Embed Size (px)
Citation preview

BUSINESS PROCESS ARCHITECTURE MEASURING AND IMPROVING STRATEGIC FIT Aantal woorden/ Word count: 16512
Robin Dehondt Stamnummer/ Student number : 01206020 Promotor/ Supervisor: Prof. dr. Geert Poels Co-promotor/ Co-supervisor: Michaël Verdonck Masterproef voorgedragen tot het bekomen van de graad van: Master’s Dissertation submitted to obtain the degree of:
Master of Science in Business Engineering Academiejaar/ Academic year: 2016 - 2017

Confidentiality agreement PERMISSION Ondergetekende verklaart dat de inhoud van deze masterproef mag geraadpleegd en/of gereproduceerd worden, mits bronvermelding. I declare that the content of this Master’s Dissertation may be consulted and/or reproduced, provided that the source is referenced. Naam student/name student : Robin Dehondt

I
Foreword I would like to thank Prof. Dr. Geert Poels for the feedback and the guidance of this master
dissertation. Not only for the individual counselling but also for the relevant knowledge
transferred during the lectures at Ghent University. Further, I would like to thank Michaël
Verdonck for the feedback and the help with structuring this master dissertation. At last, I would
like to thank my parents who gave me the opportunity to study at Ghent University.

II
Table of contents
TITLE PAGE .............................................................................................................................................
CONFIDENTIALITY AGREEMENT ..............................................................................................................
FOREWORD ........................................................................................................................................... I
LIST OF USED ABBREVIATIONS ............................................................................................................. III
LIST OF FIGURES ................................................................................................................................. IV
LIST OF TABLES .................................................................................................................................... V
1 INTRODUCTION .............................................................................................................................. 1
2 MODELLING THE BUSINESS PROCESS ARCHITECTURE WITH ARCHIMATE ........................................ 4 2.1 THE BUSINESS PROCESS ARCHITECTURE .................................................................................................... 5 2.2 THE ARCHIMATE LANGUAGE ................................................................................................................. 7 2.3 MODELLING THE BUSINESS PROCESS ARCHITECTURE WITH ARCHIMATE ......................................................... 9 2.4 CASE STUDY DEMONSTRATION-‐ARCHISURANCE ....................................................................................... 10 2.4.1 The business process architecture of Archisurance ................................................................. 10 2.4.2 The business process architecture of Archisurance in ArchiMate ........................................... 13
3 LINKING THE BPA WITH THE STRATEGY IN ARCHIMATE ................................................................ 14 3.1 STRATEGY ........................................................................................................................................ 14 3.2 MODELLING THE STRATEGY WITH ARCHIMATE ....................................................................................... 19 3.3 LINKING BUSINESS PROCESSES WITH THE STRATEGY IN ARCHIMATE ............................................................ 20 3.4 CASE STUDY DEMONSTRATION-‐ARCHISURANCE ....................................................................................... 22 3.4.1 The strategy of Archisurance .................................................................................................. 22 3.4.2 The strategy of Archisurance linked with the BPA in ArchiMate ............................................ 28
4 EVALUATING THE STRATEGIC FIT OF BUSINESS PROCESSES .......................................................... 31 4.1 EVALUATING THE STRUCTURE DIMENSION OF STRATEGIC FIT ...................................................................... 31 4.1.1 Case study demonstration-‐Archisurance ................................................................................ 32
4.2 EVALUATING THE PERFORMANCE DIMENSION OF STRATEGIC FIT ................................................................. 33 4.2.1 Step 1: Weight the strategic goals .......................................................................................... 35 4.2.2 Step 2: Derive the weights of the objectives ........................................................................... 35 4.2.3 Step 3: Choose path, target values, threshold values and worst values ................................. 37 4.2.4 Step 4: Assess current values and calculate performance levels ............................................ 40 4.2.5 Step 5: Build the process-‐goal models .................................................................................... 40 4.2.6 Step 6: Calculate the strategic fit scores ................................................................................. 41 4.2.7 Step 7: Interpret the strategic fit scores ................................................................................. 44
5 CONCLUSION AND FURTHER WORK ............................................................................................. 50
REFERENCE LIST .................................................................................................................................. 52
APPENDIX A: CURRENT AND DESIRED CAPABILITY MAP OF ARCHISURANCE ....................................... 55
APPENDIX B: FULL MODEL AND PROCESS-‐GOAL MODELS OF ARCHISURANCE ..................................... 56

III
List of used abbreviations BPM
BPA
EA
PO
IT
BPMN
ITIL
SCOR
PCF
APQC
I.E.
ADM
TOGAF
SAM
BMM
SF
PL
CV
TV
Business process management
Business process architecture
Enterprise Architecture
Process orientation
Information technology
Business process management notation
Information technology infrastructure library
Supply chain operations reference model
Process classification framework
American productivity and quality center
Id est (that is, with other words)
Architecture development method
The open group architecture framework
Strategic alignment model
Business motivation model
Strategic fit
Performance level
Current value
Threshold value

IV
List of figures Figure 1: Strategic alignment [49] .................................................................................................................... 2 Figure 2: Process identification framework [11] ................................................................................................. 7 Figure 3: Correspondence between TOGAF ADM (left side) and the ArchiMate language (right side) .................... 8 Figure 4: Modelling process owners in ArchiMate ........................................................................................... 10 Figure 5: process identification of Archisurance (part a) ................................................................................... 11 Figure 6: process identification of Archisurance (part b) ................................................................................... 11 Figure 7: The BPA of Archisurance modelled with ArchiMate ......................................................................... 15 Figure 8: The use of the serving relationship between tactics ............................................................................ 19 Figure 9: Conceptual model for strategy representation in ArchiMate ................................................................ 20 Figure 10: Linking business processes with the strategy through capabilities ...................................................... 22 Figure 11: Vision and mission of Archisurance ................................................................................................ 23 Figure 12: The influencers of Archisurance with their assessments .................................................................... 24 Figure 13: The strategic goals of Archisurance ................................................................................................ 24 Figure 14: The origins of the strategic goals .................................................................................................... 25 Figure 15: The digital customer intimacy strategy realises the finincial goal ....................................................... 26 Figure 16: The tactics realise the other strategic goals together with their objectives (part a) ................................ 26 Figure 17: The tactics realise the other strategic goals together with their objectives (part b) ................................ 27 Figure 18: The tactics realise the other strategic goals together with their objectives (part c) ................................ 27 Figure 19: Implementing the course of action through the creation of new capabilities (part a) ............................. 29 Figure 20: Implementing the course of action through the creation of new capabilities (part b) ............................. 29 Figure 21: The BPA linked with the capabilities .............................................................................................. 30 Figure 22: Correcting the misalignment .......................................................................................................... 33 Figure 23: Structure of our model ................................................................................................................... 34 Figure 24: Weighting of the non-financial goals ............................................................................................... 35 Figure 25: Relative importance of each objective ............................................................................................. 36 Figure 26: Weights of the objectives ............................................................................................................... 37 Figure 27: Formula to calculate the performance level of an objective ...................................................... 38 Figure 28: Illustration of the normalisation [47] ............................................................................................... 39 Figure 29: Derivation of serving relationship ................................................................................................... 41 Figure 30: Process-goal model of the manage big data business process of Archisurance ..................................... 43 Figure 31: Calculation of the strategic fit score for the manage big data process of Archisurance .......................... 44 Figure 32: Visualisation of strategic fit scores of scenario 1 .............................................................................. 46 Figure 33: process-capability map .................................................................................................................. 47 Figure 34: Visualisation of strategic fit scores of scenario 2 .............................................................................. 48 Figure 35: Process-capability (left) and Process-goal (right) model .................................................................... 48 Figure 36: Visualisation of strategic fit scores of scenario 3 .............................................................................. 49 Figure 37: Process-goal model of the issue new policy process ......................................................................... 50

V
List of tables Table 1: The ArchiMate elements of the business process architecture ................................................................. 9 Table 2: Process list of Archisurance (frameworks) .......................................................................................... 12 Table 3: Process list of Archisurance (value streams) ....................................................................................... 13 Table 4: Key concepts of a strategy [15] ......................................................................................................... 18 Table 5: Parameter values of Archisurance ...................................................................................................... 39 Table 6: Current values and performance levels of the three scenarios of Archisurance ....................................... 40 Table 7: Strategic fit scores of the processes of Archisurance in the three scenarios ............................................ 43

1
1 Introduction Companies are constantly searching for ways to improve business performance in order to stay
relevant in the global competitive market. Adopting a process orientation (PO) could offer a
solution as research indicates that process-oriented organisations show better overall
performance [30]. PO manages an organisation based on its processes instead of functions and
hierarchies. A business process is defined as “a collection of inter-related events, activities and
decision points that involve a number of actors and objects, and that collectively lead to an
outcome that is of value to at least one customer [1]”. This imposes a company to focus more on
the outcomes of each process, especially the value it delivers to its customers [30]. Also, since
customer and market demands are constantly changing, being process-oriented enables a faster
response to these changes because implementing change becomes easier. This makes process
orientation the basis for the creation of an agile enterprise [31].
To reap the benefits of PO, it is necessary to continuously improve the building blocks, i.e. the
business processes. This is realised by actively engaging in business process management (BPM)
[1]. “BPM is defined as a body of methods, techniques and tools to discover, analyse, redesign,
execute and monitor business processes [1]”. Applying BPM results in an improvement of the
individual process in the cost, time, quality or flexibility dimension. While this increase in
operational efficiency is certainly a positive outcome, there is a vulnerability that these
adjustments will not lead into customer or economic value without a proper link to strategy
[38][40]. Changing processes also requires resources. These invested efforts should thus generate
a positive return for the project in order to be considered successful. Moreover, the company
should strive for the highest return possible. In order to attain these desired results, a tight
alignment of the business processes with the corporate strategy in terms of structure and
performance is necessary [31]. The alignment in terms of structure and performance answer the
questions “Do we have the right set of processes?” and “Are our processes able to realize our
strategic goals?” respectively. Any misalignment is a high value improvement opportunity that
should be addressed to improve performance and prevent wasting resources. Unfortunately,
companies are still struggling to synchronize their business processes with their corporate
strategy [31]. The reason is a lack of commitment and know-how of upper management [31].
Indeed, although there is enough literature that advocates strategic fit, little is known about how
to actually achieve it. Therefore, this thesis will aim to fill this gap by investigating how the
strategic fit of business processes can be measured and improved.

2
The concept of strategic fit is deeply rooted in the business literature and is commonly defined as
“matching organisational resources and capabilities with the corresponding environmental
context” [41]. Hereby capabilities refer to “a firm’s capacity to deploy resources, using
organisational processes, to affect a desired end” [34]. Good strategies will show both a match
between its strategy and its environmental situation, i.e. external fit and a match between its
strategy and its organisational aspects to execute the strategy in a competent manner, i.e. internal
fit [20]. Several models appeared in the literature to conceptualise strategic alignment. The most
influential research on this is the model by Henderson and Venkatraman [48] called the strategic
alignment model (SAM). The model specified that strategic alignment is realised by creating
strategic fit between the external and internal domain and also functional integration between the
business and IT domain. Maes [49] extended this model by adding the structure and information
perspective (Figure 1). Managing structure is important because it determines the flexibility or
rigidity of an enterprise. Thus, also contributing towards the creation of an agile enterprise. It is
important to notice that this thesis focuses on measuring and improving strategic fit within the
business architecture (first column of Figure 1) by taking an enterprise-wide BPM approach. This
approach will align the organisational goals (strategy perspective) with the highest-level business
processes (structure perspective) and the operational decisions made within the business
processes (operations perspective).
Figure 1: Strategic alignment [49]

3
Thereby, this thesis will aid organisations in preventing a poor implementation of their strategy.
Many strategies fail because of bad implementation, not bad formulation [33]. Testing the
strategic fit of business processes can serve the purpose of a strategic control system, thereby
identifying what processes are lacking in order to achieve the strategic goals. Currently, the
balanced scorecard serves as an excellent control system in many enterprises but some criticise
that it is functional focused and not process focused. This gives the possibility of gaps when the
scorecards are not properly linked along the functions [33]. Our approach tries to address this
critique by being process-oriented. Such process-oriented approach is expected to deliver more
benefits since strategy implementation depends on business processes and their interaction
[31][32][33].
Before we can measure and improve the strategic fit of business processes, the people involved
should all have the same and a thorough understanding of both the direction and the business
processes of the company. This implies the use of a modelling language [1]. Uncovering a
modelling language that enables us to combine the business processes with the strategy of a
company is not an easy task since different fields each use their own languages in current
practice [35]. For example, the strategy domain has the business motivation model [15] and i*
[3] as modelling languages. An organised overview of the high-level business processes among
with their relationships is defined as the business process architecture [11]. The business process
architecture will serve as our key intermediate layer, thereby representing the structure
perspective. Although BPMN [36] is the standard language to model a business process, there is
still no consensus on what modelling language to use for the business process architecture [11].
Enterprise architecture wants to tackle this problem by providing a holistic view of the enterprise
and thereby aligning different architectural domains [8]. Zachman identified six different
architectural artefacts, commonly referred to as the ‘what’, ‘how’, ‘where’, ‘who’, ‘when’ and
‘why’ columns [14]. The business process architecture and the strategy of a company are both
part of the enterprise architecture. They correspond to the ‘how’ and ‘why’ columns of the
business architecture of the Zachman framework respectively [14]. Looking from an enterprise
architecture perspective will enable us to address the strategic fit of business processes and view
the effectiveness of the organisation. Furthermore, the Zachman framework facilitates an easier
alignment of the other architectural domains to support and improve the business processes [32].
A discussion of the Zachman framework will not be presented in this thesis, however we refer to
[7], [8] and [14] for more information.

4
Consequently, we need a modelling language that supports the Zachman framework by
providing constructs from all the different architectural domains. One language that answers this
requirement is the ArchiMate modelling language. ArchiMate has business processes as a
modelling construct and includes also constructs related to motivation and strategy [7]. Further,
all the layers of the enterprise architecture identified by the Zachman framework can be
represented using one language, making it possible to use the same language for modelling the
strategy, the business process architecture and other parts of the enterprise architecture [4][5][6].
The language is also supposedly easy to understand by experts and non-experts, making it a good
tool to communicate the architecture to other stakeholders [5][6]. At last, it has a broad
community and is supported by free, cross-platform tools [6]. Henceforth, we continue with
ArchiMate as the modelling language of this thesis.
To summarise, we will investigate how the strategic fit of business processes can be measured
and improved so that they aid the company in reaching its strategic goals. We will apply the
ArchiMate language to assist us in this endeavour. The structure of this thesis is organised
according to the following three research questions. The first research question is how to model
the business process architecture with ArchiMate and will be handled in the next section.
Following up on this, the second research question is how to link the business processes with
the strategy of a company in ArchiMate and is the subject of section three. Finally, in section
four, we will answer the third research question, which reads as follows: how can these linkages
be quantified and measured in order to evaluate the strategic fit of business processes. Each
section first identifies an answer to the respective research question, whereas next the proposed
answer is evaluated on the basis of a single fictitious case study [50].
2 Modelling the business process architecture with ArchiMate In this section, we will first elaborate on the conceptualisation and identification of the business
process architecture (BPA). After having explained the general concepts of BPA, we will briefly
introduce the reader to the language structure of ArchiMate. Afterwards, we will explain how to
model the BPA with ArchiMate. Finally, we present the Archisurance business case. This
business case will serve as our model case throughout this thesis to demonstrate and evaluate the
proposed approaches. Here, we will demonstrate our approach by identifying and modelling the
business process architecture of Archisurance.

5
2.1 The business process architecture The business process architecture (BPA) corresponds to the ‘how’ column of the Zachman
framework [14] and is defined as an organised overview of the primary business processes
among with their interrelationships [11]. Two common relationships between the processes are
producer-consumer and hierarchical decomposition relations [1]. In a producer-consumer
relationship, the output of the first process is the input of the second process. An example is the
relationship between the quote-to-order (producer) and order-to-cash (consumer) processes.
Hierarchical decomposition refers to breaking down a process in a top down fashion. An
example is to decompose the logistics process into the receive goods, check delivery and store
goods processes. The BPA provides executives and employees with a common view of all the
activities that encapsulate the enterprise on its creation and delivering of value. Unfortunately,
there is no consensus on how the BPA should be derived and what level of abstraction it should
be [11]. Therefore, we will now explain several options to derive the BPA at an appropriate
abstraction level with the purpose of measuring strategic fit.
Enumerating all the processes that exist in an organisation is not an easy task [1]. The problem
lies in its hierarchical nature. How many times does one have to decompose the processes in
order to achieve an effective process architecture? Breaking down the enterprise in too few
processes results in unmanageable processes, as it would be very difficult to redesign such a
large entity. On the other hand, breaking down the enterprise in too many processes results in
less potential impact of improvements and a very complex BPA. As stated in [1], there is a clear
trade-off between impact and manageability. In this regard, we follow [11] that suggests a
decomposition of 3 levels where level 1 is the distinction between core, support and management
processes. The difference between the three categories is the following [9]:
• Core processes directly add value for the customers; they deal with the customer
relationship journey and the product lifecycle. This is what an organization gets paid to
do and everything else it does outside of the core must strive to optimize this set of
processes. Note that the name core should not be perceived as more important than the
other categories.
• Support or enabling processes enable the execution of these core processes by providing
reusable resources.
• Management or guiding processes set directions, plans, constraints and control over all
other processes.

6
There exist several methods to assess further decompositions of these three categories. The most
straightforward way would be to get various high ranked managers together and let them identify
the core, support and management processes of the business [9]. Several approaches support this
task. A first approach is to make use of a reference model. Some examples are: the information
technology infrastructure library (ITIL), the supply chain operations reference model (SCOR)
and the process classification framework (PCF) by APQC. The managers can go through the
reference framework and check which of the processes they are performing. After going through
the list, the managers can add additional unique processes that were missing in the framework.
An advantage of using a reference framework is that it defines what is seen as different
processes, this can save a lot of time. The frameworks also have some disadvantages. The PCF is
organised reasonably functional and does not represent the true end-to-end processes we are
looking for. ITIL, among others, is industry specific and SCOR does not provide any guiding or
enabling processes.
A second approach is to use the concept of value streams [42]. In this approach, all the
stakeholders of the company are identified first. Common examples of stakeholders are
customers, shareholders, government, employees and suppliers. After all the stakeholders are
identified, define all the processes that the company performs to respond to the requests of each
stakeholder. All these processes are level two processes where the processes that correspond to
shareholders and the government are guiding processes, the processes that correspond to
customers and main suppliers are core processes and the processes that correspond to employees
and other suppliers are enabling processes.
A third approach is to use the framework developed by [11] presented in Figure 2. The framework
allows the identification of business processes by “the creation of a hierarchical decomposition
of the business functions that exist in an organisation and a classification of the most important,
permanent business objects” [11]. “Permanent objects are business objects that have a relatively
long life cycle in the organisation”, such as a product or service delivered to the customer [11].
Thus, The framework shows which business functions are involved in executing the process and
which business objects the process affects.

7
Figure 2: Process identification framework [11]
When the managers are all on the same page for the number of processes, which has as a rule of
thumb a maximum of 30 processes to remain orderly, it is time to define the relationships
between the processes. For this, the managers need to find the producer-consumer and
hierarchical decomposition relationships as previously explained. If there is an agreement on the
relationships and the processes, we have everything we need to model the business process
architecture.
In our experience, it is best to begin with the frameworks to get an initial overview of the
processes, where after the use of value streams is recommended to find all the end-to-end
processes that capture the creation and delivering of value of the enterprise.
2.2 The ArchiMate language The Architecture Development Method (ADM) of the TOGAF framework provides a process for
developing and maintaining the lifecycle of the enterprise architecture of a company [8]. The
ArchiMate language is designed to provide a graphical language for TOGAF ADM [7]. In other
words, ArchiMate is the graphical representation for all inter-related architectures that make up
the enterprise architecture and the relations between them. Aside from the graphical notation, the
ArchiMate language also permits the modeller to analyse the architectures. The connection
between TOGAF ADM and the ArchiMate structure is shown in Figure 3.

8
Figure 3: Correspondence between TOGAF ADM (left side) and the ArchiMate language (right side)
The ArchiMate core language has three main layers. “The business layer depicts business
services offered to customers, which are realized in the organization by business processes
performed by business actors” [7]. “The application layer depicts application services that
support the business, and the applications that realize them” [7]. “The Technology Layer depicts
technology services such as processing, storage, and communication services needed to run the
applications, and the computer and communication hardware and system software that realize
those services. Physical elements are added for modelling physical equipment, materials, and
distribution networks to this layer.” [7]. The ArchiMate 3.0 specification also defines 3
extensions (Strategy, motivation and Implementation & Migration). We will discuss these
extensions in a further section. The elements of each layer are categorised as an active structure,
a behaviour or a passive structure element [7]. Running somewhat ahead, we will explain the
difference using the business layer. The active structure element (business actor) performs
behaviour (process) on a passive structure element (business object). Structure elements are
represented using nouns while verbs are used to represent behaviour elements. At last, the
behaviour and active structure constructs are further subdivided in internal and external
elements. External elements are exposed to the environment while hiding its internal elements. In
the section below, we will further elaborate on the ArchiMate constructs and start modelling the
business process architecture with ArchiMate.

9
2.3 Modelling the business process architecture with ArchiMate How can we represent the business process architecture in the ArchiMate language? To focus on
certain aspects of the enterprise architecture in ArchiMate, the user has the ability to use
architecture viewpoints. Viewpoints restrict the enterprise architecture to a certain set of objects
and relationships [7]. By making use of this abstraction, users can look at that part of the
enterprise architecture that is in their interest. We propose the pre-defined business process co-
operation viewpoint [7] as a possible viewpoint to model the business process architecture. Here,
ArchiMate has various constructs that all can add value to the business process architecture
depending on the purpose. Therefore, we will first go through the elements necessary for the
measurement of strategic fit and afterwards demonstrate several additional options.
For the purpose of measuring strategic fit, we previously identified the processes that
encapsulate the enterprise together with the producer-consumer and hierarchical decomposition
relationships as fundamental elements. We will start with the business processes. The ArchiMate
language provides a process element in the business layer to model a business process. The
modeller can simply use this construct to model the business processes. If the process constructs
are in place, we need a way to connect the processes with each other. For the producer-consumer
and hierarchical decomposition relationship explained in section 2.1, we propose the use of the
flow and composition relationship respectively. Next to these relationships, ArchiMate makes
the use of two more relationships possible. First, the trigger relationship, which expresses the
causal relationship between processes. Second, when a process is a specialisation of another
process, we apply the specialisation relationship. Table 1 gives an overview of all these
ArchiMate elements [7].
Table 1: The ArchiMate elements of the business process architecture
Business process Hierarchical decomposition relationship
Producer-consumer relationship
Other relationships
Composition Relationship
Flow Relationship
Trigger Relationship
Specialization Relationship

10
With ArchiMate, the modeller has the option to add several other elements if required. For
example, the literature heavily advocates the specification of a process owner, i.e. the person
responsible for the management of the process [30][31]. To specify the process owners and other
process responsibilities such as the process auditor and coordinator, the BPA ArchiMate model
may be extended with business role and actor constructs attached. These are then connected
using assignment relationships. Figure 4 shows an example of how this is exactly modelled. In
this example, Robin Dehondt is the process owner of the handle claim process of Archisurance.
Another example might be that for communication purposes, the business functions, objects or
other elements are added in the BPA ArchiMate model. We refer to the ArchiMate specification
[7] for all the possibilities and modelling instructions.
Figure 4: Modelling process owners in ArchiMate
2.4 Case study demonstration-‐Archisurance The case study involves a fictitious insurance company called Archisurance [50]. Archisurance is
the result of a merger between three different insurance companies who were each located in
different cities and provided different insurance products. The case study describes how
Archisurance operates, which troubles it is having and the direction it will go. We will use the
Archisurance case study to demonstrate each step undertaken in this thesis and serve as an
example of how to measure and improve the strategic fit of business processes.
2.4.1 The business process architecture of Archisurance In this section, we will demonstrate how to use the three different approaches explained in the
previous section to identify all the processes performed by Archisurance. As we recommended, it
is best to start with the frameworks. Therefore, we will start with the third approach, the process
identification framework, to form an initial set of processes. There after, we will work with the

11
process classification framework to find processes that are missing in our initial set. At last, we
will demonstrate the use of value streams to identify all the end-to-end processes that capture the
creation and delivering of value of Archisurance.
The process identification framework [11] requires an establishment of the permanent objects
and the business functions first. Because Archisurance is an insurance company, we identified
the following list of permanent objects: customer, product (split in policy and premium), claims
and assets (split in reserves and real estate assets). We could divide product into the three
insurance categories but as mentioned in the case, the processes are almost the same. Therefore,
we see the differences as variations within the processes and not as different processes. The case
itself mentions the different functions, namely underwriting, sales, customer relations, claims,
finance, marketing, actuarial, investment management and document processing. As shown in
figures 5 and 6, the framework allowed us to identify an initial set of processes for Archisurance.
Underwriting Sales Marketing Actuarial
Customers Customer
Issue new Policies
Understand customers
Products Policy Promote
products Design new
products Premium
Assets Reserves Analyse
enterprise risk Real estate
Figure 5: process identification of Archisurance (part a)
Customer Relations Claims Finance Investment
management
Customers Customer Handle questions
Products Policy Promote
products
Premium Collect premiums
Claims Claim Handle claims
Assets Reserves Manage
assets Real estate
Figure 6: process identification of Archisurance (part b)

12
To complete and verify our list of processes, we looked at the PCF by APQC of the insurance
industry for processes that we missed using the process identification framework [11]. To build
an appropriate list of business processes with the process classification framework, an inventory
of the level 2 process groups is recommended. There, we found that we did not identify the
processes develop & manage strategy, develop & manage human capital, manage information
technology and perform accounting. Table 2 shows the complete process list of Archisurance.
Note that we use a process id to show the hierarchical decomposition relationship. The consumer
producer relationships are not investigated yet.
Table 2: Process list of Archisurance (frameworks)
Process id
Process name Process id
Process name
1 Develop & manage strategy 6 Develop and manage human capital 2 Design new products 7 Manage information technology 3 Market and sell products 8 Manage financial resources 3.1 Understand markets & customers 8.1 Collect premiums 3.2 Develop and manage marketing plans 8.2 Perform accounting 3.3 Issue new policies 9 Acquire, construct and manage assets 4 Handle claims 10 Manage enterprise risk 5 Manage customer service
Value streams look at the requests of the different stakeholders to identify the processes.
Therefore, we first need to know who the stakeholders of Archisurance are. The different
stakeholders are customers, employees, shareholders, IT service providers and the government.
Now that the stakeholders are identified, we look at the requests these stakeholders make of the
enterprise. The main requests customers make are to issue new policies and to handle claims.
Next to these main requests, there is also a request for new products and information. At last,
Archisurance market their policies to make the customer aware and collects the premiums of the
customers. Employees need to be hired or fired, have their salaries paid and need support. The
government asks Archisurance to pay its taxes and comply with the regulations. Shareholders
want to know if their money is invested wisely. At last, the IT service providers need to collect,
share and protect the enterprise data. To respond to these requests, Archisurance performs the
following list of processes (Table 3).
13
Table 3: Process list of Archisurance (value streams) Process id
Process name Process id
Process name
1 Create & market insurance policies 4 Manage shareholders 1.1 Develop new policies 4.1 Develop and manage assets 1.2 Market policies 4.1.1 Develop and manage real estate 1.3 Inform customer 4.1.2 Develop and manage reserves 1.4 Issue new policy 4.1.3 Manage enterprise risk 1.5 Collect premiums 4.1.4 Manage enterprise return 1.6 Handle claim 4.2 Develop and manage business strategy 2 Manage employees 4.3 Perform accounting 2.1 Hire/fire employees 5 Manage IT service providers 2.2 Pay salaries 5.1 Manage enterprise information 2.3 Support employees 5.1.1 Collect information 2.3.1 Provide feedback 5.1.2 Share information 2.3.2 Employee satisfaction initiatives 5.2 Protect data 3 Manage government regulations 5.3 Improve business processes 3.1 Pay taxes 3.2 Comply with policy regulations 3.3 Comply with other regulations
Although the two process lists look different at sight, they are practically the same. Process list
two is simply more elaborated and therefore less vague. It is not the purpose of this thesis to
evaluate the different techniques but rather present several techniques available. The goal is to
create a process enumeration of the whole company that everyone agrees on and feels
comfortable using. For the purpose of this thesis, we will proceed with process list two because
these processes respond to all the stakeholders of Archisurance.
2.4.2 The business process architecture of Archisurance in ArchiMate The final step of this section is to demonstrate our solution by providing the business process
architecture of Archisurance modelled with ArchiMate. To do this, we use our process list given
in Table 3 and apply the rules from the previous section. Figure 7 displays the result. We started by
modelling all the processes listed in Table 3 with the process element of ArchiMate. Then, we
looked at the process ids to find all the hierarchical decomposition relationships. Mostly, they
present compositions. For example, the support employees process is divided in the provide
feedback and the employee satisfaction initiatives processes. We recognized two specialisation
relationships. The manage real estate and reserves processes are both specialisations of the
manage assets process. At last, identification of the flow and trigger relationships were required.
In business process architectures, not much of these relationships will appear because each
process represents a different request of a stakeholder. Mostly, sequences will be found in sub
processes. Some examples from our model are: to manage enterprise return, the information

14
found in the analysis of the enterprise risk will probably be used (flow relationship). The output
of the collect information process will be used as the input of the share information process (flow
relationship). Going through all the processes results in our Archisurance business process
architecture modelled with ArchiMate.
3 Linking the BPA with the strategy in ArchiMate
This section will be split up in 3 phases. First, we will investigate the concept of strategy and
identify the elements that constitute it. Second, we will have a look on how the strategy of a
company can be modelled in the ArchiMate language. At last, we will link this section with the
previous section, where we will connect the BPA of a company with its strategy. As a result, we
will have modelled a business process architecture that is connected with the strategic objectives
of the company.
3.1 Strategy Strategy is a word freely used in all sort of situations. Therefore, it should be no surprise that
practitioners have not found a consensus on its definition and development [23]. Nonetheless, we
can state that strategic decisions are mostly about the long-term direction of an organisation, the
scope of an organisation’s activities, gaining advantage over competitors, addressing changes in
the business environment, building on resources & competences and the values/expectations of
stakeholders [39].
It is important to note that the effort required here is not actually developing the strategy, where
different schools of thought exist [23], but instead is to understand the strategy and make sure
everyone is on the same page. Thus, a common vocabulary is extremely important. The business
motivation model (BMM) [15] can help us with this task as it has identified and defined all
elements related to the strategy of a company. This organised structure should enable us to
describe the strategy and likewise nullify any misconceptions.
The business motivation model splits the strategy concepts in two main categories: the ends and
means. An end is something that the business seeks to accomplish, without any indication of how
it will be achieved. The decisions on how the ends will be achieved are the means.

15
Figure 7: The BPA of Archisurance modelled with ArchiMate

16
To be more precise, a mean is some device, capability, regime, technique, restriction, agency,
instrument, or method that may be called upon, activated, or enforced to achieve ends.
The first element of the end category is the vision. The vision describes a desired ideal future
state of an organisation, without regard to how it is to be achieved. Common characteristics of
the vision are action-oriented, responsive to competition, long-term and purposeful [24]. An
example of a vision is to become the city’s favourite pizza place. The mean that is focused on
achieving the vision, is called the mission. The mission describes what the enterprise is or will
be doing on a day-to-day basis. It contains 3 items: An action part (e.g. provide), a product or
service part (e.g. pizzas) and a market or customer part (e.g. customers city-wide).
Attaining the vision isn’t easy. The environment is full of influencers that might have an impact
on the performance of a company, both positive and negative. The internal influencers are
commonly categorised as strengths and weaknesses originating from the resources and
capabilities of the company. The external influencers as opportunities and threats derived from
the external environment. An important remark is that influencers are neutral, whether their
influence is positive or negative depends on the analysis that someone makes of the influencer.
We call the results of such analysis an assessment. Several categories of external influencers are
competitor, customer, environment, partner, regulation, supplier and technology [15].
To indicate what must be satisfied on a continuing basis to effectively attain the vision and cope
with the environmental risks and constraints, strategic goals are set. It is up to the executives to
choose which goals it wants to pursue based on their assessments but we advocate, just as
Kaplan and Norton [33], that a diverse set of goals are set in several dimensions and connected.
The primary objective of any for-profit organisation is to increase the shareholder wealth [45].
Thus, it would be tempting to place only financial goals such as increase profits, revenue growth
and market share. The problem is that the progress of the goals will be measured to evaluate their
completion. But, when we measure financial measures, they represent only the history of the
company. This can lead to short-term thinking and has the possibility to devastate future
potential. For example, a company might raise the price of its products leading to an increase of
revenues in year 1. The company is praising the executives. Meanwhile, customer satisfaction is
lowering because they are not pleased with the price raise and customers are starting to find
alternatives. In year 3, revenues are lower than ever. This example shows that only having
financial goals is not good. Financial goals are the end goal, but other goals must be set that

17
help the company achieve its financial goals. Then, we can monitor and manage the other goals
that have shorter time lags to evaluate our progression. After an amount of time, financial goals
reveal if our strategy of the past was successful. The difficulty now becomes in which other
dimensions do we need to set strategic goals. The balanced scorecard [33] proposes three other
dimensions: customer, processes and learning & growth. While very popular, it is criticised for
not taking other stakeholders into account and missing clarity [45]. The dynamic multi-
dimensional performance framework [45] refined the balanced scorecard by using five
dimensions and clearly defining them. These five are the financial, customer, process, people and
future dimension. The financial measures stay the primary objectives. Examples are ROI, profit
margin, revenue and market share. Customer measures represent the relationship between the
organisation and its customers. Any improvements in this relationship or in meeting the
customer needs and wants belong in this category. Some examples are customer satisfaction,
retention and complaints. Process measures reflect the organisational efficiency and
improvement view. Common measures are time to market of new products and units
manufactured. People measures represent the relationship between the organisation and its
employees. Measures here can be the retention of top employees, employee training and ideas
suggested by employees. At last, the future measures are all the other stakeholders and external
pressures that were not yet mentioned. Quality of strategic planning, changes in environment,
partnerships with suppliers and investments in new technologies all belong here. All the goals of
the company should thereafter be linked with each other and should all be read as an if/then
statement [43]. For example: if we strengthen existing customer relationships, then we will
increase revenue. There is no universal correct way for the relationships between the goals, it
merely shows where the management team wants to focus to move the company forward.
Contrary to the vision, goals should be more specific that they can be quantified by objectives.
An objective is a statement of a specific, measurable, attainable, relevant and time-based (i.e.
SMART) target that the enterprise ought to meet in order to achieve its strategic goals. An
example of a strategic goal is to deliver pizzas in a desirable amount of time. The objective
quantifying this goal can be: by January 1, 2018, 98% within 30 minutes delivery. Kaplan and
Norton [33] advocate the use of both lag and lead indicators. A lag measure is one that reflects a
result, it shows how well you have done up to today. A lead measure is a measure that you think
will drive positive results in the future. If you think attending trade shows will drive positive
results, the number of tradeshows is a good lead measure.

18
The counterpart of the strategic goal is the strategy. A strategy is the chosen approach to achieve
certain strategic goals. In our model, the strategy should be the method that achieves the
financial goals and thus answers the question why customers would buy from you. To be
successful, there are only three strategies to choose from according to [46]. These are product
leadership, customer intimacy and operational excellence. In product leadership, there is a heavy
focus on innovation and delivering value added, differentiated, new products. Apple and Dyson
are two examples that follow this strategy. In customer intimacy, the focus is on specialised and
customised customer relationship. Zappos is a company that follows this strategy. At last, in
operational excellence, the focus is on the efficiency of day-to-day operations and the price and
simplicity of delivering and buying products. Two good examples are Walmart and IKEA.
A strategy is implemented by tactics and governed by business policies. A tactic is a detailed
part of the strategy that represents how it will achieve an objective. In our model, the tactics are
the chosen approaches to achieve the non-financial goals. A business policy, formed as a
response on one or more assessments, indicates how a strategy should, or should not, be carried
out. The last concept is the corporate values, mostly considered to describe the core philosophy
of an organisation. They are part of the organisational culture and set the behavioural boundaries
of an organisation [21]. The values are supposed to be aligned with the vision and the mission.
An example is environmental friendliness.
To conclude this section, we summarise all the key concepts necessary to describe a strategy in
Table 4.
Table 4: Key concepts of a strategy [15]
Concept Description Influencer Something that might impact the performance of the company. Assessment Result of a SWOT analysis of an influencer. Vision Desired ideal future state of the company. Mission What a company does on a day-to-day basis. Values Core philosophy of the company. Strategic goals
Indication of what must be satisfied to attain the vision and cope with the influencers.
Business policy
Indication of how a strategy should or should not be carried out based on an assessment.
Strategy The chosen approach to achieve certain strategic goals. Objective Statement of a specific, measurable, attainable, relevant and time-based
target that the enterprise ought to meet in order to achieve a strategic goal. Tactic Detailed part of the strategy that represents how it will achieve an
objective.

19
3.2 Modelling the strategy with ArchiMate As mentioned earlier, the main components of ArchiMate cover 3 phases of TOGAF ADM.
Motivated to support the other phases, multiple extensions have been introduced in ArchiMate
[7]. The motivation extension can represent high-level statements expressing the goals of an
enterprise [12]. The strategy extension contains several additional concepts that are critical in
describing the strategy of an enterprise. Thus, using both these extensions should enable us to
represent the strategy of a company in ArchiMate.
In the previous section we identified all the elements necessary to represent a strategy. Now, we
will identify the correct ArchiMate constructs for all of these strategy elements. Next to the
purpose of measuring strategic fit, modelling the strategy of a company with ArchiMate can have
another benefit. In addition to communicating the strategy and it’s rational through a bundle of
text, visual representation can strengthen communication, understanding and support for the
strategic decisions made. Figure 9 presents our proposed conceptual model based on the
elaboration of the BMM in the previous section.
As in the previous section, we will start with the vision. The vision is an end state the firm would
like to achieve, therefore the goal construct of ArchiMate is proposed. Strategic goals and
objectives are both more specific statements of ends. Thus, they will also be modelled with the
goal construct of ArchiMate. Since the different goals can reinforce each other, the influence
relation can exist between them. Because a change in vision should not necessarily result in all
the current strategic goals destroyed, we propose the use of an aggregation relationship between
the elements. For consistency in the model, we use the same relationship between the strategic
goal and its objective. Similar to vision, strategic goal and objective are mission, strategy and
tactic modelled with the same construct and connected with an aggregation relationship. The
ArchiMate construct proposed here is the course of action element in line with the BMM. In
accordance with the previous section, a realisation relationship is formed between each course of
action and goal element. Sometimes, it can be that one tactic depends on the fulfilment of
another tactic. In ArchiMate, there is the possibility to model this with the help of the serving
relationship. Figure 8 presents the use of the serving relationship.
Figure 8: The use of the serving relationship between tactics
20
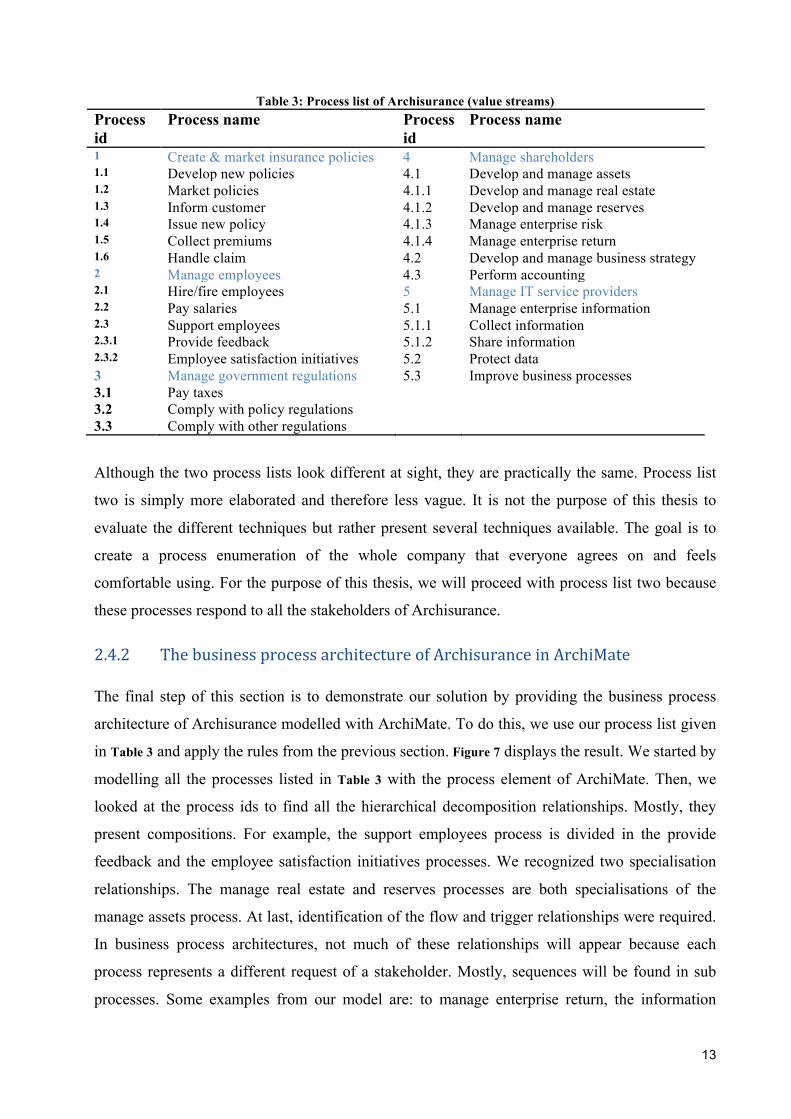
The corporate values and business policies are modelled with the principle element of ArchiMate
since it is proposed in the specification itself [7]. Values are translated in business policies,
which govern strategies and set new goals. At last, the reasoning behind the goals and policies
might be modelled. The driver and assessment construct of ArchiMate are used for this purpose.
An audit line of who conducted the assessment may be set with the actor construct of ArchiMate.
At last, more information of the internal influencer might be given. The stakeholder construct of
ArchiMate can show which stakeholder is concerned about the influencer. If the internal
influencer is a specific capability or resource, a construct exist that can be connected to the driver
construct.
Figure 9 provides a summary of our proposed conceptual model for strategy representation in
ArchiMate. Having both the business process architecture and the strategy modelled in
ArchiMate, we will discuss how to connect them in the following section.
Figure 9: Conceptual model for strategy representation in ArchiMate
3.3 Linking business processes with the strategy in ArchiMate When a company chooses to execute certain business processes or applies a business rule, it
should be able to motivate why. This has been recognized and highlighted early on in the
Zachman framework [14]. By modelling its strategy and linking it with the business process
architecture, the company has an answer to these questions. Because ArchiMate supports the
Zachman framework, ArchiMate facilitates the connection between these two domains. This
highlights the added value of using ArchiMate.

21
This improved alignment between the two domains has advantages for both sides. On the one
hand, when constructing the strategic plans, the company has the ability to observe what changes
are necessary to implement the strategy and can also explain its rational why something has to
change. And on the other hand, the model offers traceability of the reason why something has
changed and if the current way of operating is still motivated. Overall, “the impact of
organisational change resulting from new strategies can be easier and more accurately
determined” [13].
The problem with linking business processes directly to tactics is that the difference in
abstraction level is too high. Business processes show how a business does something while
strategic intent mostly shows what the business wants to do. An intermediate is needed between
this strategic intent and implementation. The Open Group [44] suggests the use of capabilities as
intermediate. They define a capability as “a particular ability or capacity that a business may
possess or exchange to achieve a specific purpose or outcome”[44]. We refer to their example of
customer data management, which is the ability of the organisation to accumulate and manage all
pertinent customer attributes and inter-related business data to navigate new market channels and
optimize customer retention. A company should have a capability map that shows all the current
capabilities. Then, the company can adjust the capability map to represent its strategic intent.
When we have all the desired capabilities modelled, we need to connect them with the business
process architecture. Capabilities are realised by processes, people and assets [44]. In ArchiMate,
people and assets are grouped as resources. To be more specific, resources can be financial
(cash), physical (equipment), intangible (patent) or human (know-how) assets [7]. Thus, we can
connect each business process with the capability they realise. This displays which process or
combination of processes make it possible for the company to have that ability. This relationship
translates from what the company is able to do, to where it actually performs it. Modelling the
resources is optional since they are not required in our calculation of the strategic fit of processes
but can be helpful to gain a more complete picture. This model, with capabilities and resources,
could be used in strategy formulation to take more informed decisions with the resource-based
and dynamic capabilities view in mind [34]. Figure 10 presents our solution. It displays the
capability as the bridge between the strategy formulation (objective and tactic) and strategy
implementation (business process and resource).

22
Figure 10: Linking business processes with the strategy through capabilities
3.4 Case study demonstration-‐Archisurance In the previous demonstration, we identified the BPA of Archisurance and modelled it with the
use of ArchiMate. In this demonstration, we will identify and model the strategy of Archisurance
with the use of ArchiMate. Thereafter, we will unite the two models to obtain the BPA of
Archisurance connected with its strategy.
3.4.1 The strategy of Archisurance A good place to start any strategic plan is the vision. Unfortunately, Archisurance hasn’t
specified their vision in the case study. Therefore, we formulate a vision for the company based
upon the description of the Archisurance case study. The vision can be described as follows:
establish Archisurance as the market leader in quality and value-priced insurance products. Just
as the vision, no mission was specified. As mentioned in the previous section, it needs to contain
an action, product and customer part. Therefore, again based upon the description of the case
study, the following mission for Archisurance is defined: provide homeowner, travel, auto and
legal expense insurance products to customers and businesses in America. No information was
available about the corporate values. Modelling the vision and mission in ArchiMate results in
Figure 11.

23
Figure 11: Vision and mission of Archisurance
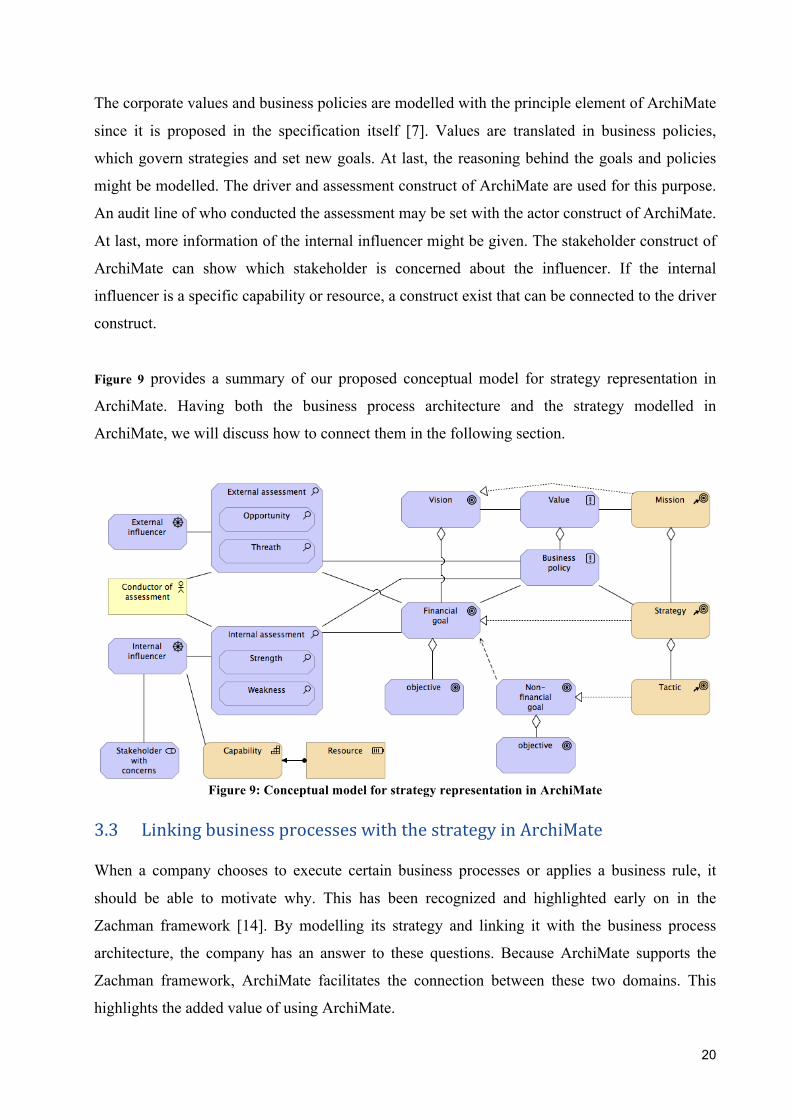
After having the vision and mission in place, an assessment of the different drivers that could
affect the performance of Archisurance is conducted. Archisurance has performed several
analyses themselves. The influencer low-cost competitor is seen as a threat since it is stealing
away some of the Archisurance customers. The same problem is occurring for companies with
superior digital experiences. This results in a second influencer of the shareholder who is
concerned because profits are lowering. A third influencer, the environment, has a positive
assessment of emerging high growth areas. Since these areas are not specified in the case, we
will assume that they are American blooming cities. A fourth influencer is technology, whereof
two assessments have been taken. On the one hand, IT is clearly established as a weakness of
Archisurance because of the scattered application landscape. But on the other hand, it is seen as
an opportunity because new methods are constantly coming to life for the collection of customer
data. These data could potentially be used to better estimate risks. We extend the case with a fifth
influencer. Because Archisurance is the result of a merger between three companies, we propose
the merger itself as an influencer. The assessment of the influencer recognises a weakness
because the employees of the three companies feel no connection with each other. Modelling the
influencers and assessments in ArchiMate results in Figure 12.
In order to achieve the vision while tackling the influencers, strategic goals and business policies
are formulated. To simplify the case study, we will only take goal setting into account. As
mentioned above, goals have to be set in different dimensions and connected. Several have
already been specified in the case study, while some are still missing. To tackle the concern of
the declining profit and realise its vision of market leader, the company wants to heavily increase
its revenues. This first goal is derived from the financial perspective. To help achieve the
financial perspective, the customer perspective receives the following goals: increase customer
satisfaction, improve customer retention and attract new customers. All these goals are based
upon customers defecting. The process perspective receives the goals expand product line and
improve cross selling based upon the availability of more vendors for data collection and as a
consequence of the merger respectively. Another consequence of the merger is that the
employees of the three former companies feel no connection, thus the goal of increase solidarity
24
is set in the people perspective. At last, the future perspective addresses the weakness of the
scattered application landscape. The company sets the following goals: increase information
sharing and improve the digital experience. All of this can be modelled in ArchiMate, which is
presented in Figure 13 and Figure 14. The broken arrows represent positive influence relationships.
Figure 12: The influencers of Archisurance with their assessments
Figure 13: The strategic goals of Archisurance

25
Figure 14: The origins of the strategic goals
In order to attain the strategic goals, a proper strategy should be formulated. After some debate
which strategy to follow, Archisurance has decided to go for a digital customer intimacy
strategy. This includes a combination of big data and the Internet of things to acquire detailed
customer data and using it to improve customer satisfaction and digital interaction. A second
way this data will be used is for creating new products that will adjust insurance premiums based
on risk perceived, which will be more accurately calculated based upon customer behaviour data
acquired. For example, using smart devices to monitor driving behaviour and fitness trackers to
monitor health behaviour. Taking advantage of the merger should also result in the formulation
of a whole new set of insurance products that use combinations of cross-type products where the
new product will have a lower insurance premium than the different products separately. To
support information sharing, a single customer relationship management system will be
implemented. At last, to further focus on product innovation and solidarity, personnel diffusion
is chosen. Hereby, new teams are set up that exist out of personnel from the different former
companies. Also, options are available for personnel to switch to different insurance types.
Currently, there is no specific strategy addressed to conquer the high-growth regions. We assume
Archisurance prefers to first use its current market as test market and later expand in the high-
growth areas.
After formulating strong goals and a solid strategy, it is time to be more precise and formulate
objectives that quantify the goals. The objectives set here are all to be achieved within the
following year. The objective increase revenue is set at 25%. Archisurance wants to have no
more than 25% of the current customers leaving and hold 90% of the new customers that come
in this year. Cross selling has the objective of having a customer base of 30% that has at least 2
different insurance products. To attract new customers, a lead indicator is set that counts the
number of positive media mentions in local newspapers. The objective is to get mentioned at
least 3 times. A lag indicator is the growth of the customer base, set at 10%. The goal expanding
the product line gets the objectives of 5 new product introductions and 20% of total revenue

26
from new products. The increase customer satisfaction goal will be measured on the basis of a
customer satisfaction survey. The objective is to increase the average score by 1 at the end of the
year. To improve digital experience, objectives are set to decrease the number of questions asked
by customers by 15% and the number of app users should increase by 20%. To increase the
solidarity between the three former companies, a survey will be taken whereby the survey has an
objective of at least an 8 for average. As a lead indicator, the company sets a target of at least 3
teambuilding events this year. At last, increasing information should have no internal instabilities
in the CRM system and no customer complaints that their information was already given. As
said in the theory, the financial goal is the ultimate indicator of success after some time while the
other objectives have to be monitored and controlled to help the company achieve its financial
goal. Modelling the strategic goals, objectives together with the strategy and tactics that realise
them results in figures 15, 16, 17 and 18.
Figure 15: The digital customer intimacy strategy realises the finincial goal
Figure 16: The tactics realise the other strategic goals together with their objectives (part a)

27
Figure 17: The tactics realise the other strategic goals together with their objectives (part b)
Figure 18: The tactics realise the other strategic goals together with their objectives (part c)

28
3.4.2 The strategy of Archisurance linked with the BPA in ArchiMate
After having modelled both the business process architecture and the strategy of Archisurance,
we will now connect the two to finally evaluate the strategic fit of their business processes. To
make this connection, we need the desired capability map of Archisurance. The desired
capability map represents all the desired abilities of the enterprise. We start with the current
capabilities of the enterprise, which were presented in the case study. We simplified them a little
bit and present them in appendix A. In real businesses, a capability map with three levels is
recommended.
To deliver on the chosen strategy, new capabilities have to be created or existing capabilities
need to be improved. To acquire more detailed information about its customers, it will acquire
data on various B2B markets. Currently, it does not have the ability to do this. Thus, a new
capability called data acquisition is created. Next to data acquisition is a new capability data
analysis needed to make the new information useful. Since the output of the data analysis will be
used throughout the whole organisation (product development, underwrite risk, marketing, etc.)
we place these new capabilities together under a new support capability called data-driven
insurance. The single CRM will change the current capability customer data management. We
can reflect this by creating a new sub capability called data centralization. The bundling of
products will impact the product management capability while the personnel diffusion changes
the capability HR management. To implement behaviour-based policies, we need changes in
both the product management and underwriting risk capability. At last, for the digital interaction
course of action to happen, we need a new capability called digital customer management. These
changes are modelled with ArchiMate in figures 19 and 20. Note that we use the serving
relationship to highlight the dependencies between the capabilities. The black dot in Figure 20
represents the AND relationship. This means that we need both capabilities to realise the course
of action (one capability does not suffice). The desired capability map is placed in appendix A.
At last, the processes from our BPA need to realise the elements of the desired capability map to
display where the company performs its abilities. This is presented in Figure 21.

29
Figure 19: Implementing the course of action through the creation of new capabilities (part a)
Figure 20: Implementing the course of action through the creation of new capabilities (part b)

30
Figure 21: The BPA linked with the capabilities

31
4 Evaluating the strategic fit of business processes With all the constructs in place, we will now investigate how we can measure the strategic fit of
business processes in the two dimensions mentioned in the introduction: structure and
performance. In the first section, we will investigate the structure dimension followed up by the
performance dimension in the second section.
4.1 Evaluating the structure dimension of strategic fit
The structure dimension answers the question: do we have the right set of processes? A company
does not have the right set of processes when [38]:
• The company has processes that do not contribute towards their organisational strategies
and goals.
• The company has strategies that are unfulfilled because there are no processes in place
that satisfy them.
Translated in terms of ArchiMate in our evaluation:
• Each process must realise at least one desired capability.
• Each desired capability must be realised by at least one process.
Thus, to evaluate the structure dimension of strategic fit, we need to go through each of the
elements of the business process architecture linked with the desired capabilities and make sure
that the above terms are validated. If these terms are violated, a misalignment between the
strategy of the organisation and the business process architecture is established and needs to be
corrected. Depending on the violated term, we propose the following options for the company to
correct the misalignment:
• If a process does not realise at least one desired capability:
Ø Remove the process from business execution.
Ø Modify the process in a matter that it realises a desired capability.
• If a desired capability is not realised by at least one process:
Ø Create a new process that realises the desired capability.
Ø Change an existing process in an order that it realises the desired capability.

32
4.1.1 Case study demonstration-‐Archisurance To demonstrate the evaluation of the structure dimension of strategic fit, we perform the
technique on our case study. As stated in the previous section, we need to go through each of the
elements of the BPA linked with the desired capabilities model and investigate if each process
realises at least one capability and if each capability is realised by at least one process.
Figure 21 shows the business process architecture together with the desired capabilities. We start
our analysis by reviewing if all the processes of the BPA realise at least one capability. In
Archisurance, all the processes realise at least one desired capability. Thus, the first term of the
structure dimension of strategic fit is validated. The next step is to look into the second term, i.e.
investigating if all the capabilities are realised by at least one process. In Archisurance, the new
desired capabilities of Figure 19 and Figure 20 are not realised by one or more processes yet. This
misalignment is the consequence of no decision being made regarding the implementation of
these new desired capabilities. Now, Archisurance must correct these misalignments by either
creating new processes or changing existing processes in order that the desired capabilities are
realised. Figure 22 displays the decision made by Archisurance to correct the misalignment. We
use the colour grey to represent new processes to be created by Archisurance.
To be able to have the data driven insurance capability, Archisurance has created a new support
process called manage big data. It contains three sub processes: search and acquire data, data
analysis and data reporting. The mixed teams capability will be realised by the existing employee
satisfaction initiatives process. This process will be modified to regularly give employees the
option to change insurance type and organise events to unify Archisurance. The existing process
‘inform customer’ will change in a matter that it supports the digital customer management
capability. The manage customer information process needs to be adapted to realise the data
centralization capability. The product management capability, that will focus on behaviour based
policies and the bundling of products, will be made able by the combination of the develop new
policies and issue new policy processes. At last, the data based risk underwriting capability
forces changes in the issue new policy, collect premiums and inform customer processes. In the
issue new policy process, the boundaries of the premiums are explained to the customer based on
his/her behaviour. The collect premiums process will need more flexibility to send an invoice
based on the behaviour of the client during the invoice period. At last, the customer needs to be
informed about the consequences of his/her actions.

33
Figure 22: Correcting the misalignment
4.2 Evaluating the performance dimension of strategic fit When we successfully identify and correct the misalignments in the structure dimension of
strategic fit, we can evaluate the performance dimension of strategic fit. We remark that it is
important that all the misalignments in the structure dimension are solved first for the
performance dimension to be effective evaluated. The reason is that the two terms of the
structure dimension must hold for a viable calculation of the performance dimension.
The performance dimension answers the question: are our processes able to realise our strategic
goals? Moreover, this evaluation will serve the purpose of a strategic control system, thereby
providing support for repeated evaluation of which processes are currently lacking to realise the
strategic goals. First, the company can link the evaluation with an incentive system to make sure
that every person involved in a process works together to realise the strategic goals of the
process while also creating synergies between the processes that receive the responsibility for the
same strategic goals. Second, the evaluation can be the basis of new BPM projects by indicating
which processes are most lacking strategically [1]. Thus, these projects will certainly have high
returns on their invested efforts and contribute towards a better alignment of the processes with
the strategy.

34
To perform the evaluation of strategic fit in the performance dimension, we propose a method
based on the current structure of our model and several properties we wanted the calculated
measure to possess. Currently, our model has the structure resembled in Figure 23. By means of
the derivation relationship, we can state that each process is assigned responsible for the
achievement of one or more objectives. This is indicated by the red realisation relationship in
Figure 23. Since we imposed that an objective is measurable, we can use the performance of the
related objectives of a business process as a measure that indicates if the process was able to
realise the delegated strategic goals (i.e. strategic fit in the performance dimension). Next to
identifying which measure to use, we wanted the calculated score to be able to reflect differences
in priorities and cope with the dependencies between tactics. The design choices made to provide
the calculated score with these properties will be explained in the steps of the method itself. The
method consists of the following steps:
1. Weight the strategic goals.
2. Derive the weights of the objectives.
3. Choose path, target values, threshold values and worst values.
4. Assess current values and calculate performance levels.
5. Build the process-goal models.
6. Calculate the strategic fit scores.
7. Interpret the strategic fit scores.
We will now explain each of the steps in detail and illustrate them on our Archisurance case.
Figure 23: Structure of our model

35
4.2.1 Step 1: Weight the strategic goals The start of the performance evaluation is placing a weight on every non-financial goal. In order
to do that, we need to go back to our strategic model where we modelled every strategic goal and
weight them. The weighting of the goals decides which goals are more important than other and
is, as every prioritizing exercise, not easy. Yet, it is a necessary task because if you don’t weigh
the strategic goals, you are assuming that every goal is of equal importance. This is highly
unlikely, thus the decision makers need to assign the weights. The weights can be determined on
several ways. A first way is for executives to arrive at a common agreement about the
importance of each goal. A second way is to employ the average of the decision makers’
individual weights. Needless to say that other methods are allowed as well, the company has to
adopt its preferred method. Figure 13 illustrates the strategic goals of Archisurance. The
executives arrived at an agreement about the weight of each non-financial goal, which is
displayed in Figure 24. Note that the sum of the percentages is required to be 100%.
Figure 24: Weighting of the non-financial goals
4.2.2 Step 2: Derive the weights of the objectives When the task of weighting the strategic goals is done, it is possible to derive the weights of the
objectives. This step is necessary because the strategic goals are not measurable, the objectives
are. But, because one strategic goal can have multiple objectives, a new weighting exercise is
needed. Hereby, each of the objectives of a strategic goal is weighted to resemble the importance
of an objective regarding the strategic goal. Again, the sum of the objective weights needs to be
100%. When this is done, we can derive the weight of each objective with the following formula:

36
𝑊! = 𝑊! ∗𝑊!"
𝑊! = 𝑤𝑒𝑖𝑔ℎ𝑡 𝑜𝑏𝑗𝑒𝑐𝑡𝑖𝑣𝑒
𝑊! = 𝑤𝑒𝑖𝑔ℎ𝑡 𝑠𝑡𝑟𝑎𝑡𝑒𝑔𝑖𝑐 𝑔𝑜𝑎𝑙
𝑊!" = 𝑟𝑒𝑙𝑎𝑡𝑖𝑣𝑒 𝑖𝑚𝑝𝑜𝑟𝑡𝑎𝑛𝑐𝑒 𝑜𝑓 𝑜𝑏𝑗𝑒𝑐𝑡𝑖𝑣𝑒 𝑜 𝑟𝑒𝑔𝑎𝑟𝑑𝑖𝑛𝑔 𝑠𝑡𝑟𝑎𝑡𝑒𝑔𝑖𝑐 𝑔𝑜𝑎𝑙 𝑔
This formula is based on simple mathematics. For our method, it is required that the sum of the
objectives’ weights is 100%. Since the sum of the weights of the strategic goals is 100%, it
follows that the sum of the weights of a strategic goal’s objectives equals the weight of the
strategic goal itself. Using the above equation fulfils this requirement. For Archisurance, the
relative importance of each objective is presented in Figure 25. Using these scores, we can now
calculate the weight of each objective with our formula. The resulting weights of the objectives,
whose sum is 100%, are displayed in Figure 26.
Figure 25: Relative importance of each objective

37
Figure 26: Weights of the objectives
4.2.3 Step 3: Choose path, target values, threshold values and worst values
In our evaluation, we will need to combine the measures obtained from the objectives. But, all
the metrics have different units, hindering us to combine them. Thus, this creates the demand for
a method that makes combination of measurements with different units possible. Horkoff et al.
[47] proposed a solution for this issue. By normalising the values of the objectives against a set
of parameters, in the same scale, it becomes possible to combine the different measures. These
parameters are defined as the target value, the threshold value and the worst value. They are
utilised in a linear polarisation that transforms the current value in the range [-1; 1] whereby 1
reflects the value of the target value, 0 the threshold value and -1 the worst value (Figure 28). We
define this normalised value as the performance level of the objective and calculate it by using
the formula presented in Figure 27 (𝑡𝑣 represents the threshold value and 𝑐𝑣 the current value).

38
Figure 27: Formula to calculate the performance level of an objective
Now that we know our normalised method, we need to look at the consequences of the
parameters on our evaluation. Because these parameters will affect our evaluation, it is important
that we understand their influence well. Therefore, we propose two paths that the company can
take in determining the parameters.
In path 1, the company sets its objectives with a specified time. The company can then track the
progress of the processes made towards the goals by setting the worst value as the value at the
start of the strategy, the target value as the indicated target value of the objective and the
threshold value as the middle value of the two. This will result in a linear interpolation between
the start and end value of the objective. Each iteration of the evaluation will display the progress
made by the processes and indicate which processes are lacking the most, but at the start of the
strategy every process will have a score of -1. Thus, this path will only start giving real insights
when the time of the evaluation is closer to the deadline of the objective.
Path 2 requires target, threshold and worst values for each time an evaluation of the performance
dimension of strategic fit is taken. Hereby, the threshold value equals the lowest acceptable value
of the objective thereby representing the allowed deviation of the target value. When this path is
followed, a score above 0 means an acceptable performance level and a linear interpolation
between the threshold and the target value will occur. If the score is below 0, the performance
level is unacceptable and a linear interpolation between the worst and the threshold value will
arise. This produces an important difference with path 1, whereby the interpolation was between
the start value and the target value.
It is up to the company to choose which approach it takes. It can even take a hybrid approach but
it is crucial that they understand the consequences of the chosen values. We definitely advocate
path 2 because it results in more valuable information. But, it requires more effort dependent on
the number of evaluations.

39
Figure 28: Illustration of the normalisation [47]
In our case demonstration, we opt for path 2. Since they indicated the target values of their
objectives after 1 year, we will take the (fictitious) evaluation 1 year after they started their new
strategic plan. The values of the parameters are displayed in Table 5. We use the column ‘index’
to indicate if the objective is to (I)ncrease, (R)each or (D)ecrease the value.
Table 5: Parameter values of Archisurance
Objective Index Target Threshold Worst Average on solidarity survey R 8 6 2 # of teambuilding events R 3 2 0 # of customer questions D 15% 10% 0% Average on satisfaction survey I 1 0,5 0 Retainment of new customers R 90% 75% 50% Retainment of old customers R 75% 60% 45% # of app users I 20% 10% 0% # of positive media mentions R 3 1 0 # of customers I 10% 5% 0% %Revenue from new products R 20% 10% 0% # of product introductions R 5 3 0 # of customers having at least 2 products R 30% 15% 0% # of customer complaints R 0 5 20 # of internal instabilities R 0 5 20

40
4.2.4 Step 4: Assess current values and calculate performance levels Subsequent to setting the target, threshold and worst value of each objective, it is time to
measure the current value of each objective and calculate the performance level as explained in
the previous section. As a reminder, Figure 27 shows the formula for calculating the performance
level of an objective. If the current value is higher than the target value, we install the
performance level on 1. On the other hand, if the current value of an objective is less than the
worst value, we install the performance level on -1.
To demonstrate how to make use of our technique, we create three different scenarios for
Archisurance. The values of the three scenarios along with the calculated performance levels are
displayed in Table 6.
Table 6: Current values and performance levels of the three scenarios of Archisurance
4.2.5 Step 5: Build the process-‐goal models As indicated in Figure 23, we can derive the relationship between a process and its objectives. It is
now the intention to find for each business process all the objectives it realises. We call this
result a process-goal model. To perform this step, simply follow the realisation relationship
through the model to find each of the objectives it realises. One difficulty here lies in the use of
the serving relationship used by the courses of actions. We propose that a business process that
Objective Cv 1 Cv 2 Cv 3 Pl 1 Pl 2 Pl 3 Average on solidarity survey 8 4 7 1,00 -‐0,50 0,50 # of teambuilding events 3 2 3 1,00 0,00 1,00 # of customer questions 2% 12% 15% -‐0,80 0,40 1,00 Average on satisfaction survey 0,1 2 2 -‐0,80 1,00 1,00 Retainment of new customers 60% 95% 95% -‐0,60 1,00 1,00 Retainment of old customers 75% 80% 90% 1,00 1,00 1,00 # of app users 2% 5% 20% -‐0,80 -‐0,50 1,00 # of positive media mentions 0 1 3 -‐1,00 0,00 1,00 # of customers 1% 6% 25% -‐0,80 0,20 1,00 %Revenue from new products 0% 30% 35% -‐1,00 1,00 1,00 # of product introductions 0 5 5 -‐1,00 1,00 1,00 # of customers having at least 2 products 40% 24% 5% 1,00 0,60 -‐0,67 # of customer complaints 0 3 0 1,00 0,13 1,00 # of internal instabilities 0 2 0 1,00 0,20 1,00

41
realises a course of action that serves another course of action, adopts the goals of that other
course of action together with the use of an AND element of ArchiMate. The reason behind this
distinction is for calculation purposes, which will be illustrated in the following section. Figure 29
represents our proposed method.
We present the process-goal model of the Manage big data process of Archisurance in Figure 30
as an illustration of our derivation method. The manage big data process realises the Internet of
things and big data courses of actions. These serve the behaviour based policies and digital
interaction courses of actions. Therefore, the manage big data process adopts the objectives of
the behaviour based policies and digital interaction courses of actions according to our method.
For the full model of Archisurance and the other process-goal models, we refer to appendix B.
Figure 29: Derivation of serving relationship
4.2.6 Step 6: Calculate the strategic fit scores
With the objectives weights, performance levels and our process-goal models in place, we can
finally calculate the strategic fit scores for each of the business processes. The formula is based
on three choices made by the author, which are the following:
1. If two processes realise two different objectives that have the same performance level but
different weights, the process that realises the objective with the highest weight should
have the lowest strategic fit score.
2. If a process realises two objectives, it receives the average performance level score.

42
3. If a process has a derivation of a serving relationship, the average scores are passed on till
the AND-nodes where after the minimum score, of all the AND-nodes, is the strategic fit
score.
The first choice is made based on the perception that if a new BPM project will be started, it
should be on the process that has the lowest strategic fit score. Thus, if a process realises an
objective that has a higher weight, and does not fulfil its target, it should receive a lower strategic
fit score. Then if a BPM project is started, it will improve the process that realises the objective
with the most importance. For the second choice, we had three options. If a process realises two
goals, the maximum, minimum or average value could be chosen. Since we want to avoid the
situations where either all objectives are good and one objective is bad and therefore receives a
bad score and where all objectives are bad and one objective is good and therefore receives a
good score, we judged that an average score is the right representation. At last, for the derivation
of the serving relationship, we decided that the process that realises the course of action that
serves other courses of action should receive the same score as the worst process it serves. This
is based on the property that if a process is doing bad, it could be because the other process that
serves this process is not fulfilling its capabilities and therefore it is the other process fault and
not this process. For this to be assessed, the other process should receive the same score as this
process. We will see in the next section how we can get to the conclusion which process is at
fault. The first two choices result in the use of a simple weighted average transformed to cope
with both positive and negative numbers and higher weights resulting in lower scores. A
minimum statement resembles the third choice. This results in the following formula to calculate
the strategic fit score:
𝑆𝐹 = 𝑀𝑖𝑛 𝐴! 𝐴! =𝑃𝑙! , 𝑖𝑓 𝑃𝑙! = 1 ∨ 𝑃𝑙! = −1𝑃𝑙! − 𝑃𝑙!𝑊! 𝐵𝑇!"!
𝑂, 𝑜𝑡ℎ𝑒𝑟𝑤𝑖𝑠𝑒
∀ 𝑘 ∈ 𝐾
𝐾 = 𝑁𝑢𝑚𝑏𝑒𝑟 𝑜𝑓 𝐴𝑁𝐷 − 𝑛𝑜𝑑𝑒𝑠 𝑡ℎ𝑎𝑡 𝑏𝑒𝑙𝑜𝑛𝑔 𝑡𝑜 𝑡ℎ𝑒 𝑏𝑢𝑠𝑖𝑛𝑒𝑠𝑠 𝑝𝑟𝑜𝑐𝑒𝑠𝑠
𝑂 = 𝑁𝑢𝑚𝑏𝑒𝑟 𝑜𝑓 𝑜𝑏𝑗𝑒𝑐𝑡𝑖𝑣𝑒𝑠 𝑡ℎ𝑎𝑡 𝑏𝑒𝑙𝑜𝑛𝑔 𝑡𝑜 𝑡ℎ𝑒 𝑏𝑢𝑠𝑖𝑛𝑒𝑠𝑠 𝑝𝑟𝑜𝑐𝑒𝑠𝑠
𝐴! = 𝑤𝑒𝑖𝑔ℎ𝑡𝑒𝑑 𝑎𝑣𝑒𝑟𝑎𝑔𝑒 𝑝𝑒𝑟𝑓𝑜𝑟𝑚𝑎𝑛𝑐𝑒 𝑙𝑒𝑣𝑒𝑙 𝑠𝑐𝑜𝑟𝑒 𝑜𝑓 𝐴𝑁𝐷 − 𝑛𝑜𝑑𝑒 𝑘
𝑃𝑙! = 𝑃𝑒𝑟𝑓𝑜𝑟𝑚𝑎𝑛𝑐𝑒 𝑙𝑒𝑣𝑒𝑙 𝑜𝑓 𝑜𝑏𝑗𝑒𝑐𝑡𝑖𝑣𝑒 𝑜
𝑊! =𝑊𝑒𝑖𝑔ℎ𝑡 𝑜𝑓 𝑜𝑏𝑗𝑒𝑐𝑡𝑖𝑣𝑒 𝑜
𝐵𝑇!" = 1, 𝑖𝑓 𝑜𝑏𝑗𝑒𝑐𝑡𝑖𝑣𝑒 𝑜 𝑏𝑒𝑙𝑜𝑛𝑔𝑠 𝑡𝑜 𝐴𝑁𝐷 − 𝑛𝑜𝑑𝑒 𝑘
0, 𝑜𝑡ℎ𝑒𝑟𝑤𝑖𝑠𝑒

43
Figure 30: Process-goal model of the manage big data business process of Archisurance
We will demonstrate the use of our formula for scenario 1 for the business process manage big
data of Figure 30. The analysis is presented in Figure 31. The orange colour represents the weights,
the purple colour the performance levels, the brown colour the individual weighted levels
resulting in the green colour as the weighted average. At last, the minimum of the two weighted
averages is chosen as the strategic fit score of the process displayed in the colour red. The
strategic fit scores of the other processes for all the scenarios can be found in Table 7.
Table 7: Strategic fit scores of the processes of Archisurance in the three scenarios
Business process SF 1 SF 2 SF 3 Employee satisfaction initiatives 1,00 -‐0,26 0,74 Inform customer -‐0,68 0,56 1,00 Collect premiums -‐0,98 0,54 1,00 Issue new policy -‐0,59 0,54 0,65 Develop new policies -‐0,59 0,54 0,65 Manage big data -‐0,98 0,54 1,00 Manage enterprise information 1,00 0,16 1,00
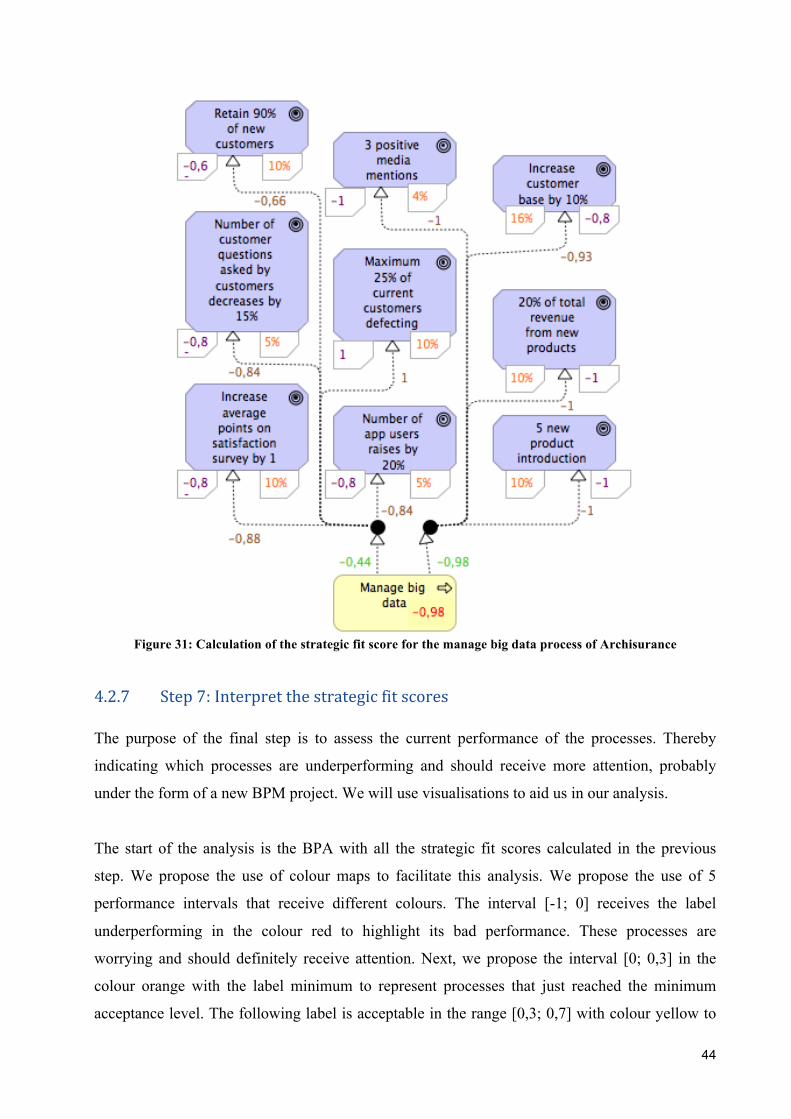
44
Figure 31: Calculation of the strategic fit score for the manage big data process of Archisurance
4.2.7 Step 7: Interpret the strategic fit scores The purpose of the final step is to assess the current performance of the processes. Thereby
indicating which processes are underperforming and should receive more attention, probably
under the form of a new BPM project. We will use visualisations to aid us in our analysis.
The start of the analysis is the BPA with all the strategic fit scores calculated in the previous
step. We propose the use of colour maps to facilitate this analysis. We propose the use of 5
performance intervals that receive different colours. The interval [-1; 0] receives the label
underperforming in the colour red to highlight its bad performance. These processes are
worrying and should definitely receive attention. Next, we propose the interval [0; 0,3] in the
colour orange with the label minimum to represent processes that just reached the minimum
acceptance level. The following label is acceptable in the range [0,3; 0,7] with colour yellow to

45
represent a medium performance of the process. We choose the colour light green for the range
[0,7; 1], which we label good. At last, a strategic fit score of 1 is indicated with a dark green
colour and represent target reached. Of course, a company is free to use other intervals if it
wishes.
After the initial evaluation of the performance of the processes, we propose the use of two more
models to find the root causes of the failure. The first model is the process-capability model
made when evaluating our structure dimension of strategic fit. Using for example an assessment
of the capability level, which will not be discussed here, but is elaborated in [44], we can see the
progress of the implementation of the strategy. The reason for this model is because if a process
is not reaching its goals, it can be that the implementation of the strategy is delayed, therefore the
process does not realise its capability yet, leading in non-satisfaction of the strategic goal. This is
especially useful if there are multiple processes underperforming. The assessment of the
capabilities can indicate the root cause of the underperformance. A second possibility is when
the assessment of the capabilities reveals that all capabilities are implemented well. If this
happens, the capabilities are well implemented but the processes do not reach their goals, the
chosen strategy or the process executors are at fault. Thus, this model shows that a revision of
the strategy and the process executors is necessary because it is not achieving it ends. For this
purpose, we propose a second model, namely the process goal model of the weakest performing
processes. This model can indicate which goals it is achieving and which goals it is not. This
gives then the urgency of a new BPM project to be started with guidance of the specific goal(s)
the process should achieve. This model will guarantee high value for the BPM project. At last, if
the company reached strategic fit scores of 1 on all processes at the end of the planning period, it
can evaluate its strategy by examining if the financial objectives are attained.
We will now demonstrate the last step of our method for the three scenarios of Archisurance.
A. Scenario 1 We start our analysis with the processes of Archisurance indicated with their strategic fit scores
and colour labels in Figure 32. Normally, this would be visualised on the full BPA we created in
section 2. But for better visualisation, we only used the processes that are affected by the current
strategy. As can be clearly seen from the figure, something went wrong because we see a lot of
red processes. This means that they are all underperforming. To find the next action plan, we will
start by taking a look at the process-capability map as suggested in our section above. For us, in

46
our case study, it would be possible to look at all the capabilities of all the processes because we
simplified the case study. But, in real life, this approach will take a lot more effort. Therefore, we
suggest to start with the capabilities of the process with the weakest strategic fit score. As can be
seen in Figure 32, two processes have the weakest score. Namely, the collect premiums and the
manage big data processes. The process-capability model of these processes is visualised in
Figure 33. This model reveals that all the capabilities of the processes are at a very low
implementation level (colour white) [44]. Further investigation reveals that the other capabilities
are failing because they depend on the data acquisition capability that the company does
currently not have. Thus, we can conclude that Archisurance should investigate why the process
search and acquire data is not able to acquire data. This can give the company the option to
reform how the process works or give the process more resources. At last, the objectives should
be re-evaluated to be in line with the current state of the strategy.
Figure 32: Visualisation of strategic fit scores of scenario 1

47
This first scenario demonstrates our choice regarding the calculation of the strategic fit scores. If
we would not have included the AND-node formula, manage big data would have gotten a better
score. This would lead to more resources expanded for searching why the process collect
premiums is performing so poorly. With our approach, the problem is identified fast and the
company can start working on a solution.
Figure 33: process-capability map
B. Scenario 2 Once again, we will start our approach by looking at the visualisation of the strategic fit scores of
Archisurance. This is displayed in Figure 34. This scenario shows a better state than the previous
scenario. Here, most processes are performing at an acceptable performance. Only the employee
satisfaction initiatives process is under performing and the manage enterprise information is at a
minimum level of performance. Our model prioritises the focus on the employee satisfaction
initiatives process. As in the previous scenario, we will investigate how the capabilities of this
process are performing. This is shown on the left side in Figure 35 and states that it is able to do
the capability (colour green) [44]. Thus, the employee satisfaction initiatives process was able to
successfully set up the mixed teams and give employees the option to change insurance types.
Since it is not a fault of the implementation of the strategy, we will need to look further to find
the cause of the bad performance of the process. To do this, we propose to look at the process-
goal model itself. The process-goal model of the employee satisfaction initiatives is displayed on

48
the right side in Figure 35. This shows that the current solidarity is only a 4 and that it was only
able to do 2 teambuilding events. This can either give the opportunity for a BPM project that
reduces the time to organise a teambuilding event or raise the question that the strategy to
increase the solidarity is not working.
Figure 34: Visualisation of strategic fit scores of scenario 2
Figure 35: Process-capability (left) and Process-goal (right) model

49
C. Scenario 3 Just as in the previous two scenarios, we start with visualising the strategic fit scores. Figure 36
presents this for scenario 3. Archisurance can be satisfied with this result since most processes
reached their targets. Although the two yellow processes are in the acceptable performance level,
they do have the lowest scores thus we will investigate them to try and improve them. For our
investigation, we will use the process-goal model of the two processes. The two processes have
the same process-goal models, therefore we only show it for one process in Figure 37. Our
process-goal model quickly reveals the issue. The two processes are performing well but are not
fulfilling the goal of cross selling. Archisurance should address this issue by investigating
whether the bundled policies are not attractive to the customers or if the sales people of the issue
new policy are not selling them well. Either way, the two processes should work together to
increase their performance on the cross selling goal. If Archisurance ties our system with an
incentive system, the people of the two processes will automatically be directed towards
fulfilling this goal.
Figure 36: Visualisation of strategic fit scores of scenario 3

50
Figure 37: Process-goal model of the issue new policy process
5 Conclusion and further work In this dissertation, a new method is proposed and demonstrated to measure the strategic fit
within the business architecture. For this purpose, we use the business process architecture as our
central artefact because processes are the core drivers of value creation and strategy execution
within an organisation. The result of the measurement is threefold. First, repeated evaluation of
strategic fit can serve as a strategic control system. This results in the various parts of the
enterprise working together in pursuit of its strategic goals. Second, the strategic fit scores of the
business processes determine a new priority rank for new BPM projects that will guarantee high
value improvements. Hereby, the lower the strategic fit score, the higher the priority. Third, the
method serves as the basis of evaluating the strategy itself by distinguishing between financial
goals and non-financial goals and distinguishing between ends and means. Based on these
results, we consider the contribution of this dissertation to be (i) a refinement of the balanced
scorecard as strategic control system, (ii) a method for strategic alignment of BPM projects and
(iii) a method to assess and improve strategic fit within the business architecture. Thus,
contributing to the field of strategic management, enterprise architecture and business process
management by combining the three disciplines.

51
We successfully proposed and evaluated an answer on research question one. Thereby
demonstrating how the business process architecture can be identified and modelled with the
ArchiMate language. An evaluation of the correctness of the identified BPA was not part of this
thesis but could definitely be researched in future work. The second research question demanded
a method to connect the strategy of the enterprise with its BPA. We proposed a new conceptual
model for this purpose and demonstrated its use. At last, we proposed a method to measure the
strategic fit of business processes to answer our third research question. Incorporating leading
process performance measures that can predict the outcome of our current lagging strategic
process performance measures could generate an extension on our model. This is left for future
research.
Several other methods have already been introduced to improve the strategic fit within the
business architecture [3][10][47]. Our method differs in three important ways. First, most of
these techniques do not include a method to measure the strategic fit but simply align different
models. Second, with exception of [3], other methods do not use the business process
architecture as the basis for the improvement, but use loosely coupled processes. Third, other
techniques use either a new invented language or combine different languages. This dissertation
uses the ArchiMate language, which has the advantage of having constructs in other architectural
domains as well. This creates the possibility to form a model in a single language that can be
used to measure both the strategic fit within and the functional integration between the business,
application and technology architecture. This possibility is our first proposition for future work.
This dissertation is the foundation of measuring the strategic fit within the business architecture.
Further work should focus on measuring functional integration between and strategic fit within
the other architectures. Then all these methods can be combined to create a method to measure
strategic alignment.
Since our work is evaluated with the help of a fictitious case study, another possibility of future
work is to test and further refine the use of our method in real companies. Thereby, investigation
of which process performance measures affect the strategic objectives is potential future work
that could extend our current model to better monitor the outcomes of the objectives and gain
more insights for the strategy formulation.

52
Reference list [1] Dumas, La Rosa, Mendling, Reijers. Fundamentals of Business Process Management. Springer, 2013. [2] Wierda G. Mastering ArchiMate. R&A, 2012 [3] Odeh Y, Odeh M, Green S. “Aligning Riva-based Business Process Architectures with Business Goals Using the i* Framework.” Proc. 3rd International Conf. Business Intelligence and Technology, IARIA, 2013, pp. 15-20. [4] Steen M.W.A, Akehurst D.H, Ter Doest H, Lankhorst M.M. “Supporting Viewpoint-Oriented Enterprise Architecture.” Enterprise Distributed Object Computing Conference, 2004. [5] Heijster M.V. “Enterprise Architecture: Problems and potentials of ArchiMate.” Citeseer, 2007 [6] Dorji S, Kirikova M. "Data, Information, and Knowledge Modeling in Worksystem Networks." Riga Technical University, Faculty of Computer Science and Information Technology, Institute of Applied Computer Systems, Kalku 1, Riga, Latvia, 2012 [7] The Open Group, “ArchiMate 3.0 Specification, Technical Standard,” Reading, UK: The Open Group, 2016. [Online]. Available: http://www.opengroup.org/archimate/ [8] Josey A. TOGAF Version 9.1 Enterprise Edition: An Introduction. Open Group, 2011. [9] Harmon P. Business process change. Morgan Kaufmann, 2014. [10] Roelens B, Steenacker W and Poels G. "Realizing strategic fit within the business architecture: the design of a Process-Goal Alignment modeling and analysis technique." Software & Systems Modeling, 2017, pp. 1-32. [11] Dijkman R, Vanderfeesten I, Reijers HA. "Business process architectures: overview, comparison and framework." Enterprise Information Systems, 10.2, 2016, pp. 129-158. [12] Azevedo CLB, et al. "An ontology-based semantics for the motivation extension to archimate." Enterprise Distributed Object Computing Conference (EDOC), 2011 15th IEEE International. IEEE, 2011. [13] Aldea A, et al. "Modelling strategy with ArchiMate." Proceedings of the 30th Annual ACM Symposium on Applied Computing. ACM, 2015. [14] Sowa, John F., and John A. Zachman. "Extending and formalizing the framework for information systems architecture." IBM systems journal 31.3, 1992, pp. 590-616. [15] Object Management Group, “Business Motivation Model Version 1.3.” Available: http://www.omg.org/spec/BMM/1.3/

53
[16] Yu E. “Towards Modelling and Reasoning Support for Early-Phase Requirements Engineering.” Proceedings of the 3rd IEEE Int. Symp. on Requirements Engineering (RE’97). Washington D.C.,1997, pp. 226-235. [17] Dardenne A, Lamsweerde AV, Fickas S. “Goal- Directed Requirements Acquisition.” Science of Computer Programming. Vol. 20, 1993, pp. 3-50. [18] Quartel D, Engelsman W, Jonkers H, Sinderen MV. "A goal-oriented requirements modelling language for enterprise architecture," IEEE EDOC'09, 2009, pp. 3-13. [19] Meertens LO et al. "Mapping the business model canvas to ArchiMate." Proceedings of the 27th annual ACM symposium on applied computing. ACM, 2012. [20] Zajac EJ, Kraatz MS, Bresser RKF. "Modeling the dynamics of strategic fit: A normative approach to strategic change." Strategic management journal, 2000, pp. 429-453. [21] Aldea A et al. "Strategic planning and enterprise achitecture." Enterprise Systems Conference (ES), IEEE, 2013. [22] Azevedo CLB et al. "Towards capturing strategic planning in EA." Enterprise Distributed Object Computing Conference (EDOC), 2015 IEEE 19th International. IEEE, 2015. [23] Mintzberg H. The strategy process: concepts, context, cases. Pearson Education, 2003 [24] Larwood L et al. "Structure and meaning of organizational vision." Academy of Management journal 38.3, 1995, pp. 740-769. [25] Dyson RG. "Strategic development and SWOT analysis at the University of Warwick." European journal of operational research 152.3, 2004, pp. 631-640. [26] Barney J. "Firm resources and sustained competitive advantage." Journal of management 17.1, 1991, pp. 99-120. [27] Eisenhardt KM, Martin JA. "Dynamic capabilities: what are they?." Strategic management journal 21.10-11, 2000, pp. 1105-1121. [28] Porter ME. "Industry structure and competitive strategy: Keys to profitability." Financial Analysts Journal 36.4, 1980, pp. 30-41. [29] Kim WC, Mauborgne R. "Blue ocean strategy." If you read nothing else on strategy, read thesebest-selling articles, 2004, pp. 71. [30] Kohlbacher M. "The effects of process orientation: a literature review." Business Process Management Journal 16.1, 2010, pp. 135-152. [31] Neubauer T. "An empirical study about the status of business process management." Business Process Management Journal 15.2, 2009, pp. 166-183. [32] Vom Brocke J, Rosemann M. Handbook on business process management, Springer, 2010.

54
[33] Atkinson H. "Strategy implementation: a role for the balanced scorecard?" Management Decision 44.10, 2006, pp. 1441-1460. [34] Makadok R. "Toward a synthesis of the resource-based and dynamic-capability views of rent creation." Strategic management journal 22.5, 2001, pp. 387-401. [35] Lankhorst M. Enterprise Architecture at Work, Springer, 2009. [36] OMG: Business Process Model and Notation (BPMN) Specification 2.0 V0.9.15. Object Management Group Inc. (2009). Available: http://www.omg.org/spec/BPMN/2.0/ [37] Jonkers H, Band I, and Quartel D. "The archisurance case study, version 2." White paper, The Open Group, 2016. [38] De Bruin T, Rosemann M. "Towards understanding strategic alignment of business process management." ACIS 2006 Proceedings, 2006, pp. 82. [39] Johnson G, Scholes K, Whittington R. Exploring corporate strategy. Pearson, 2008. [40] Hung RYY. "Business process management as competitive advantage: a review and empirical study." Total Quality Management & Business Excellence 17.1, 2006, pp. 21-40. [41] Andrews KR. "Concept of corporate strategy." 1971. [42] The open group, “Value streams” Available: https://www2.opengroup.org/ogsys/catalog/G170 [43] Smith R. Business process management and the balanced scorecard. John Wiley & Sons Inc, 2007. [44] The open group, “Capability-Based Planning” Available: https://www2.opengroup.org/ogsys/catalog/W16C [45] Maltz AC, Shenhar AJ and Reilly RR. "Beyond the balanced scorecard: Refining the search for organizational success measures." Long Range Planning 36.2, 2003, pp. 187-204. [46] Treacy M and Wiersema F. The discipline of market leaders: Choose your customers, narrow your focus, dominate your market. Basic Books, 1997. [47] Horkoff J et al. "Strategic business modeling: representation and reasoning." Software & Systems Modeling 13.3, 2014, pp. 1015-1041. [48] Henderson JC and Venkatraman H. "Strategic alignment: Leveraging information technology for transforming organizations." IBM systems journal 32.1,1993, pp. 472-484. [49] Maes R. "An integrative perspective on information management." Information Management: setting the scene, 2007, pp. 11-26. [50] The open group, “ArchiSurance Case Study, version 2” Available: https://www2.opengroup.org/ogsys/catalog/Y163

55
Appendix A: Current and desired capability map of Archisurance

56
Appendix B: Full model and process-‐goal models of Archisurance

57