Embed Size (px)
Citation preview

BUSINESS PLAN AND BUDGETFY2017-2018ADOPTED


BUSINESS PLAN AND BUDGET
FY2017-2018ADOPTED

Foothill Transit LeadershipGoverning Board CLUSTER 1ClaremontCouncilmember Corey Calaycay Mayor Pro Tem Opanyi K. Nasiali, AlternateLa VerneCouncilmember Charles A. Rosales Mayor Pro Tem Tim Hepburn, AlternatePomonaCouncilmember Robert S. Torres Mayor Tim Sandoval, AlternateSan DimasCouncilmember Emmett Badar Councilmember John Ebiner, AlternateWalnutCouncilmember Bob Pacheco Councilmember Andrew Rodriguez, Alternate
CLUSTER 2AzusaMayor Pro Tem Uriel Macias Councilmember Edward J. Alvarez, AlternateBaldwin ParkCouncilmember Ricardo Pacheco Councilmember Cruz Baca, Alternate CovinaCouncilmember Peggy A. Delach Councilmember John C. King, AlternateGlendoraMayor Gary Boyer Councilmember Michael Allawos, AlternateIrwindaleMayor Pro Tem Albert Ambriz Councilmember Manuel R. Garcia, AlternateWest CovinaMayor Corey Warshaw Councilmember James Toma, Alternate
CLUSTER 3ArcadiaCouncilmember Roger Chandler Councilmember Tom Beck, Alternate BradburyCouncilmember Richard G. Barakat Councilmember D. Montgomery Lewis, AlternateDuarteCouncilmember Tzeitel Paras-Caracci Councilmember Samuel Kang, Alternate
MonroviaCouncilmember Becky Shevlin VACANT, AlternatePasadenaCouncilmember Margaret McAustin Mayor Terry Tornek, Alternate Temple CityMayor Cynthia Sternquist Mayor Pro Tem William Man, Alternate
CLUSTER 4El MonteCouncilmember Juventino “J” GomezVACANT, AlternateDiamond BarCouncilmember Carol Herrera Councilmember Nancy A. Lyons, AlternateIndustryMayor Pro Tem Cory C. Moss Councilmember Abraham N. Cruz, AlternateLa PuenteMayor Valerie MuñozMayor Pro Tem Violeta Lewis, AlternateSouth El MonteCouncilmember Hector Delgado Mayor Pro Tem Gloria Olmos, Alternate
CLUSTER 5County of Los AngelesDavid C. Rodriguez(Representing Supervisor Janice Hahn) Michael De La Torre(Representing Supervisor Kathryn Barger) Sam Pedroza(Representing Supervisor Hilda Solis)
Executive BoardChairCarol HerreraCluster 4 - Diamond Bar
Vice ChairCorey CalaycayCluster 1 - Claremont
Board MemberCorey WarshawCluster 2 - West Covina
Board MemberCynthia SternquistCluster 3 - Temple City
Board MemberSam PedrozaCluster 5 - County of Los Angeles
Executive Board AlternatesBob PachecoCluster 1 - Walnut
VacantCluster 2 -
Richard Barakat Cluster 3 - Bradbury
Valerie MuñozCluster 4 - La Puente
Michael De La TorreCluster 5 - County of Los Angeles
Doran J. BarnesExecutive Director
Kevin Parks McDonaldDeputy Executive Director
LaShawn King GillespieDirector of Customer Service and Operations
Roland CorderoDirector of Maintenance and Vehicle Technology
Felicia FriesemaDirector of Marketing and Communications
Senior ManagementDonald Luey Director of Information Technology
Jarrett StoltzfusDirector of Policy and Strategic Sourcing
Michelle Lopes CaldwellDirector of Finance and Treasurer
Joseph RaquelDirector of Planning
Sharlane BaileyDirector of Facilities
David ReynoDirector of Government Relations

Table of Contents
ExecutiveSummary
1. ExecutiveSummary2. MissionStatementandValues3. OverallSystemPerformance4. InitiativesforFY2016-2017andFY2017-2018
ServiceSummary
1. AgencyHistory2. OrganizationalStructure3. FoothillTransitFleetandFacilities4. ServiceChangesProposedFortheNextThreeYears5. MajorCapitalProjectsPlannedFortheNextThreeYears
1
FY2016-2017Summary of Activities
1. OverallSystemStatistics2. ProgressinAdvancingFY2016-2017Initiatives
FY2017-2018Initiatives
1. OverallSystemStatistics2. FY2017-2018GoalsandTargets3. MajorInitiativesforFY2017-2018
4
Funding and Budget Summary
1. FundingSources2. FundingAssumptionsandBudgetedRevenues3. ExpenditureAssumptionsandBudgetedExpenditures4. OperatingExpenses5. CapitalExpenditures
5
6Capital 1. CapitalPrograms
7OperatingBudget
Section Page
2
3
1. DepartmentBudgetsandSummary2. CustomerServiceandOperations3. MaintenanceandVehicleTechnology4. MarketingandCommunications5. InformationTechnology6. Administration7. PolicyandStrategicSourcing8. Finance9. Planning
Facilities
5689
1215161718
2225
303133
3842434445
48
5455586164666971747610.


Adhering to our mission statement will continue to guide planning and day-to-day operations as we advance Foothill Transit’s mission into and through the coming year.
Foothill Transit will remain keenly focused on safety, customer service, efficiency, and innovation as we undertake a number of capital and operating programs designed to achieve these goals. Among these are the development of the Covina Transit Center and Park & Ride, implementation of a college ridership program with Citrus College, new CNG and electric bus procurements, implementation of recommendations from the Fare Restructuring Study that is currently ongoing, and the replacement of the agency’s Computer Aided Dispatch and Automatic Vehicle Location (CAD/AVL) system. All of these projects have a goal of growing ridership and improving our customers’ day-to-day experience with our service.
The FY2017-2018 Business Plan and Budget projects that Foothill Transit will operate 872,171 vehicle service hours, which is equal to the FY2016-2017 year-end estimated service levels.
The total agency-wide budget of $161 million is a seven percent increase over the FY2016-2017 budget. The FY2017-2018 transit operating cost, budgeted at $98.2 million, represents a six percent increase over FY2016-2017 budget. The primary drivers in the operating cost increases are the award of the operating contract at the Pomona Operations and Maintenance Facility, which incorporates changes to hourly wage rates and the contractual increases related to CPI. The FY2017-2018 capital budget of $61 million is nine percent higher than the FY2016-2017 budget and includes ongoing and new capital projects.
Foothill Transit’s FY2017-2018 fare revenue projection is $17.5 million, which is eight percent more than the FY2016-2017 year-end estimate. This improvement is related to conclusion of the agreement with LA Metro to honor Metro fares for one year on Lines 190, 194, and 270.
Foothill Transit ridership is projected to decrease by one percent, which is consistent with recent trends. This business plan includes a heightened focus on innovative service delivery concepts focused on growing ridership. The fare restructuring planned for this fiscal year will address methods to increase fare revenues and improve operational efficiency.
Executive Summary

6 | BUSINESS PLAN AND BUDGET FY2017-2018 BUSINESS PLAN AND BUDGET FY2017-2018 | 7
The Foothill Transit Mission
Foothill Transit provides community-oriented, environmentally
friendly bus service throughout Southern California’s San Gabriel
and Pomona Valleys, including express bus routes to Downtown
Los Angeles.
To be the premier public transit provider committed to:
SAFETYCOURTESY QUALITYRESPONSIVENESSEFFICIENCYAND INNOVATION

6 | BUSINESS PLAN AND BUDGET FY2017-2018 BUSINESS PLAN AND BUDGET FY2017-2018 | 7
The Foothill Transit MissionSAFETYWe educate, encourage, and endorse a strong culture of safety at all levels of the organization, valuing the responsibility entrusted to us by the communities that we serve.
RESULTSWe value the achievement of organizational goals and initiatives as defined in our business plan and involving all levels of the organization.
INTEGRITYWe are committed to high ethical standards based on accountability, honesty, respect, transparency, and a high level of fiscal responsibility.
DIVERSITYWe create an environment rich with talented people and differing viewpoints, valuing the unique perspectives that everyone brings.
TEAM MEMBERSOur team members are the key to Foothill Transit’s success and we are committed to supporting them through education, development, and recognition.
COMMUNICATIONWe value and are committed to open, honest, and respectful discussion that is responsive, informative, and constructive.
SUSTAINABILITYWe embrace sustainability because it benefits all aspects of our business, while also helping our communities by protecting the environment through measured and responsible stewardship of resources.
Foothill Transit Values

Passenger Boardings
Vehicle Service Hours
Fare Revenue
Operating Expense
13,584,135
799,177
$17,144,739
$75,446,753
14,849,171
881,868
$19,500,000
$92,748,920
13,585,262
873,598
$16,151,831
$89,331,220
13,510,238
872,171
$17,421,825
$98,235,452
Overall System Performance
FY2015-2016 Actual
FY2016-2017 Target
FY2016-2017 Estimate
FY2017-2018Target
This chart shows a comparison of Foothill Transit’s overall system performance for FY2015-2016, the projected performance for FY2016-2017, and the targeted performance goals for FY2017-2018.
Operate a Safe Transit System
Provide Outstanding Customer Service
Operate an Effective Transit System
Operate an Efficient Transit System
Preventable Accidents per 100,000 miles
Schedule Adherence
Miles Between Service Interruptions
Complaints per 100,000 Boardings
Boardings per Vehicle Service Hour
Average Weekday Boardings
Farebox Recovery Ratio
Average Cost per Vehicle Service Hour
0.90
83.2%
25,694
18.7
17.2
45,310
22.7%
$95.50
0.70
83.0%
20,000
16.0
16.8
49,638
21.0%
$105.17
0.78
82.9%
30,683
21.0
15.6
45,695
18.1%
$102.26
Goal Indicator FY2015-2016 Actual
FY2016-2017 Target
FY2016-2017 Estimate
0.70
83.0%
20,000
20.0
15.5
45,034
17.7%
$112.63
FY2017-2018 Target
8 | BUSINESS PLAN AND BUDGET FY2017-2018
Overall System Performance
BUSINESS PLAN AND BUDGET FY2017-2018 | 9
Overall System Performance
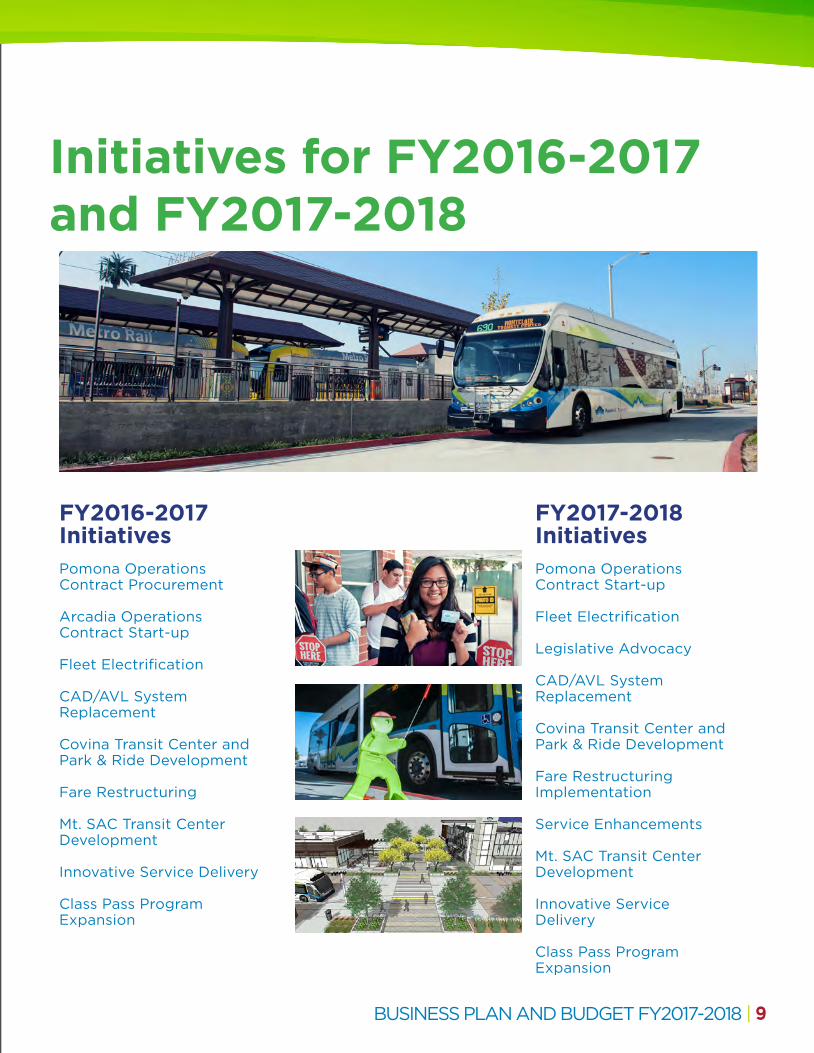
Pomona Operations Contract Procurement
Arcadia Operations Contract Start-up
Fleet Electrification
CAD/AVL System Replacement
Covina Transit Center and Park & Ride Development
Fare Restructuring
Mt. SAC Transit Center Development
Innovative Service Delivery
Class Pass Program Expansion
Pomona Operations Contract Start-up
Fleet Electrification
Legislative Advocacy
CAD/AVL System Replacement
Covina Transit Center and Park & Ride Development
Fare Restructuring Implementation
Service Enhancements
Mt. SAC Transit Center Development
Innovative Service Delivery
Class Pass Program Expansion
FY2016-2017Initiatives
FY2017-2018Initiatives
Initiatives for FY2016-2017 and FY2017-2018

This page is intentionally left blank.

This page is intentionally left blank.
SERVICE SUMMARY

12 | BUSINESS PLAN AND BUDGET FY2017-2018 BUSINESS PLAN AND BUDGET FY2017-2018 | 13
Agency History Foothill Transit was created in 1988 as a unique joint powers authority following the Southern California Rapid Transit District (RTD) announcement of service cuts and fare increases that would negatively impact the San Gabriel Valley. The Los Angeles County Transportation Commission (LACTC) approved Foothill Transit’s application to assume operation of 14 lines previously operated by RTD. Foothill Transit was tasked by community leaders to provide superior public transportation, while reducing costs, and improving local control. Its leadership is comprised of elected representatives of 22 member cities in the San Gabriel and Pomona Valleys and three appointees from the Board of Supervisors of the County of Los Angeles.
Foothill Transit service began in December 1988 with the operation of two fixed-route bus lines absorbed from RTD – Lines 495 and 498. The remaining 12 lines approved by the LACTC were shifted to Foothill Transit operation over a period of five years. The new agency also assumed administration of the Bus Service Continuation Project and began providing service on an additional six lines that were cancelled by RTD. Foothill Transit performed an analysis of regional transit needs which resulted in changes to existing lines, increased weekday service, introduction of new weekend service, and new service to connect communities.
Foothill Transit now operates 39 fixed-route local and express lines, which covers over 300 square miles in eastern Los Angeles County and serves approximately 14 million customers each year. This number is up from 9.5 million from the time of Foothill Transit’s formation.
At its inception, Foothill Transit relied on contractor-provided operations facilities to maintain its growing fleet. Then in 1997, Foothill Transit opened its first agency-owned operations facility in Pomona. The second agency-owned operations facility in Arcadia completed construction in 2002. In 2007, the administrative offices moved from leased property to its current address at 100 S. Vincent Ave. in West Covina. The purchase of the administrative building enabled the investment of capital dollars to offset ongoing operating costs associated with the lease of the previous office space.
FAST FACTS
Buses in service: 369 (337 CNG and 32 electric buses)
Lines: 39 local and express routes
Area served: 327 square miles of the San Gabriel and Pomona Valleys
Ridership: Over 48,000 a week, and approximately 14 million a year
Comparative size: Medium-sized municipal operator in Los Angeles County, second in fleet size only to regional provider Metro

12 | BUSINESS PLAN AND BUDGET FY2017-2018 BUSINESS PLAN AND BUDGET FY2017-2018 | 13
Foothill Transit began converting its diesel-fueled fleet to compressed natural gas in 2002. Fleet conversion is now 100 percent complete with the final diesel-fueled bus retired in late 2013.
Agency growth continued in 2007 as Foothill Transit launched the region’s first cross-valley, high occupancy bus service – the Silver Streak. Covering approximately 45 miles from Montclair to downtown Los Angeles. The Silver Streak route spends about five percent of its total trip time on surface streets by utilizing freeways and High Occupancy Toll (HOT) lanes for quick commuting between designated station stops, mimicking the efficiency and speed of light rail.
Continuing its commitment to adopt low emissions technology, the agency took a bold step in 2010 with the implementation of the first-of-its-kind, zero-emissions battery electric buses. Funded through the American Recovery and Reinvestment Act of 2009 (ARRA), these vehicles were the first heavy duty zero-emissions battery electric public transit buses that utilized in-route fast charging capability that enabled them to remain in service throughout the day without having to leave the route to be charged before
returning to service. Foothill Transit received a $10.2 million TIGGER II grant in early 2011 to expand the electric bus program. This funding enabled the purchase of 12 additional electric vehicles for use on Line 291 and on other lines that serve the Pomona Transit Center. In July 2014, Line 291 became the first all-electric, zero-emissions bus line in operation in Los Angeles County. In May 2016, Foothill Transit embarked on a bold new vision to fully electrify the bus fleet by 2030.
To best serve the organization and stakeholders, Foothill Transit began the transition to in-house management on June 15, 2013, by hiring its first full-time employee, Executive Director Doran J. Barnes. Doran had previously served as Executive Director since 2003 under a management contract with Veolia Transportation. At the direction of the Board, senior leadership and technical staff were hired and the management services contract with Transdev was amended, which resulted in management of Foothill Transit being brought in-house on July 1, 2013. Bus operations and maintenance, Transit Store operations, and bus stop maintenance continue to be provided
under contracts with private firms.
Foothill Transit began providing service to the first agency-owned parking structure, the Industry Park & Ride, on October 7, 2013, to provide more convenient and predictable commuting options for residents of the San Gabriel and Pomona Valleys. The structure houses 622 parking spaces and its construction allowed for the introduction of Line 495 – Foothill Transit’s first and only commuter line to offer non-stop service into downtown Los Angeles.
14 | BUSINESS PLAN AND BUDGET FY2017-2018 BUSINESS PLAN AND BUDGET FY2017-2018 | 15
Our second Park & Ride facility - the Azusa Intermodal Transit Center - opened in January 2016 in the City of Azusa. That structure is shared by the City of Azusa and the Gold Line Foothill Extension, and provides 202 spaces to Foothill Transit customers. The Azusa Intermodal Transit Center immediately adjacent to the parking structure, includes infrastructure for electric bus charging to facilitate near term plans to fully electrify Line 280, which is a north-south route traveling between Azusa and the Puente Hills Mall.
In June 2016, Foothill Transit assumed the transfer of lines 190, 194, and 270 from LA Metro – the largest service expansion in 14 years. Lines 190 and 194 provide service from El Monte to Pomona along corridors that were not previously served by other Foothill Transit Lines. Additionally, line 270 serves the cities of Monrovia and El Monte, while connecting passengers to the newly constructed Gold Line Station.
In February 2017, Foothill Transit achieved an important milestone in the agency’s quest towards sustainability as it became the first bus-only public transit system in North America to attain the American Public Transportation Association’s (APTA) Sustainability Commitment Platinum Level. APTA’s recognition highlights the agency’s effort in being responsible stewards of the resources that are entrusted to us, and our ability to develop and implement sustainable processes.
Agency History(continued)

14 | BUSINESS PLAN AND BUDGET FY2017-2018 BUSINESS PLAN AND BUDGET FY2017-2018 | 15
General membership in the Foothill Transit Joint Powers Authority includes one city council member and one alternate from each of the 22 cities in the Foothill Transit service area and three appointed repre-sentatives for the County of Los Angeles.
A five-member Executive Board governs Foothill Transit: four elected officials representing four clusters of cities, and the fifth member is elected by the Los Angeles County representatives (Cluster Five).
The Board directs policy that is implemented by a directly employed administrative staff. On-street operations and front-line customer ser-vice are provided through contracts with Keolis and Transdev.
EXECUTIVE BOARD
EXECUTIVE DIRECTOR
DEPUTYEXECUTIVE DIRECTOR
DIRECTOR OFMARKETING AND COMMUNICATIONS
DIRECTOR OFGOVERNMENT RELATIONS
DIRECTOR OFFACILITIES
DIRECTOR OFPLANNING
DIRECTOR OF CUSTOMER SERVICE AND OPERATIONS
DIRECTOR OFVEHICLE MAINTENANCE TECHNOLOGY
DIRECTOR OFPOLICY AND STRATEGIC SOURCING
DIRECTOR OFINFORMATION TECHNOLOGY
DIRECTOR OFFINANCE AND TREASURER
ARCADIA CONTRACTOR
POMONA CONTRACTOR
CUSTOMER SERVICE AND FACILITIES CONTRACTOR
DIRECTOR OF MAINTENANCE AND VEHICLE TECHNOLOGY
Organization StructureGeneral membership in the Foothill Transit Joint Powers Authority includes one city council member and one alternate from each of the 22 cities in the Foothill Transit service area and three appointed representatives for the County of Los Angeles.
A five-member Executive Board governs Foothill Transit: four elected officials representing four clusters of cities, and the fifth member is elected by the Los Angeles County representatives (Cluster Five).
The Board directs policy that is implemented by a directly employed administrative staff. On-street operations and front-line customer service are provided through contracts with Keolis Transit Services and Transdev.

16 | BUSINESS PLAN AND BUDGET FY2017-2018 BUSINESS PLAN AND BUDGET FY2017-2018 | 17
Foothill Transit Fleet and Facilities
1400s57 currently in the fleetSeats 40CNG fueled
1500s10 currently in the fleetSeats 40CNG fueled
1600s30 currently in the fleetSeats 58CNG fueled
1700s30 currently in the fleetSeats 36CNG fueled
1800s12 currently in the fleetSeats 36CNG fueled
1900s14 currently in the fleetSeats 34CNG fueled
2000s30 currently in the fleetSeats 35100% battery-electric bus
2016 and 20172 currently in the fleetSeats 40100% battery-electric bus
2100s64 currently in the fleetSeats 37CNG fueled
2200s and 2300s60 currently in the fleet (30 each)Seats 38CNG fueled
2400s and 2500s60 currently in the fleet (30 each)Seats 35CNG fueled
West Covina Administrative Office100 S. Vincent Ave.Suite 200West Covina, CA
Arcadia Operations and Maintenance Facility5640 Peck Rd.Arcadia, CA
Pomona Operations and Maintenance Facility200 S. East End Ave.Pomona, CA

16 | BUSINESS PLAN AND BUDGET FY2017-2018 BUSINESS PLAN AND BUDGET FY2017-2018 | 17
Service Changes Proposed For the Next Three YearsThis section includes information on service changes planned for FY2017-2018 through FY2019-2020.
Comprehensive Operational Analysis Recommendations
Nelson\Nygaard, the consultants who completed the Comprehensive Operational Analysis (COA), provided initial service improvement recommendations. These were based on customer and non-rider surveys that looked at ridership, population density, and destinations in our service area such as schools and employment centers. Among the key areas of focus are the following: ensuring integration of Foothill Transit service with the Gold Line Foothill Extension; improving Commuter Express lines by rerouting or re-evaluating underutilized route segments; and implementing a uniform span of service and frequencies to lines serving areas around West Covina, El Monte, Pomona, and Puente Hills Mall to allow better travel throughout the region.
These regional service area enhancements focused on streamlining routes, creating more direct trips, and improving connectivity and transfers. Regional service enhancements also included reducing duplication of services and fulfilling unmet needs determined by customer surveys.
Following the Public Outreach process, the final recommendations will be presented for Governing Board approval. Service improvement recommendations approved by the Governing Board will begin implementation during FY2017-2018.
Line ProductivityAlong with service changes, staff will look at all lines and schedules to ensure the routes are efficient and productive. Our team will apply the newly adopted Planning Service Standards and recommend changes to improve productivity and bring lines closer to the adopted service standards. An example of possible changes may be the introduction of separate Saturday and Sunday schedules to ensure that appropriate levels of service are provided to customers.
Creation of Frequent Transit NetworkFrequent Transit Network routes are defined as Foothill Transit’s highest ridership and most productive routes – this includes Lines 187, 190, 194, 280, 291, 486, 488, and Silver Streak. Each of these lines has the market potential to support higher levels of service due to the appropriate mix of population, employment density, and connections to other local and regional services. Together, these routes create a grid of North/South and East/West connections that traverse the Foothill Transit service area along its most heavily travelled corridors. Market research has shown that 15 minute service offers enough convenience so that customers no longer need a schedule to plan their trips, thereby attracting more choice riders to the system.
One of the keys to success of a Frequent Transit Network is that customers can rely on a consistent high level of service. Current plans include implementation of frequent transit networks in other key corridors.

18 | BUSINESS PLAN AND BUDGET FY2017-2018 BUSINESS PLAN AND BUDGET FY2017-2018 | 19
Major Capital Projects Planned For the Next Three YearsThis section includes information on capital projects for FY2017-2018, FY2018-2019, and FY2019-2020
CAD/AVL System Replacement
The process of replacing the outdated system began in FY2015-2016 and will involve outfitting the entire bus fleet with updated data tracking and customer information equipment, as well as replacement of the equipment located at both operations and maintenance facilities and the administrative offices. This project will be completed in 2018.
Bus Replacement
In three fiscal years (FY2017-2018 through FY2019-2020), Foothill Transit will continue to replace the oldest coaches in its fleet. The 1400 and 1500 series of buses, which were purchased in 2004 and 2006 respectively, will be over 12 years and have accumulated more than 500,000 miles in service when they are replaced by new compressed natural gas (CNG) and electric buses.
Bus Fleet Heavy Maintenance
As the fleet accumulates in-service miles of at least 250,000 – 300,000 miles, the buses will undergo heavy maintenance that includes a re-powering to provide more efficient and cost effective service. The heavy maintenance program will mitigate mechanical bus failures, improve on-time performance and reduce customer complaints. Approximately 60 buses will undergo heavy maintenance over two fiscal years, FY2017-2018 and FY2018-2019.
Arcadia Electric Charging Station
In FY2017-2018, new electric buses will be deployed, operating out of the Arcadia Operations and Maintenance Facility. As part of this deployment, a set of electric bus chargers for 14 buses will be installed in Arcadia. The chargers will be installed by October 2017, in conjunction with the delivery of the electric buses. The chargers will be the on-the-ground “plug-in” type. Foothill Transit is considering another system to charge buses on a large scale related to the 2030 all-electric initiative.
Facility Rehabilitation, Repair and Maintenance
Hydraulic In-Ground Lifts Rehabilitation:
The in-ground lifts at the Pomona and Arcadia Operations and Maintenance facilities have not been in service for several years due to concerns regarding the weight of the new fleet of buses and the current capacity of the lifts. The twelve hydraulic lifts will be inspected in FY2016-2017 and are planned for rehabilitation to restore them to service at both facilities in FY2017-2018 through FY2019-2020.

18 | BUSINESS PLAN AND BUDGET FY2017-2018 BUSINESS PLAN AND BUDGET FY2017-2018 | 19
Facility Rehabilitation, Repair and Maintenance (continued)
Arcadia HVAC and Roof Replacement:
Replacement of the HVAC equipment and asphalt roofing of the 13 year-old Arcadia facility is scheduled in FY2017-2018.
Operations and Maintenance Facility Floor Coating and Exterior Floor Scrubbers:
New protective floor coating will be applied to the maintenance building areas and floor scrubbers will be procured for exterior concrete cleaning at both Pomona and Arcadia Operations and Maintenance Facilities.
Arcadia Compressed Natural Gas (CNG) Compressor Replacement:
The existing CNG compressors at Arcadia, installed in 2005, require continued maintenance due to aging equipment and replacement parts that require custom fabrication on various parts. In order to maintain reliable service, two additional compressors are required to supplement the original compressors. The installation includes upgrades to the priority panel and switchgear for integration with existing compressors.
Pomona Emergency Gas Generator Replacement:
The existing emergency gas generator is original to the Pomona Operations and Maintenance facility built in 1997. Since then, the Southern California Air Quality Management District has introduced new air quality mitigation measures that regulate gas generator emissions especially in proximity to schools. As such, Foothill Transit will replace the existing gas generator with a new compliant emergency generator.
Park & Rides
Covina Transit Center and Park & Ride
A transit oriented, mixed-use development (TOD) project, located at the former K-mart retail store in the City of Covina, is in design. The parking structure will be three levels that feature approximately 372 spaces including upper deck parking and solar canopies on the upper level. The transit center will have five bus bays and a layover area, including provisions for an electric bus charging station. A retail building adjacent to the parking structure will be built to provide high consumer traffic and increased visibility for our transit center.
West Covina Transit Center
West Covina is at the core of Foothill Transit’s service area. In particular, West Covina Parkway on the south side of West Covina Plaza is a major transit corridor with multiple local and commuter express lines serving the corridor. Bus stop amenities along West Covina Parkway are inadequate and parking for Foothill Transit riders is needed. Due to condition of existing transit amenities, ridership volumes and corresponding parking demand generated in the area, Foothill Transit is in discussions with the City of West Covina on possible improvements to include a transit center facility along West Covina Parkway. A shared use parking facility with the mall owners at Plaza West Covina and the City of West Covina will be discussed as part of the transit center development.

This page is intentionally left blank.

FY2016-2017 SUMMARY OF ACTIVITIES

22 | BUSINESS PLAN AND BUDGET FY2017-2018 BUSINESS PLAN AND BUDGET FY2017-2018 | 23
Overall System Statistics
Passenger Boardings
Vehicle Service Hours
Fare Revenue
Operating Expense
14,849,171
881,868
$19,500,000
$92,748,920
13,585,262
873,598
$16,151,831
$89,331,220
Overall System Performance
FY2015-2016 Actual
FY2016-2017Target
FY2016-2017 Estimate
13,584,135
799,177
$17,144,739
$75,446,753
AnalysisPassenger Boardings and Fare Revenue
The FY2016-2017 ridership estimate is the same as the FY2015-2016 actual passenger boardings. Foothill Transit is projected to receive $16,151,831 in fare revenue in FY2016-2017, which amounts to a year-to-year decrease of 5.8 percent when compared to the FY2015-2016 actual. This unusual occurrence of constant ridership and decreasing revenues is due to a combination of factors:
Foothill Transit continues to investigate strategies to address declining ridership with the goal of increasing ridership.
Vehicle Service Hours and Operating Expenses
In FY2016-2017, service hours increased 9.3 percent compared to FY2015-2016. This is the result of the addition of Lines 190, 194, and 270, increased service on lines connecting to the Gold Line Foothill Extension, and schedule adjustments to address increased traffic levels and improve on-time performance. Operating expenses in FY2016-2017 are projected to be $89.3 million which is within the budget of $92.7 million.
• Foothill Transit gained approximately six percent new riders with the assumption of Lines 190, 194, and 270;
• Foothill Transit honored Metro fares on these three lines for the entire fiscal year as part of the agreement which impacted Foothill Transit fare revenue; and
• With the exception of the new lines, Foothill Transit experienced a six percent decline in ridership. The decline in ridership is a regional and national trend due to continued economic recovery and an associated increase in personal car sales.

22 | BUSINESS PLAN AND BUDGET FY2017-2018 BUSINESS PLAN AND BUDGET FY2017-2018 | 23
AnalysisPreventable Accidents per 100,000 Miles
Foothill Transit is projected to end the year at 0.78 preventable accidents per 100,000 miles which is above the target of 0.70 preventable accidents per 100,000 miles. The target of 0.70 is well below industry standards for preventable accidents. While there was an increase in preventable accidents in December, performance has shown measurable improvement in recent months. The operations and maintenance contractors have heightened their emphasis on safe driving habits by focusing on specific routes and locations in the service area that have historically shown more frequent accidents.
Schedule Adherence
Throughout FY2016-2017, several large-scale infrastructure projects are under construction throughout the Foothill Transit service area, impacting travel time and schedule adherence. The most significant of these occurs along Interstate 10, which travels through the heart of the Foothill Transit system and is a primary connection to downtown Los Angeles. Projected on-time performance for FY2016-2017 is 82.9%, which is just below the target of 83% and is less than one percent below the previous fiscal year.
Operate a Safe Transit System
Provide Outstanding Customer Service
Operate an Effective Transit System
Operate an Efficient Transit System
Preventable Accidents per 100,000 miles
Schedule Adherence
Miles Between Service Interruptions
Complaints per 100,000 Boardings
Boardings per Vehicle Service Hour
Average Weekday Boardings
Farebox Recovery Ratio
Average Cost per Vehicle Service Hour
0.90
83.2%
25,694
18.7
17.2
45,310
22.7%
$95.50
0.70
83.0%
20,000
16.0
16.8
49,638
21.0%
$105.17
0.78
82.9%
30,683
21.0
15.6
45,695
18.1%
$102.26
Goal Indicator FY2015-2016 Actual
FY2016-2017 Target
FY2016-2017 Estimate
Performance indicators are established annually based on projections of total vehicle service hours, ridership, revenues, and expenses. The estimated boardings per vehicle service hour, farebox recovery ratio and cost per vehicle service hour are derived directly from overall system statistics, while other indicators are estimated based on historical data and current events. Each indicator is discussed below.
Goals and Performance Standards

24 | BUSINESS PLAN AND BUDGET FY2017-2018 BUSINESS PLAN AND BUDGET FY2017-2018 | 25
Average Miles between Service Interruptions
In FY2016-2017, Foothill Transit averaged 30,683 miles between service interruptions, exceeding the performance target of 20,000 miles. This target was set to ensure that customers were served by a properly maintained transit vehicle fleet. The miles between service interruptions performance in FY2016-2017 represents a 19 percent improvement over FY2015-2016. This variance is primarily a result of the addition of 62 new buses to the fleet in FY2016-2017 which has led to a decrease in the overall number of mechanical road calls.
Complaints per 100,000 Boardings
In FY2016-2017, Foothill Transit received more comments and complaints than in previous years as a result of our efforts to engage customers through more channels, including social media. The agency is projected to receive 21 complaints per 100,000 boardings at the end of this current fiscal year, which is higher than the target of 16 complaints per 100,000 boardings.
Boardings per Service Hour
Boardings per service hour for FY2016-2017 is estimated at 15.6, which doesn’t meet the target of 16.8 and is 10 percent lower than the FY2015-2016 actual boardings. This is primarily a result of declining ridership as well as an increase in service hours.
Average Weekday Boardings
In FY2016-2017, Foothill Transit carried an estimated average of 45,695 boardings each weekday. This is a one percent increase from FY2015-2016 attributed to the assumption of Lines 190, 194, and 270.
Farebox Recovery Ratio
Farebox recovery ratio is one of the two indicators used to measure efficiency by evaluating total fare revenue as a percentage of total operating expenses. Due to a rise in operating costs and lower ridership, it is estimated that 18.1 percent of operating costs will be paid for directly by fare revenue in FY2016-2017. This doesn’t meet the target of 21 percent.
Average Cost per Vehicle Service Hour
The current fiscal year projected average cost per vehicle service hour of $102.26 is a three percent improvement from the targeted cost of $105.17.
Overall System Statistics (continued)

24 | BUSINESS PLAN AND BUDGET FY2017-2018 BUSINESS PLAN AND BUDGET FY2017-2018 | 25
Progress in Advancing FY2016-2017 InitiativesPomona Operations Contract Procurement
The current agreement for operation of transit services at Foothill Transit’s Pomona facility expires on June 30, 2017. A request for proposals was released on July 29, 2016, followed by a well-attended site visit and pre-proposal conference on August 8, 2016, where prospective proposers were given an overview of the project. Proposals were received on October, 15, 2016, and a contract award was made on March 24, 2017, to Keolis Transit Services, LLC.
Arcadia Operations Contract Start-up
The Arcadia Operations Contract start-up with Transdev is complete. All coach operators and service technicians were hired. The Foothill Transit and Transdev maintenance teams finalized the fleet inspection documentation and all facility inspections and turnover repairs were completed on schedule. A new phone system and supporting architecture is currently being installed to support the new contract.
Fleet Electrification
The in-depot fast charging station was completed at the Pomona Operations and Maintenance facility in October 2016. This will allow the 17 Proterra electric buses to charge at the Pomona facility before being deployed into service on Lines 291 and 285. Foothill Transit’s order of thirteen 40-foot Catalyst E2 extended-range buses will be built at Proterra’s City of Industry plant. These buses will have a nominal range of 251 miles per charge and will be delivered from June 2016 through October 2017. The new 40-foot Catalyst E2 buses will be deployed on Line 280, serving the Azusa Intermodal Transit Center where two charging stations will be built to provide opportunity charging. A working group has been created between Foothill Transit and Proterra to identify and complete action items and ensure the capability of electrifying the entire fleet by 2030.
CAD/AVL System Replacement
Foothill Transit’s Computer Aided Dispatch and Automated Vehicle Location (CAD/AVL) system replacement continues to progress. Foothill Transit teams and technical consultants from IBI Group have been working with Avail Technologies, the system provider, to complete the Final System Design Acceptance, Factory Acceptance Testing, additional equipment procurement, site testing, vehicle pilot fleet testing, training, and system adoption. The project timeline anticipates completion by April 2018.

26 | BUSINESS PLAN AND BUDGET FY2017-2018 BUSINESS PLAN AND BUDGET FY2017-2018 | 27
Covina Transit Center and Park & Ride
In January 2016, the City of Covina, Foothill Transit and private developer MLC Holdings, entered into a Non-Binding Memorandum of Understanding to collaborate on the development of a mixed use project in the City of Covina called Covina Forward project. Since then, Foothill Transit’s design team has developed a preliminary architectural and engineering design for the transit component which consists of a parking structure, bus bays, retail space, and provisions for an electric bus charging station.
The project team has participated in three study sessions: two with the Covina City Council, and one with the Covina Planning Commission and residents of Covina. On December 6, 2016, the second reading of the Zone Change ordinance related to the Covina Forward project was also approved by City Council.
In collaboration with the City’s environmental consultants, Foothill Transit finalized environmental documents to meet the federal National Environmental Policy Act (NEPA) under a Categorical Exclusion. In addition, after issuing a Request for Qualifications (RFQ) and a Request for Proposals (RFP) for Design-Build services early this year, design of the transit center and park & ride is anticipated to begin in the second quarter of 2017 and construction is scheduled to commence in September 2017.
Fare Restructuring
In December 2015, the Executive Board authorized award of a contract to Four Nines Technologies to evaluate Foothill Transit’s current fare structure, provide recommendations to restructure, and perform predictive modeling for potential fare changes.
The consultants have completed nearly all of the milestones for the project; Governing Board approval of the fare restructuring is anticipated in May 2017.
Mt. SAC Transit Center Development
The Memorandum of Understanding between Foothill Transit and Mt. SAC was presented as an informational item at Mt. SAC’s December Board of Trustees Meeting. Foothill Transit will be issuing a Request for Qualifications for architectural and engineering services to begin preliminary design of the Transit Center. In addition, further discussions are required with Mt. SAC staff and their environmental consultants to possibly incorporate the transit center component into the college’s existing Environmental Impact Report.
Progress in Advancing FY2016-2017 Initiatives (continued)

26 | BUSINESS PLAN AND BUDGET FY2017-2018 BUSINESS PLAN AND BUDGET FY2017-2018 | 27
Innovative Service Delivery
Foothill Transit has been included in the FTA Mobility on Demand (MOD) Sandbox Grant application submitted by Los Angeles Metro. Foothill Transit will partner with Metro in the creation of their MOD project. Additionally, our team is reviewing our system as a whole to identify areas and lines that may have the potential for implementation of an alternative service delivery mode.
Class Pass Program Expansion
The Class Pass pilot program at Citrus College launched during the Fall 2016 semester. Participation in the program has been higher than originally projected. The implementation of a TAP sticker is an exciting addition to this program. The TAP sticker will ensure that the Class Pass stays with the student because it will be affixed to the student ID card. The Class Pass programs at University of La Verne and Mt. SAC continue to be successful programs with strong campus favorability and ridership. Foothill Transit staff has participated in events and met with key administrative officials at Cal Poly. The Class Pass discussion is progressing towards Foothill Transit bus access in their future campus general plan.

This page is intentionally left blank.

This page is intentionally left blank.
FY2017-2018 INITIATIVES

30 | BUSINESS PLAN AND BUDGET FY2017-2018 BUSINESS PLAN AND BUDGET FY2017-2018 | 31
During FY2017-2018, Foothill Transit will continue to focus on the delivery of high quality transit service. The following table shows Foothill Transit‘s anticipated service delivery during the upcoming year. Performance targets for FY2017-2018 have been adjusted to take into account any operational changes and performance trends during the prior year.
AnalysisPassenger Boardings and Fare Revenue
Passenger boardings and fare revenue are projected to remain flat during FY2017-2018 when compared to the estimated results for FY2016-2017. The FY2016-2017 target was set prior to Foothill Transit being made aware of the fare agreement for Lines 190, 194 and 270. In addition, public transit ridership experienced declines both regionally and nationally. Foothill Transit will work to improve ridership during the next fiscal year.
Vehicle Service Hours and Operating Expenses
Service hours are projected to remain constant in FY2017-2018. Operating expenses are proposed to increase six percent to accommodate the award of a new contract at the Pomona Operations and Maintenance Facility.
Passenger Boardings
Vehicle Service Hours
Fare Revenue
Operating Expense
14,849,171
881,868
$19,500,000
$92,748,920
13,585,262
873,598
$16,151,831
$89,331,220
13,510,238
872,171
$17,421,825
$98,235,452
Overall System Performance
FY2016-2017 Target
FY2016-2017 Estimate
FY2017-2018 Target
Overall System Statistics

30 | BUSINESS PLAN AND BUDGET FY2017-2018 BUSINESS PLAN AND BUDGET FY2017-2018 | 31
The agency uses several performance indicators to evaluate Foothill Transit’s achievement of its annual established goals. These goals are based on projections of total vehicle service hours, ridership, revenues, and expenses. Each goal and its corresponding performance target are provided in the table below.
AnalysisPreventable Accidents per 100,000 Miles
Foothill Transit’s first priority is safety. The target for preventable accidents per 100,000 miles for FY2017-2018 has been set at 0.70. This rigorous target is set to ensure continued heightened focus on safety while acknowledging the increased traffic in the Los Angeles basin. It is important to note that preventable accidents include collisions with vehicles and fixed objects, as well as other types of preventable incidents, such as a customer falling onboard a bus or a side mirror hitting an overhanging tree.
Schedule Adherence
The target for schedule adherence is proposed to remain at 83 percent for FY2017-2018. Schedule adjustments for the commuter express routes, running time adjustments to local lines, and analysis of the agency’s CAD/AVL data have been implemented to improve the accuracy of on–time performance reporting and improve schedule adherence. Continued major construction along a number of travel corridors in the service area has made it extremely challenging to keep pace with the frequent schedule adjustments needed to match these areas impacted by construction.
Operate a Safe Transit System
Provide Outstanding Customer Service
Operate an Effective Transit System
Operate an Efficient Transit System
Preventable Accidents per 100,000 miles
Schedule Adherence
Miles Between Service Interruptions
Complaints per 100,000 Boardings
Boardings per Vehicle Service Hour
Average Weekday Boardings
Farebox Recovery Ratio
Average Cost per Vehicle Service Hour
.70
83.0%
20,000
16.0
16.8
49,638
21.0%
$105.17
.78
82.9%
30,683
21.0
15.6
45,695
18.1%
$102.26
Goal Indicator FY2016-2017 Target
FY2016-2017 Estimate
.70
83.0%
20,000
20.0
15.5
45,034
17.7%
$112.63
FY2017-2018 Target
FY2017-2018 Goals and Targets
32 | BUSINESS PLAN AND BUDGET FY2017-2018 BUSINESS PLAN AND BUDGET FY2017-2018 | 33
Average Miles between Service Interruptions
The target for average miles between mechanical service interruptions is proposed to remain at 20,000 miles for FY2017-2018. Foothill Transit continues to receive new coaches that reduce the overall age of the fleet. This is expected to reduce the number of mechanical service interruptions.
Complaints per 100,000 Boardings
The target for FY2017-2018 is proposed to increase to 20 complaints per 100,000 boardings. The customer comment intake and handling process continues to improve which has increased the number of channels through which customers may provide feedback to Foothill Transit. The agency will continue to face challenges with continued construction that is planned throughout the service area, as well as the proposed service changes and fare restructuring that may affect this metric.
Boardings per Service Hour
The FY2017-2018 boardings per service hour target will decrease slightly to 15.5. This target anticipates that ridership will remain constant. Service adjustments proposed for next year are targeted at improving ridership by addressing increased traffic, customer wait times between trips, and connections to the Metro Gold Line.
Average Weekday Boardings
Weekday boardings are projected to decrease in the upcoming year, with a new proposed target of 45,034 average weekday boardings.
Farebox Recovery Ratio
The FY2017-2018 farebox recovery ratio of 17.7 percent is a direct ratio between budgeted fare revenues and operating expenses projected for the year. The target takes into account recent ridership loss and the projected increase in operating expenses for the new contract at Pomona, as well as agreed upon contractual increases with contractors.
Average Cost per Vehicle Service Hour
The FY2017-2018 average cost per vehicle service hour target of $112.63 is a direct ratio between overall operating expenses and planned service hours during the year. This figure is a seven percent increase compared to the FY2016-2017 target.
FY2017-2018 Goals and Targets

32 | BUSINESS PLAN AND BUDGET FY2017-2018 BUSINESS PLAN AND BUDGET FY2017-2018 | 33
Pomona Operations Contract Start-up
Procurement activities for a new operations and maintenance contract at the Foothill Transit operations and maintenance facility in Pomona recently concluded. Following the proposal evaluation process, a recommendation to award the contract to Keolis Transit Services, LLC, was presented to the Executive Board on March 24, 2017. The new contract goes into effect on July 1, 2017, and will incorporate a number of changes to the management of that operating agreement. Among these changes is a modification to the invoicing methodology that takes into account fixed costs as well as hours-based and miles-based costs incurred by the contractor. Contract start-up activities will include a thorough inspection and any needed contract turnover repairs of the fleet and facility in the months leading up to and following the contract start-up. Numerous contract close out activities for the current transit operations and maintenance contract will be completed in the months following the contract transition.
Fleet Electrification
In 2010, Foothill Transit became the first transit agency in the nation to implement fast-charge, electric buses into normal transit operations. Our electric bus program has continued to develop as we gained insight from our experience operating our 17-bus electric fleet. With advancements in battery technology and the growing number of electric bus manufacturers, it is now feasible to pursue full electrification of the Foothill Transit fleet. As older CNG buses are retired and the necessary electric charging infrastructure is put in place at both operations and maintenance facilities, retired CNG coaches will be replaced by battery-electric buses. Based on current fleet retirement schedules, Foothill Transit will pursue operation of a fully electric fleet by 2030.
Legislative Advocacy
This year will bring new challenges and opportunities at the federal and state government levels. Foothill Transit will focus on building relationships with the new Administration including key staff for the Department of Transportation and Federal Transit Administration, newly elected U.S. Senator Kamala Harris and her staff, and new staff for key House and Senate committees. We will also strengthen relationships we have built with members of our House Delegation, U.S. Senator Dianne Feinstein and staff, and returning staff for key House and Senate Committees. This relationship building and maintenance strategy will also continue to be the focus of our efforts with our state delegation in Sacramento.
CAD/AVL System Replacement
System design is currently underway for a new state-of-the-art system to replace Foothill Transit’s aging Computer Aided Dispatch and Automated Vehicle Location (CAD/AVL) system. The new system will include enhancements to better monitor on-street service in real time, while providing more accurate data for use by our customers for their daily travel and by agency staff for system planning and reporting purposes. Pilot fleet deployment of the new CAD/AVL system, final system design, and complete fleet system deployment will be completed in the upcoming fiscal year.
Major Initiatives FY2017-2018FY2017-2018 Goals and Targets

34 | BUSINESS PLAN AND BUDGET FY2017-2018 BUSINESS PLAN AND BUDGET FY2017-2018 | 35
Covina Transit Center and Park & Ride Development
Development of the Covina Park & Ride continues to be a priority this year. The project is a partnership between the City of Covina, a private developer and Foothill Transit. The City of Covina is the lead for the three-party Agreement. The project involves the redevelopment of the project site with a City component to include an event center and professional office space, residential, and transit component. The park & ride will consist of a three-level parking structure containing approximately 380 parking spaces, bus berths, and electric bus charging stations to accommodate Foothill Transit buses. A transit oriented retail component will also be included within the transit center element.
Fare Restructuring Implementation
Implementation of the fare restructuring includes extensive marketing and communications to advise the public of fare changes, training coach operators, and technical software changes to the farebox system. Implementation of the fare restructuring will occur concurrently with the Fall 2017 service changes.
Service Enhancements
The success of the Gold Line Foothill Extension presents opportunities to restructure a number of Foothill Transit lines to provide a more seamless integration with the rail line by connecting bus service to the eastern terminus of the rail line and north-south bus service that provides enhanced customer access to and from the Gold Line. A number of service enhancements will be implemented during the coming fiscal year to continue advancing this effort. Enhancements that ensure system productivity and efficiency will also be implemented.
Mt. SAC Transit Center Development
With the success of the Class Pass program at Mt. SAC, the development of a transit center on campus continues to move forward. Mt. SAC is one of the largest trip generators in the Foothill Transit system and has a limited number of bus stops. Foothill Transit was awarded a federal grant for the construction of this transit center. The development of this facility is under way and includes ten transit bays with covered bus shelters for customers.
Major Initiatives FY2017-2018

34 | BUSINESS PLAN AND BUDGET FY2017-2018 BUSINESS PLAN AND BUDGET FY2017-2018 | 35
Innovative Service Delivery
Transportation Network Companies (TNCs) such as Uber, Lyft, and others have become more prevalent within the Foothill Transit service area and throughout the nation. As such, it is prudent for Foothill Transit to investigate and pursue strategies to integrate seamless connections of the mass transit service we provide with the services provided by TNCs. In the coming year, staff will work within the framework of the Federal Transit Administration’s (FTA) guidelines to implement innovative approaches to partnering with TNCs. The goal of this project is to deliver service not only to our current customers, but also to those customers who could use the services of a TNC to provide critical first-mile and last-mile trip connections.
Staff will also explore a pilot opportunity this year to assume operation of the transit service provided in one of our member cities while expanding the implementation of our electric bus fleet in that transit operation.
Class Pass Program Expansion
Based on the successful launch and adoption of the Class Pass programs at Mt. SAC and University of La Verne, and the successful launch of a pilot program on the campus of Citrus College, Foothill Transit will continue to pursue Class Pass programs with other major colleges and universities throughout the San Gabriel and Pomona Valleys.

This page is intentionally left blank.

FUNDING SOURCES
This page is intentionally left blank.

38 | BUSINESS PLAN AND BUDGET FY2017-2018 BUSINESS PLAN AND BUDGET FY2017-2018 | 39
Foothill Transit is funded with state and local sales tax funds, federal transportation funds, and farebox revenues.
The majority of funds are transportation subsidies allocated by the Regional Transportation Planning entity (LA Metro) to Los Angeles County fixed-route transit operators through the Formula Allocation Procedure (FAP) and the Capital Allocation Procedure (CAP). FAP uses vehicle service miles and passenger revenues to apportion the available revenues into percentage shares. CAP uses total vehicle miles and active fleet size (National Transportation Database data) to apportion the shares. The sources of funds are as follows:
State ResourcesTransportation Development Act (TDA) Article 4
TDA is a statewide one-quarter cent sales tax that is deposited into the State Local Transportation Fund. TDA funds are eligible for capital and operating uses.
State Transit Assistance Funds (STA)
STA is a statewide excise tax on fuel and are eligible for use on transit capital and operating expenses.
Low Carbon Transit Operations Program (LCTOP)
LCTOP is funded by auction proceeds from the California Air Resource Board’s (ARB) Cap-and-Trade Program and deposited into the Greenhouse Gas Reduction Fund (GGRF). This program is a component of the State of California budget (by Senate Bill 852 and Senate Bill 862) with a goal of reducing greenhouse gas emissions. These funds are eligible for capital projects which reduce greenhouse emissions.
Transit and Intercity Rail Capital Program (TIRCP)
TIRCP was created by Senate Bill 862 (Chapter 36, Statutes of 2014) and modified by Senate Bill 9 (Chapter 710, Statutes of 2015) to provide grants from the Greenhouse Gas Reduction Fund to fund transformative capital improvements that will modernize California’s intercity, commuter and urban rail systems, and bus and ferry transit systems to reduce emissions of greenhouse gases by reducing congestion and vehicle miles travelled throughout California.
Public Transportation Modernization Improvement and Service Enhancement Account (PTMISEA)
PTMISEA (also known as Prop. 1B) is a ten-year statewide general obligation bond eligible for use on transit capital.
Funding Sources

38 | BUSINESS PLAN AND BUDGET FY2017-2018 BUSINESS PLAN AND BUDGET FY2017-2018 | 39
State Resources (continued)Carl Moyer Memorial Air Quality Standards Attainment Program (Carl Moyer Program)
The Carl Moyer Program is funded through tire fees and smog impact vehicle registration fees. It reduces air pollution from vehicles and equipment by providing incentive funds to purchase cleaner than legally required engines, equipment, and emission reduction technologies. It also achieves reductions in emissions of key pollutants which are necessary for California to meet its clean air commitments under regulatory requirements.
Los Angeles County Resources Proposition A 40% Sales Tax Funds
Proposition A is a 1980 voter approved one-half cent Los Angeles county local sales tax ordinance. These funds may be used for bus operations or capital. This source also funds the Prop A Bus Service Continuation Program (BSCP).
Proposition C 40% Discretionary Sales Tax Funds
Proposition C is a 1990 voter approved one-half cent Los Angeles County sales tax ordinance. The funds are allocated to the regional transit operators through the following LA Metro Board adopted programs: 1) Municipal Operator Service Improvement Program (MOSIP); 2) Bus System Improvement Plan Overcrowding Relief on Lines 480/481 and 707; 3) Transit Service Expansion on Line 690; 4) Base Restructuring on Lines 497/498 and local Saturday service on various lines; and, 5) Prop 1B Bridge funding eligible for public transportation modernization improvements, service enhancements, and security expenditures. The Prop C 40% funds are eligible for operations and transit capital.
Proposition C 5% Transit Security
These funds are specifically intended to improve transit security. They are distributed to county transit operators based on total unlinked passenger trips.
Measure R 20% Bus Operations
Measure R is a 2008 voter approved Los Angeles County sales tax ordinance. These funds are eligible for bus operating and capital expenses.
Measure M 20% Bus Operations
Measure M is a 2016 voter approved Los Angeles County sales tax ordinance. These funds are eligible for bus operating and capital expenses.
Metro ExpressLanes Net Toll Revenue Reinvestment Grant Program
Metro ExpressLanes Net Toll Revenue Reinvestment Grant Program is funded by toll revenues collected from the use of the ExpressLanes on the I-10 and I-110 corridors. Grant funds are invested in projects/programs that provide direct mobility benefits to the I-10 and I-110 ExpressLanes within a three-mile radius. The primary objective of the Net Toll Revenue Program is to increase mobility and person throughput via implementation of integrated strategies that enhance transit operations, transportation demand management, transportation systems management, active transportation, and capital investments in the 1-10 and 1-110 corridors.

40 | BUSINESS PLAN AND BUDGET FY2017-2018
Funding Sources (continued)
Federal ResourcesFederal Urban Area Formula Program (Section 5307)
These funds are allocated by the Federal Transit Administration to Los Angeles County transit operators based on a capital allocation formula consisting of total vehicle miles, number of vehicles, unlinked boardings, passenger revenue and base fare. They are used for capital procurements or preventive maintenance expenditures. These funds require a 20 percent local match.
Federal Buses and Bus Facilities and Low-or No-Emission Program (Section 5339)
The Grants for Buses and Bus Facilities program (49 U.S.C. 5339) makes federal resources available to States and direct recipients to replace, rehabilitate and purchase buses and related equipment and to construct bus-related facilities including technological changes or innovations to modify low or no emission vehicles or facilities. Funding is provided through formula allocations and competitive grants. A sub-program, the Low- or No-Emission Vehicle Program, provides competitive grants for bus and bus facility projects that support low and zero-emission vehicles.
Federal State of Good Repair Program (Section 5337)
State of Good Repair funds must be used either to maintain system infrastructure for buses or rail operating on exclusive transportation right-of-way or to maintain buses operating on lanes not fully reserved for public transportation. These funds are allocated through the CAP. They are capital funds used to maintain, replace and rehabilitate vehicles and transportation equipment. They require 20 percent local match.
Federal Congestion Mitigation and Air Quality (CMAQ)
These funds are programmed for cost-effective emission reduction activities and congestion mitigation projects that provide air quality benefits. They require 20 percent local match.
Non-Subsidy ResourcesAuxiliary Revenue
Foothill Transit operates a park and ride shuttle service for the Rose Bowl and a Dial-a-Ride shuttle service for the City of Monrovia. These special services revenues are used for operating the special services.

BUSINESS PLAN AND BUDGET FY2017/2018 | 41BUDGET SUMMARY

42 | BUSINESS PLAN AND BUDGET FY2017-2018 BUSINESS PLAN AND BUDGET FY2017-2018 | 43
FY2017-2018 Budgeted Revenues
Operating Subsidies - 50%Capital Reserve - 24%
Grants Reimbursements - 14%Farebox - 11%
Special Service/ Property Management - 1%
Funding AssumptionsOperating subsidies and revenues increase to match operating expenses
Farebox revenues reflect ridership trends and complete transition of Lines 190, 194, and 270Continue to seek federal, state and local funding to help finance operations and capital projectsProposed operating subsidies consist of local sales tax funds (Prop A and C, Measures R and M), and state and federal resources, such as TDA4
Farebox
Operating Subsidies
Property Management
Special Service Income
Total Operating and Other Revenues
$19,500,000
73,248,920
400,000
1,075,000
$ 94,223,920
$17,421,825
80,813,627
445,000
1,175,000
$ 99,855,452
FY2017-2018 Budgeted Revenues
FY2016-2017 Budget
FY2017-2018 Budget
Operating & Other Revenues
Grants Reimbursements
Capital Reserve
Total Capital Revenues
Total Budgeted Revenues
$27,775,991
28,351,120
$ 56,127,111
$ 150,351,031
$22,348,309
38,723,401
$ 61,071,710
$ 160,927,162
Capital Revenues24%
11%
50%
1%
14%
Budgeted Revenues

42 | BUSINESS PLAN AND BUDGET FY2017-2018 BUSINESS PLAN AND BUDGET FY2017-2018 | 43
FY2017-2018 Budgeted Expenditures
Transit Operating Expenses - 61%Existing Capital Programs - 34%
New Capital Programs - 4%Non-Operating Expenses - 01%
Expenditure AssumptionsIncrease operating expenditures by six percent over prior year budget
Vehicle service hours and vehicle service miles remain constant
Initiate fleet replacements for 20 CNG buses
Complete heavy maintenance on 30 CNG buses
Continue work on Covina Transit Center and Park & Ride
Complete installation of new CAD/AVL System
Transit Operating Expenses
Non-Operating Expenses
Total Operations
$92,748,920
1,475,000
$ 94,223,920
$98,235,452
1,620,000
$ 99,855,452
Operating
New Capital Programs
Existing Capital Programs
Total Capital
Total BudgetedExpenditures
$27,775,991
28,351,120
$56,127,111
$150,351,031
$5,785,000
55,286,710
$61,071,710
$160,927,162
Capital61%
1%
FY2017-2018 Budgeted Expenditures
FY2016-2017 Budget
FY2017-2018 Budget
34%
Budgeted Expenditures
4%

44 | BUSINESS PLAN AND BUDGET FY2017-2018 BUSINESS PLAN AND BUDGET FY2017-2018 | 45
Customer Service & Ops.
Maintenance & Veh. Tech.
Marketing & Communication
Information Technology
Administration
Policy and Strategic Sourcing
Finance
Planning
Facilities
Total Operating Expenses
$79,968,120
878,940
2,139,890
2,263,240
3,264,090
848,300
1,236,250
975,450
1,174,640
$ 92,748,920
$84,568,242
898,870
2,257,050
2,395,030
2,891,150
931,800
1,779,240
1,297,750
1,216,320
$ 98,235,452
Summary By Department
FY2016-2017 Budget
FY2017-2018 Budget
Operating Expenses
Property Management
Special Services
Dial-A-Ride
Total Non-Operating Expenses
Total Operations
$400,000
325,000
750,000
$ 1,475,000
$ 94,223,920
$445,000
375,000
800,000
$ 1,620,000
$ 99,855,452
Non-Operating Expenses
FY2017-2018 Operating Expenses
Customer Service & Ops. - 85%Other Departments - 14%
Non-Operating Expenses - 1%
85%
14%
1%
Operating Expenses

44 | BUSINESS PLAN AND BUDGET FY2017-2018 BUSINESS PLAN AND BUDGET FY2017-2018 | 45
Bus/Fleet Management
Facilities Construction/Maintenance
Information Technology
Total New Capital Programs
$23,134,560
3,188,000
1,453,431
$ 27,775,991
$4,000,000
865,000
920,000
$ 5,785,000
Summary ByCategory
FY2016-2017 Budget
FY2017-2018 Budget
New Capital Programs
Bus/Fleet Management
Facilities Construction/Maintenance
Information Technology
Total Existing Capital Programs
Total Capital
$2,930,778
14,415,062
11,005,280
$ 28,351,120
$ 56,127,111
$29,774,508
14,545,759
10,966,443
$ 55,286,710
$ 61,071,710
Existing Capital Programs
FY2017-2018 New/Existing Capital Expenditures
Bus/Fleet Mgmt. - 55%Facilities Const./Maint. - 25%
Information Technology - 20%
55%
25%
20%
Capital Expenditures

This page is intentionally left blank.

This page is intentionally left blank.
CAPITAL BUDGET
48 | BUSINESS PLAN AND BUDGET FY2017-2018 BUSINESS PLAN AND BUDGET FY2017-2018 | 49
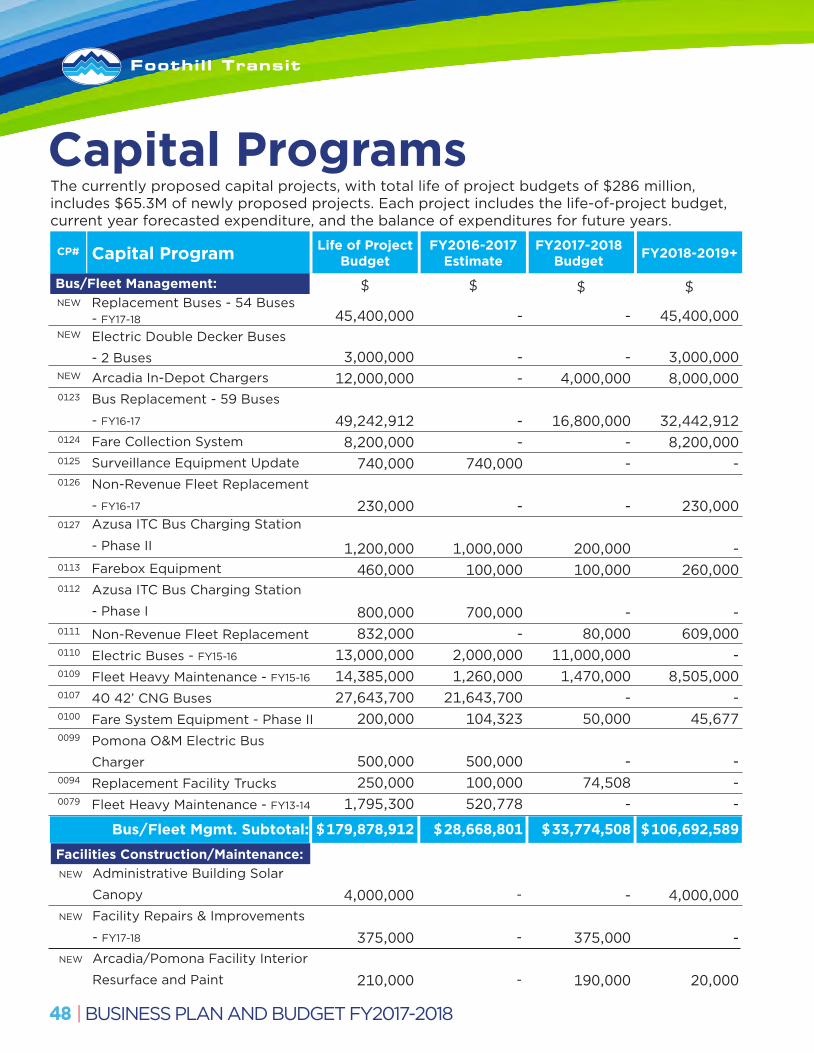
The currently proposed capital projects, with total life of project budgets of $286 million, includes $65.3M of newly proposed projects. Each project includes the life-of-project budget, current year forecasted expenditure, and the balance of expenditures for future years.
Capital Program
NEW
NEW
NEW
0123
0124
0125
0126
0127
0113
0112
0111
0110
0109
0107
0100
0099
0094
0079
Bus/Fleet Management:
Life of Project Budget
FY2016-2017 Estimate
FY2017-2018 Budget FY2018-2019+CP#
$ $ $ $
45,400,000
3,000,00012,000,000
49,242,9128,200,000
740,000
230,000
1,200,000460,000
800,000832,000
13,000,00014,385,00027,643,700
200,000
500,000250,000
1,795,300
$ 179,878,912
-
--
--
740,000
-
1,000,000100,000
700,000-
2,000,0001,260,000
21,643,700104,323
500,000100,000520,778
$ 28,668,801
-
-4,000,000
16,800,000--
-
200,000100,000
-80,000
11,000,0001,470,000
-50,000
-74,508
-
$ 33,774,508
45,400,000
3,000,0008,000,000
32,442,9128,200,000
-
230,000
-260,000
-609,000
-8,505,000
-45,677
---
$ 106,692,589
Replacement Buses - 54 Buses - FY17-18
Electric Double Decker Buses
- 2 BusesArcadia In-Depot Chargers
Bus Replacement - 59 Buses
- FY16-17
Fare Collection System
Surveillance Equipment Update
Non-Revenue Fleet Replacement
- FY16-17
Azusa ITC Bus Charging Station
- Phase II
Farebox Equipment
Azusa ITC Bus Charging Station
- Phase I
Non-Revenue Fleet Replacement
Electric Buses - FY15-16
Fleet Heavy Maintenance - FY15-16
40 42’ CNG Buses
Fare System Equipment - Phase II
Pomona O&M Electric Bus
Charger
Replacement Facility Trucks
Fleet Heavy Maintenance - FY13-14
Bus/Fleet Mgmt. Subtotal:
Administrative Building Solar
Canopy
Facility Repairs & Improvements
- FY17-18
Arcadia/Pomona Facility Interior
Resurface and Paint
4,000,000
375,000
210,000
-
-
-
-
375,000
190,000
NEW
NEW
NEW
Facilities Construction/Maintenance:
4,000,000
-
20,000
Capital Programs

48 | BUSINESS PLAN AND BUDGET FY2017-2018 BUSINESS PLAN AND BUDGET FY2017-2018 | 49
Facilities Construction/Maintenance:Arcadia Overflow Parking
Admin Bldg. Landscaping
Arcadia CNG Compressor
Replacement
Pomona Transit Store Renovation
Arcadia HVAC Replacement
BSEP - West Covina Bus Shelters
Admin EV Chargers
ESMS Operations Facilities
Improvements
Admin Building Stairwell Paint
Facility Repairs & Improvements
- FY16-17
Arcadia Forklift Replacement
Admin Building Electrical Panel
Covina Park & Ride and Transit
Center
West Covina Transit Store, Plaza
and Transitway
Office Furniture & Equipment
- FY15-16
Arcadia Roof Replacement
Ops. Facilities Floor Coating
and Equipment
Admin Building 2nd Floor
Remodel
Mt. SAC Transit Store & Center
Hydraulic Lift Replacement
Office Furniture/Equipment - FY14-15
Facility Repairs & Improvements
- FY14-15
Facility Maintenance & Upgrades
Transit Store Security System
250,00050,000
1,800,000800,000370,000260,000103,000
90,00060,000
60,00030,00015,000
28,495,511
15,079,000
60,00068,300
333,500
796,0009,750,0002,600,000
60,000
400,000250,000663,460
--
1,800,000400,000100,000260,000103,000
-40,000
60,00030,00015,000
7,256,620
-
30,00038,300
100,000
-325,00050,000
-
295,975100,000363,460
250,00050,000
-200,000270,000
--
90,00020,000
---
10,869,875
250,000
30,00030,000
143,500
-1,300,000
600,00022,384
50,000150,000300,000
--
-200,000
---
--
---
10,369,016
14,829,000
--
90,000
796,0008,125,0001,937,472
-
---
NEW
NEW
0128
0129
0130
0131
0132
0133
0134
0135
0136
0137
0138
0139
0119
0118
0117
0116
0115
0098
0095
0093
0091
0083
Life of Project Budget
FY2016-2017 Estimate
FY2017-2018Budget FY2018-2019+Capital ProgramCP#
$ $ $ $
Capital Programs (continued)
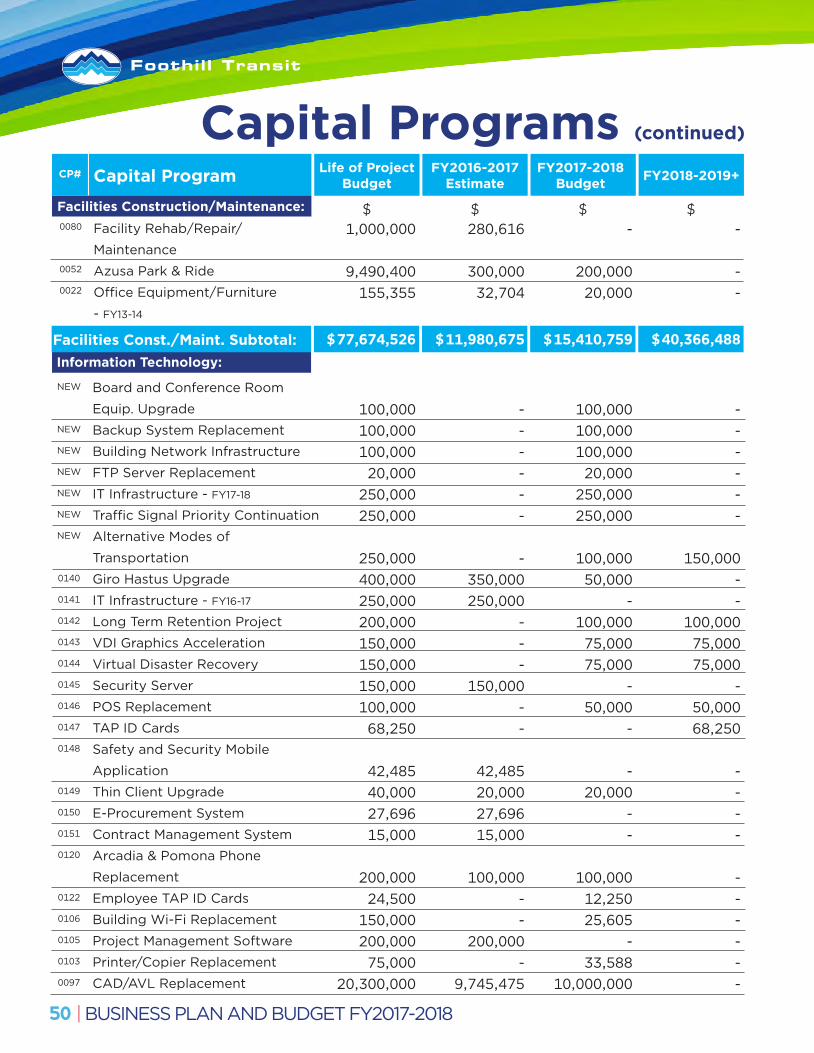
50 | BUSINESS PLAN AND BUDGET FY2017-2018 BUSINESS PLAN AND BUDGET FY2017-2018 | 51
Board and Conference Room
Equip. Upgrade
Backup System Replacement
Building Network Infrastructure
FTP Server Replacement
IT Infrastructure - FY17-18
Traffic Signal Priority Continuation
Alternative Modes of
Transportation
Giro Hastus Upgrade
IT Infrastructure - FY16-17
Long Term Retention Project
VDI Graphics Acceleration
Virtual Disaster Recovery
Security Server
POS Replacement
TAP ID Cards
Safety and Security Mobile
Application
Thin Client Upgrade
E-Procurement System
Contract Management System
Arcadia & Pomona Phone
Replacement
Employee TAP ID Cards
Building Wi-Fi Replacement
Project Management Software
Printer/Copier Replacement
CAD/AVL Replacement
100,000100,000100,00020,000
250,000250,000
250,000400,000250,000200,000150,000150,000150,000100,00068,250
42,48540,00027,69615,000
200,00024,500
150,000200,00075,000
20,300,000
------
-350,000250,000
---
150,000--
42,48520,00027,69615,000
100,000--
200,000-
9,745,475
100,000100,000100,00020,000
250,000250,000
100,00050,000
-100,00075,00075,000
-50,000
-
-20,000
--
100,00012,25025,605
-33,588
10,000,000
NEW
NEW
NEW
NEW
NEW
NEW
NEW
0140
0141
0142
0143
0144
0145
0146
0147
0148
0149
0150
0151
0120
0122
0106
0105
0103
0097
------
150,000--
100,00075,00075,000
-50,00068,250
----
------
Information Technology:
Capital Program
0080
0052
0022
Facilities Construction/Maintenance:
Life of Project Budget
FY2016-2017 Estimate
FY2017-2018 Budget FY2018-2019+CP#
$ $ $ $1,000,000
9,490,400155,355
$ 77,674,526
280,616
300,00032,704
$ 11,980,675
-
200,00020,000
$ 15,410,759
-
--
$ 40,366,488
Facility Rehab/Repair/
Maintenance
Azusa Park & Ride
Office Equipment/Furniture
- FY13-14
Facilities Const./Maint. Subtotal:
Capital Programs (continued)

50 | BUSINESS PLAN AND BUDGET FY2017-2018 BUSINESS PLAN AND BUDGET FY2017-2018 | 51
Capital Program
0096
0058
0044
0042
0017
0014
0007
Information Technology:
Life of Project Budget
FY2016-2017 Estimate
FY2017-2018 Budget FY2018-2019+CP#
$ $ $ $
150,000
1,000,000
300,000600,000
1,500,000300,000600,000
$ 28,062,931
150,000
200,000
10,000100,000504,79651,41940,000
$ 11,956,871
-
200,000
25,000100,000
--
100,000
$ 11,886,443
-
277,946
40,000100,000
--
152,714
$ 1,088,910
Board Room Video System
Upgrade
Bus Stop Enhancement Program
(BSEP) - FY11-12
Document Imaging Equipment/
Software
Bus Stop Customer Information
Traffic Signal Priority
Financial Software
Executive Information System
Capital Projects Total: $ 285,616,369 $ 52,606,347 $ 61,071,710 $ 148,147,987
Information Technology Subtotal:
Capital Programs (continued)Capital Programs (continued)

This page is intentionally left blank.

This page is intentionally left blank.
OPERATING BUDGET

54 | BUSINESS PLAN AND BUDGET FY2017-2018 BUSINESS PLAN AND BUDGET FY2017-2018 | 55
Customer Service and Operations
Maintenance and Vehicle Technology
Marketing and Communications
Information Technology
Administration
Policy and Strategic Sourcing
Finance
Planning
Facilities
Total Transit Operating Expenses
Property Management
Special Service
Dial-A-Ride
Total Non-Operating Expenses
Foothill Transit’s operating budget and departmental initiatives for FY2017-2018 are presented in this section. A brief description of each department has been provided. A summary of all departments is shown below:
Non-Operating Expenses:
Total Expenses:
$84,568,242
898,870
2,257,050
2,395,030
2,891,150
931,800
1,779,240
1,297,750
1,216,320
98,235,452
$445,000
$375,000
$800,000
1,620,000
$ 99,855,452
Transit Operating Expenses:
FY2017-2018Budget
$76,616,120
878,940
2,092,876
2,367,740
2,794,090
848,300
1,235,850
875,450
1,174,640
88,884,006
FY2016-2017Estimate
$400,000
325,000
750,000
1,475,000
$ 90,359,006
$38,058,467
368,945
728,937
919,822
1,233,237
251,047
559,432
354,595
485,531
42,960,013
Actual Through
Dec. 2016
$206,227
180,502
342,456
729,185
$ 43,689,198
$79,968,120
878,940
2,139,890
2,263,240
3,264,090
848,300
1,236,250
975,450
1,174,640
92,748,920
FY2016-2017 Budget
$400,000
325,000
750,000
1,475,000
$ 94,223,920
Department Budgets and Summaries

54 | BUSINESS PLAN AND BUDGET FY2017-2018 BUSINESS PLAN AND BUDGET FY2017-2018 | 55
Customer Service and OperationsThe Customer Service and Operations department was established to effectively focus on key components of the agency’s mission. This department is responsible for ensuring the safe and efficient daily operation of Foothill Transit service, focusing specifically on applied enforcement of agency standards for operating performance.
The department also works closely with the four Foothill Transit stores to maintain and enhance the customer service experience; including providing itineraries for customers, answering questions about service, and collecting customer feedback. The safety of our customers, contractors, and staff is a primary focus of the Customer Service and Operations department and the team works directly with local, state, and national safety organizations in this effort.
DIRECTOR OF CUSTOMER SERVICE AND OPERATIONS
SAFETY COMPLIANCE MANAGER
RECEPTIONISTOPERATIONS CONTRACT MANAGER
CUSTOMER SERVICE AND OPERATIONS ASSISTANT
QUALITY ASSURANCE ANALYST
QUALITY ASSURANCE INSPECTOR (4)

56 | BUSINESS PLAN AND BUDGET FY2017-2018 BUSINESS PLAN AND BUDGET FY2017-2018 | 57
FY2016-2017 ACCOMPLISHMENTS:• Completed procurement of Pomona Operations & Maintenance Contract• Incorporated Lines 190, 194, 270 into Foothill Transit service• Completed system design, installation, and initial testing on new CAD/AVL System• Hosted Local and Regional Bus Roadeo• Supported radio replacement project• Continued coach operator audits• Implemented customer service audits• Obtained notice of compliance from FTA Drug and Alcohol Audit• Achieved safety and security presence with LA County Sheriff Department contract
execution• Provided premium Rose Bowl Special Service to more than 117,000 customers• Provided LA Marathon special shuttle service to approximately 2,000 runners• Continued participation in Transit Paratransit Certification Course• Continued participation in APTA Early Career Program Mentor Group• Coordinated CPR and Evacuation Chair training for Administrative Staff• Participated in various APTA committees• Elected to Southern California COMTO Board of Directors• Participated in various safety trainings
FY2017-2018 INITIATIVES:• Complete contract transition of Pomona Operations & Maintenance• Complete line transition between Pomona and Arcadia Operations and Maintenance
Facilities• Modify procedures as needed to respond to FTA’s new Safety Management System
requirements• Complete Quality Assurance Dispatch Education training• Host Transit Security table top exercise with TSA• Continue Front Line Customer Service Recognition program• Complete installation, testing, and implementation of CAD/AVL system replacement
Customer Service and Operations

56 | BUSINESS PLAN AND BUDGET FY2017-2018 BUSINESS PLAN AND BUDGET FY2017-2018 | 57
Purchased Transportation
Fuel
Electricity - Fuel
Salary, Wages & Benefits
Fringe Benefits
Contracted Services
Professional/Technical
Bus Roadeo
Dues and Subscriptions
Travel and Meeting
Uniform/Clothing Supplies
Transit Store Lease
Other Contracted Services
Office/General Supplies
Safety & Security
Utilities
$74,061,0306,341,376
469,196726,900286,900
1,752,76049,00071,2502,230
29,750304,900101,530189,820
1,000168,600
12,000
$ 84,568,242
FY2015-2016Actual
FY2016-2017Estimate
FY2017-2018Budget
$66,216,7906,605,000
260,000741,300306,700
1,609,55048,90075,000
2,25035,430
301,200153,600188,400
3,00057,00012,000
$ 76,616,120
$69,916,7906,300,000
260,000741,300306,700
1,571,55048,90075,0002,250
30,430301,200153,600188,400
3,00057,00012,000
$ 79,968,120
$56,166,3085,255,771
129,656768,936
-1,516,068
100,33347,9202,129
21,93533,57798,749
122,704187
47,6981,545
$ 64,313,516
Acct.Number
5001502050355100511051505260541154305550556057105720585059916100
FY2016-2017Budget
Account Name
• Account 5035 Electricity - Fuel increased due to the addition of 13 new electric busesoperating out of the Acadia Facility
• Account 5150 Contracted Services increased due to inclusion of contractual requirements• Account 5710 Transit Store Lease reduced because plans to move West Covina
Transit Store are delayed• Account 5991 Safety & Security increased because of a new contract with the Los
Angeles County Sheriff’s Department and includes APTA Safety Award Fees
Budget Notes:

58 | BUSINESS PLAN AND BUDGET FY2017-2018 BUSINESS PLAN AND BUDGET FY2017-2018 | 59
The Maintenance and Vehicle Technology (MVT) Department ensures daily operation of Foothill Transit’s revenue and non-revenue vehicle fleet through the systematic enforcement of Foothill Transit standards for fleet maintenance and oversight of maintenance on fueling and the electric bus charging stations. The MVT Department ensures ongoing local, state and federal regulatory compliance of the fleet and environmental compliance of the operations. In addition, the MVT department is responsible for the development and implementation of Foothill Transit’s alternative fuels program including the specification, in-plant inspection, and acceptance of all new rolling stock and technologies to maximize efficiencies in operations and maintenance. The MVT department participates and supports legislative efforts in the development of policies and regulations for transit fleet electrification.
Maintenance and VehicleTechnology
FLEET TECHNOLOGYCOORDINATOR
ELECTRIC BUS PROGRAM MANAGER
MECHANICAL SERVICE QUALITY INSPECTOR
FLEET MAINTENANCE COORDINATOR
DIRECTOR OF MAINTENANCE AND VEHICLE TECHNOLOGY

58 | BUSINESS PLAN AND BUDGET FY2017-2018 BUSINESS PLAN AND BUDGET FY2017-2018 | 59
FY2016-2017 ACCOMPLISHMENTS:• Procured 30 new 40 ft. CNG New Flyer Excelsior buses• Initiated procurement of thirteen 40 ft. Proterra Catalyst extended range buses• Constructed one electric bus fast-charging station at the Pomona facility• Constructed two electric bus fast-charging stations at the Azusa Intermodal Transit
Center• Completed bus heavy maintenance on nine 60-foot articulated buses• Completed bus heavy maintenance on 16 Series 1700 buses• Completed bus heavy maintenance on five Series 1800 buses• ISO 14001 Certification of Arcadia and Pomona ESMS programs• Performed and completed Arcadia Fleet Turnover Audit
FY2017-2018 INITIATIVES:• Inspect and accept 13 new 40 ft. Proterra Catalyst extended-range buses• Construct an in-depot charging station at the Arcadia facility• Implement Electric Bus Health monitoring system on electric fleet• Complete bus heavy maintenance on 60-foot articulated buses• Implement bus heavy maintenance on Series 1700 and 1800 buses• Continue ISO 14001 Certification of Arcadia and Pomona ESMS programs• Perform and complete Fleet Turnover Audit at Pomona• Perform Monrovia Dial-A-Ride fleet inspections• Continue random fleet audits at both Pomona and Arcadia facilities
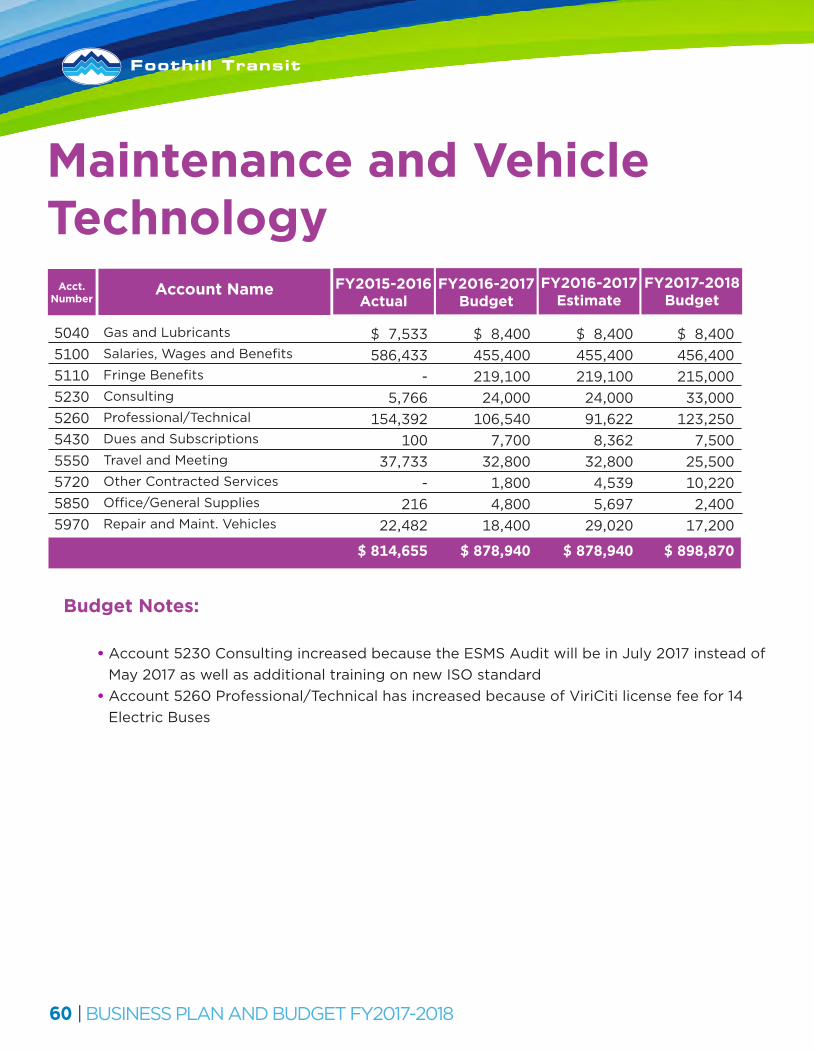
60 | BUSINESS PLAN AND BUDGET FY2017-2018 BUSINESS PLAN AND BUDGET FY2017-2018 | 61
• Account 5230 Consulting increased because the ESMS Audit will be in July 2017 instead ofMay 2017 as well as additional training on new ISO standard
• Account 5260 Professional/Technical has increased because of ViriCiti license fee for 14Electric Buses
Budget Notes:
Maintenance and VehicleTechnology
Gas and Lubricants
Salaries, Wages and Benefits
Fringe Benefits
Consulting
Professional/Technical
Dues and Subscriptions
Travel and Meeting
Other Contracted Services
Office/General Supplies
Repair and Maint. Vehicles
FY2015-2016Actual
FY2016-2017Estimate
FY2017-2018Budget
Acct.Number
5040510051105230526054305550572058505970
FY2016-2017Budget
Account Name
$8,400456,400215,00033,000
123,2507,500
25,50010,2202,400
17,200
$ 898,870
$8,400455,400219,10024,00091,622
8,36232,800
4,5395,697
29,020
$ 878,940
$8,400455,400219,10024,000
106,5407,700
32,8001,8004,800
18,400
$ 878,940
$7,533586,433
-5,766
154,392100
37,733-
21622,482
$ 814,655

60 | BUSINESS PLAN AND BUDGET FY2017-2018 BUSINESS PLAN AND BUDGET FY2017-2018 | 61
Marketing and CommunicationsThe Marketing and Communications team supports, brands, communicates, and promotes Foothill Transit service, and relevant information to existing and potential customers. This is accomplished through targeted and strategic advertising, community engagement, government outreach, media exposure, special events, on-board communications, the Bus Book, social media, and foothilltransit.org. The primary strategic goal in all campaigns and projects is to heighten public awareness of Foothill Transit and increase ridership.
MANAGER OF PUBLIC AFFAIRS
MANAGER OF COMMUNITY ENGAGEMENT
MARKETING ASSISTANT
DIGITAL MEDIA AND CUSTOMER RELATIONS COORDINATOR
DIRECTOR OF MARKETING AND COMMUNICATIONS
MARKETING AND COMMUNICATIONS STRATEGIST
CREATIVE CONTENT DESIGNER

62 | BUSINESS PLAN AND BUDGET FY2017-2018 BUSINESS PLAN AND BUDGET FY2017-2018 | 63
• Continued ridership initiative campaigns for Silver2Silver, Class Pass, and CommuterExpress
• Re-launched Mt. SAC and University of La Verne Class Pass campaigns, launchedCitrus College Class Pass pilot campaign, and expanded advertising and marketing forfuture partnerships
• Coordinated customer communication and marketing for the transition of former MetroLines 190, 194, and 270
• Coordinated customer communication and marketing for the launch of the new Line 196 tothe LA County Fair
• Coordinated public outreach for new service programs and fare restructuring• Developed destination-type marketing initiatives highlighting community connections and
events• Leveraged unique opportunities to increase stakeholder and community support• Launched New Resident campaign for the San Gabriel and Pomona Valleys• Improved customer communication of detour and road closure information
FY2016-2017 ACCOMPLISHMENTS:
• Conduct research for customer satisfaction, awareness, information preferences, andservice quality
• Incorporate additional capabilities of new CAD/AVL into customer communication andrider tools
• Create groundwork for new website that can incorporate data from CAD/AVL• Increase community engagement with focus on seniors, mobility, LGBT, and social services• Develop marketing collateral to leverage ridership on special services• Re-launch Commuter Express campaign• Launch customer education campaign regarding results of fare restructuring and service
changes• Update Foothill Transit facility artwork and initiate new student/local artist program• Organize grand opening event for Covina Transit Center and Park & Ride• Launch TAP vendor campaign
FY2017-2018 INITIATIVES:
Marketing and Communications

62 | BUSINESS PLAN AND BUDGET FY2017-2018 BUSINESS PLAN AND BUDGET FY2017-2018 | 63
• Account 5330 Community Sponsorship increased to include new, local non-profits focusedon seniors, mobility, the LGBT community, and social services
• Account 5380 Special Events increased with the addition of electric bus and a transitcenter grand opening events
• Account 5550 Travel and Meeting increased due to added Public Affairs Managerresponsibilities
• Account 6280 Printing increased to accommodate upcoming fare and service change info,more on-site campus campaigns and new preliminary 30th anniversary campaign
• Account 6290 Reprints of Brochures increased to include new TAP card campaign
Budget Notes:
Salaries, Wages and Benefits
Fringe Benefits
Consulting
Professional/Technical
Advertising and Promotion
Community Sponsorship
Special Events
Team Member Appreciation
Dues and Subscriptions
Travel and Meeting
Office/General Supplies
Printing
Reprints of Brochures
$588,000240,600480,000126,000544,45085,00036,000
5,00014,00026,000
7,00095,00010,000
$ 2,257,050
FY2015-2016Actual
FY2016-2017Estimate
FY2017-2018Budget
$563,834225,306470,00069,686
529,45070,00026,0005,000
14,00023,5007,600
80,0008,500
$ 2,092,876
$563,834225,306470,000116,700529,45070,00026,0005,000
14,00023,5007,600
80,0008,500
$ 2,139,890
$559,638-
329,18449,209
496,28472,28124,645
7,06212,43114,070
1,66115,988
8,541
$ 1,590,994
Acct.Number
5100511052305260530053305380541154305550585062806290
FY2016-2017Budget
Account Name

64 | BUSINESS PLAN AND BUDGET FY2017-2018 BUSINESS PLAN AND BUDGET FY2017-2018 | 65
Information TechnologyThe Information Technology (IT) Department is responsible for management, coordination, and implementation of information technology to ensure timely and cost-effective delivery of services to the public. The department provides data and communication solutions to Foothill Transit’s administrative staff, the Transit Stores, and the operations and maintenance contractors to achieve Foothill Transit’s goals and objectives.
• Completed design and functions of the Computer Aided Dispatch and Automated VehicleLocation (CAD/AVL)
• Implemented RSA technologies for multi-factor authentication to better secure ourCAD/AVL hardware and software system
• Replaced phone system for operating and maintenance facilities• Replaced email server filter to improve security• Implemented RSA technologies for multi-factor authentication to better secure our
network infrastructure• Installed an internal data monitoring appliance to protect against ransomware attacks
FY2016-2017 ACCOMPLISHMENTS:
HELP DESK ADMINISTRATOR
NETWORKMANAGER
IT APPLICATIONS SPECIALIST
DIRECTOR OF INFORMATIONTECHNOLOGY
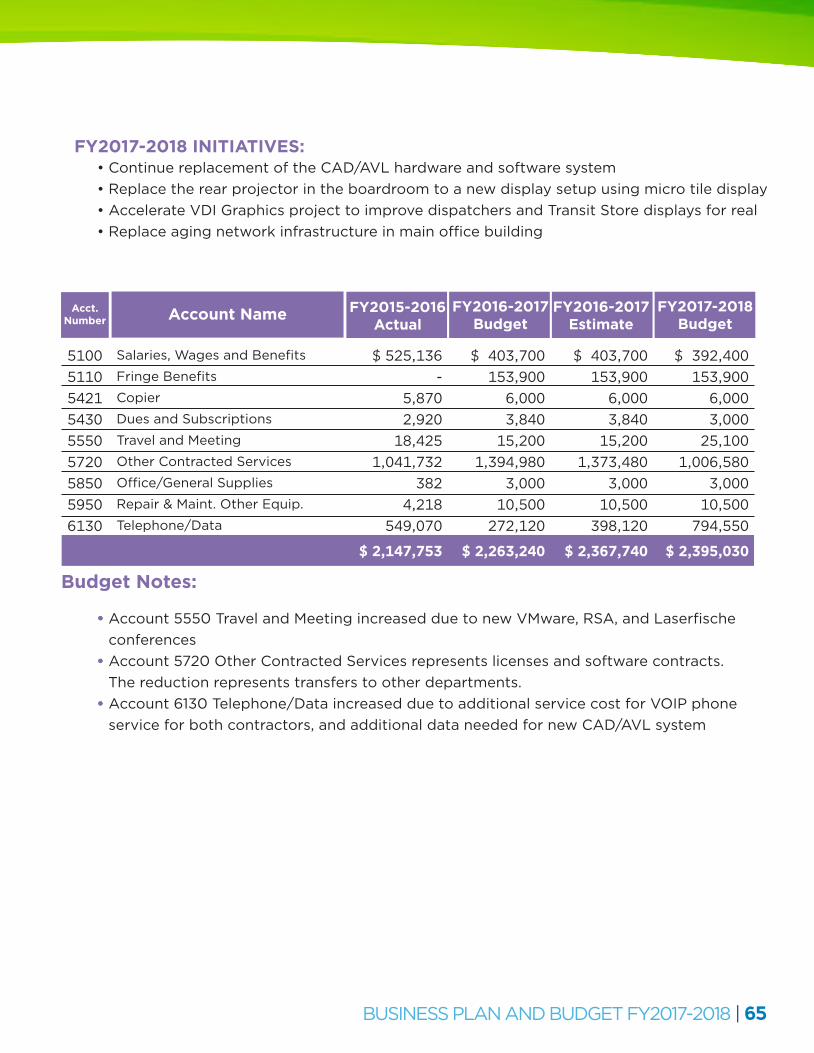
64 | BUSINESS PLAN AND BUDGET FY2017-2018 BUSINESS PLAN AND BUDGET FY2017-2018 | 65
Salaries, Wages and Benefits
Fringe Benefits
Copier
Dues and Subscriptions
Travel and Meeting
Other Contracted Services
Office/General Supplies
Repair & Maint. Other Equip.
Telephone/Data
$392,400153,900
6,0003,000
25,1001,006,580
3,00010,500
794,550
$ 2,395,030
FY2015-2016Actual
FY2016-2017Estimate
FY2017-2018Budget
$403,700153,900
6,0003,840
15,2001,373,480
3,00010,500
398,120
$ 2,367,740
$403,700153,900
6,0003,840
15,2001,394,980
3,00010,500
272,120
$ 2,263,240
$525,136-
5,8702,920
18,4251,041,732
3824,218
549,070
$ 2,147,753
Acct.Number
510051105421543055505720585059506130
FY2016-2017BudgetAccount Name
• Account 5550 Travel and Meeting increased due to new VMware, RSA, and Laserfischeconferences
• Account 5720 Other Contracted Services represents licenses and software contracts. The reduction represents transfers to other departments.
• Account 6130 Telephone/Data increased due to additional service cost for VOIP phoneservice for both contractors, and additional data needed for new CAD/AVL system
Budget Notes:
• Continue replacement of the CAD/AVL hardware and software system• Replace the rear projector in the boardroom to a new display setup using micro tile display• Accelerate VDI Graphics project to improve dispatchers and Transit Store displays for real• Replace aging network infrastructure in main office building
FY2017-2018 INITIATIVES:

66 | BUSINESS PLAN AND BUDGET FY2017-2018 BUSINESS PLAN AND BUDGET FY2017-2018 | 67
AdministrationThe Administration Department is responsible for providing management direction to all departments within the organization while executing the strategies and policies of the Executive Board. In addition, the Administration Department coordinates all legislative and intergovernmental affairs for Foothill Transit. The Administration Department also provides office support including the monitoring of office supplies and coordination of the organization’s central filing system.
DEPUTY EXECUTIVE DIRECTOR
DIRECTOR OF GOVERNMENT RELATIONS
BOARD SUPPORT SERVICES MANAGER
EXECUTIVE DIRECTOR
BOARD SUPPORT SERVICESCOORDINATOR

66 | BUSINESS PLAN AND BUDGET FY2017-2018 BUSINESS PLAN AND BUDGET FY2017-2018 | 67
• Supported the Executive and Governing Boards• Ensured effective Executive and Governing Board communications• Oversaw progress toward completion of San Gabriel Valley Park & Ride projects• Advocated for federal funding for Foothill Transit capital projects• Managed the West Coast Multi-Agency Exchange (MAX) leadership development program• Strengthened industry involvement and enhanced Foothill Transit’s visibility and influence
with the American Public Transportation Association, California Transit Association,Southern California Regional Transit Training Consortium (SCRTTC), and Access Services
• Continued and strengthened industry involvement in Conference of MinorityTransportation Officials (COMTO) and Women‘s Transportation Seminar (WTS)
FY2016-2017 ACCOMPLISHMENTS:
FY2017-2018 INITIATIVES:• Support the Executive and Governing Boards• Ensure progress toward completion of San Gabriel Valley Park & Ride projects• Maintain effective Executive Board and Governing Board communications• Maintain strong industry involvement with American Public Transportation Association,
California Transit Association, and Access Services• Maintain industry involvement in COMTO and WTS• Ensure continued involvement in and pursue expansion of the West Coast Multi-Agency
Exchange (MAX) leadership development program

68 | BUSINESS PLAN AND BUDGET FY2017-2018 BUSINESS PLAN AND BUDGET FY2017-2018 | 69
Salaries, Wages and Benefits
Fringe Benefits
Consulting
Legal Fees
Public Affairs
Board Stipend
Dues and Subscriptions
Postage/Express Mail
Mail Equipment Lease
Training and Development
Travel and Meeting
Casualty & Liability Insurance
Other Contracted Services
Office/General Supplies
$1,077,900304,20072,000
416,000153,00050,50072,75014,800
4,000272,000216,000218,000
3,90016,100
$ 2,891,150
FY2015-2016Actual
$1,198,866362,19423,000
344,000153,00050,50069,83014,0003,600
181,600156,000218,000
3,90015,600
$ 2,794,090
$1,348,866422,19473,000
414,000153,00050,50069,83014,0003,600
261,600216,000218,000
3,90015,600
$ 3,264,090
$1,460,569-
104,902312,073159,73645,75283,70511,776
3,571172,227142,500185,756
3,48222,487
$ 2,708,536
Acct.Number
51005110523052505265541254305441550055455550560057205850
FY2016-2017Budget
Account Name
Budget Notes:
•Account5100Salaries,WagesandBenefitsdecreasedduetotwopositionsbeing transferredtoFinanceandonetoPolicyandStrategicSourcing •Account5545TrainingandDevelopmentincludestuitionreimbursement
Administration FY2017-2018Budget
FY2016-2017Estimate
FY2017-2018Budget

68 | BUSINESS PLAN AND BUDGET FY2017-2018 BUSINESS PLAN AND BUDGET FY2017-2018 | 69
The Department of Policy and Strategic Sourcing is responsible for supporting Foothill Transit policy, legislative, regulatory, procurement, and contract administration activities. It supports the increased visibility of Foothill Transit in the national arena and builds strategic partnerships with academic, nonprofit, and policy organizations. It is also responsible for ensuring timely acquisition of goods and services to support Foothill Transit mission and supports Foothill Transit Disadvantaged Business Enterprise program.
• Supported Foothill Transit visibility through partnerships with national policy organizationsand other stakeholders
• Coordinated agency responses to federal rulemakings, comments, and other significantactions
• Procured services to support capital activities occurring at Foothill Transit maintenanceand operations facilities
• Managed necessary procurements for the Covina and West Covina Transit Centers• Managed procurement for new operations contractor at Pomona Operating Facility
FY2016-2017 ACCOMPLISHMENTS:
Policy and Strategic Sourcing
ADMINISTRATIVE ANALYST
PROCUREMENTMANAGER
PROCUREMENT SPECIALIST
DIRECTOR OF POLICY AND STRATEGIC SOURCING

70 | BUSINESS PLAN AND BUDGET FY2017-2018 BUSINESS PLAN AND BUDGET FY2017-2018 | 71
Policy and Strategic Sourcing FY2017-2018 INITIATIVES:
• Support Foothill Transit national policy efforts and visibility • Support Foothill Transit in the promotion of innovative concepts, methodologies, such as shared use mobility and other emerging technologies, including Mobility on Demand project with LA Metro and other Innovative Service Delivery Concepts • Coordinate internal administrative policies, procedures and systems to improve organizational efficiency, including implementation of Transit Asset Management responsibilities • Ensure successful and timely procurement of goods and services to support Foothill Transit mission • Ensure Foothill Transit Procurement Manual remains consistent with federal and state procurement guidelines • Manage procurement process for new electric and CNG buses
Salary, Wages & Benefits
Fringe Benefits
Consulting
Legal Fees
Professional/Technical
Advertising and Promotion
Dues and Subscriptions
Travel and Meeting
$358,500131,800100,000270,00012,00025,0002,500
32,000
$ 931,800
FY2015-2016Actual
FY2016-2017Estimate
FY2017-2018Budget
$287,70083,000
110,000290,00012,00030,0002,500
33,100
$ 848,300
$287,70083,000
110,000290,00012,00030,0002,500
33,100
$ 848,300
$353,994-
26,375370,022
6,1008,5282,167
36,329
$ 803,515
Acct.Number
51005110523052505260530054305550
FY2016-2017Budget
Account Name
• Account 5100 Salary, Wages & Benefits increased due to additional position transferred from Administration Department
• Account 5300 Advertising and Promotion decreased due to increased use of electronic procurement system
Budget Notes:

70 | BUSINESS PLAN AND BUDGET FY2017-2018 BUSINESS PLAN AND BUDGET FY2017-2018 | 71
The Finance Department provides timely, accurate, clear, and complete financial information to support the Foothill Transit mission. This includes a multitude of support services in the major functions of Accounting, Budget and Grants management, Human Resources, Fare Policy and Collection, Class Pass Programs, Benefits Administration, Retirement Program management, and Investment activities. The Finance Department provides support to all departments within the organization while adhering to Board policies and generally accepted accounting principles.
Finance
FARE REVENUE MANAGER
BUDGET AND GRANTS MANAGER
ADMINISTRATIVE ANALYST
DIRECTOR OF FINANCE AND TREASURER
SENIOR ACCOUNTANT (2)
CONTROLLERHUMAN RESOURCESMANAGER
ACCOUNTINGCLERK ACCOUNTANT

72 | BUSINESS PLAN AND BUDGET FY2017-2018 BUSINESS PLAN AND BUDGET FY2017-2018 | 73
• Updated ten-year financial forecast • Successfully completed the Federal Transit Administration Triennial Review • Completed financial audits resulting in no material findings • Conducted a five-year capital improvement program call-for-projects • Prepared annual operating and capital budgets; included annual cash flow for capital projects • Continued fare restructuring study to improve ridership and fare revenues • Implemented the Class Pass “pilot program” with Citrus Community College • Successfully won over $21 million in competitive capital grants • Received National Government Finance Officers Association award for excellence in financial reporting • Implemented employee wellness program, including lunchtime Yoga for all employees
FY2016-2017 ACCOMPLISHMENTS:
FY2017-2018 INITIATIVES: • Complete and implement the fare restructuring program • Complete development and implementation of electronic timesheet program payroll enhancement • Implement Class Pass program at Citrus Community College • Implement upgrade to finance software • Implement accounting process for Transit Asset Management Plan • Investigate mobile ticketing applications for potential pilot program • Update ten-year financial forecast
Finance

72 | BUSINESS PLAN AND BUDGET FY2017-2018 BUSINESS PLAN AND BUDGET FY2017-2018 | 73
• Account 5100 Salary and Wages increased due to the transfer of two positions from • Administration Department • Account 5230 Consulting increased due to professional assistance for development of mobile ticketing pilot project and human resource improvements • Account 5720 Other Contracted Services increased due to retirement and payroll fees • Account 5550 Travel and Meeting increased due to training for new positions • Account 6210 Pass Sales Commission increased due to new vendors being added to
encourage transition to TAP cards • Account 6260 Fare Media Title VI analysis may require additional TAP cards to be
distributed as mitigation for fare change
Budget Notes:
Salaries, Wages and Benefits
Fringe Benefits
Audit Fees
Consulting
Dues and Subscriptions
Travel and Meeting
Other Contracted Services
Fare Collection Equip./Maint.
Office/General Supplies
Pass Sales Commission
Fare Media
$966,600
389,600
45,000
107,000
3,940
70,500
127,850
13,550
1,200
30,000
24,000
$ 1,779,240
FY2015-2016Actual
FY2016-2017 Estimate
FY2017-2018 Budget
$758,400269,20045,00035,9003,300
51,20018,50013,550
80020,00020,000
$ 1,235,850
$758,400269,20045,00035,9003,300
51,20018,50013,5501,200
20,00020,000
$ 1,236,250
$941,023-
53,1101,3413,055
33,31612,578
2,35646
20,93323,140
$ 1,090,898
Acct.Number
51005110521052305430555057205741585062106260
FY2016-2017 Budget
Account Name

74 | BUSINESS PLAN AND BUDGET FY2017-2018 BUSINESS PLAN AND BUDGET FY2017-2018 | 75
PlanningThe Planning Department is responsible for route planning, coordination with member cities and neighboring transit systems in the design and construction of transit-related projects. The department works closely with cities to ensure that bus stop locations are safe and ADA compliant. The department also projects service levels and budgets and monitors actual costs related to Foothill Transit’s two operating contracts.
• Completed the public outreach process of the Comprehensive Operational Analysis (COA) and made final recommendations of service enhancements to the Governing Board for approval
• Coordinated special LA County Fair service including a line from the Azusa Intermodal Transit Center to the Pomona Fairplex • Improved schedule adherence by making necessary adjustments to route run times • Integrated Lines 190, 194, and 270 into Foothill Transit’s service profile
FY2016-2017 ACCOMPLISHMENTS:
TRANSIT PLANNERPLANNINGMANAGERTRANSIT PLANNER
DIRECTOR OF PLANNING

74 | BUSINESS PLAN AND BUDGET FY2017-2018 BUSINESS PLAN AND BUDGET FY2017-2018 | 75
• Analyze and adjust routes and schedules impacted by the Gold Line extension • Upgrade the Giro Hastus scheduling system software • Research innovative delivery of service such as the forming collaborative partnerships with
transportation network companies (TNCs) such as Uber, Lyft, and taxis • Research and implement a pilot express line from the newly constructed Covina Park &
Ride • Develop foundation for a frequent network of service by establishing select corridors
throughout the service area • Submit Foothill Transit’s 2017 Title VI Program Update to the Federal Transit
Administration • Complete inventory of Foothill Transit’s existing bus stops including the amenities provided at the location • Complete installation of the bus signal priority equipment at designated intersections to
help improve on time performance on Line 187
FY2017-2018 INITIATIVES
• Account 5230 Consulting decreased due to elimination of GIS Analysis • Account 5260 Professional/Technical decreased due to elimination of T-Best Modeling • Account 5430 Dues and Subscriptions increased for rotary dues and AICP • Account 5530 System Map decreased due to the majority of the system map work being
done in-house • Account 5550 Travel and Meeting increased due to the APTA Planning Workshop, TRB,
and APTA Annual • Account 5720 Other Contracted Services increased due to planning specific software costs transferred from IT Department
Budget Notes:
Salaries, Wages and Benefits
Fringe Benefits
Consulting
Professional/Technical
Dues and Subscriptions
System Map
Travel and Meeting
Other Contracted Services
Office/General Supplies
Bus Book Printing
$409,000122,50040,000
110,0005,250
20,00020,000
391,00030,000
150,000
$ 1,297,750
FY2015-2016Actual
FY2016-2017Estimate
FY2017-2018Budget
$413,200110,80060,000
130,0003,450
-16,00012,00010,000
120,000
$ 875,450
$413,200110,80060,000
130,0003,450
50,00016,00012,00030,000
150,000
$ 975,450
$501,013-
27,274127,676
1,230-
13,533120,63518,04278,227
$ 887,630
Acct.Number
5100511052305260543055305550572058506200
FY2016-2017Budget
Account Name

76 | BUSINESS PLAN AND BUDGET FY2017-2018 BUSINESS PLAN AND BUDGET FY2017-2018 | 77
The Facilities Department is responsible for all of Foothill Transit’s physical assets, including grounds, administrative offices, operations and maintenance facilities and parking structures. The department implements a comprehensive and strategic approach to developing, enhancing, and sustaining Foothill Transit’s physical assets. In addition, the department plays a supporting role in the agency’s bus operations through the installation and upkeep of Foothill Transit’s bus stop signage program.
Facilities
• Completed the Arcadia Operations and Maintenance Facility interior and exterior improvements, including furniture replacement in various areas
• Completed the fare collection canopy at the Arcadia Operations and Maintenance Facility
• Completed Phase 1 environmental review and preliminary architectural and engineering design for the Covina Transit Center and Park & Ride
• Completed the Environmental and Sustainability Management System (ESMS) Program recertification at the Arcadia and Pomona Operations and Maintenance Facility
• Completed painting of stairwells at Administrative Building • Completed fire alarm extension to fuel island at Pomona Operations and Maintenance
Facility • Resealed and restriped employee parking lot and completed ADA upgrades at Arcadia
Operations and Maintenance facility • Modified bus bay at Pomona Transit Center to accommodate new extended range
electric buses
FY2016-2017 ACCOMPLISHMENTS:
CONSTRUCTION PROJECT MANAGER
FACILITIESMANAGER
FACILITIESANALYST
DIRECTOR OF FACILITIES

76 | BUSINESS PLAN AND BUDGET FY2017-2018 BUSINESS PLAN AND BUDGET FY2017-2018 | 77
• Begin detail design and construction for the Covina Park & Ride and Transit Center • Begin Phase 1 environmental review and preliminary design for the Mt. SAC Transit
Center • Complete the West Covina Bus Shelter replacement project on Vincent Avenue • Begin concept designs for the West Covina Transit Center • Complete installation of nine electric vehicle charging stations at the Administrative
Office Building • Complete the Overflow Employee Parking Lot Project at the Arcadia Operations and
Maintenance Facility • Begin modifications for employee wellness outdoor park at the Administrative Office
Building • Complete the installation of two natural gas compressors at the Arcadia Operations
and Maintenance Facility • Complete exterior and interior painting at the Pomona Operations and Maintenance
Facility • Complete roof replacement and HVAC upgrade at Arcadia Operations and Maintenance
Facility • Complete the rehabilitation of the in-ground lifts at the Pomona and Arcadia
Maintenance Facilities • Begin concept design for remodel of the Pomona Transit Store • Develop a Facilities Transit Asset Management Plan for Arcadia and Pomona
Operations and Maintenance Facilities
FY2017-2018 INITIATIVES

• Account5151ContractedService-FacilityincreasedduetothecontractedserviceswithTransdevincreasingapproximatelyfourpercent
• Account5471Janitorialincreasedduetothecontractedservicesincreasingbyninepercent
78 | BUSINESS PLAN AND BUDGET FY2017-2018
Facilities
Salary, Wages & Benefits
Fringe Benefits
Contracted Services-Facility
Professional/Technical
Contract Maintenance
Dues & Subscriptions
Janitorial
Travel & Meeting
Other Contracted Services
Office/General Supplies
Tools and Materials
Repair & Maint. Other Equip.
Safety & Security
Utilities
$353,300136,900467,060
2,00071,48016,00046,05019,500
178,9801,050
24,00038,60024,690
281,710
$ 1,661,320
FY2015-2016Actual
FY2016-2017Estimate
FY2017-2018Budget
$347,400126,000433,420
2,00068,64015,96042,24018,600
166,5801,050
20,00033,60024,690
274,460
$ 1,574,640
$347,400126,000433,420
2,00068,64015,96042,24018,600
166,5801,050
20,00033,60024,690
274,460
$ 1,574,640
$436,804-
378,542-
50,5918,827
34,5526,780
92,506678
19,00020,0378,823
214,320
$ 1,271,460
Acct.Number
51005110515152605420543054715550572058505910595059916100
FY2016-2017Budget
Account Name
Budget Notes:
This page is intentionally left blank.

This page is intentionally left blank.

100 S. Vincent Ave., Suite 200West Covina CA, 91790
foothilltransit.org
MEMBER CITIESArcadia,Azusa,BaldwinPark,Bradbury,Claremont,Covina,DiamondBar,Duarte,ElMonte,Glendora,Industry,Irwindale,LaPuente,LaVerne,Monrovia,Pasadena,Pomona,SanDimas,SouthElMonte,TempleCity,Walnut,WestCovinaandLosAngelesCountyA PUBLIC AGENCY