Embed Size (px)
Citation preview
Gamesa EnergíaNobody knows more about wind
September 24, 2010, Madrid
2
Table of contents
1
2
3
4
Business model and value generation alternatives
Gamesa Energía pipeline breakdown and balance sheet value
Accounting and financial modeling
Gamesa Energía´s history
5
6
Strategy
Valuation
7
Conclusions8
Financing
3
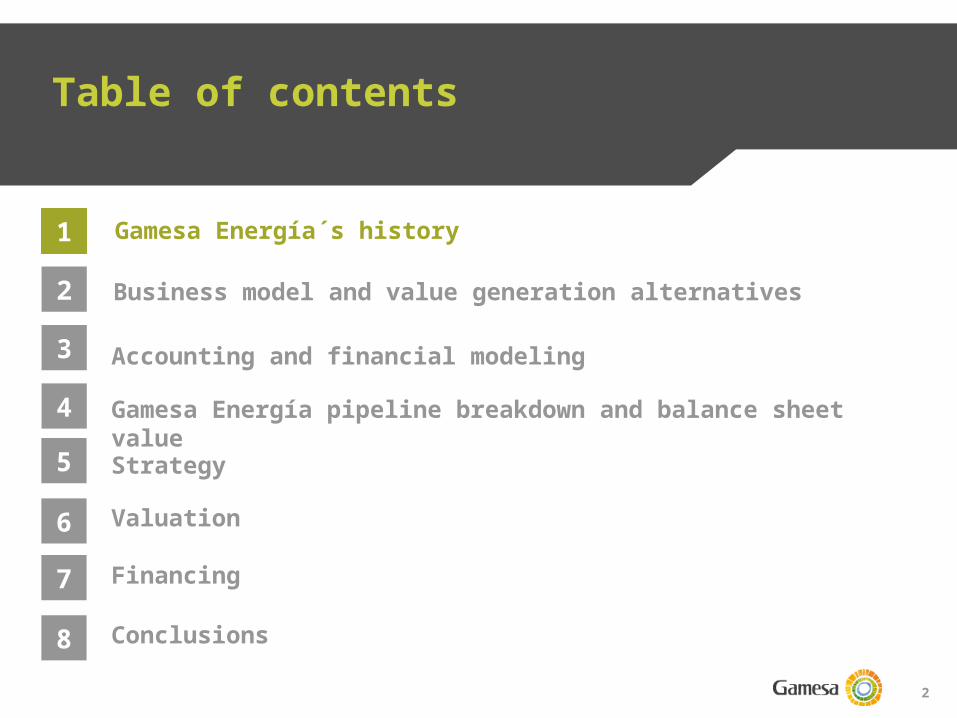
Gamesa Energía´s history
o Gamesa Energía started its activity in 1995 in Galicia and Aragón to complement the WTG manufacturing business with the rest of activities in the wind business cycle
o In 1999 it started it international expansion opening offices in Portugal, Italy and Greece.
o It launched its US operations in 2003, followed by China in 2006, and India in 2010.
o The business started with 15 people located in 3 offices. Currently counts with 300 people in 16 countries, 25 offices, managing the development of 22,000 MW
179 27369
523
8141.070
1.511
1.684
2.122
2.837
3.161
3.578
00
500
1000
1500
2000
2500
3000
3500
4000
1996-98
1999 2000 2001 2002 2003 2004 2005 2006 2007 2008 2009
MW
Pot. Instalada Acumulada por GESA (MW)
4
Table of contents
1
2
3
4
Business model and value generation alternatives
Gamesa Energía pipeline breakdown and balance sheet value
Accounting and financial modeling
History of Gamesa Energía
5
6
Strategy
Valuation
7
Conclusions8
Financing
5
Business model and value generation alternatives
Business model description1
2
3
4
5
Procurement of WTG – relationship with the manufacturing business
Key considerations in the sale of a wind farm
Alternatives and evolution of current business model
Competitive advantages
6 Site selection: wind resource expertise
6
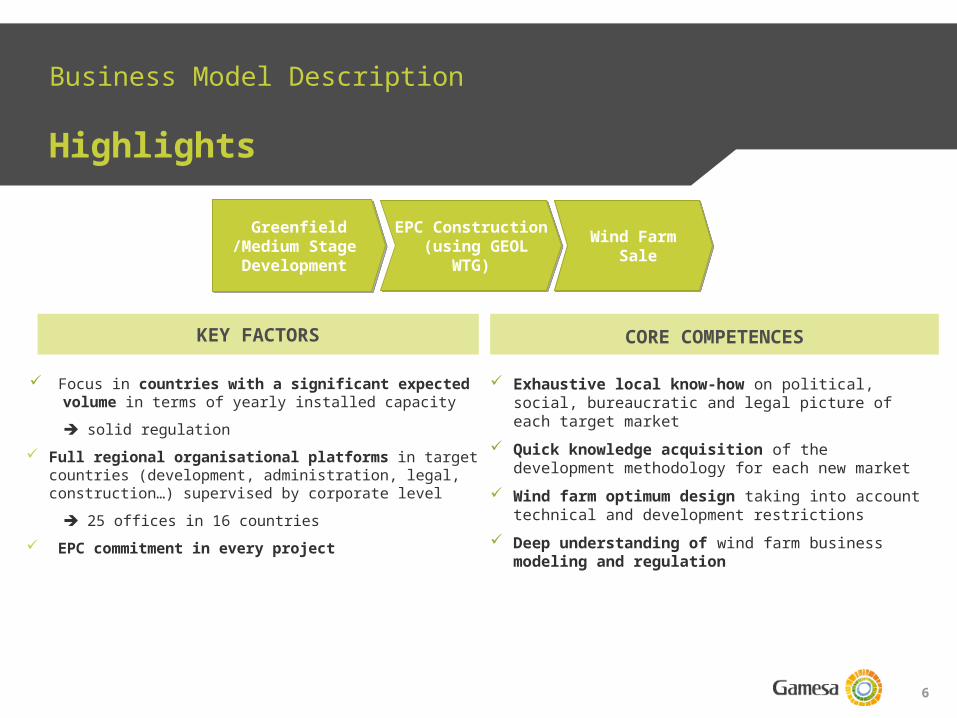
Business Model Description
Highlights
EPC Construction (using GEOL
WTG)Wind Farm
SaleGreenfield
/Medium Stage Development
Focus in countries with a significant expected volume in terms of yearly installed capacity
solid regulation Full regional organisational platforms in target
countries (development, administration, legal, construction…) supervised by corporate level
25 offices in 16 countries EPC commitment in every project
KEY FACTORS
Exhaustive local know-how on political, social, bureaucratic and legal picture of each target market
Quick knowledge acquisition of the development methodology for each new market
Wind farm optimum design taking into account technical and development restrictions
Deep understanding of wind farm business modeling and regulation
CORE COMPETENCES
7
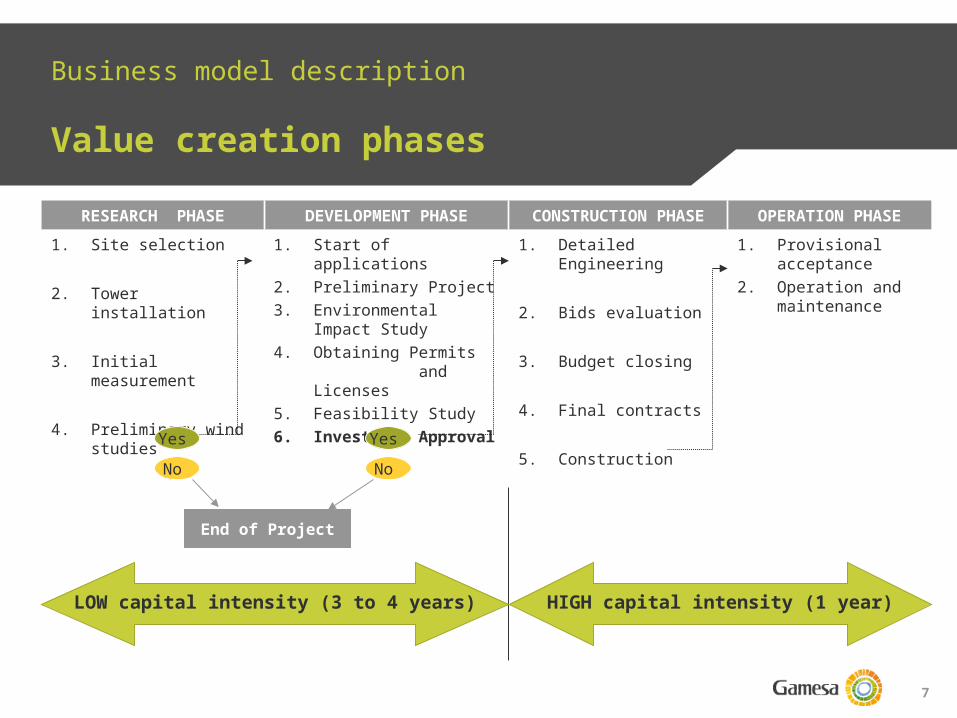
RESEARCH PHASE DEVELOPMENT PHASE CONSTRUCTION PHASE OPERATION PHASE
1. Site selection
2. Tower installation
3. Initial measurement
4. Preliminary wind studies
1. Start of applications2. Preliminary Project3. Environmental Impact
Study4. Obtaining Permits
and Licenses5. Feasibility Study6. Investment
Approval
1. Detailed Engineering
2. Bids evaluation
3. Budget closing
4. Final contracts
5. Construction
1. Provisional acceptance
2. Operation and maintenance
Yes No
End of Project
Business model description
Value creation phases
No Yes
LOW capital intensity (3 to 4 years) HIGH capital intensity (1 year)
8
Business model and value generation alternatives
Business model description1
2
3
4
5
Procurement of WTG – relationship with the manufacturing business
Key considerations in the sale of a wind farm
Alternatives and evolution of current business model
Competitive advantages
6 Site selection: wind resource expertise
9
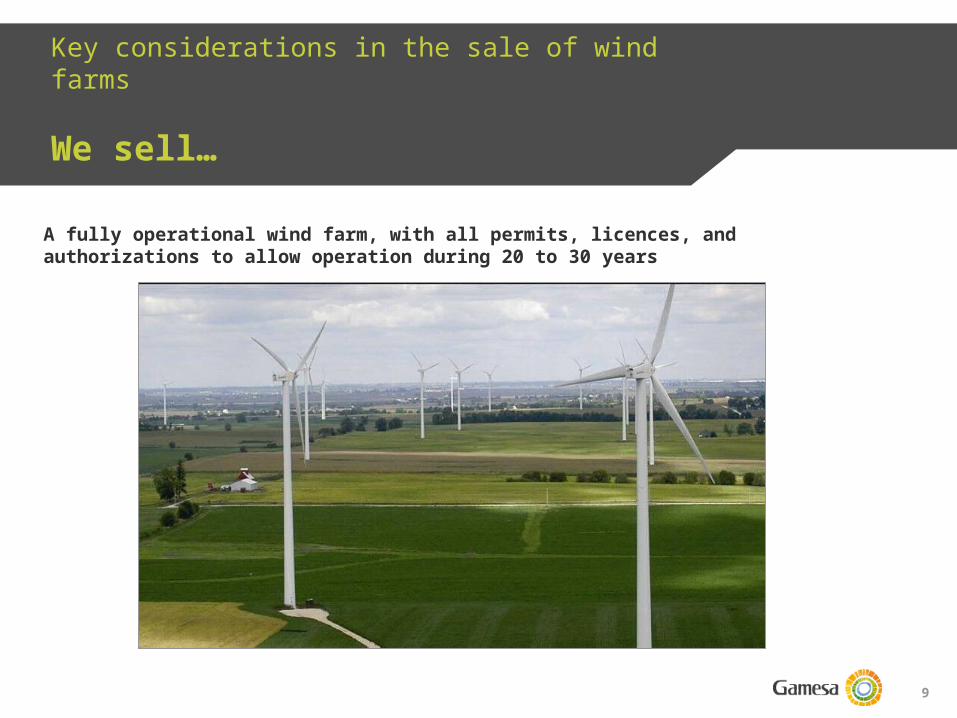
Key considerations in the sale of wind farms
We sell…
A fully operational wind farm, with all permits, licences, and authorizations to allow operation during 20 to 30 years
10
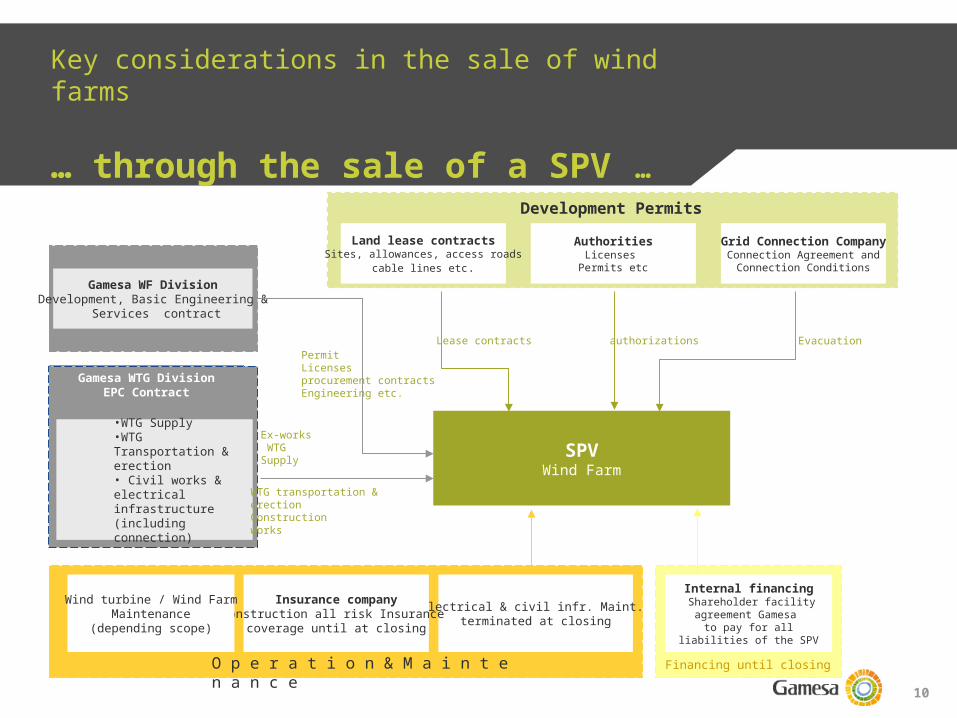
SPVWind Farm
Gamesa WF DivisionDevelopment, Basic Engineering &
Services contract
•WTG Supply•WTG Transportation & erection• Civil works & electrical infrastructure (including connection)
Internal financing Shareholder facility agreement Gamesa
to pay for all liabilities of the SPV
Land lease contractsSites, allowances, access roads
cable lines etc.
Lease contractsPermitLicensesprocurement contractsEngineering etc.
Ex-works WTG Supply
WTG transportation & erectionConstructionworks
AuthoritiesLicenses
Permits etc
authorizations
Financing until closing
Grid Connection CompanyConnection Agreement and
Connection Conditions
Evacuation
Electrical & civil infr. Maint. terminated at closing
Insurance companyConstruction all risk Insurance
coverage until at closing
Wind turbine / Wind FarmMaintenance
(depending scope)
O p e r a t i o n & M a i n t e n a n c e
Gamesa WTG DivisionEPC Contract
Development Permits
Key considerations in the sale of wind farms
… through the sale of a SPV …
11
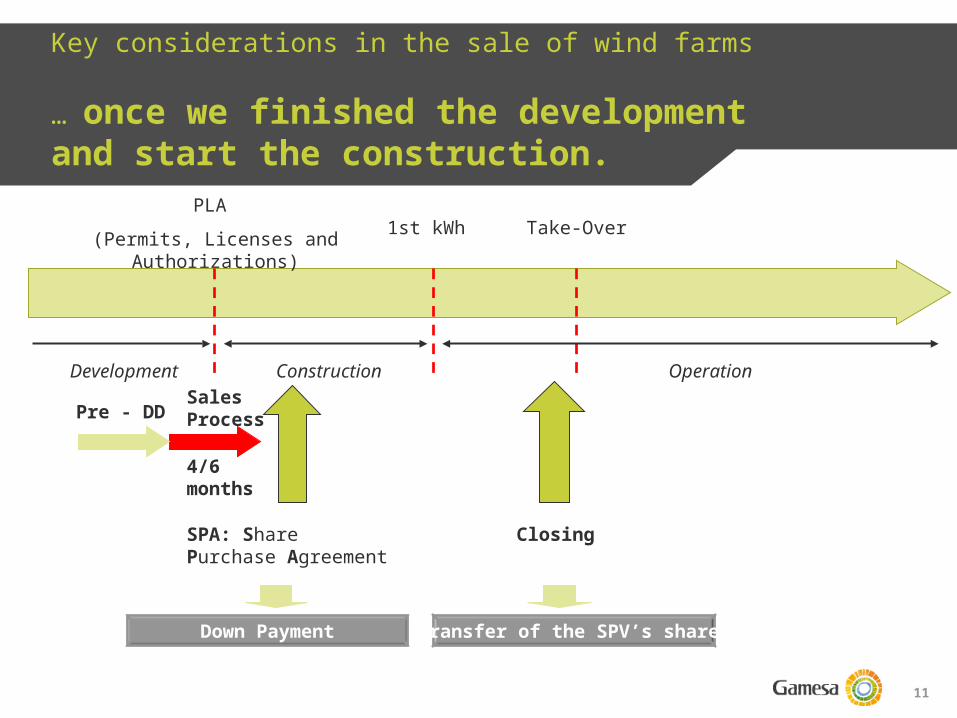
Key considerations in the sale of wind farms
… once we finished the development and start the construction.
PLA (Permits, Licenses and
Authorizations)1st kWh Take-Over
Development Construction Operation
SPA: Share Purchase Agreement
Closing
Sales Process
4/6 months
Pre - DD
Down Payment Transfer of the SPV’s shares
12
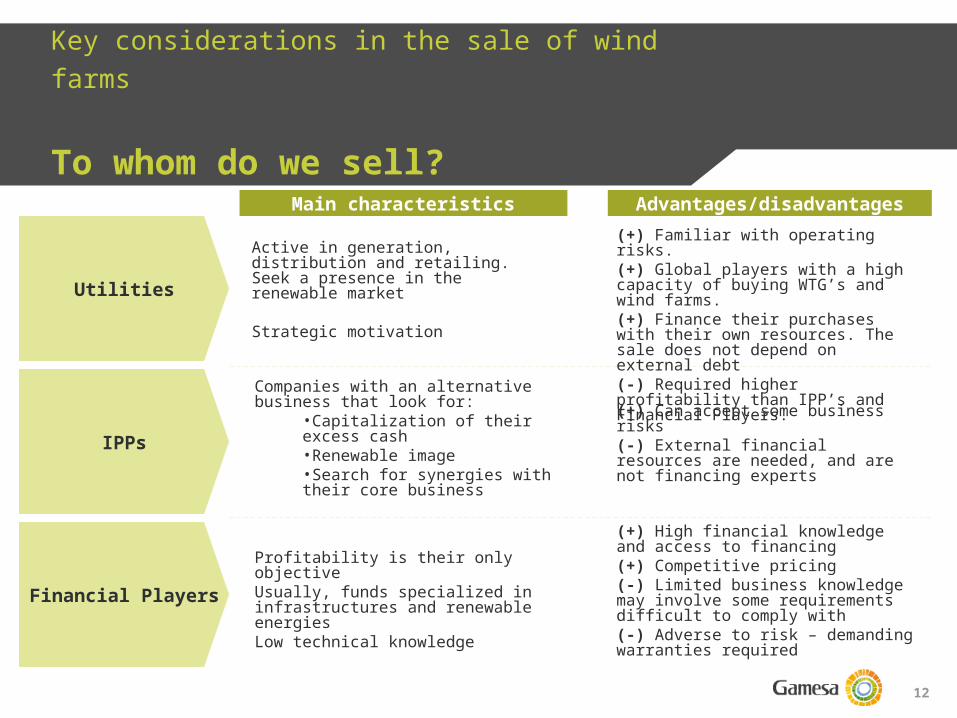
Key considerations in the sale of wind farms
To whom do we sell?
Utilities
Main characteristics Advantages/disadvantages
IPPs
Financial Players
Active in generation, distribution and retailing. Seek a presence in the renewable market
Strategic motivation
Companies with an alternative business that look for:
•Capitalization of their excess cash•Renewable image•Search for synergies with their core business
Profitability is their only objectiveUsually, funds specialized in infrastructures and renewable energiesLow technical knowledge
(+) Familiar with operating risks.(+) Global players with a high capacity of buying WTG’s and wind farms.(+) Finance their purchases with their own resources. The sale does not depend on external debt(-) Required higher profitability than IPP’s and Financial Players.
(+) Can accept some business risks(-) External financial resources are needed, and are not financing experts
(+) High financial knowledge and access to financing (+) Competitive pricing (-) Limited business knowledge may involve some requirements difficult to comply with(-) Adverse to risk – demanding warranties required

13
o B&Bo Viridiso Taiga Mistral
o Iberdrolao Edisono Endesao ENEL
o Electrabelo Eono EWEo Duke Energy
o Gestampo Genera Avanteo Naturener
o Acciona / CESAo Aldesao Ikeao ACS
o Fortunyo Marubeni
Key considerations in the sale of wind farms
Some of our clients
Utilities
IPPs
Financial Players
Core Market
Increasing weight market
opportunity
14
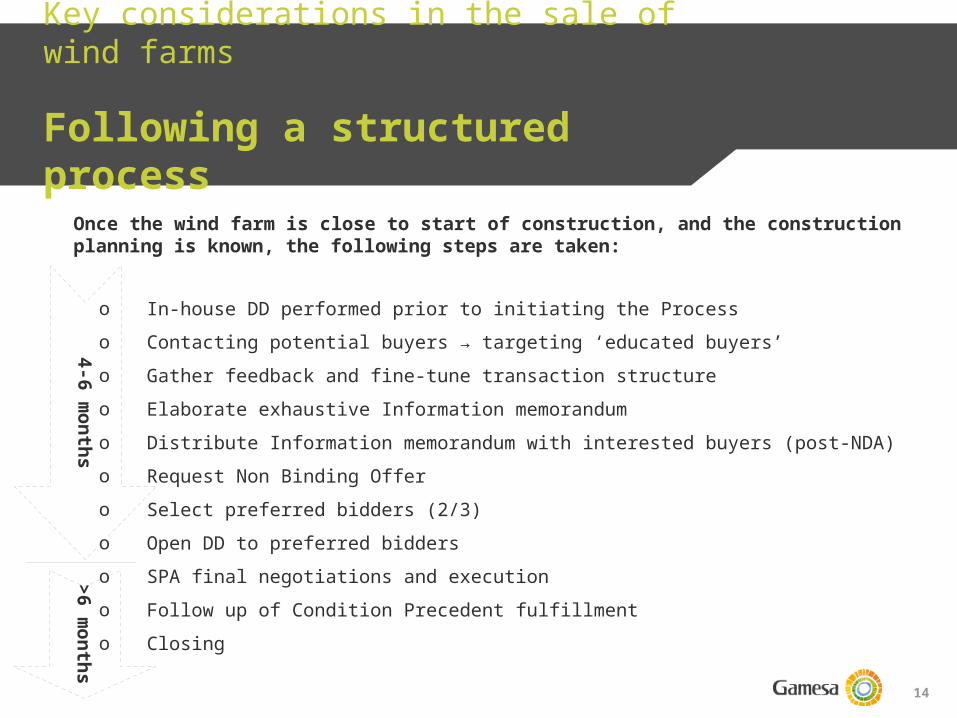
o In-house DD performed prior to initiating the Processo Contacting potential buyers → targeting ‘educated buyers’o Gather feedback and fine-tune transaction structureo Elaborate exhaustive Information memorandumo Distribute Information memorandum with interested buyers (post-NDA)o Request Non Binding Offero Select preferred bidders (2/3)o Open DD to preferred bidderso SPA final negotiations and executiono Follow up of Condition Precedent fulfillmento Closing
Once the wind farm is close to start of construction, and the construction planning is known, the following steps are taken:
Key considerations in the sale of wind farms
Following a structured process
4-6 months
>6 m
onths
15
Business model and value generation alternatives
Business model description1
2
3
4
5
Procurement of WTG – relationship with the manufacturing business
Key considerations in the sale of a wind farm
Alternatives and evolution of current business model
Competitive advantages
6 Site selection: wind resource expertise
16
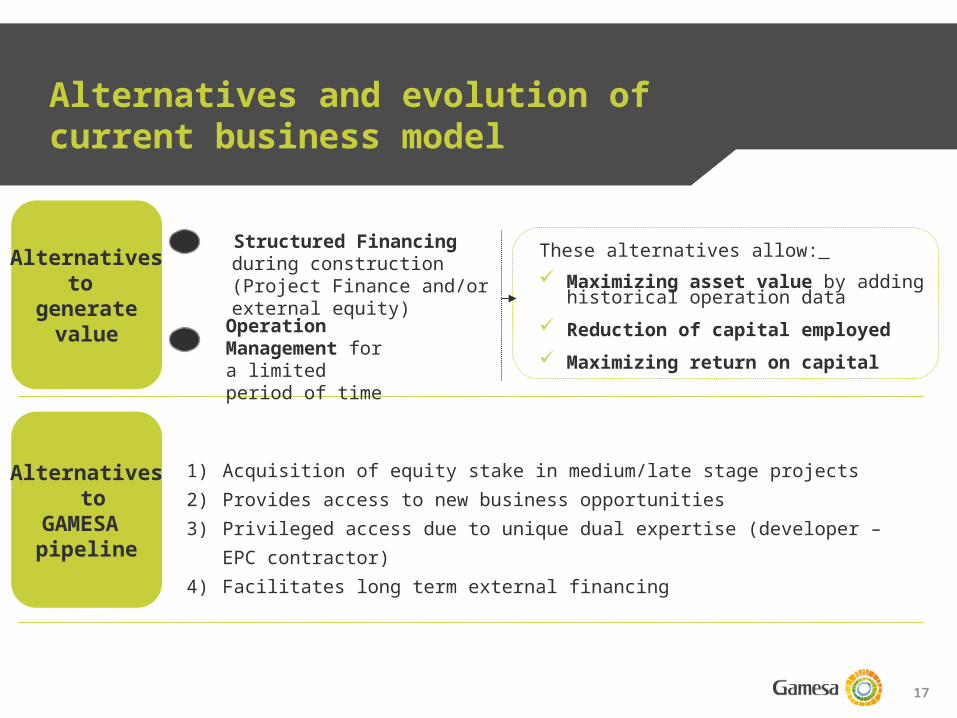
Alternatives and evolution of current business model
GESA does not intend to become an IPP
17
Alternatives and evolution of current business model
Alternativesto
generatevalue
Alternatives to
GAMESA pipeline
These alternatives allow: Maximizing asset value by adding historical operation data Reduction of capital employed Maximizing return on capital
Structured Financing during construction (Project Finance and/or external equity)
1
Operation Management for a limited period of time
2
1) Acquisition of equity stake in medium/late stage projects2) Provides access to new business opportunities3) Privileged access due to unique dual expertise (developer – EPC
contractor)4) Facilitates long term external financing
18
Business model and value generation alternatives
Business model description1
2
3
4
5
Procurement of WTG – relationship with the manufacturing business
Key considerations in the sale of a wind farm
Alternatives and evolution of current business model
Competitive advantages
6 Site selection: wind resource expertise
19
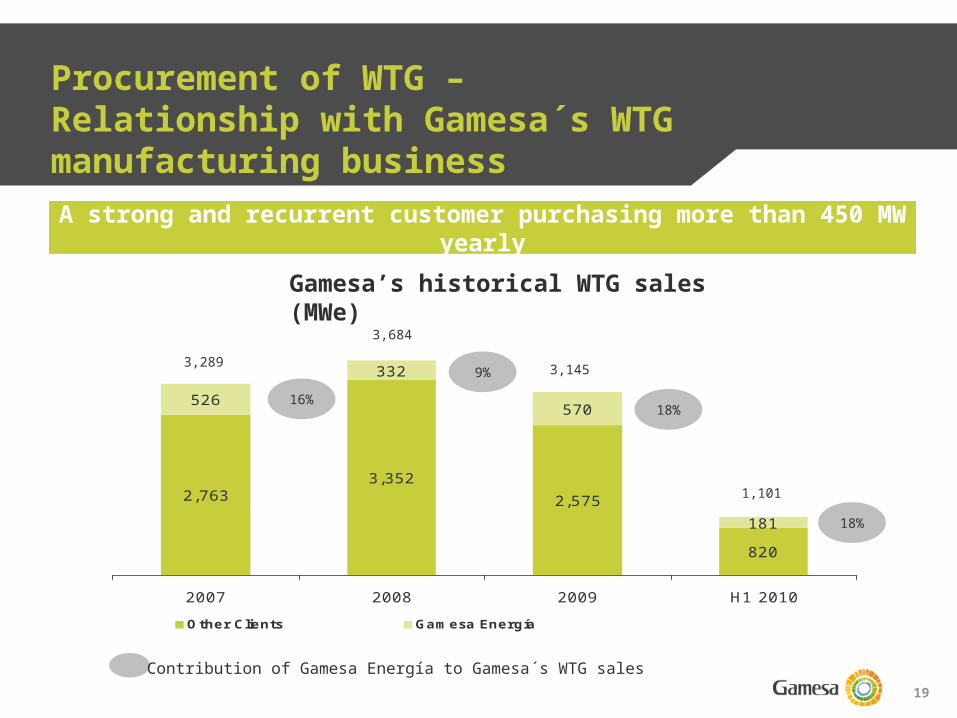
MWe WTG
820
526332
570
1812,575
3,3522,763
2007 2008 2009 H1 2010Other Clients Gamesa Energía
16%9%
18%
18%
Contribution of Gamesa Energía to Gamesa´s WTG sales
3,2893,684
3,145
1,101
Procurement of WTG – Relationship with Gamesa´s WTG manufacturing businessA strong and recurrent customer purchasing more than 450 MW
yearlyGamesa’s historical WTG sales (MWe)

20
Business model and value generation alternatives
Business model description1
2
3
4
5
Procurement of WTG – relationship with the manufacturing business
Key considerations in the sale of a wind farm
Alternatives and evolution of current business model
Competitive advantages
6 Site selection: wind resource expertise
21
o Our unique global presence (Europe, US, Lat-Am, China) allows a natural hedge to slow downs of specific markets due to regulatory changes
o Preferential access to WTGs during a sellers market cycleo Advantages related with recurrent nature of selling wind farms vs
one spot seller: Professional DD and negotiation process Can remain involved in all relationships with the local authorities in
order to allow a smooth transition The reputational factor ensures fair terms and conditions
o Deep in house expertise in all aspects of wind development (lands, permitting, wind resource evaluation, micrositing, EPC)
Competitive advantages
22
Business model and value generation alternatives
Business model description1
2
3
4
5
Procurement of WTG – relationship with the manufacturing business
Key considerations in the sale of a wind farm
Alternatives and evolution of current business model
Competitive advantages
6 Site selection: wind resource expertise
23
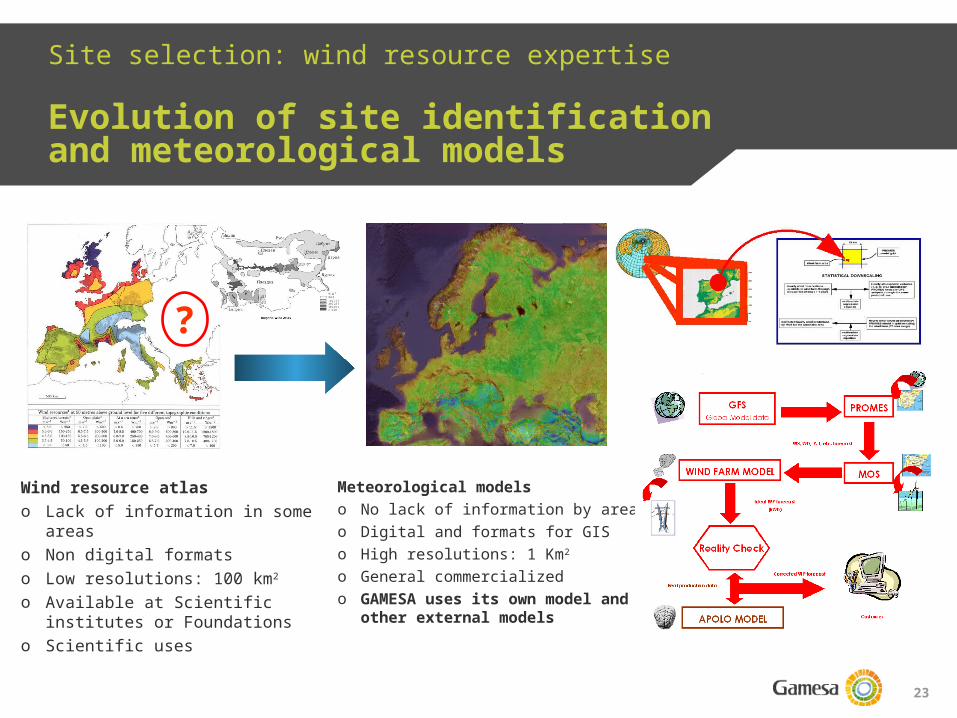
Site selection: wind resource expertise
Evolution of site identification and meteorological models
Wind resource atlaso Lack of information in some areaso Non digital formats o Low resolutions: 100 km2
o Available at Scientific institutes or Foundations
o Scientific uses
Meteorological modelso No lack of information by areaso Digital and formats for GISo High resolutions: 1 Km2
o General commercializedo GAMESA uses its own model
and other external models
?
24
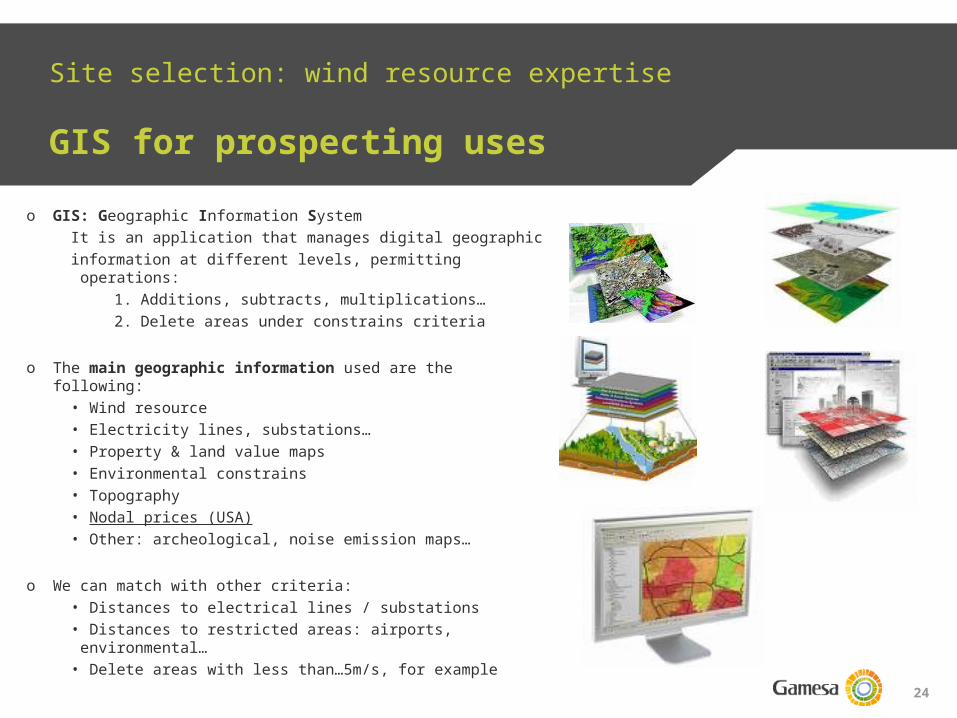
Site selection: wind resource expertise
GIS for prospecting uses
o GIS: Geographic Information SystemIt is an application that manages digital geographicinformation at different levels, permitting operations:
1. Additions, subtracts, multiplications…2. Delete areas under constrains criteria
o The main geographic information used are the following:• Wind resource• Electricity lines, substations…• Property & land value maps• Environmental constrains• Topography• Nodal prices (USA)• Other: archeological, noise emission maps…
o We can match with other criteria:• Distances to electrical lines / substations• Distances to restricted areas: airports, environmental…• Delete areas with less than…5m/s, for example
25
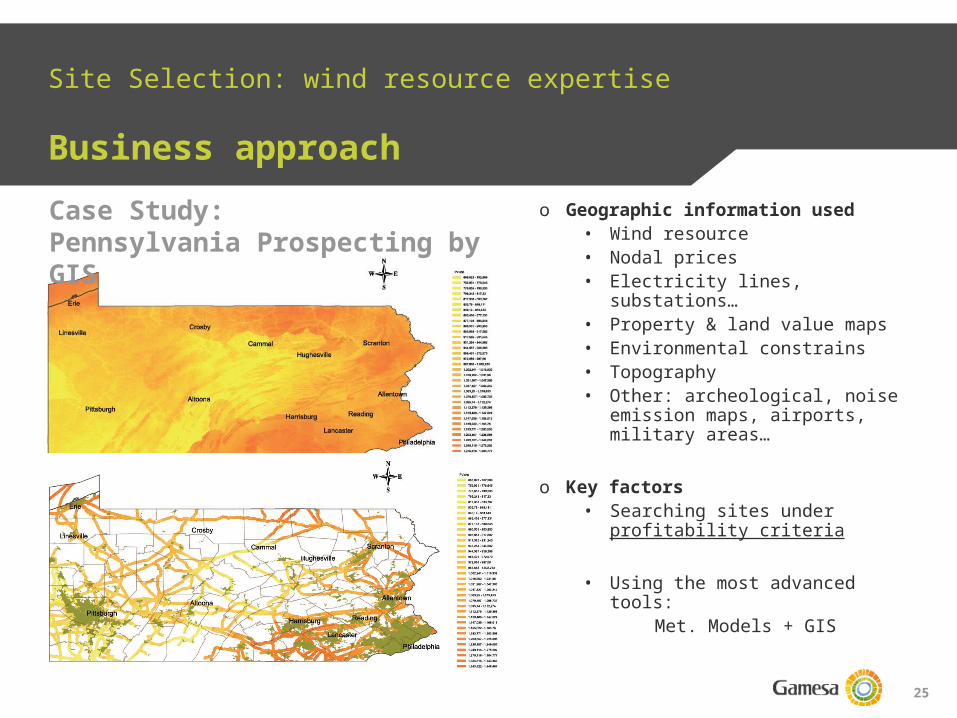
Site Selection: wind resource expertise
Business approachCase Study:Pennsylvania Prospecting by GIS
o Geographic information used• Wind resource• Nodal prices• Electricity lines, substations…• Property & land value maps• Environmental constrains• Topography• Other: archeological, noise
emission maps, airports, military areas…
o Key factors• Searching sites under
profitability criteria
• Using the most advanced tools:Met. Models + GIS
26
Wind resource assessment & optimization
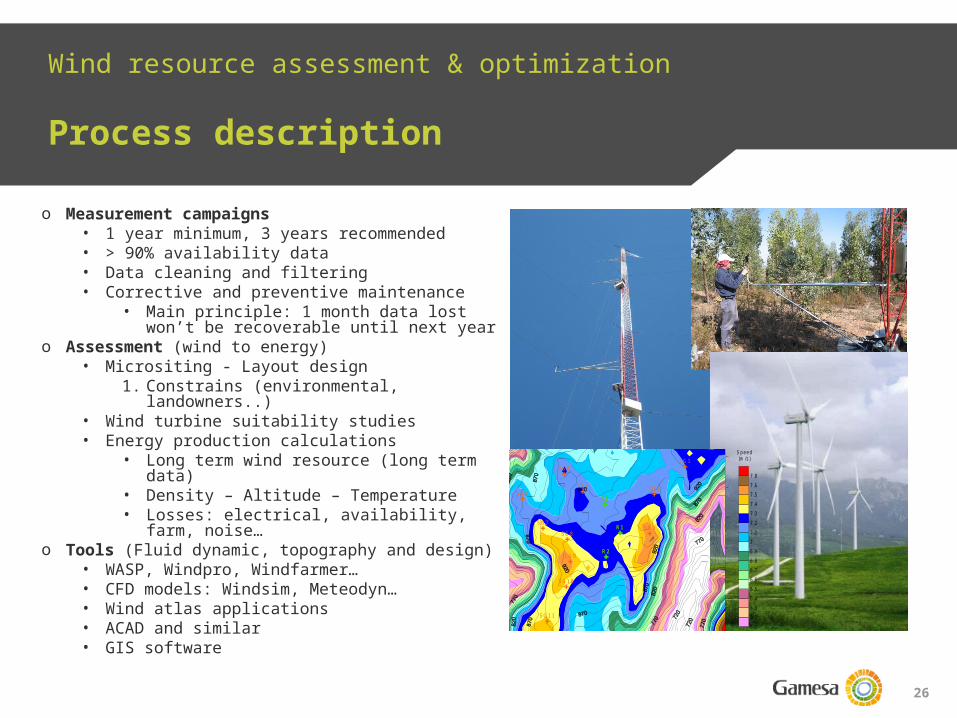
Process description
o Measurement campaigns• 1 year minimum, 3 years recommended• > 90% availability data• Data cleaning and filtering• Corrective and preventive maintenance
• Main principle: 1 month data lost won’t be recoverable until next year
o Assessment (wind to energy) • Micrositing - Layout design
1. Constrains (environmental, landowners..)• Wind turbine suitability studies• Energy production calculations
• Long term wind resource (long term data)
• Density – Altitude – Temperature• Losses: electrical, availability, farm,
noise…o Tools (Fluid dynamic, topography and design)
• WASP, Windpro, Windfarmer…• CFD models: Windsim, Meteodyn…• Wind atlas applications• ACAD and similar • GIS software
632000 632500 633000 633500 634000 634500 635000 635500
4524
000
4524
500
4525
000
4525
500
4526
000
4526
500
4527
000
SG1
SG2
SG3
SG4
SG5
SG6
SG7SG8
SG9
SG10
SG11
SG12
R1
R2
R3
R1
R2
R3
6.1
6.2
6.3
6.4
6.5
6.6
6.7
6.8
6.9
7
7.1
7.2
7.3
7.4
7.5
7.6
7.8
M ean speed at 120m at S ao G ens area
Speed (m /s)
27
Wind resource assessment & optimization
New technology available: remote sensors
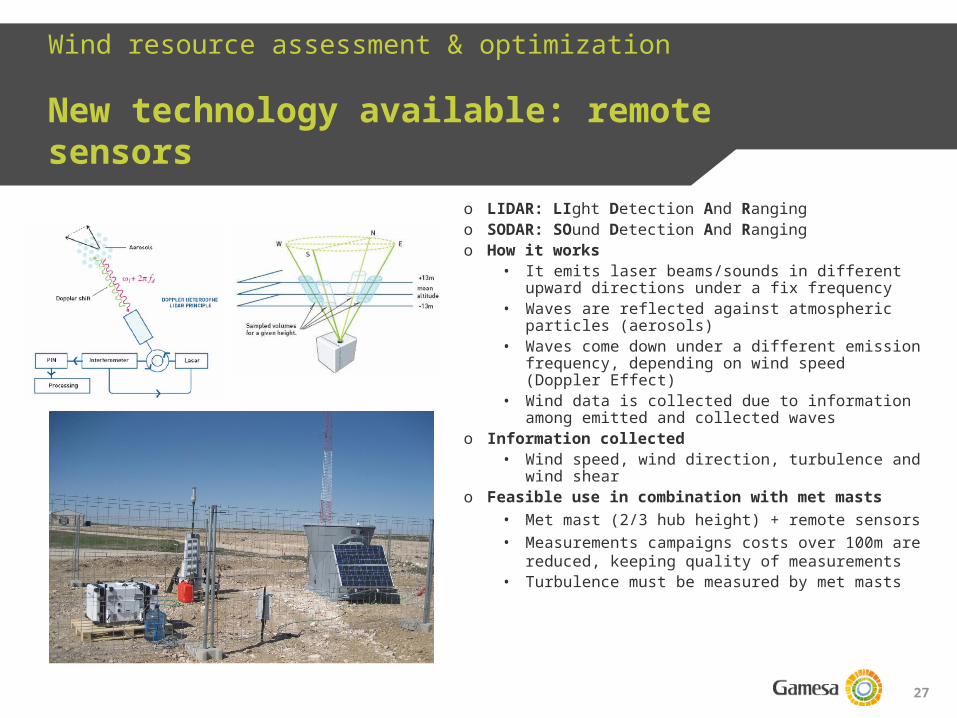
o LIDAR: LIght Detection And Rangingo SODAR: SOund Detection And Rangingo How it works
• It emits laser beams/sounds in different upward directions under a fix frequency
• Waves are reflected against atmospheric particles (aerosols)
• Waves come down under a different emission frequency, depending on wind speed (Doppler Effect)
• Wind data is collected due to information among emitted and collected waves
o Information collected• Wind speed, wind direction, turbulence and
wind shearo Feasible use in combination with met masts
• Met mast (2/3 hub height) + remote sensors• Measurements campaigns costs over 100m
are reduced, keeping quality of measurements• Turbulence must be measured by met masts
28
Wind resource assessment & optimization
Optimization and business approach
IRR G80 G87 G90 OPTIMUM
POSITION
67 m
78 m
67 m
78 m
100m
67 m
78 m
100m
IRR average = 14,3 %
1 7.1 6,9 11.7
14.3 13.6 12.
712.3 13.7 G
8778 m
14.3 %
2 7.2 6,9 12.8
12.8 14.8 15.
813.6 12.8 G
9067 m
15.8 %
3 7.3 7.1 15.1
14.1 13.1 16.
114.8 13.7 G
9067 m
16.1 %
4 7.0 6,8 15.7
15.2 12.2 14.
713.2 13.2 G
8767 m
15.7 %
5 5.6 5.3 7.2 7.9 7.7 6.3 8.5 7.3 G90
78 m 8.5 %
6 6.3 6.1 14.8
18.0 15.0 13.
818.9 16.0 G
9078 m
18.9 %
7 6.8 6.4 9.2 9.7 8.5 8.3 7.7 8.8 G87
78 m 9.7 %
8 7.0 6,2 13.5
14.5 12.5 15.
513.8 14.5 G
9067 m
15.5%
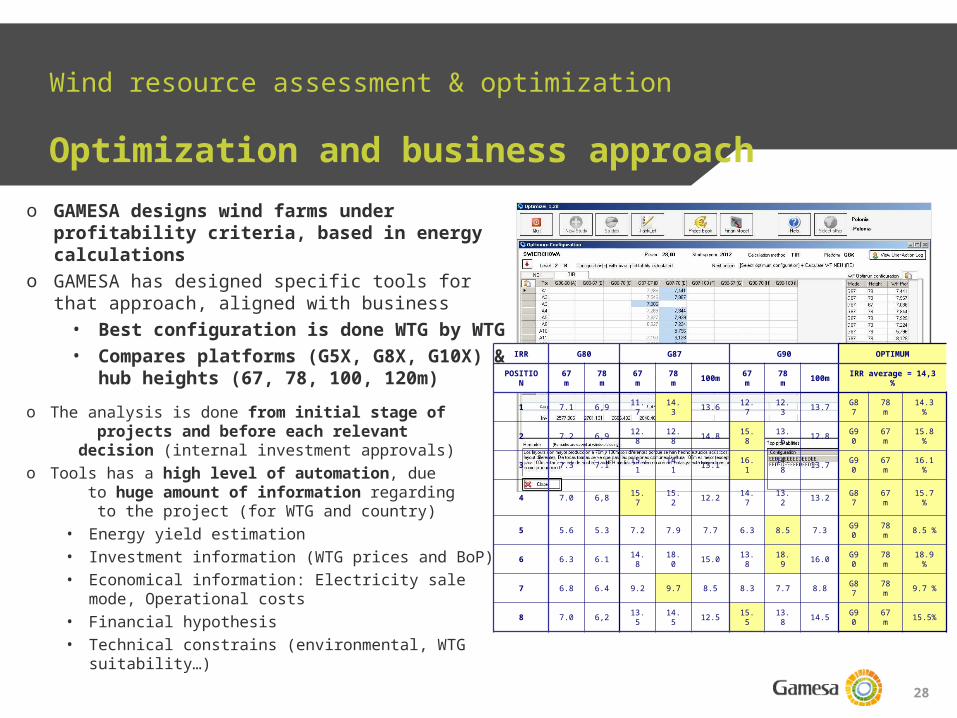
o GAMESA designs wind farms under profitability criteria, based in energy calculations
o GAMESA has designed specific tools for that approach, aligned with business
• Best configuration is done WTG by WTG• Compares platforms (G5X, G8X, G10X) &
hub heights (67, 78, 100, 120m)o The analysis is done from initial stage of
projects and before each relevant decision (internal investment approvals)
o Tools has a high level of automation, due to huge amount of information regarding to the project (for WTG and country)
• Energy yield estimation• Investment information (WTG prices and BoP)• Economical information: Electricity sale mode,
Operational costs• Financial hypothesis• Technical constrains (environmental, WTG
suitability…)
29
The importance of wind resource expertise
o Gamesa introduces maximizing profitability criteria from initial stages of the projects
o Site selection and wind resource assessment are difficult tasks which requires complex computer tools and internal know-how
o Gamesa has the needed internal knowledge and expertise to design internal tools, always improving profitability of projects
o Gamesa invests in knowledge to test new technologies for client support with a business approach
30
Table of contents
1
2
3
4
Business model and value generation alternatives
Gamesa Energía pipeline breakdown and balance sheet value
Accounting and financial modeling
History of Gamesa Energía
5
6
Strategy
Valuation
7
Conclusions8
Financing
31
Accounting and financial modeling
1
2
3 Accounting example
Example of a recent transaction
Cash flow and P&L through the project life
4
Accounting process
32
Accounting rules
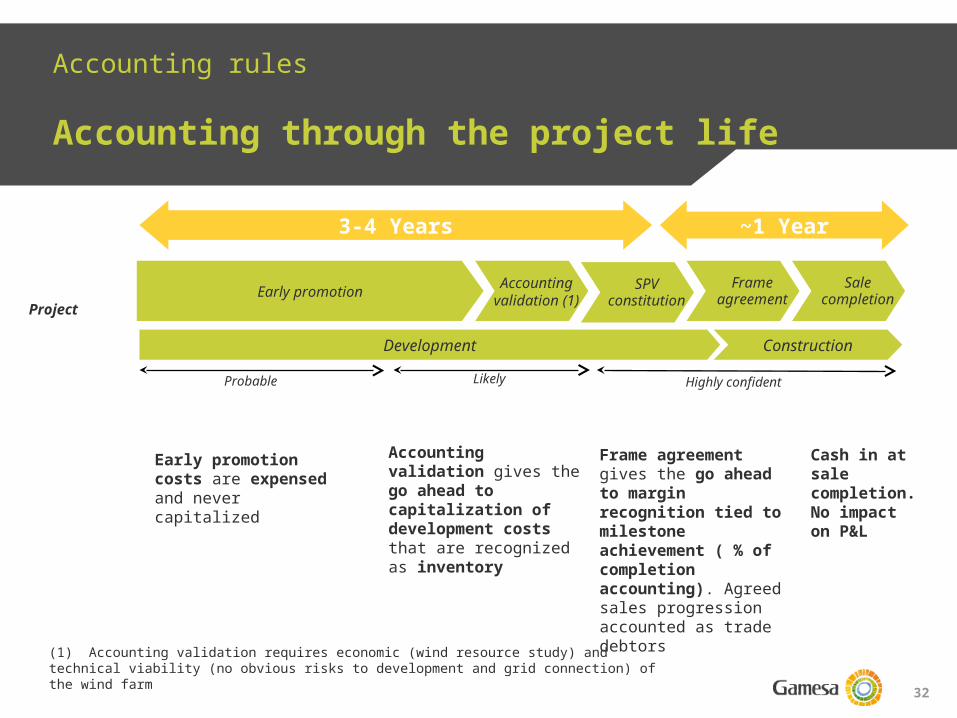
Accounting through the project life
Early promotion costs are expensed and never capitalized
Accounting validation gives the go ahead to capitalization of development costs that are recognized as inventory
Frame agreement gives the go ahead to margin recognition tied to milestone achievement ( % of completion accounting). Agreed sales progression accounted as trade debtors
Cash in at sale completion. No impact on P&L
(1) Accounting validation requires economic (wind resource study) and technical viability (no obvious risks to development and grid connection) of the wind farm
Accounting validation (1)Early promotion
3-4 Years
Project
Probable Likely Highly confident
SPV constitution
Development Construction
Frame agreement
Sale completion
~1 Year
33
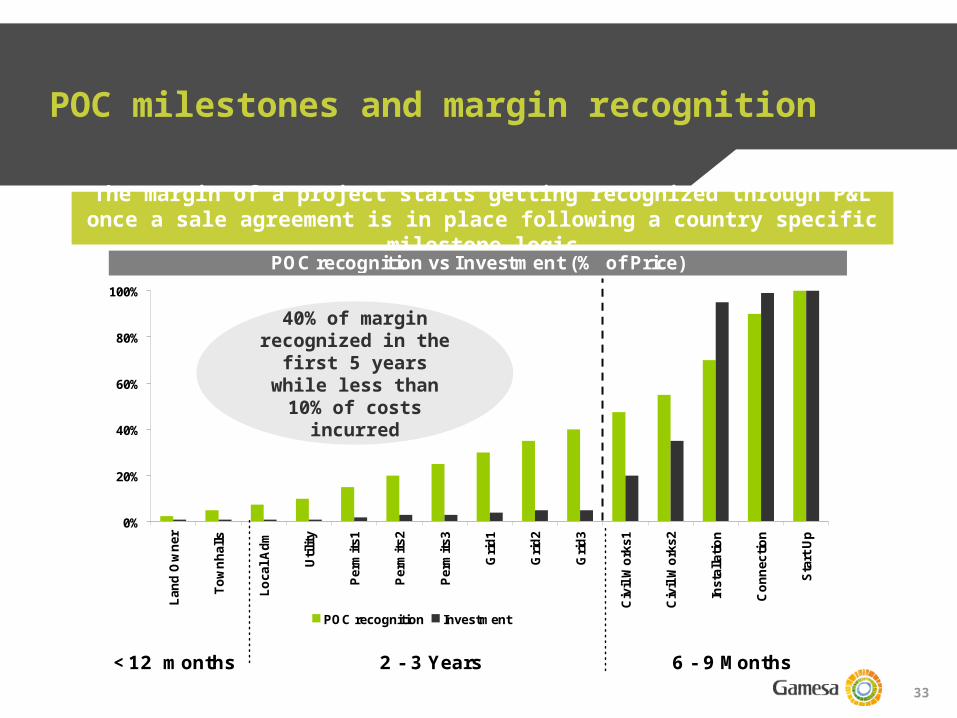
POC milestones and margin recognition
40% of margin recognized in the first 5 years while less than 10% of costs incurred
The margin of a project starts getting recognized through P&L once a sale agreement is in place following a country specific milestone
logic
<12 months
POC recognition vs Investment (% of Price)
2 - 3 Years 6 - 9 Months
0%
20%
40%
60%
80%
100%
Land
Ow
ner
Tow
nhal
ls
Loca
l Adm
Util
ity
Perm
its1
Perm
its2
Perm
its3
Grid
1
Grid
2
Grid
3
Civ
il W
orks
1
Civ
il W
orks
2
Inst
alla
tion
Con
nect
ion
Star
t Up
POC recognition Investment
34
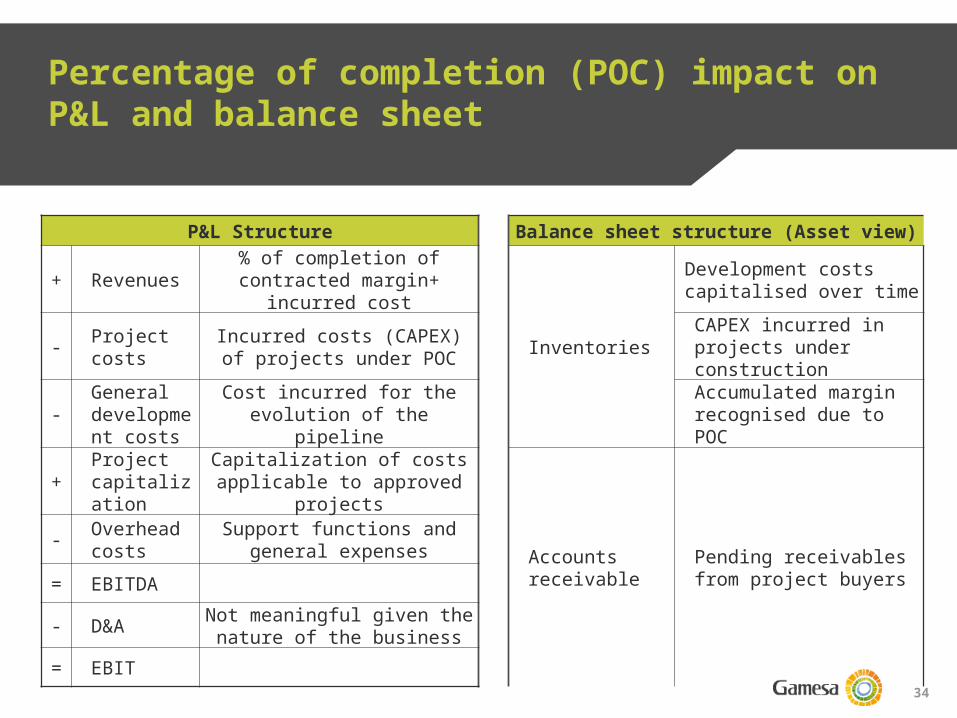
Percentage of completion (POC) impact on P&L and balance sheet
P&L Structure Balance sheet structure (Asset view)
+ Revenues% of completion of
contracted margin+ incurred cost
Inventories
Development costs capitalised over time
- Project costs
Incurred costs (CAPEX) of projects under POC
CAPEX incurred in projects under construction
-General development costs
Cost incurred for the evolution of the pipeline
Accumulated margin recognised due to POC
+Project capitalization
Capitalization of costs applicable to approved
projectsAccounts receivable
Pending receivables from project buyers
- Overhead costs
Support functions and general expenses
= EBITDA- D&A Not meaningful given the
nature of the business= EBIT
35
Accounting and financial modeling
1
2
3 Accounting example
Example of a recent transaction
Cash flow and P&L through the project life
4
Accounting process
36
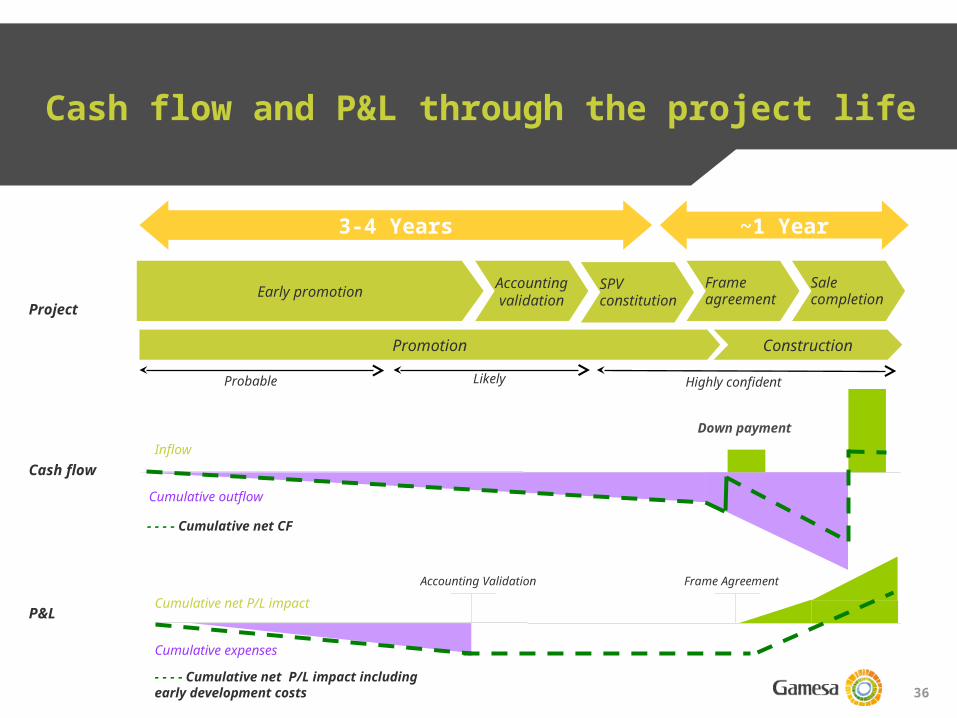
Cash flow and P&L through the project life
Cash flow
P&L
Accounting Validation Frame Agreement
Inflow
Cumulative outflow
Cumulative net P/L impact
Cumulative expenses
Down payment
- - - - Cumulative net CF
Accounting validationEarly promotion
Project
Probable Likely Highly confident
SPV constitution
Promotion Construction
Frame agreement
Sale completion
- - - - Cumulative net P/L impact including early development costs
3-4 Years ~1 Year
37
Accounting and financial modeling
1
2
3 Accounting example
Example of a recent transaction
Cash flow and P&L through the project life
4
Accounting process
38
Accounting example
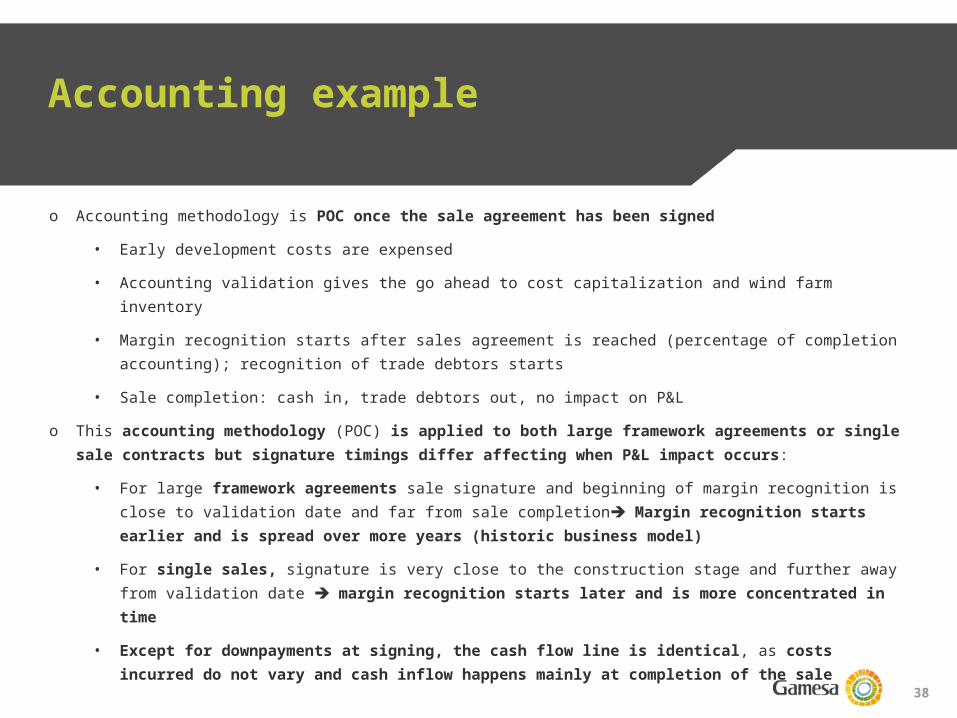
o Accounting methodology is POC once the sale agreement has been signed
• Early development costs are expensed
• Accounting validation gives the go ahead to cost capitalization and wind farm inventory
• Margin recognition starts after sales agreement is reached (percentage of completion accounting); recognition of trade debtors starts
• Sale completion: cash in, trade debtors out, no impact on P&L
o This accounting methodology (POC) is applied to both large framework agreements or single sale contracts but signature timings differ affecting when P&L impact occurs:
• For large framework agreements sale signature and beginning of margin recognition is close to validation date and far from sale completion Margin recognition starts earlier and is spread over more years (historic business model)
• For single sales, signature is very close to the construction stage and further away from validation date margin recognition starts later and is more concentrated in time
• Except for downpayments at signing, the cash flow line is identical, as costs incurred do not vary and cash inflow happens mainly at completion of the sale
39
X
Accounting examples
1 2 3 4 5 6
Single saleFramework sale
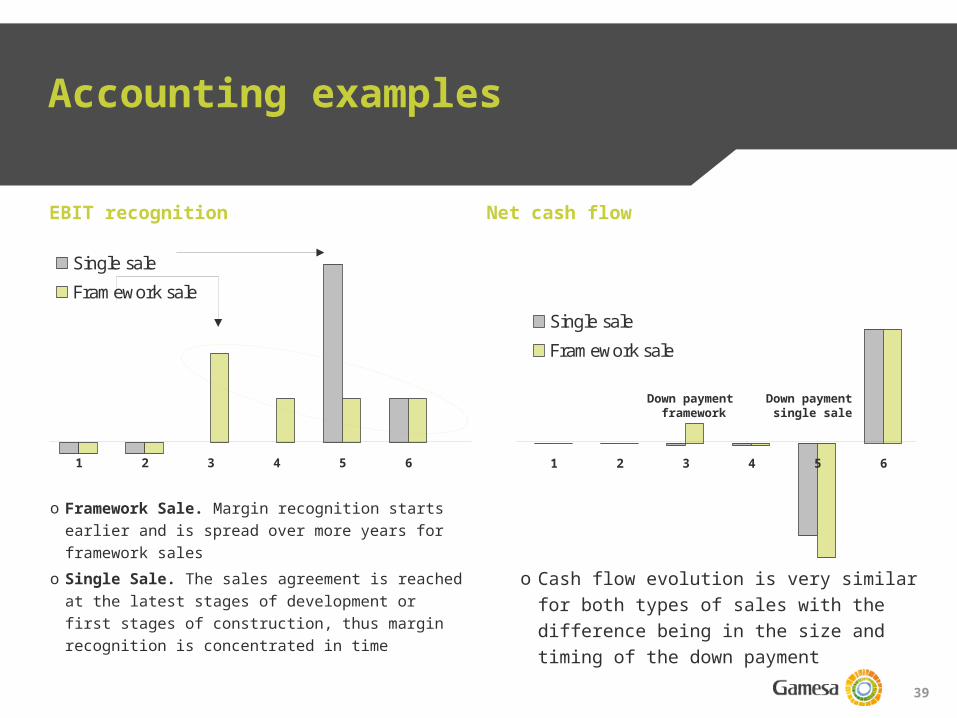
EBIT recognition
o Framework Sale. Margin recognition starts earlier and is spread over more years for framework sales
o Single Sale. The sales agreement is reached at the latest stages of development or first stages of construction, thus margin recognition is concentrated in time
1 2 3 4 5 6
Single saleFramework sale
Net cash flow
o Cash flow evolution is very similar for both types of sales with the difference being in the size and timing of the down payment
X
xx
Down payment framework
Down payment single sale
40
Accounting example of a framework agreement
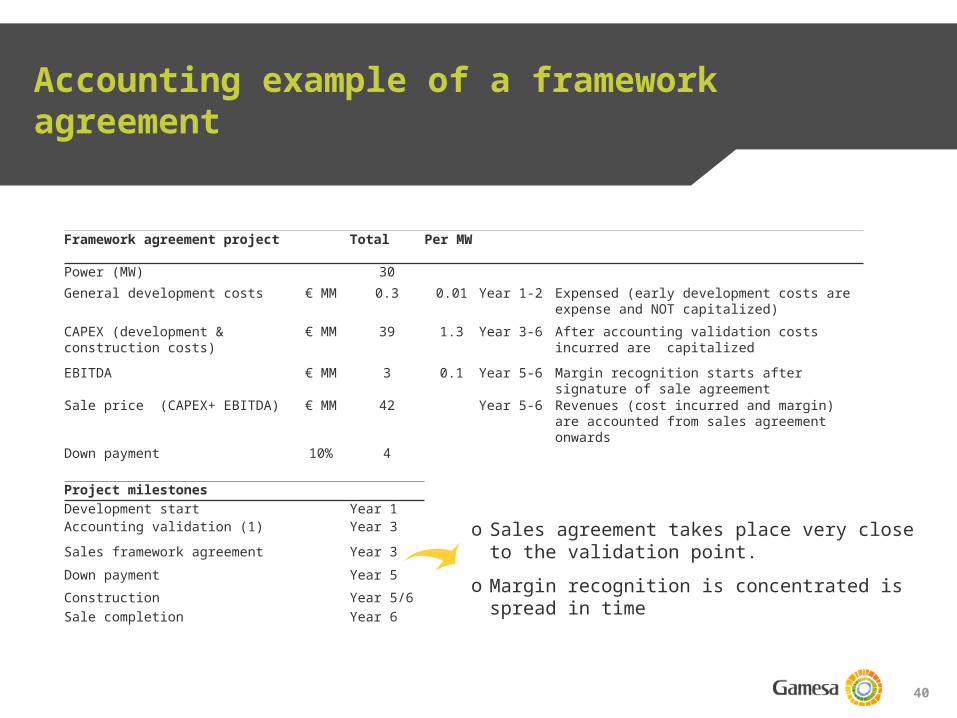
Framework agreement project Total Per MW
Power (MW) 30General development costs € MM 0.3 0.01 Year 1-2 Expensed (early development costs are
expense and NOT capitalized)CAPEX (development & construction costs)
€ MM 39 1.3 Year 3-6 After accounting validation costs incurred are capitalized
EBITDA € MM 3 0.1 Year 5-6 Margin recognition starts after signature of sale agreement
Sale price (CAPEX+ EBITDA) € MM 42 Year 5-6 Revenues (cost incurred and margin) are accounted from sales agreement onwards
Down payment 10% 4
Project milestonesDevelopment start Year 1Accounting validation (1) Year 3Sales framework agreement Year 3Down payment Year 5Construction Year 5/6Sale completion Year 6
o Sales agreement takes place very close to the validation point.
o Margin recognition is concentrated is spread in time
41
Accounting example frame agreements
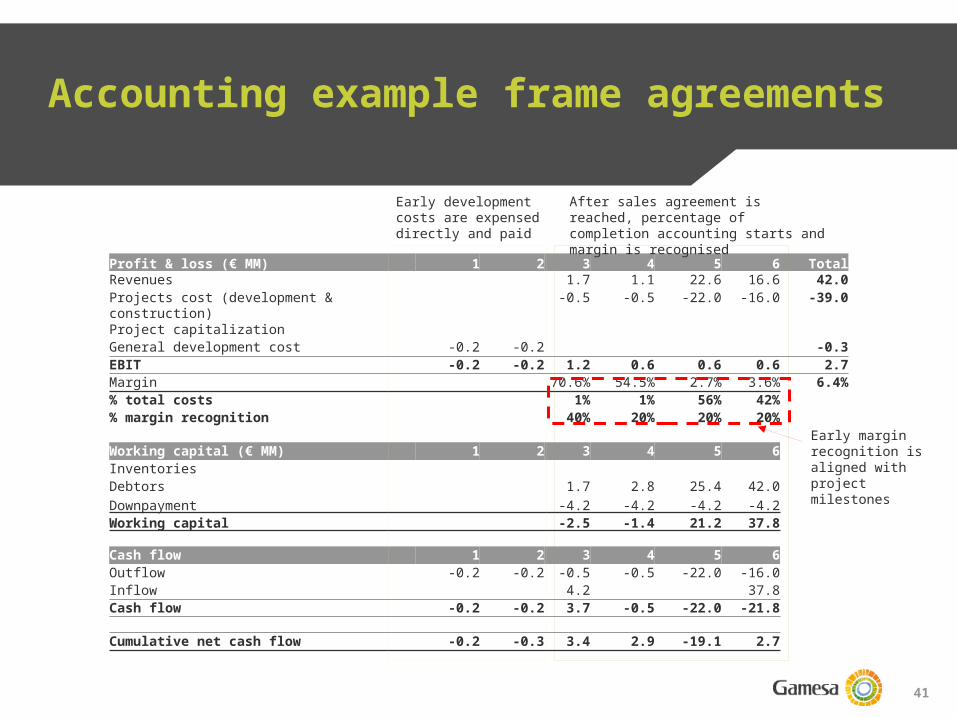
Profit & loss (€ MM) 1 2 3 4 5 6 TotalRevenues 1.7 1.1 22.6 16.6 42.0Projects cost (development & construction) -0.5 -0.5 -22.0 -16.0 -39.0Project capitalizationGeneral development cost -0.2 -0.2 -0.3EBIT -0.2 -0.2 1.2 0.6 0.6 0.6 2.7Margin 70.6% 54.5% 2.7% 3.6% 6.4%% total costs 1% 1% 56% 42%% margin recognition 40% 20% 20% 20%
Working capital (€ MM) 1 2 3 4 5 6InventoriesDebtors 1.7 2.8 25.4 42.0Downpayment -4.2 -4.2 -4.2 -4.2Working capital -2.5 -1.4 21.2 37.8
Cash flow 1 2 3 4 5 6Outflow -0.2 -0.2 -0.5 -0.5 -22.0 -16.0Inflow 4.2 37.8Cash flow -0.2 -0.2 3.7 -0.5 -22.0 -21.8
Cumulative net cash flow -0.2 -0.3 3.4 2.9 -19.1 2.7
Early development costs are expensed directly and paid
After sales agreement is reached, percentage of completion accounting starts and margin is recognised
Early margin recognition is aligned with project milestones
42
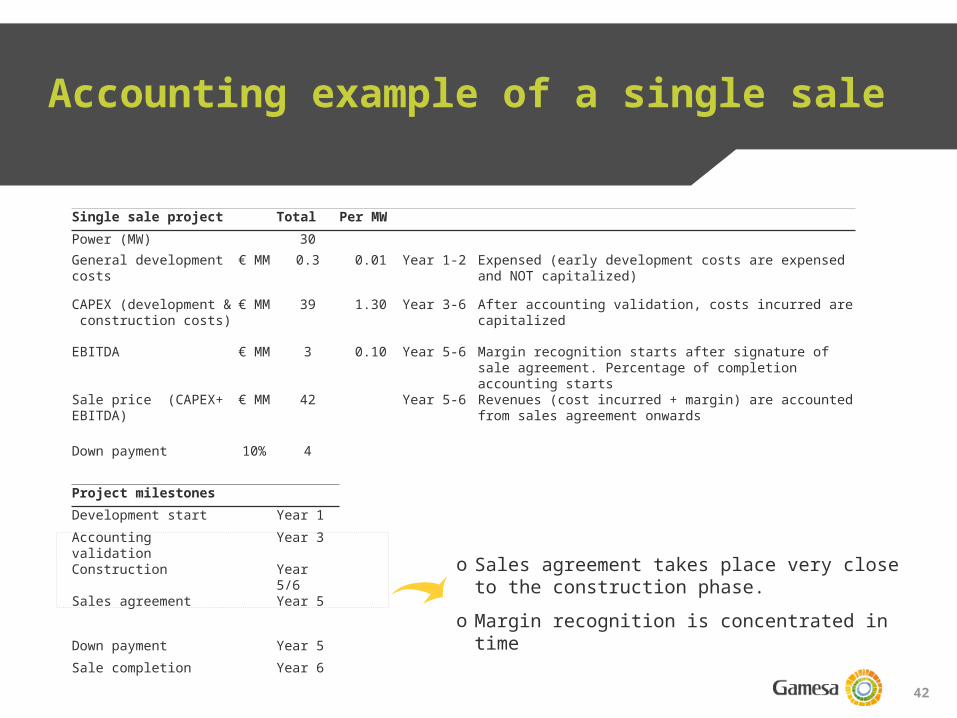
Accounting example of a single sale
Single sale project Total Per MWPower (MW) 30General development costs
€ MM 0.3 0.01 Year 1-2 Expensed (early development costs are expensed and NOT capitalized)
CAPEX (development & construction costs)
€ MM 39 1.30 Year 3-6 After accounting validation, costs incurred are capitalized
EBITDA € MM 3 0.10 Year 5-6 Margin recognition starts after signature of sale agreement. Percentage of completion accounting starts
Sale price (CAPEX+ EBITDA)
€ MM 42 Year 5-6 Revenues (cost incurred + margin) are accounted from sales agreement onwards
Down payment 10% 4
Project milestonesDevelopment start Year 1Accounting validation Year 3Construction Year 5/6Sales agreement Year 5
Down payment Year 5Sale completion Year 6
o Sales agreement takes place very close to the construction phase.
o Margin recognition is concentrated in time
43
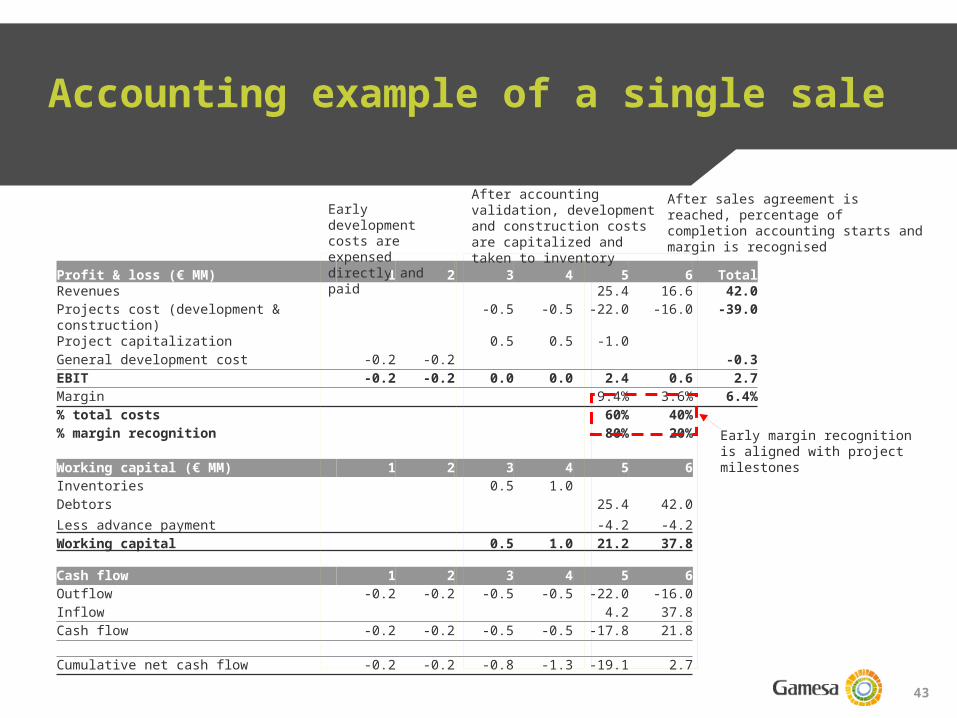
Accounting example of a single sale
Profit & loss (€ MM) 1 2 3 4 5 6 TotalRevenues 25.4 16.6 42.0Projects cost (development & construction)
-0.5 -0.5 -22.0 -16.0 -39.0
Project capitalization 0.5 0.5 -1.0General development cost -0.2 -0.2 -0.3EBIT -0.2 -0.2 0.0 0.0 2.4 0.6 2.7Margin 9.4% 3.6% 6.4%% total costs 60% 40%% margin recognition 80% 20%
Working capital (€ MM) 1 2 3 4 5 6Inventories 0.5 1.0Debtors 25.4 42.0Less advance payment -4.2 -4.2Working capital 0.5 1.0 21.2 37.8
Cash flow 1 2 3 4 5 6Outflow -0.2 -0.2 -0.5 -0.5 -22.0 -16.0Inflow 4.2 37.8Cash flow -0.2 -0.2 -0.5 -0.5 -17.8 21.8
Cumulative net cash flow -0.2 -0.2 -0.8 -1.3 -19.1 2.7
Early development costs are expensed directly and paid
After accounting validation, development and construction costs are capitalized and taken to inventory
After sales agreement is reached, percentage of completion accounting starts and margin is recognised
Early margin recognition is aligned with project milestones
44
Accounting and financial modeling
1
2
3 Accounting example
Example of a recent transaction
Cash flow and P&L through the project life
4
Accounting process
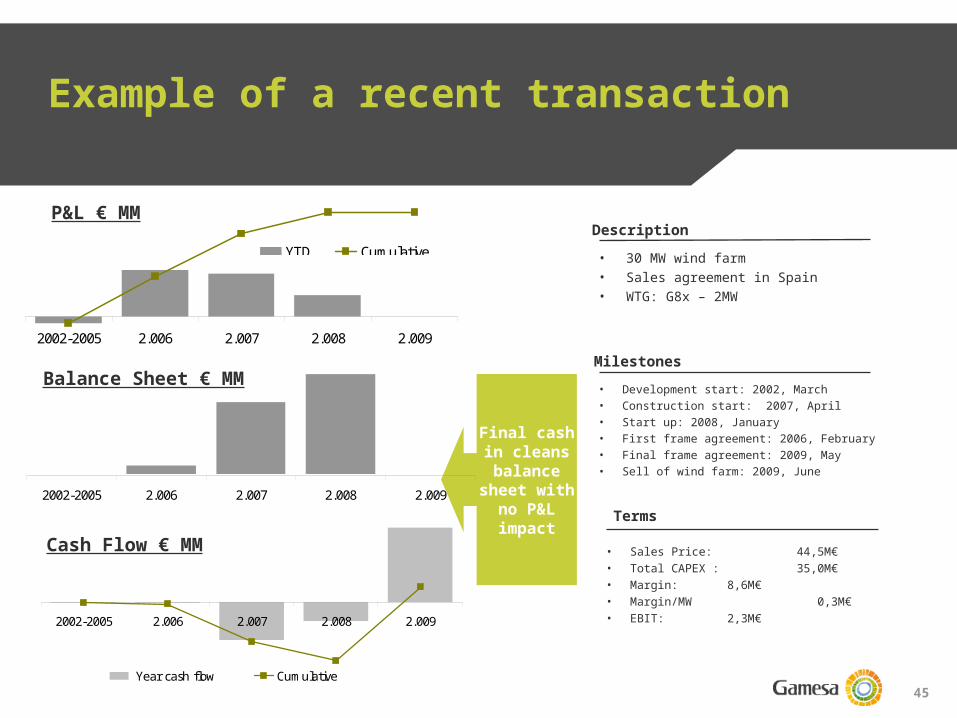
45
Final cash in cleans balance
sheet with no P&L impact
Example of a recent transaction
2002-2005 2.006 2.007 2.008 2.009
YTD Cumulative
2002-2005 2.006 2.007 2.008 2.009
Year cash flow Cumulative
• 30 MW wind farm• Sales agreement in Spain• WTG: G8x – 2MW
Description
Milestones• Development start: 2002, March• Construction start: 2007, April• Start up: 2008, January• First frame agreement: 2006, February• Final frame agreement: 2009, May• Sell of wind farm: 2009, June
Terms
• Sales Price: 44,5M€• Total CAPEX : 35,0M€• Margin: 8,6M€• Margin/MW 0,3M€• EBIT: 2,3M€
2002-2005 2.006 2.007 2.008 2.009
Cash Flow € MM
P&L € MM
Balance Sheet € MM
46
Table of contents
1
2
3
4
Business model and value generation alternatives
Gamesa Energía pipeline breakdown and balance sheet value
Accounting and financial modeling
History of Gamesa Energía
5
6
Strategy
Valuation
7
Conclusions8
Financing
47
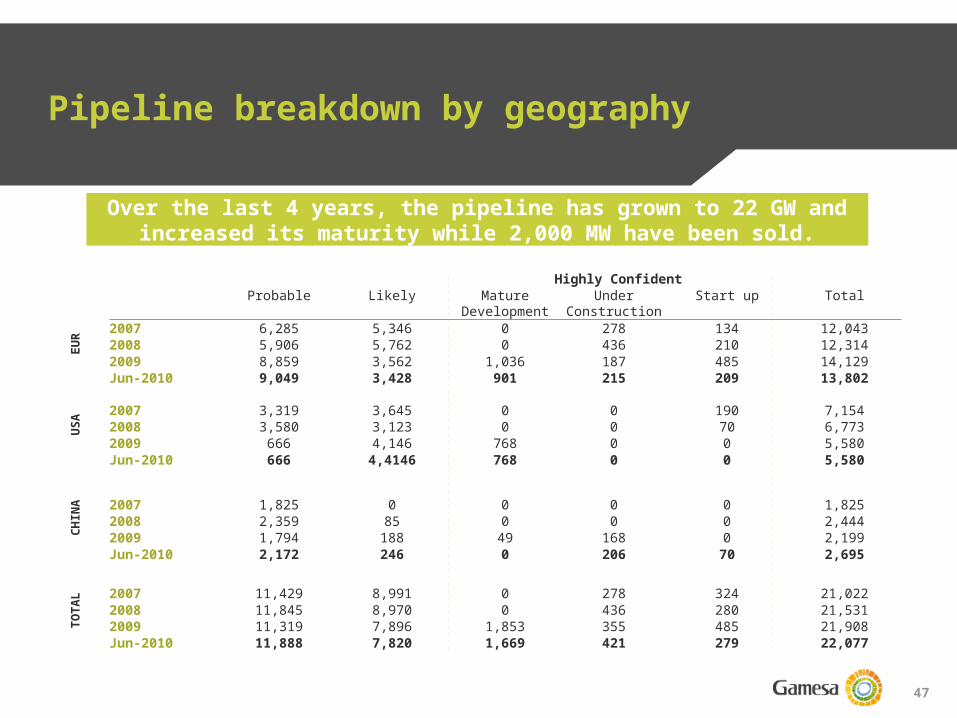
Pipeline breakdown by geography
Highly ConfidentProbable Likely Mature
DevelopmentUnder
ConstructionStart up Total
2007 6,285 5,346 0 278 134 12,0432008 5,906 5,762 0 436 210 12,3142009 8,859 3,562 1,036 187 485 14,129Jun-2010 9,049 3,428 901 215 209 13,802
2007 3,319 3,645 0 0 190 7,1542008 3,580 3,123 0 0 70 6,7732009 666 4,146 768 0 0 5,580Jun-2010 666 4,4146 768 0 0 5,580
2007 1,825 0 0 0 0 1,8252008 2,359 85 0 0 0 2,4442009 1,794 188 49 168 0 2,199Jun-2010 2,172 246 0 206 70 2,695
2007 11,429 8,991 0 278 324 21,0222008 11,845 8,970 0 436 280 21,5312009 11,319 7,896 1,853 355 485 21,908Jun-2010 11,888 7,820 1,669 421 279 22,077
EUR
CHIN
AU
SATO
TAL
Over the last 4 years, the pipeline has grown to 22 GW and increased its maturity while 2,000 MW have been sold.
48
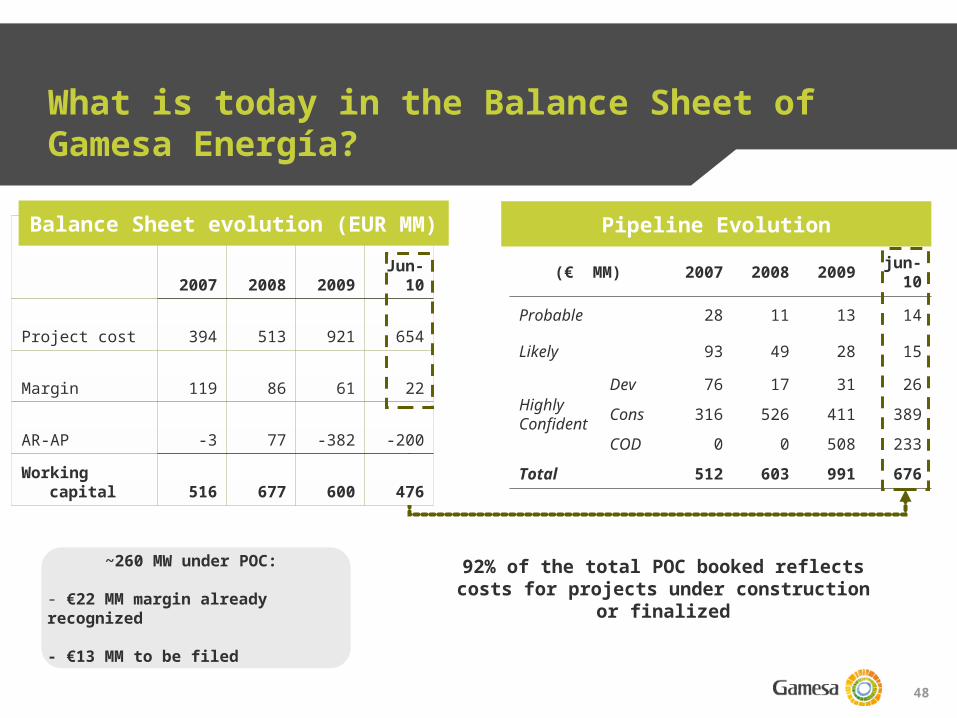
What is today in the Balance Sheet of Gamesa Energía?
2007 2008 2009
Jun-10
Project cost 394 513 921 654
Margin 119 86 61 22
AR-AP -3 77 -382 -200Working
capital 516 677 600 476
Balance Sheet evolution (EUR MM) Pipeline Evolution
(€ MM) 2007 2008 2009 jun-10
Probable 28 11 13 14
Likely 93 49 28 15
Highly Confident
Dev 76 17 31 26Cons 316 526 411 389COD 0 0 508 233
Total 512 603 991 676
92% of the total POC booked reflects costs for projects under construction or
finalized
~260 MW under POC:
- €22 MM margin already recognized
- €13 MM to be filed
49
Table of contents
1
2
3
4
Business model and value generation alternatives
Gamesa Energía pipeline description and evolution
Accounting and financial modeling
History of Gamesa Energía
5
6
Strategy
Valuation
7
Conclusions8
Financing
50
Gamesa Energia strategy
Integration vs. pure play1
2
3
4 Agreement with Iberdrola Renovables
Value creation opportunities
Strategy by geographic area
51
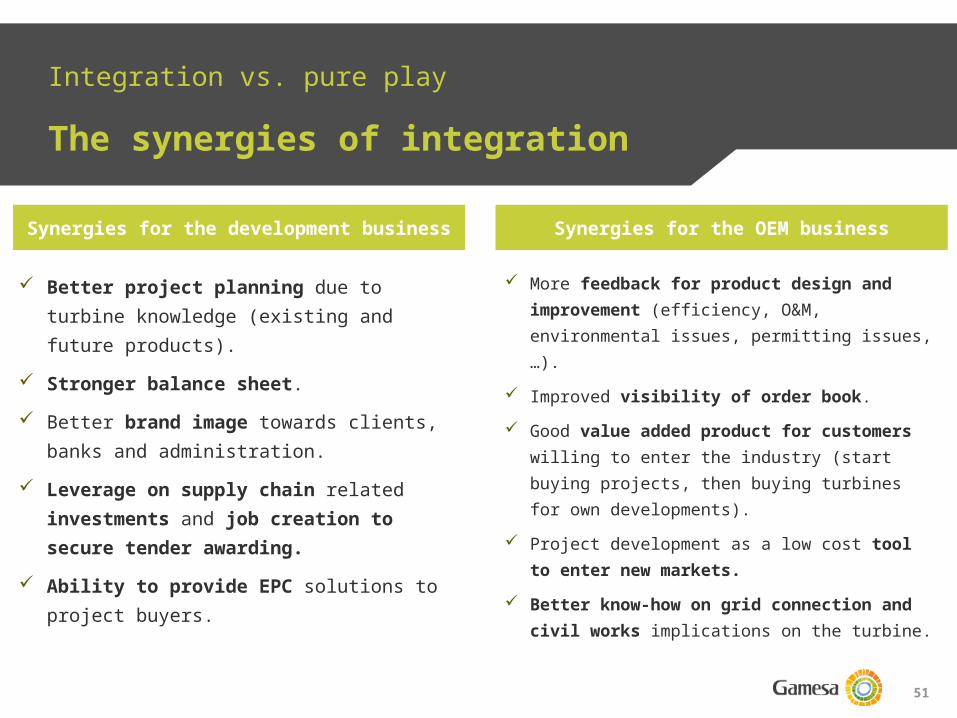
Integration vs. pure play
The synergies of integration
Synergies for the development business Synergies for the OEM business
Better project planning due to turbine knowledge (existing and future products).
Stronger balance sheet. Better brand image towards clients, banks
and administration. Leverage on supply chain related
investments and job creation to secure tender awarding.
Ability to provide EPC solutions to project buyers.
More feedback for product design and improvement (efficiency, O&M, environmental issues, permitting issues, …).
Improved visibility of order book. Good value added product for
customers willing to enter the industry (start buying projects, then buying turbines for own developments).
Project development as a low cost tool to enter new markets.
Better know-how on grid connection and civil works implications on the turbine.

52
Gamesa Energia strategy
Integration vs. pure play1
2
3
4 Agreement with Iberdrola Renovables
Value creation opportunities
Strategy by geographic area
53
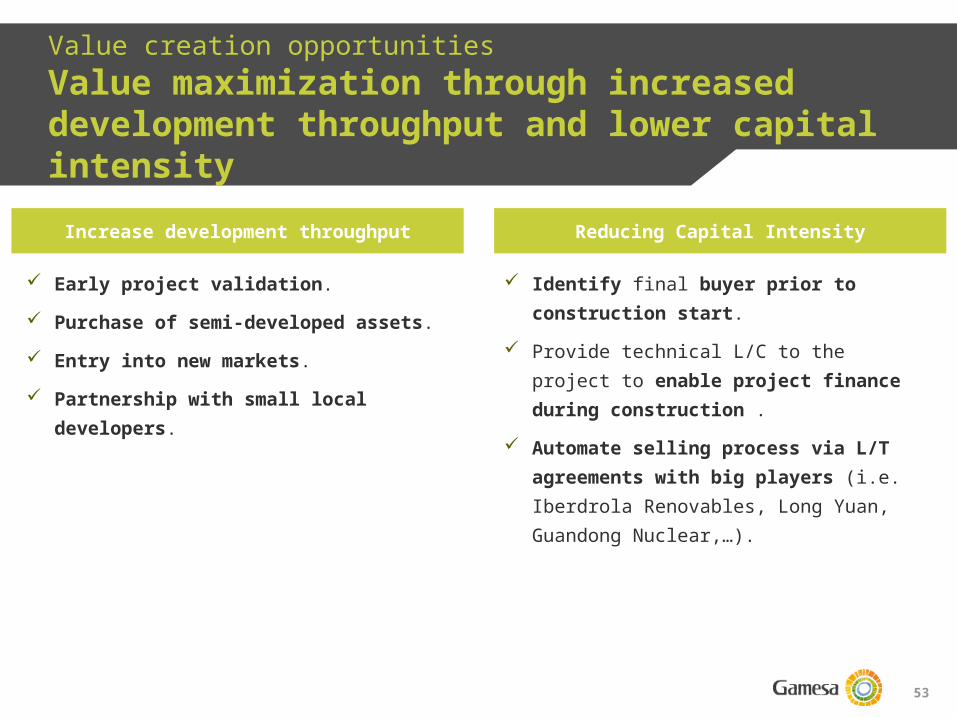
Value creation opportunitiesValue maximization through increased development throughput and lower capital intensityIncrease development throughput Reducing Capital Intensity
Early project validation. Purchase of semi-developed assets. Entry into new markets. Partnership with small local
developers.
Identify final buyer prior to construction start.
Provide technical L/C to the project to enable project finance during construction .
Automate selling process via L/T agreements with big players (i.e. Iberdrola Renovables, Long Yuan, Guandong Nuclear,…).
54
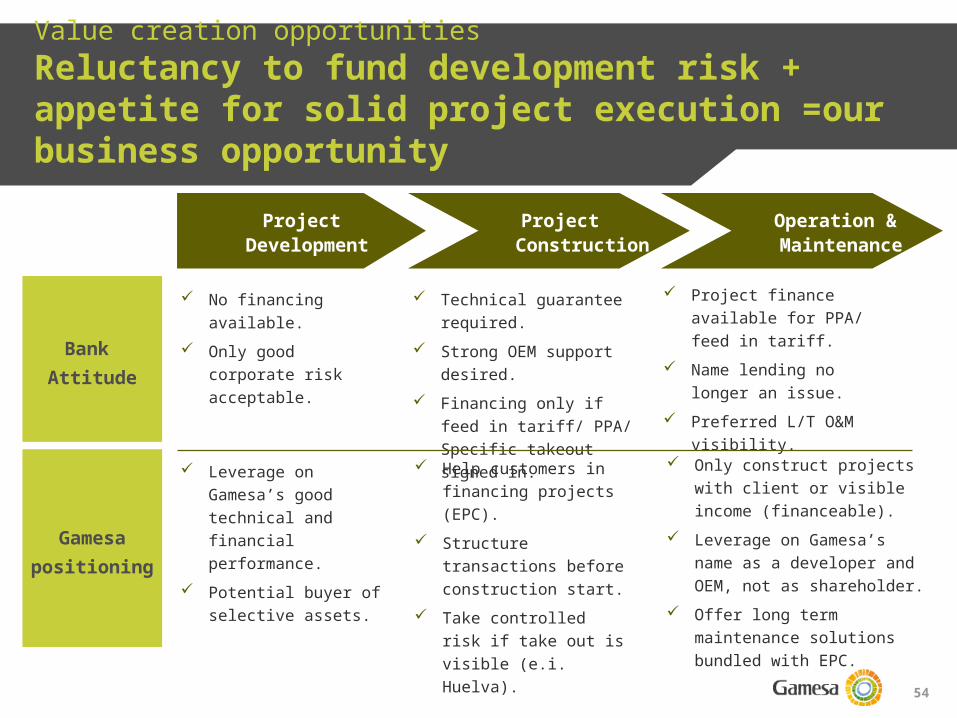
Value creation opportunitiesReluctancy to fund development risk + appetite for solid project execution =our business opportunity
No financing available.
Only good corporate risk acceptable.
Project Development
Project Construction
Bank Attitude
Gamesapositioning
Operation & Maintenance
Leverage on Gamesa’s good technical and financial performance.
Potential buyer of selective assets.
Technical guarantee required.
Strong OEM support desired.
Financing only if feed in tariff/ PPA/ Specific takeout signed in.
Project finance available for PPA/ feed in tariff.
Name lending no longer an issue.
Preferred L/T O&M visibility.
Help customers in financing projects (EPC).
Structure transactions before construction start.
Take controlled risk if take out is visible (e.i. Huelva).
Only construct projects with client or visible income (financeable).
Leverage on Gamesa’s name as a developer and OEM, not as shareholder.
Offer long term maintenance solutions bundled with EPC.

55
Gamesa Energia strategy
Integration vs. pure play1
2
3
4 Agreement with Iberdrola Renovables
Value creation opportunities
Strategy by geographic area
56
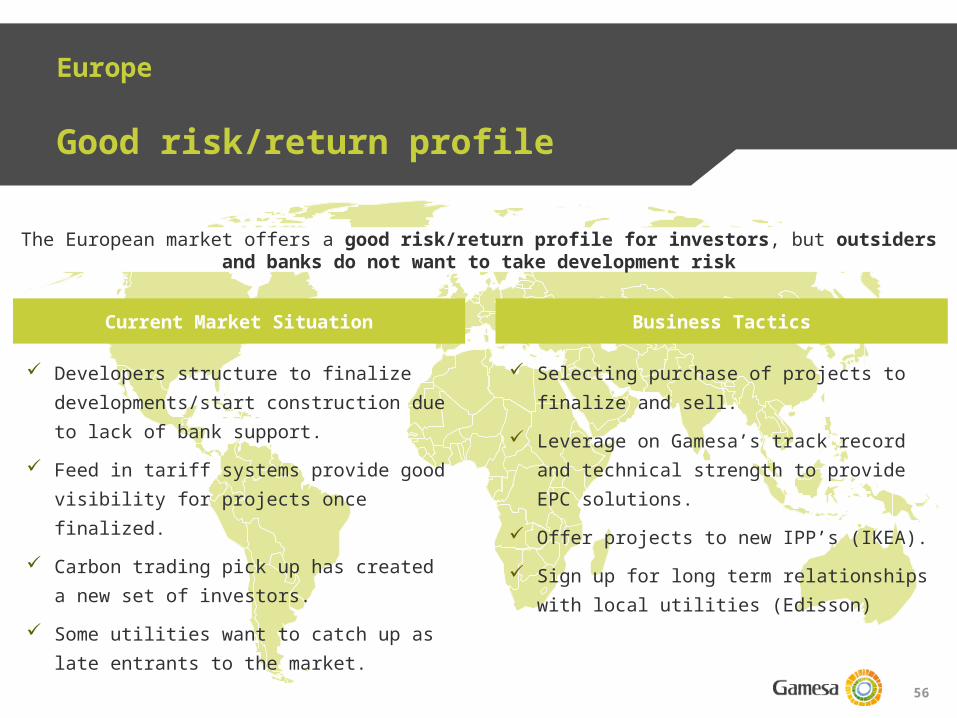
Europe
Good risk/return profile
Current Market Situation Business Tactics
Developers structure to finalize developments/start construction due to lack of bank support.
Feed in tariff systems provide good visibility for projects once finalized.
Carbon trading pick up has created a new set of investors.
Some utilities want to catch up as late entrants to the market.
Selecting purchase of projects to finalize and sell.
Leverage on Gamesa’s track record and technical strength to provide EPC solutions.
Offer projects to new IPP’s (IKEA). Sign up for long term relationships with
local utilities (Edisson)
The European market offers a good risk/return profile for investors, but outsiders and banks do not want to take development risk

57
USA
PPAs are the key challenge
Current Market Situation Business Tactics
Low cost of Natural Gas keeps power prices low to historical levels.
A significant amount of developers are struggling due to lack of financing.
Utilities still lacking green assets to achieve RPS required levels.
Cash grant expires in December 2010.
Accelerate development in areas of high energy consumptions (higher energy prices).
Selecting project acquisition to speed up development.
Approach utilities looking to purchase projects to own and operate (no need for PPA).
Start construction of feasible projects during 2010.
The key challenge is finding acceptable PPAs to make projects appealing for the financing banks
58
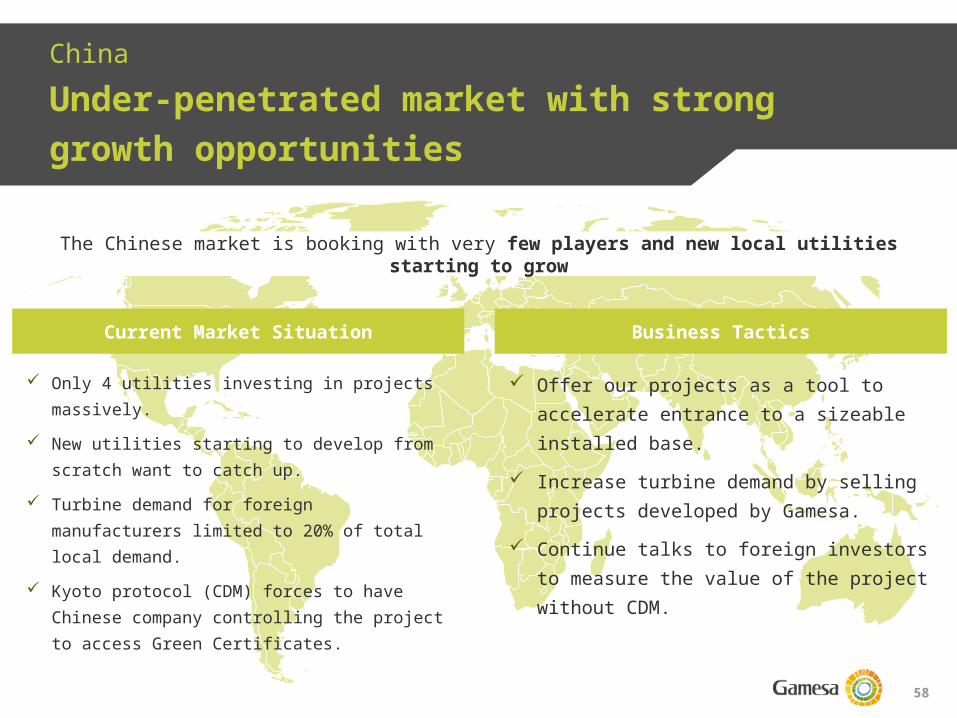
ChinaUnder-penetrated market with strong growth opportunities
Current Market Situation Business Tactics
Only 4 utilities investing in projects massively.
New utilities starting to develop from scratch want to catch up.
Turbine demand for foreign manufacturers limited to 20% of total local demand.
Kyoto protocol (CDM) forces to have Chinese company controlling the project to access Green Certificates.
Offer our projects as a tool to accelerate entrance to a sizeable installed base.
Increase turbine demand by selling projects developed by Gamesa.
Continue talks to foreign investors to measure the value of the project without CDM.
The Chinese market is booking with very few players and new local utilities starting to grow
59
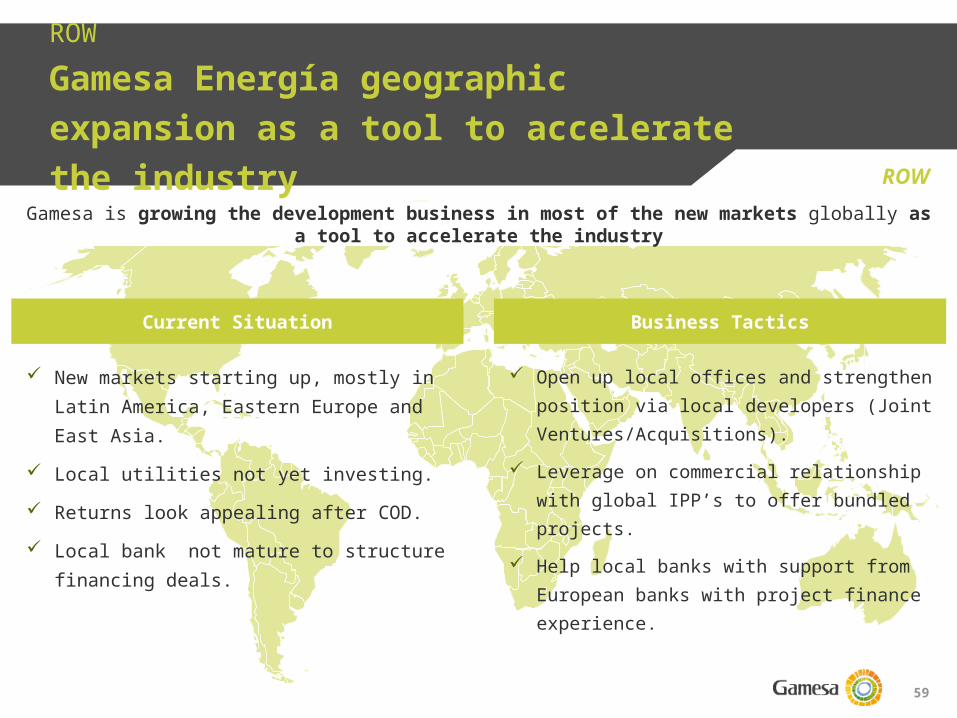
ROWGamesa Energía geographic expansion as a tool to accelerate the industry ROW
Current Situation Business Tactics
New markets starting up, mostly in Latin America, Eastern Europe and East Asia.
Local utilities not yet investing. Returns look appealing after COD. Local bank not mature to structure
financing deals.
Open up local offices and strengthen position via local developers (Joint Ventures/Acquisitions).
Leverage on commercial relationship with global IPP’s to offer bundled projects.
Help local banks with support from European banks with project finance experience.
Gamesa is growing the development business in most of the new markets globally as a tool to accelerate the industry
60
Gamesa Energia strategy
Integration vs. pure play1
2
3
4 Agreement with Iberdrola Renovables
Value creation opportunities
Strategy by geographic area
61
Agreement with IBR
The basic facts
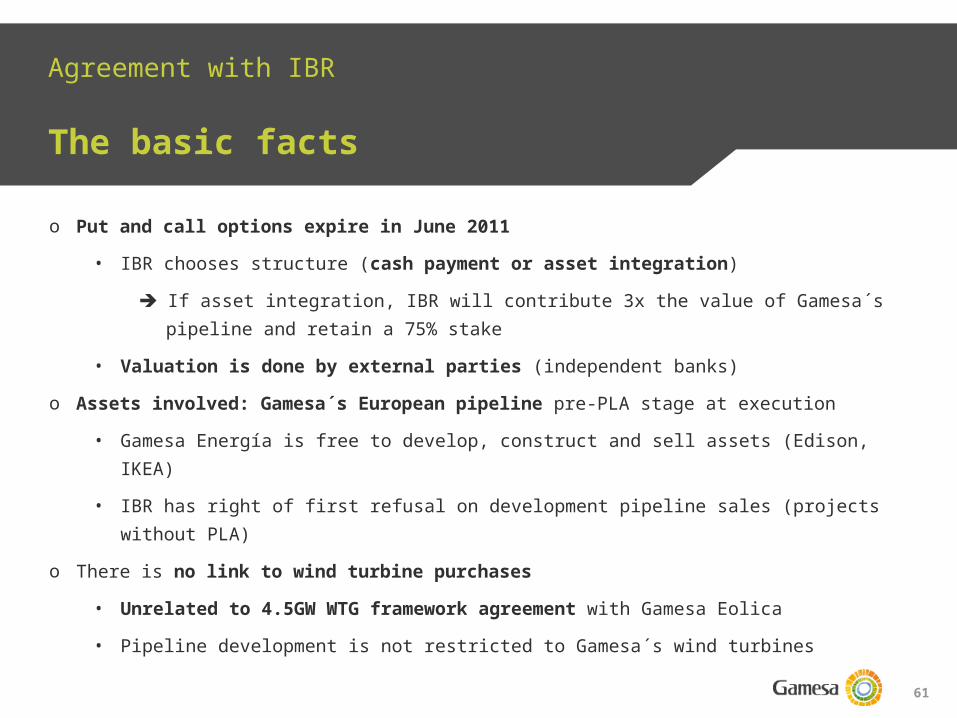
o Put and call options expire in June 2011
• IBR chooses structure (cash payment or asset integration) If asset integration, IBR will contribute 3x the value of Gamesa´s pipeline and
retain a 75% stake• Valuation is done by external parties (independent banks)
o Assets involved: Gamesa´s European pipeline pre-PLA stage at execution• Gamesa Energía is free to develop, construct and sell assets (Edison, IKEA)• IBR has right of first refusal on development pipeline sales (projects without PLA)
o There is no link to wind turbine purchases
• Unrelated to 4.5GW WTG framework agreement with Gamesa Eolica• Pipeline development is not restricted to Gamesa´s wind turbines
62
Agreement with IBR
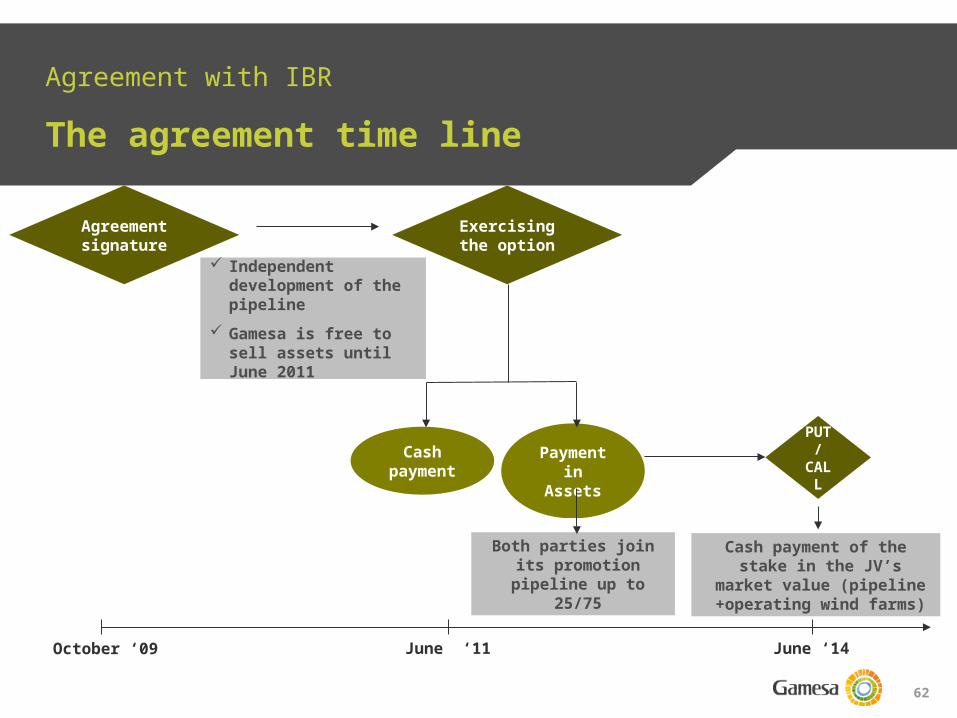
The agreement time line
June ‘11October ‘09 June ‘14
Agreement
signatureExercising the option
PUT /
CALL
Cash payment of the stake in the JV’s market
value (pipeline +operating wind farms)
Payment in Assets
Independent development of the pipeline
Gamesa is free to sell assets until June 2011
Both parties join its promotion pipeline
up to 25/75
Cash payment
63
Table of contents
1
2
3
4
Business model and value generation alternatives
Gamesa Energía pipeline description and evolution
Accounting and financial modelling
History of Gamesa Energía
5
6
Strategy
Valuation
7
Conclusions8
Financing
64
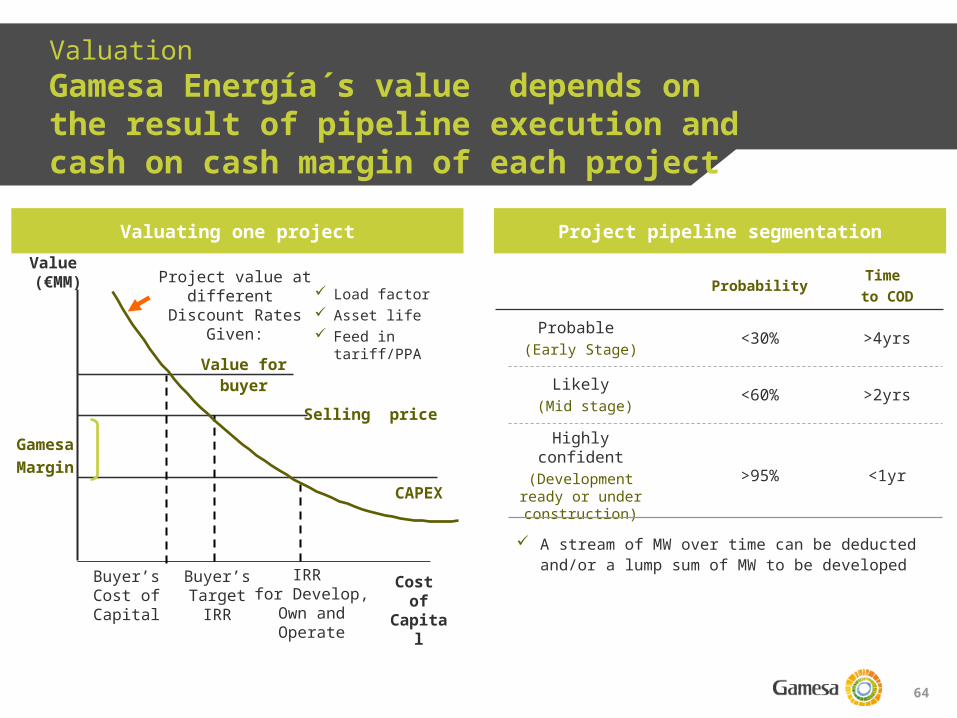
Probability Time to COD
Probable (Early Stage) <30% >4yrs
Likely (Mid stage) <60% >2yrs
Highly confident(Development ready
or under construction)
>95% <1yr
ValuationGamesa Energía´s value depends on the result of pipeline execution and cash on cash margin of each project
Valuating one project Project pipeline segmentation
A stream of MW over time can be deducted and/or a lump sum of MW to be developedBuyer’s
Cost ofCapital
Buyer’sTarget
IRR
IRR for Develop,
Own and Operate
Cost of
Capital
Project value at different
Discount Rates Given:
Selling price
CAPEX
Value forbuyer
Value (€MM)
Load factor Asset life Feed in tariff/PPA
GamesaMargin
65
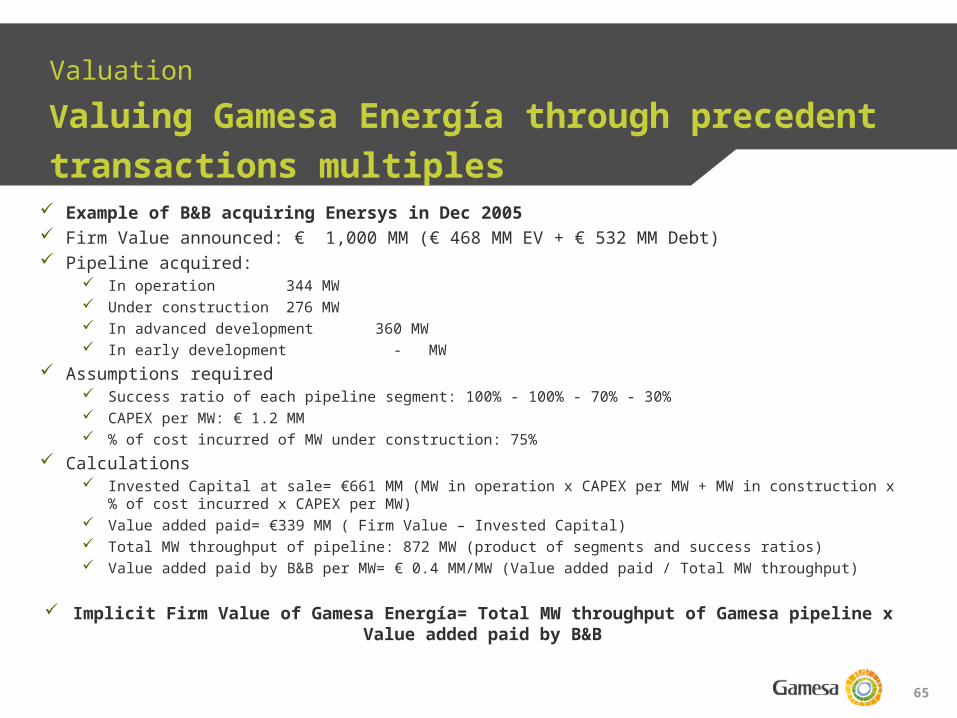
ValuationValuing Gamesa Energía through precedent transactions multiples
Example of B&B acquiring Enersys in Dec 2005 Firm Value announced: € 1,000 MM (€ 468 MM EV + € 532 MM Debt) Pipeline acquired:
In operation 344 MW Under construction 276 MW In advanced development 360 MW In early development - MW
Assumptions required Success ratio of each pipeline segment: 100% - 100% - 70% - 30% CAPEX per MW: € 1.2 MM % of cost incurred of MW under construction: 75%
Calculations Invested Capital at sale= €661 MM (MW in operation x CAPEX per MW + MW in construction x % of cost
incurred x CAPEX per MW) Value added paid= €339 MM ( Firm Value – Invested Capital) Total MW throughput of pipeline: 872 MW (product of segments and success ratios) Value added paid by B&B per MW= € 0.4 MM/MW (Value added paid / Total MW throughput)
Implicit Firm Value of Gamesa Energía= Total MW throughput of Gamesa pipeline x Value added paid by B&B
66
Table of contents
1
2
3
4
Business model and value generation alternatives
Gamesa Energía pipeline description and evolution
Accounting and financial modelling
History of Gamesa Energía
5
6
Strategy
Valuation
7
Conclusions8
Financing
67
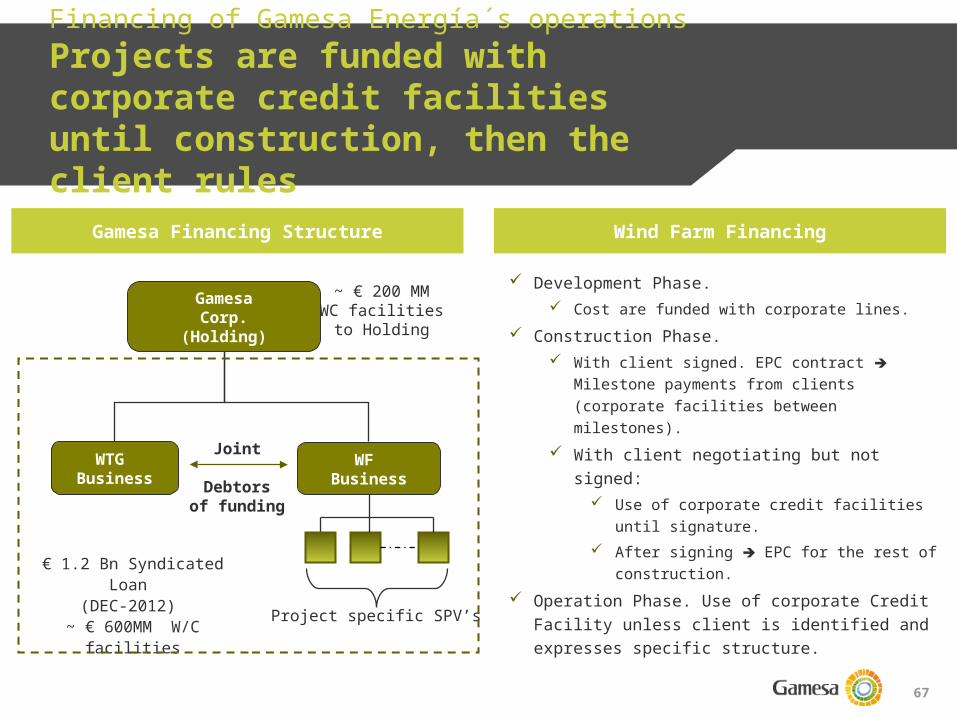
Financing of Gamesa Energía´s operationsProjects are funded with corporate credit facilities until construction, then the client rules
Gamesa Financing Structure Wind Farm Financing
Development Phase. Cost are funded with corporate lines.
Construction Phase. With client signed. EPC contract
Milestone payments from clients (corporate facilities between milestones).
With client negotiating but not signed: Use of corporate credit facilities
until signature. After signing EPC for the rest of
construction. Operation Phase. Use of corporate Credit
Facility unless client is identified and expresses specific structure.
GamesaCorp.
(Holding)
WTG Business
WF Business
~ € 200 MMWC facilitiesto Holding
Joint
Debtorsof funding
€ 1.2 Bn Syndicated Loan
(DEC-2012) ~ € 600MM W/C
facilitiesProject specific SPV’s

68
Table of contents
1
2
3
4
Business model and value generation alternatives
Gamesa Energía pipeline description and evolution
Accounting and financial modelling
History of Gamesa Energía
5
6
Strategy
Valuation
7
Conclusions8
Financing
69
Conclusions
o Gamesa Energía is a leading WF developer with 3,500 MW constructed over 15 years and strong synergies with the OEM business
o The value of Gamesa Energía relies on a 22GW pipeline and a track record of more than 450 MW developed and constructed per year
o The company has a strong balance sheet with assets (€ 476 MM) associated to mature projects under construction or in operation (680 MW)
o The strategy of the company is to sell projects recurrently, not being an IPPo The geographical spread of the pipeline mitigates riskso The company is seeking value enhancing strategies through geographical
growth, selective development pipeline acquisition and new financing structures
70
Questions & Answers
Muchas GraciasThank you
谢谢!
71
“This material has been prepared by Gamesa Corporación Tecnológica, S.A., and is disclosed solely as information.This material may contain declarations which constitute forward-looking statements, and includes references to our current intentions, beliefs orexpectations regarding future events and trends that may affect our financial condition, earnings and share value.These forward-looking statements do not constitute a warranty as to future performance and imply risks and uncertainties. Therefore, actual resultsmay differ materially from those expressed or implied by the forward-looking statements, due to different factors, risks an uncertainties, such aseconomical, competitive, regulatory or commercial changes. The potential investor should assume the fact that the value of any investment may rise orgo down, and furthermore, it may not be recovered, partially or completely. Likewise, past performance is not indicative of future results.The facts, opinions, and forecasts included in this material are furnished as to the date of this document, and are based on the company’s estimationsand on sources believed to be reliable by Gamesa Corporación Tecnológica, S.A., but the company does not warrant its completeness, timeliness oraccuracy, and therefore it should not be relied upon as if it were.Both the information and the conclusions contained in this document are subject to changes without notice. Gamesa Corporación Tecnológica, S.A.undertakes no obligation to update forward-looking statements to reflect events or circumstances that occur after the date the statements were made.The results and evolution of the company may differ materially from those expressed in this material.None of the information contained in this document constitutes a recommendation, solicitation or offer to buy or sell any securities, futures, options orother financial instruments or provide any investment advice or service. This material does not provide any recommendation of investment, or legal, taxor any other type of advise, and it should not be relied upon to make any investment or decision.Any and all the decisions taken by any third party as a result of the information, materials or reports contained in this document, are the sole andexclusive risk and responsibility of that third party, and Gamesa Corporación Tecnológica, S.A. shall not be responsible for any damages derived fromthe use of this document or its content.This document has been furnished exclusively as information, and it must not be disclosed, published or distributed, partially or totally, without the priorwritten consent of Gamesa Corporación Tecnológica, S.A.The images captured by Gamesa in the work environment or at corporate events are solely used for professional purposes to inform third parties aboutcorporate activities and to illustrate them.English version for information purposes only. In case of doubt the Spanish version will prevail.”
Disclaimer