Embed Size (px)
Citation preview


2
3
Consumer loans
Businessloans
Mobile Bank
years of profitable growth
Active & formercustomers
Countries
FY 2017revenue
Year-on-year revenue growth
Founded Helsinki 2005
EU Banking Licence
Frankfurt Prime Standard
Year-on-year profit growth

4
0
50000000
100000000
150000000
200000000
250000000
2005 2006 2007 2008 2009 2010 2011 2012 2013 2014 2015 2016 2017
FIN SWE
EST
POL
ESP
DEN
BUL
GER
ROM
CAN
FRA
NOR
MEX
RUS
MLT
BRA
NIG
No new countries
No new countries
CRO
NZL
AUS
GBRNo new countries
LAT
LIT
CZE
NED
SVK
Mobile Concept
Geographic Expansion
Product Diversification
Banking licence
Launch of the Mobile Bank
Launch of Banking-as-a-Service
Targeting 30 countries in medium term
Mobile Platform

5
Our Mobile Financial Platform Model that allows us and our partners to scale services globally
Innovation, geographic expansion and global partnerships that generate sustainable, profitable growth
We provide financial services that enable and empower our customers
Innovation& product
diversification
Mobile PlatformGeographicExpansion
Sustainableprofitable
growth

6
Addressing a range of borrowing needs
ProductsAverage Loan Value
Average Loan Term (Days)
RevenueShare
Revenues by Product (€,000)
Active Markets
PrimeLoan€3,000 – €20,000 / 1 – 10 years
€5,095 1,610 N/A 1
Business (SMEs) Up to €250,000 / 6 – 18 Month term
€13,142398 5.9% 7
Credit Limit Up to €3,000 / Digital revolving credit line
€1,119N/A 46.8% 9
PlusLoan€300 – €5,000 / 2 – 36 month term
€715351 27.2% 9
Microloan €25 – €1,000 / 7 – 90 day term
€20429 19.8% 21
43,886
52,837
60,315
30,232
103,774
66,444
13,135
4,251
N/A
N/A
2017
2016
2017
2016
2017
2016
2017
2016
2017
2016
+209% y-o-y
+56% y-o-y
+100% y-o-y
(-17%) y-o-y

7
1 231 542
1 561 687
1 876 144
2015 2016 2017
547 617
695 440
782 220
2015 2016 2017
* Total customers: active and former customers who have been granted one or several loans in the past or has an open mobile account
**Customers with a Mobile Bank account and lending customers who have had an open balance in the last 12 months. If loans are >24m overdue, the customer is not considered active.

8
Global scalability beyond Ferratum’s balance sheet: multiple sources of revenue
Ferratum‘s technology and licence platform enables consumer-facing brands to offer financial services:
✓ Fees and/or profit sharing
✓ Cheap funding sources
✓ Increased customer base
An ecosystem of services through the integration of third party products and services:
✓ Fees and/or profit sharing
✓ More attractive products
✓ Increased customer loyalty
A franchise model that combines Ferratum’s plug and play Mobile Financial Platform and our partners’ balance sheets
✓ Fees and/or profit sharing
✓ Access to more markets and customers
✓ Current accounts
✓ Deposits
✓ Loans
✓ Debit Card
✓ Payments
Ferratum Operating System 1.0
A channel agnostic, flexible customer interface and back-end data engine, supported by a decision making centre and an API integration channel to process third party data:
✓ Fees
✓ Cheap funding sources
✓ Interest on lending products

99
▪ Strategic partnerships with non-financial brands to access new/broader customers segments
▪ Rigorous partner selection criteria on a micro and macro-economic level
▪ Establishing relationships with global brands in growing sectors e.g. travel, leisure, fashion, education and agriculture
▪ Tailoring the components of our Platform Model to our partners’ needs, generating new commercial opportunities
▪ Accessing partners’ customers, enabling significant savings on customer acquisition
▪ Monetising a growth strategy without stretching Ferratum’s balance sheet
Our success with Thomas Cook Money
▪ Launch of Sumo in Sweden in Dec 2017▪ Roll-out to other key European markets
planned in 2018, including UK
New revenue and benefits from:
✓ Overdrafts✓ Licencing fee based on platform usage✓ Future revenue from additional
customer offerings✓ Cheap funding

10
Driving Ferratum’s profitability and growth
▪ Core business logic module developed
▪ API integration layer built
▪ Dynamic real-time, data-driven front end developed
▪ Mobile Bank platform integration ongoing
▪ Customer support and back office centralized to Sliema, Malta
▪ Collections centralized to Berlin
▪ Improved customer support and collection systems, supporting local market teams
▪ Completion due mid-year 2018
▪ Marketing centralized which enables an improved overview of the groups marketing efforts
▪ Improved and faster decision making in marketing efforts
▪ Rebranding of company and product lines
▪ Emphasising digital marketing and competence
Smart IT Operational excellence Smart Marketing
A robust scalable, innovative and performance platform
Increased efficiency and standardizationImproved marketing /
net sales efficiency

11

12
Portfolio quality
Balance sheet
Operating cash flow
Cost of capital and financing
Financial performance

13
111,0
154,1
221,6
FY 2015 FY 2016 FY 2017
+38.8%
+43.8%
1721,1
31,8
FY 2015 FY 2016 FY 2017
+24.1%
+50.6%
12,914,7
23,2
FY 2015 FY 2016 FY 2017
+14.0%
+57.8%
10,913,0
20,1
FY 2015 FY 2016 FY 2017
+19.2%
+54.8%

14
23.026,8
29,431,8 33,2
37,2 38,2
45,5
5053,7
57,360,6
2,6* 3,75,9
4,3 5,2 4,9 4,26,9 6,8 8,1 8,9 8,0
0
10
20
30
40
50
60
Q1 Q2 Q3 Q4 Q1 Q2 Q3 Q4 Q1 Q2 Q3 Q4
EUR million
Revenue EBIT
* Including IPO related costs in the amount of EUR 488,941 recognised as operating expenses in Q1 2015
15
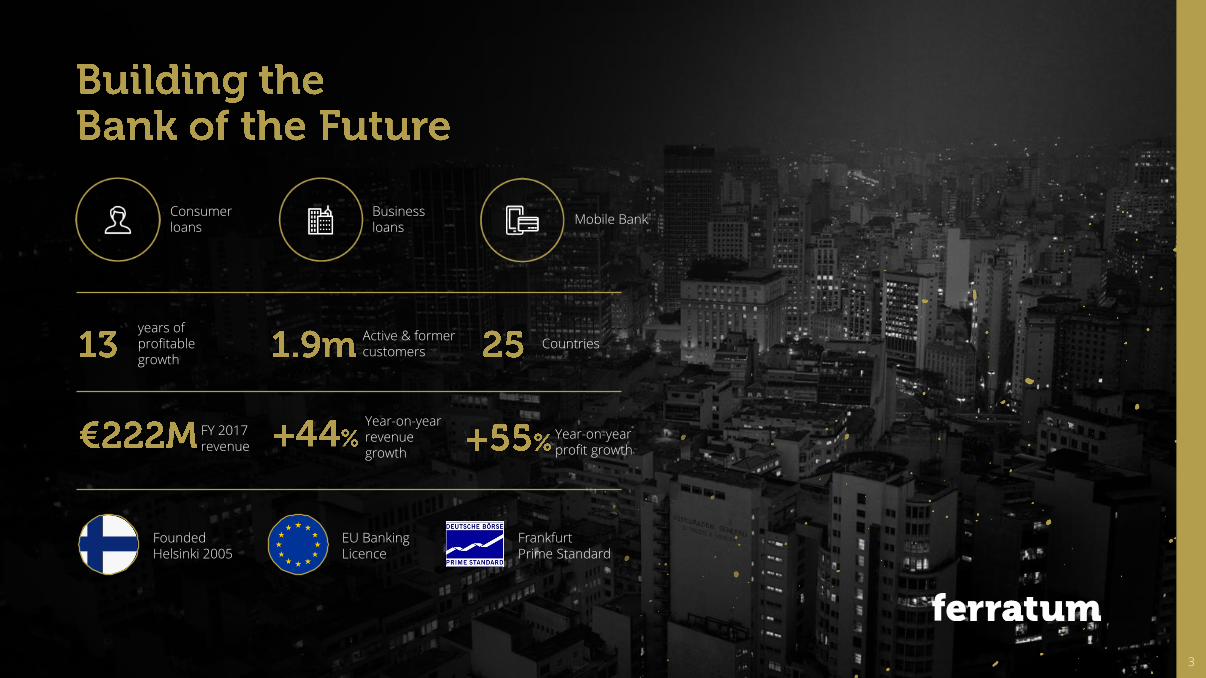
Profit before tax (EBT) up by 58%
FY 2017 FY 2016 % Change
Revenue 221,638 154,128 +43.8%
Other income 534 64 +734.4%
Impairment of loans (75,629) (47,964) +57.7%
Other operating expenses (77,521) (55,168) +40.5%
Selling & marketing expenses (37,184) (29,918) +24.3%
EBIT 31,837 21,142 +50.6%
Net financial costs (8,594) (6,414) +34.0%
EBT 23,244 14,728 +57.8%
Income tax (3,185) (1,768) +80.1%
Net profit 20,058 12,961 +54.8%
Earning per share, basic (EUR) 0.93 0.60 +56.7%
Earning per share, diluted (EUR) 0.92 0.60 +55.0%
▪ New customer acquisition tactics lead to higher “Impairment of loans” and lower “Selling and marketing expenses”
▪ Overall EBIT is increasing more than revenues
▪ EBT continues to benefit from cheaper refinancing from deposit taking
▪ Applying IFRS 2, the potential benefit from options granted to employees (€ 1,263k) is allocated as personnel expenses. This is reducing the EBIT although it is just a potential benefit of options that have not vested yet.

16
EUR ,000
Microloan PlusLoan Credit Limit SME Mobile Bank* Total
2017 2016 2017 2016 2017 2016 2017 2016 2017 2016 2017 2016
Revenue 43,886 52,837 60,315 30,232 103,774 66,444 13,135 4,251 529 364 221,638 154,128
Impairments (21,822) (19,779) (22,880) (9,709) (27,534) (17,204) (3,078) (909) (315) (363) (75,629) (47,964)
As % of Revenue 49.72% 37.43% 37.93% 32.11% 26.53% 25.89% 23.43% 21.38% - - 34.12% 31.10%
Other income 37 50 86 11 350 534
Marketing (5,527) (5,444) (9,807) (7,887) (17,480) (13,562) (3,202) (1,547) (1,168) (1,477) (29,918) (29,918)
As % of Revenue 12.59% 10.30% 16.26% 26.09% 16.84% 20.41% 24.38% 36.39% - - 13.50% 19.41%
Attributable Profit 16,574 27,614 27,679 12,636 58,846 35,678 6,865 1,795 (604) (1,476) 109,359 76,246
As % of Revenue 37.77% 52.26% 45.89% 41.80% 56.71% 53.70% 52.26% 42.23% - - 49.34% 49.47%
Total Non-directly Attributable costs
(14,245) (17,492) (19,577) (10,009) (33,684) (21,997) (4,263) (1,407) (5,752) (4,200) (77,521) (55,105)
Operating Profit 2,329 10,122 8,101 2,627 25,163 13,681 2,602 387 (6,357) (5,676) 31,838 21,142
Gross Profit Margin, % 5.31% 19.16% 13.43% 8.69% 24.25% 20.59% 19.81% 9.10% - - 14.36% 13.72%
Finance costs, net (1,099) (1,223) (2,358) (1,380) (4,137) (2,632) (1,086) (442) (12) (23) (8,594) (6,414)
Net Profit 1,230 8,899 5,743 1,247 21,026 11,049 1,516 (54) (6,369) (5,699) 23,244 14,728
As % of Revenue 2.80% 16.84% 9.52% 4.12% 20.26% 16.63% 11.54% - - - 10.49% 9.56%
*incl. Mobile Bank, FerBuy, Primeloan and Ferratum P2P

17
▪ EBIT of the lending business (excluding IFRS2 and Mobile Bank) is €39.5 million.
▪ The Mobile Bank is contributing €174 million in deposit volume. Potential benefit of ~0.6% avrg deposits interest vs ~ 6% avrg bond interest based on 174 million of deposit volume is 9.4 million - once current excess liquidity from deposits is fully used.
▪ Earnings per share (EPS) without Mobile Bank and IFRS2 would be 1.28
31.8
-6.4
39.5
0.93
-0.06-0.29
1.28
-1.3

18
EUR ,000
FY 2016Total 154,128
FY 2017Total 221,638
REGION 1 Finland, Sweden, Denmark, Norway
REGION 2 Netherlands, UK, New Zealand, Australia, Canada
REGION 3 Estonia, Latvia, Lithuania, Poland, Czech, Slovakia, Russia
REGION 4Bulgaria, Romania, Croatia, Spain, Germany, France, Mexico,Brazil, Nigeria
20,367
60,566
28,161
45,034
88,726
46,330
54,393
32,189
+64.5%
+20.8%
+58.0%
+46.5%
19
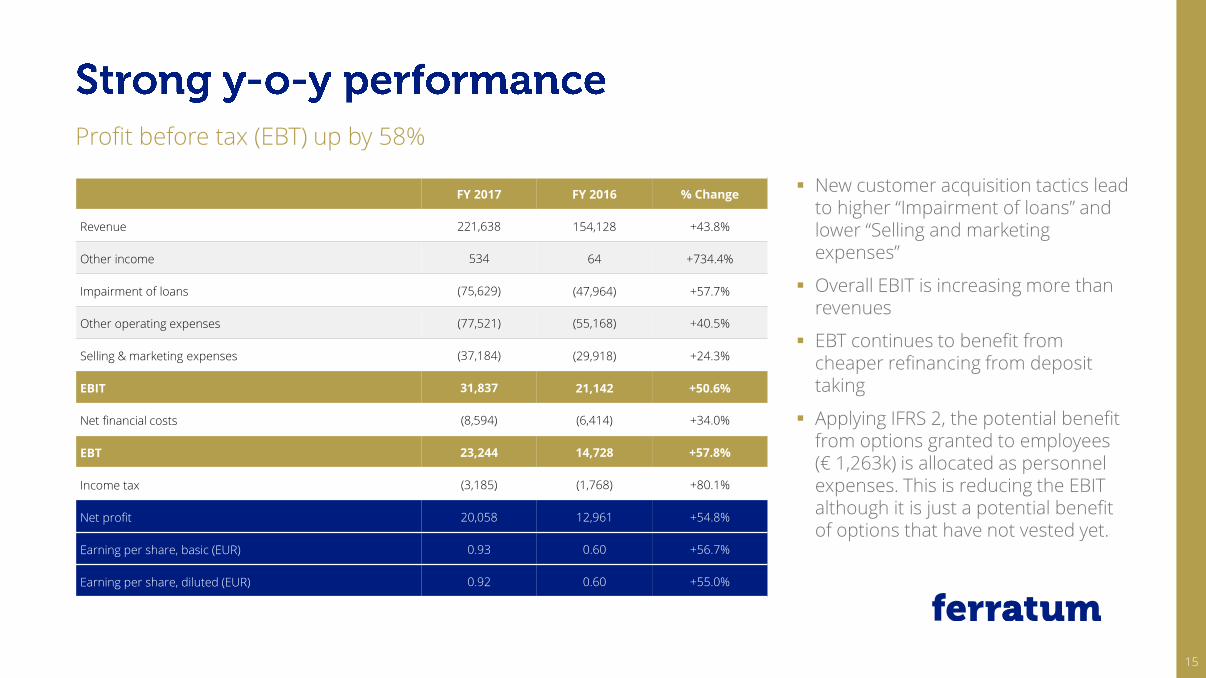
Portfolio NBV (EUR million) EUR ‘000 GBV Impairments NBV Coverage ratio (%)
31 Dec 2016
Current 153,394 (7,309) 146,085 4.8
1-90 days due 20,683 (5,359) 15,324 25.9
91-180 days due 14,736 (6,597) 8,139 44.8
>181 days due 58,197 (43,400) 14,797 74.6
Total 247,010 (62,664) 184,346 25.4
EUR ‘000 GBV Impairments NBV Coverage ratio (%)
31 Dec 2017
Current 216,988 (10,159) 206,829 4.7
1-90 days due 29,895 (7,668) 22,227 25.6
91-180 days due 20,904 (9,228) 11,676 44.1
>181 days due 66,456 (51,782) 16,674 75.6
Total 336,243 (78,837) 257,406 23.4
Current 1-90 days due
91-180 days due >181 days due
+40%
257.4m
184.3m
6.5%
8.6%
4.5%
80.4%
8.0%4.4%8.3%
79.2%
31 Dec 2016 31 Dec 2017

20
IFRS 9 requires recognition of loans at fair value, therefore any expected losses must be accounted for at the disbursement date
– Ferratums accounting of receivables was already based on an expected loss model
– From 1 January, Ferratum based its valuation of its credit portfolio on the mandatory IFRS 9 accounting standard
– IFRS 9 changes the timing of risk provisions and requires a one time increase of risk provisions of EUR 9.3m
– The one time impact is to be booked P&L neutral directly to equity and is partly offset by deferred tax effects of about € 2-3m
IAS 39
Gross AR Reserves Net AR %
Not due 216,988 (10,159) 206,829 4.7%
1-90 days due 29,895 (7,668) 22,227 25.6%
91-180 days due 20,904 (9,228) 11,676 44.1%
> 181 days due 68,456 (51,782) 16,674 75.6%
Total 336,243 (78,837) 257,406 23.4%
IFRS 9
Gross AR Reserves Net AR %
158,368 (4,695) 153,673 3.0%
72,398 (17,649) 54,749 24.4%
21,474 (12,768) 8,706 59.5%
84,004 (52,988) 31,016 63.1%
336,243 (88,100) 248,143 26.2%
Change
Gross AR Reserves Net AR
(58,620) 5,464 (53,156)
42,502 (9,981) 32,521
570 (3,540) (2,970)
15,548 (1,206) 14,341
- (9,263) (9,263)
The new accounting standard IFRS 9 was implemented on 1 January 2018

21
High cash level driven by deposit growth
EUR ‘000 31 Dec 2017 31 Dec 2016
Assets
Non-current assets 36,128 30,426
Accounts receivable – consumer loans (net) 257,406 184,346
Other receivables 10,711 7,298
Income tax assets 519 555
Cash and cash equivalents 131,832 73,059
Total Assets 436,595 295,683
EUR ‘000 31 Dec 2017 31 Dec 2016
Equity and liabilities
Equity 105,243 87,875
Non-current liabilities 64,167 72,246
Current liabilities 267,185 135,563
of which deposits 174,301 101,436
Total Equity & Liabilities 436,595 295,683
Net debt to equity ratio 1.90 1.53
▪ Deposit volume higher than required – to be optimized 2018.
▪ Moderate growth in AR due to improved portfolio management
▪ Solid net debt to equity ratio of 1.90

2222
EUR ‘000
Assets FY 2017 FY 2016
Net cash from operating activities before movements in portfolio and deposits 109,148 50,857
Net cash from operating activities 33,324 23,733
Net cash used in investing activities (11,329) (8,266)
Net cash used in financing activities 38,990 40,857
Net increase/decrease in cash equivalents 60,985 56,324
Cash and cash equivalents at the end of the period 131,832 73,059

23
Ferratum Capital Germany GmbH 8% 2018 Ferratum Capital Germany 4.875% 2019
Ferratum Bank 4.9% 2017 Ferratum Bank 6.25% + 3m Euribor 2020
Nordea Credit Line Ferratum Capital Germany 4.00% 2018
Deposits Ferratum Capital Poland B2 6.5% + 6M Wibor 2017
€25.0M
€25.0M
€20.0M
€25.0M
€101.4M
€4.6M
8,62%8,02%
5,25%
3,11%
0
2
4
6
8
10
2014 2015 2016 2017
€25.0M
€25.0M
€40.0M
€24.7M
€20.0M
€174.3M

24
Ferratum Capital Germany GmbH 8% 2018
Ferratum Capital Germany GmbH 4,875% 2019
Nordea Credit Line
Ferratum Bank 6,25% + 3m Euribor 2020
Deposits
Ferratum Capital Germany GmbH 4.0% 2018
Countries covered by Ferratum Bank p.l.c.’s EU banking licence
Countries / operations not currently utilisingFerratum Bank p.l.c.’s EU banking licence
Sphere IWACC: 2.50 %
Potential Sphere I Operations
€25.0m
€25.0m
€24.7m
€40.0m
€174.3m
€20.0m

25
Date Financial Calendar Events
19 Apr 2018 Annual General Meeting 2018
30 May 2018 Report for the first three months of 2018
30 Aug 2018 Report for the first half-year 2018
22 Nov 2018 Report for the first nine months of 2018
55,17%
0,67%4,99%
5,09%
44,16%
Jorma Jokela*
Ferratum Oyj**
Carmignac*
Dorval*
Total free
float***
* Shareholders holding based on the latest shareholder notifications received
** Own shares held by Ferratum Oyj
*** Total free float includes shares held by Carmignac and Dorval as well as shares held by employees and management
Date Other Events
10 Apr 2018 LondCap Conference Geneva
17 Apr 2018 MidCap Conference Paris
02 May 2018 LondCap Conference Toronto
15 May 2018 LondCap Conference London
30 May 2018 Q1 2018 Roadshow

26

27
▪ Consistently strong revenue growth and profitability
▪ Well funded balance sheet supported by deposit growth
▪ Further launches and partnership news in the pipeline
▪ 2018 guidance includes possible IFRS 9 effects
▪ Q1 2018 Y-o-Y revenue growth expected at about 20-30%
€ 000s %
0
10
20
30
0
50
100
150
200
250
300
2015 2016 2017 2018
Revenue EBIT Margin
14,8+39%
+44%
13-16%
EUR 280 – 310m
+33%
13,714,4

2828
Dr. Clemens Krause
Chief Financial Officer
Telephone: + 49 (0) 30 921005844
e-Mail: [email protected]
Paul Wasastjerna
Head of Investor Relations
Telephone: +358 (0) 40 7248247
e-Mail: [email protected]
Ferratum Group
Ratamestarinkatu 11 A
00520 Helsinki, Finland
Telephone: +358 20 741 1611
Fax: +358 20 741 1612