Embed Size (px)
Citation preview
Business IntelligenceBusiness IntelligenceSusan Doniz FirkaSusan Doniz Firka
Associate Director Business Associate Director Business IntelligenceIntelligence
Procter & Gamble Procter & Gamble
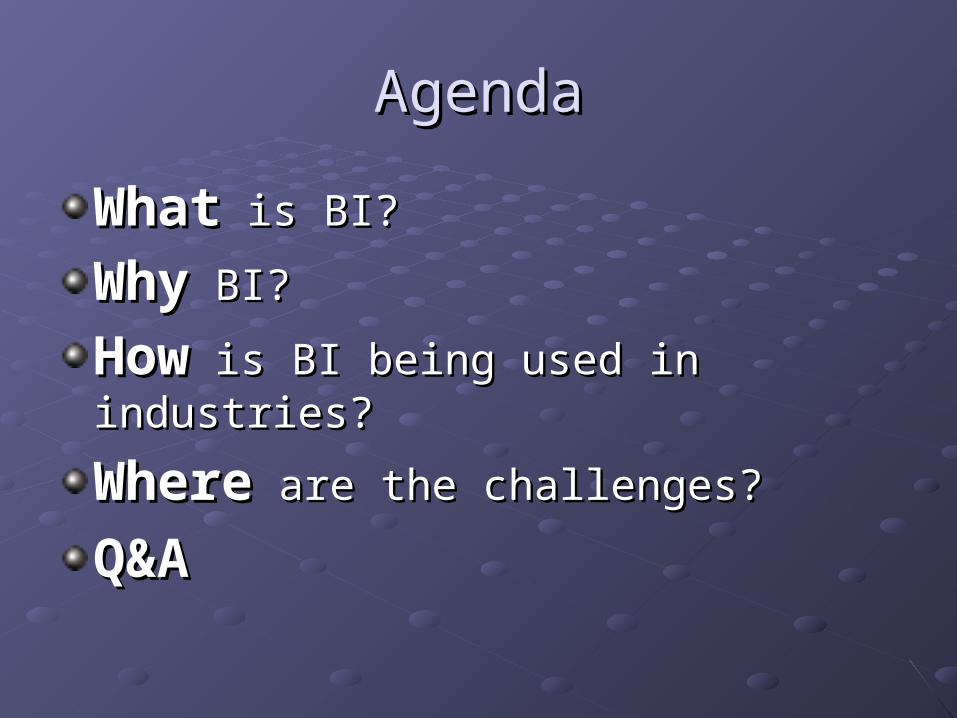
AgendaAgenda
WhatWhat is BI? is BI?
WhyWhy BI? BI?
HowHow is BI being used in industries? is BI being used in industries?
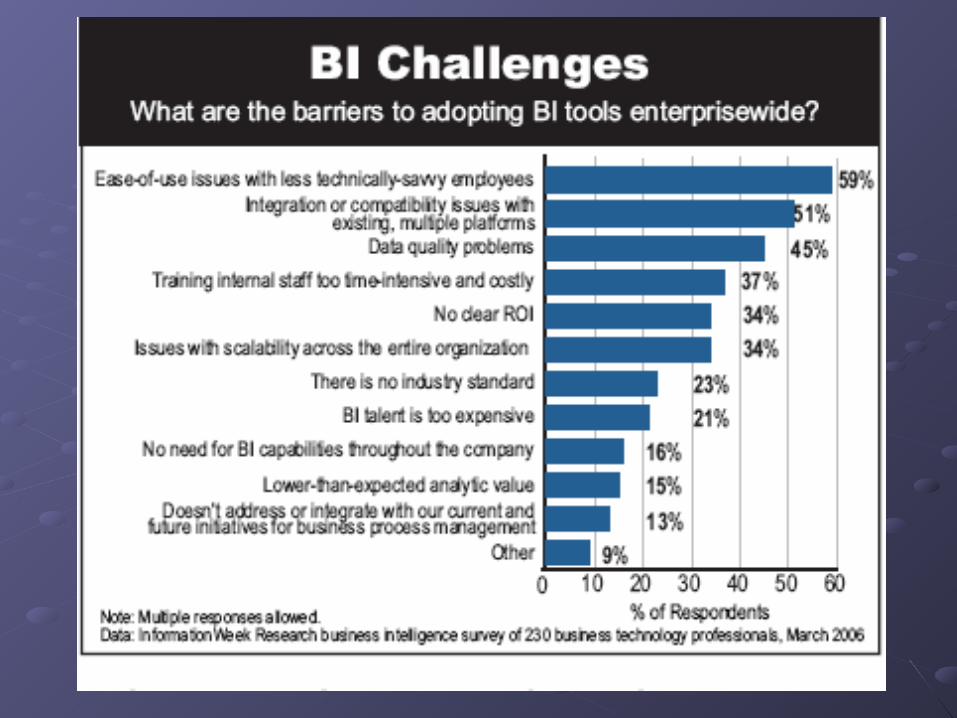
WhereWhere are the challenges? are the challenges?
Q&AQ&A
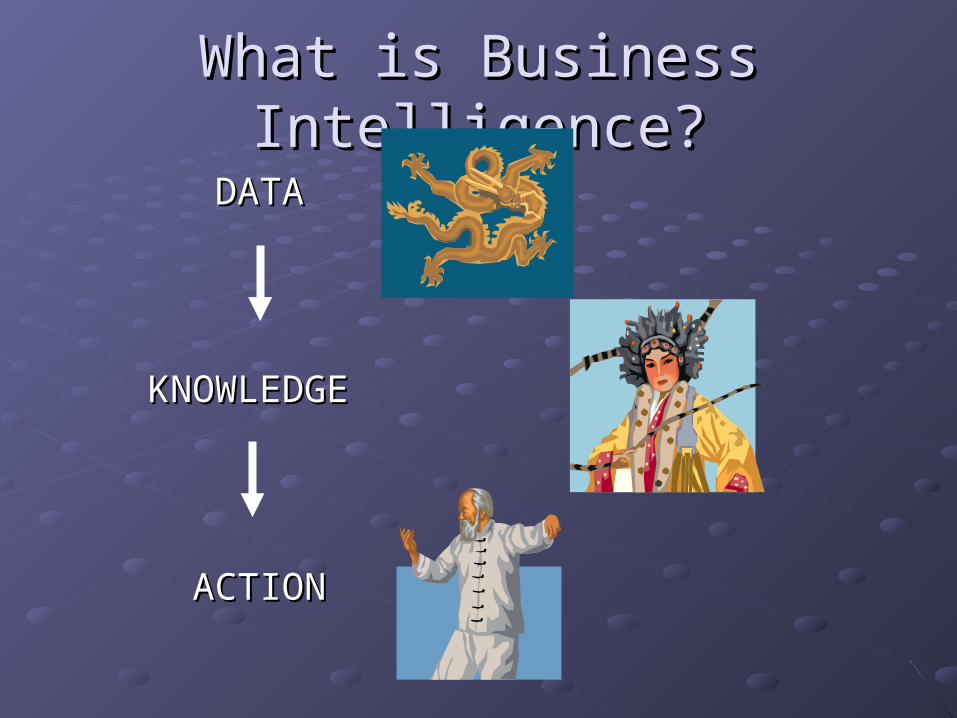
What is Business Intelligence?What is Business Intelligence?
DATADATA
KNOWLEDGE KNOWLEDGE
ACTIONACTION
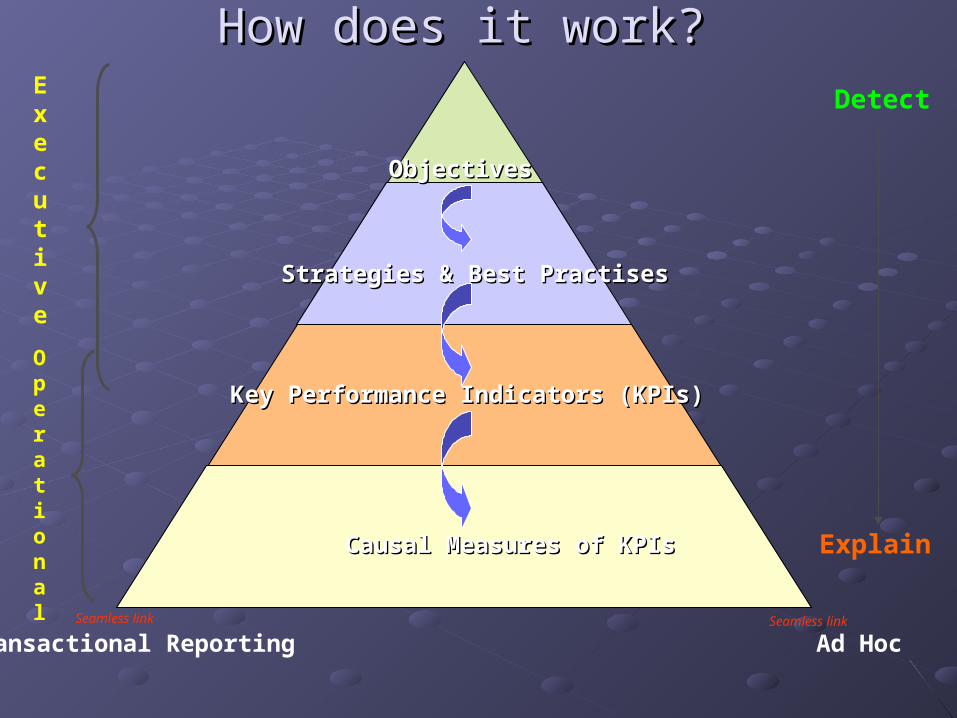
How does it work?How does it work? Executive
Causal Measures of KPIsCausal Measures of KPIs
Strategies & Best PractisesStrategies & Best Practises
Key Performance Indicators (KPIs)Key Performance Indicators (KPIs)
Seamless link
Ad Hoc
ObjectivesObjectives
Transactional ReportingSeamless link
Operational
Detect
Explain

Prework requiredPrework required
Streamlined Processes
Timely & Complete Info.
Simple & Intuitive Tools
Intelligence Engines
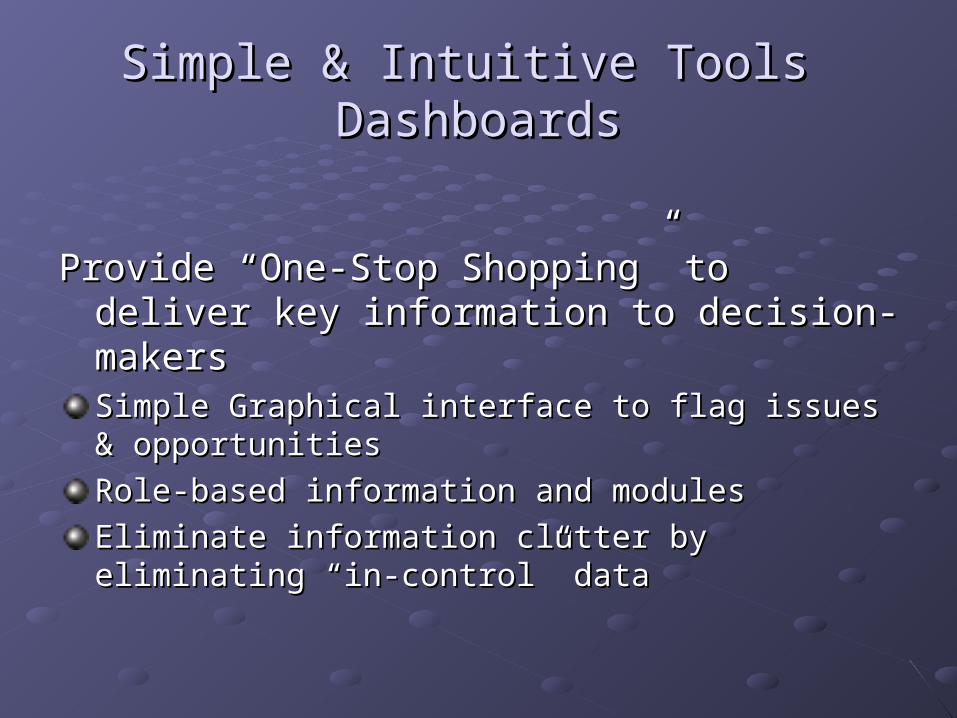
Simple & Intuitive Tools Simple & Intuitive Tools DashboardsDashboards
Provide “One-Stop Shopping” to deliver key Provide “One-Stop Shopping” to deliver key information to decision-makersinformation to decision-makersSimple Graphical interface to flag issues & opportunitiesSimple Graphical interface to flag issues & opportunities
Role-based information and modulesRole-based information and modules
Eliminate information clutter by eliminating “in-control” Eliminate information clutter by eliminating “in-control” datadata
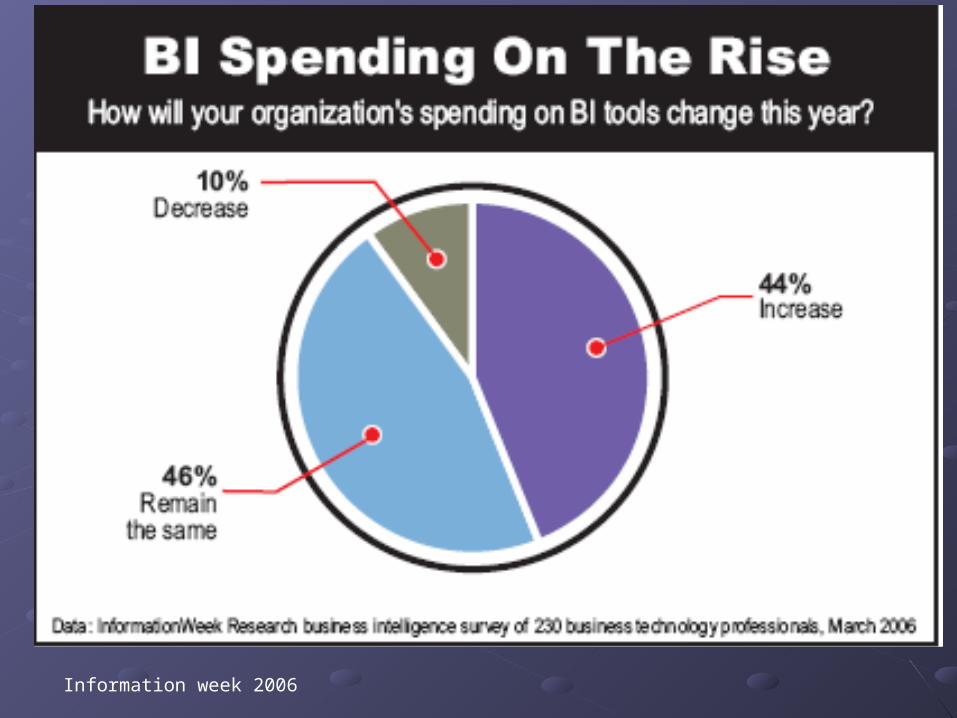
Information week 2006
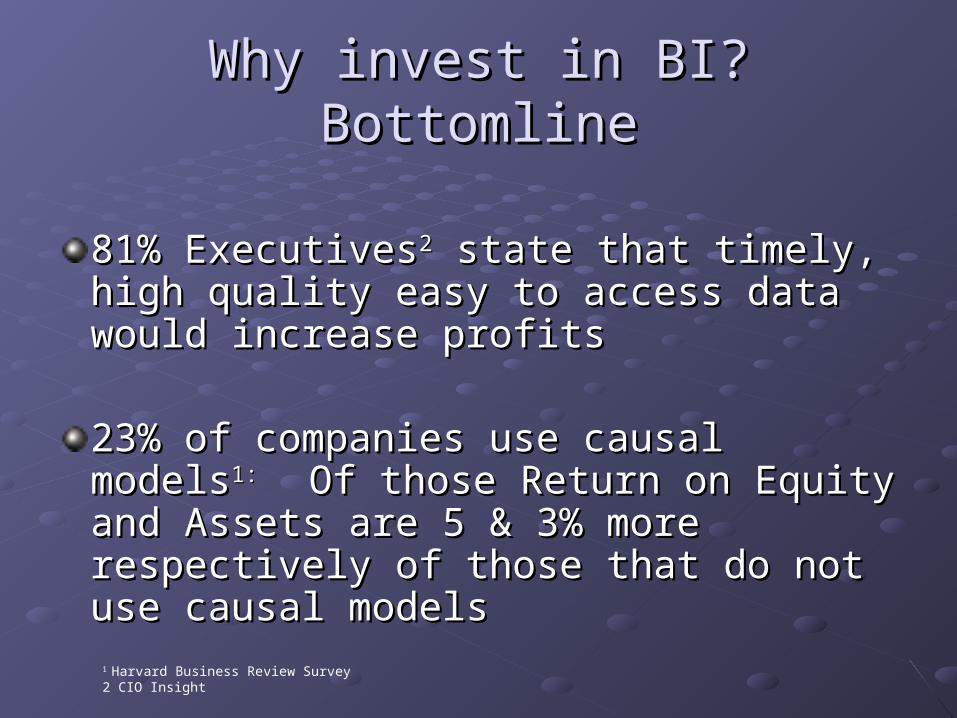
Why invest in BI?Why invest in BI?BottomlineBottomline
81% Executives81% Executives22 state that timely, high state that timely, high quality easy to access data would increase quality easy to access data would increase profitsprofits
23% of companies use causal models23% of companies use causal models1: 1: Of Of those Return on Equity and Assets are 5 & those Return on Equity and Assets are 5 & 3% more respectively of those that do not 3% more respectively of those that do not use causal modelsuse causal models
1 Harvard Business Review Survey2 CIO Insight
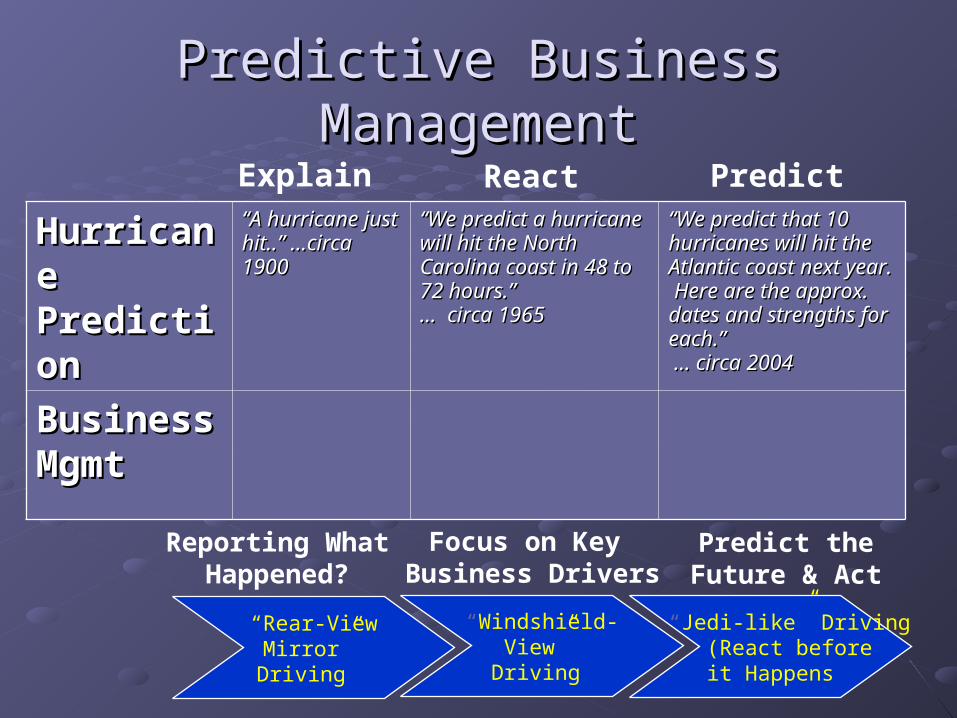
Predictive Business ManagementPredictive Business Management
“Rear-ViewMirror” Driving
“Windshield-View”
Driving
“Jedi-like” Driving (React before
it Happens
Hurricane Hurricane PredictionPrediction
““A hurricane just A hurricane just hit..” …circa hit..” …circa 19001900
““We predict a hurricane We predict a hurricane will hit the North will hit the North Carolina coast in 48 to Carolina coast in 48 to 72 hours.”72 hours.”… circa 1965… circa 1965
““We predict that 10 We predict that 10 hurricanes will hit the hurricanes will hit the Atlantic coast next year. Atlantic coast next year. Here are the approx. Here are the approx. dates and strengths for dates and strengths for each.”each.” … circa 2004 … circa 2004
Business Business MgmtMgmt
Explain React Predict
Reporting What
Happened?
Focus on Key Business Drivers
Predict the Future & Act
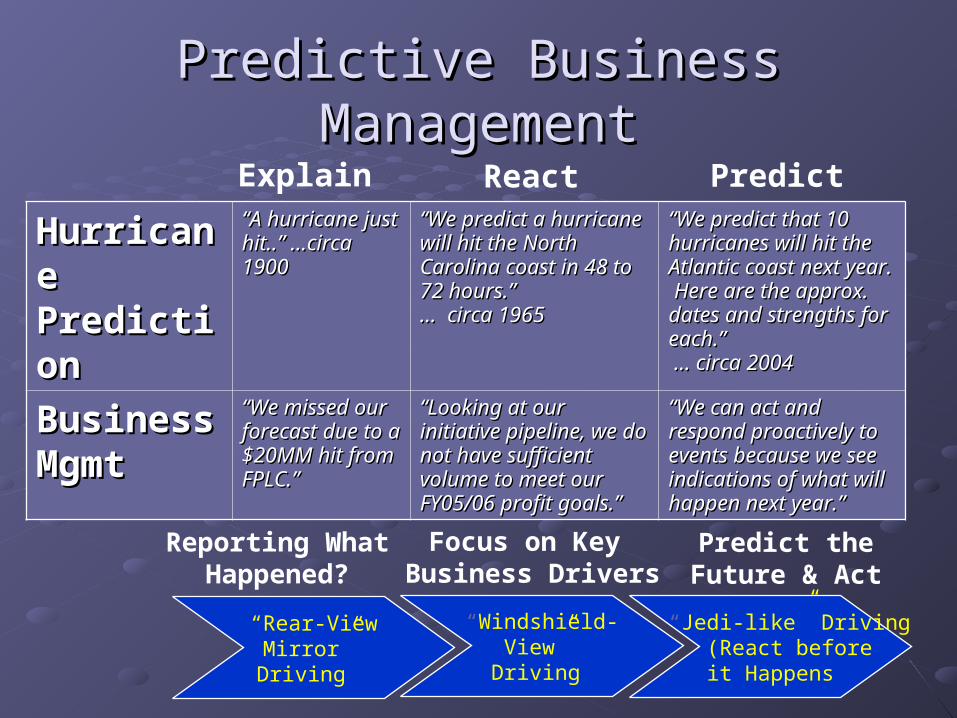
Predictive Business ManagementPredictive Business Management
“Rear-ViewMirror” Driving
“Windshield-View”
Driving
“Jedi-like” Driving (React before
it Happens
Hurricane Hurricane PredictionPrediction
““A hurricane just A hurricane just hit..” …circa hit..” …circa 19001900
““We predict a hurricane We predict a hurricane will hit the North will hit the North Carolina coast in 48 to Carolina coast in 48 to 72 hours.”72 hours.”… circa 1965… circa 1965
““We predict that 10 We predict that 10 hurricanes will hit the hurricanes will hit the Atlantic coast next year. Atlantic coast next year. Here are the approx. Here are the approx. dates and strengths for dates and strengths for each.”each.” … circa 2004 … circa 2004
Business Business MgmtMgmt
““We missed our We missed our forecast due to a forecast due to a $20MM hit from $20MM hit from FPLC.”FPLC.”
““Looking at our initiative Looking at our initiative pipeline, we do not have pipeline, we do not have sufficient volume to sufficient volume to meet our FY05/06 profit meet our FY05/06 profit goals.”goals.”
““We can act and We can act and respond proactively to respond proactively to events because we see events because we see indications of what will indications of what will happen next year.”happen next year.”
Explain React Predict
Reporting What
Happened?
Focus on Key Business Drivers
Predict the Future & Act
BenefitsBenefits
Power user community freed up …Power user community freed up …… from the mundane and enabled to leverage their intellect and … from the mundane and enabled to leverage their intellect and experience in discovering knowledge and solid strategies.experience in discovering knowledge and solid strategies.
Corporate IQ grows …Corporate IQ grows ……as intelligence building ways are captured and propagated …as intelligence building ways are captured and propagated across company and knowledge is preserved across company and knowledge is preserved
Decision makers attention gets focused …Decision makers attention gets focused …… on the few areas where the biggest problem or opportunity … on the few areas where the biggest problem or opportunity exists despite of the future “raw” data complexity explosionexists despite of the future “raw” data complexity explosion
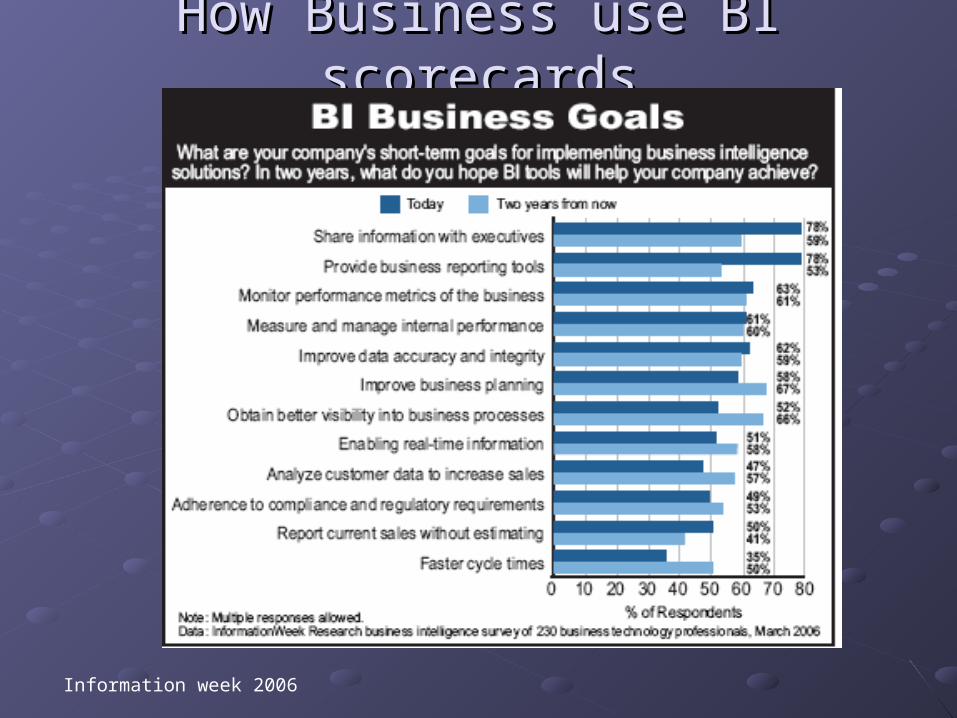
How Business use BI scorecardsHow Business use BI scorecards
Information week 2006
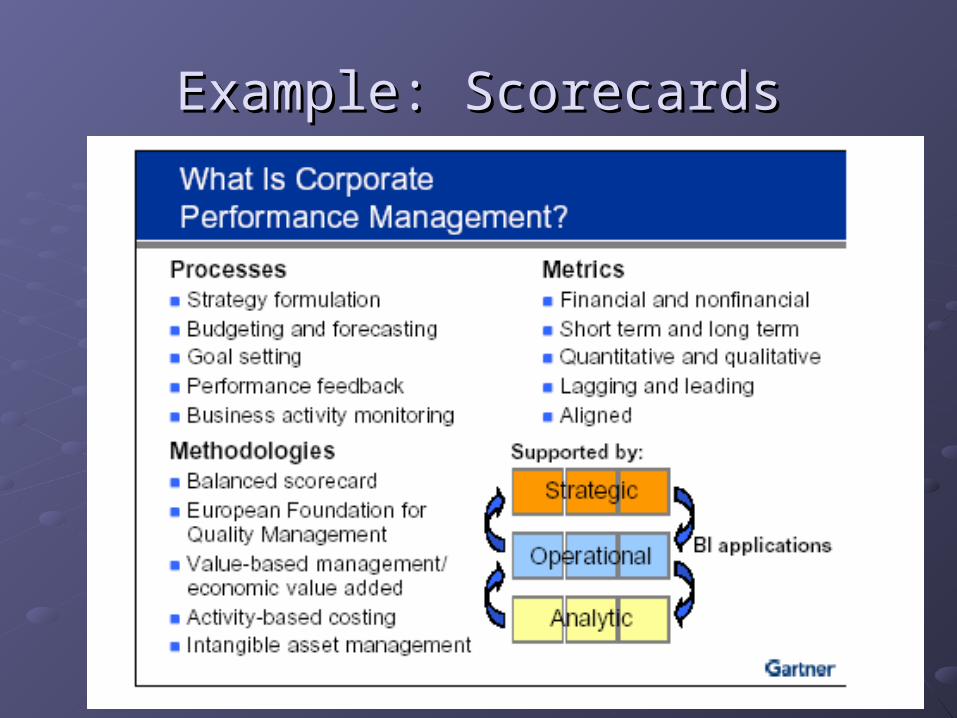
Example: ScorecardsExample: Scorecards
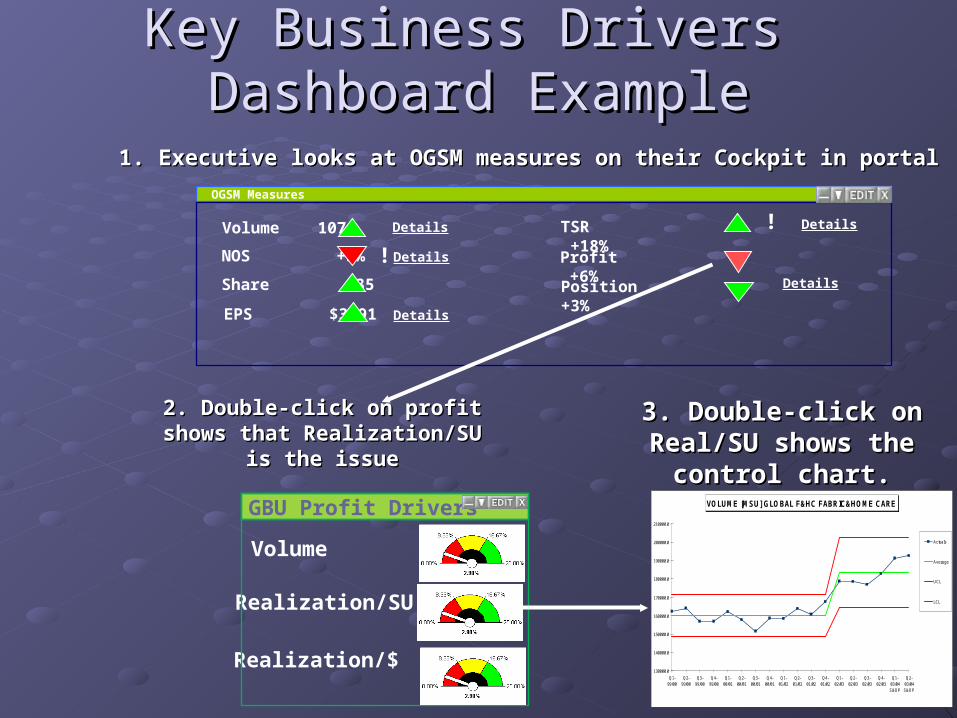
Key Business Drivers Key Business Drivers Dashboard ExampleDashboard Example
1. Executive looks at OGSM measures on their Cockpit in portal1. Executive looks at OGSM measures on their Cockpit in portal OGSM Measures
Volume 107
NOS +3%
Share 35
Profit +6%
TSR +18%
Position +3%
EPS $3.91
!
! Details
Details
Details
Details
Details
2. Double-click on profit 2. Double-click on profit shows that Realization/SU shows that Realization/SU
is the issueis the issue
Realization/$
Volume
Realization/SU
GBU Profit Drivers VOLUME [MSU] GLOBAL F&HC FABRIC&HOME CARE
130000.0
140000.0
150000.0
160000.0
170000.0
180000.0
190000.0
200000.0
210000.0
Q1-99/00
Q2-99/00
Q3-99/00
Q4-99/00
Q1-00/01
Q2-00/01
Q3-00/01
Q4-00/01
Q1-01/02
Q2-01/02
Q3-01/02
Q4-01/02
Q1-02/03
Q2-02/03
Q3-02/03
Q4-02/03
Q1-03/04S&OP
Q2-03/04S&OP
Actuals
Average
UCL
LCL
3. Double-click on 3. Double-click on Real/SU shows the Real/SU shows the
control chart.control chart.

Ease of Use/Skill DevelopmentEase of Use/Skill Development
Critical to define the ‘WHO’ :Critical to define the ‘WHO’ :Prime Prospect UserPrime Prospect User
Use of KPIsUse of KPIs
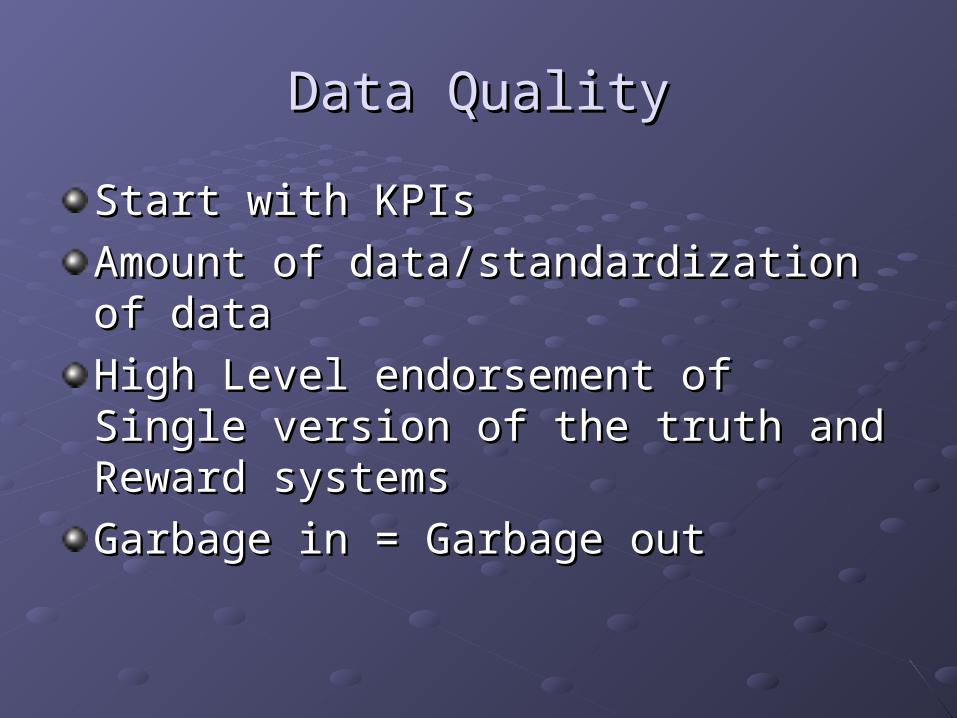
Data QualityData Quality
Start with KPIsStart with KPIs
Amount of data/standardization of dataAmount of data/standardization of data
High Level endorsement of Single version High Level endorsement of Single version of the truth and Reward systems of the truth and Reward systems
Garbage in = Garbage outGarbage in = Garbage out
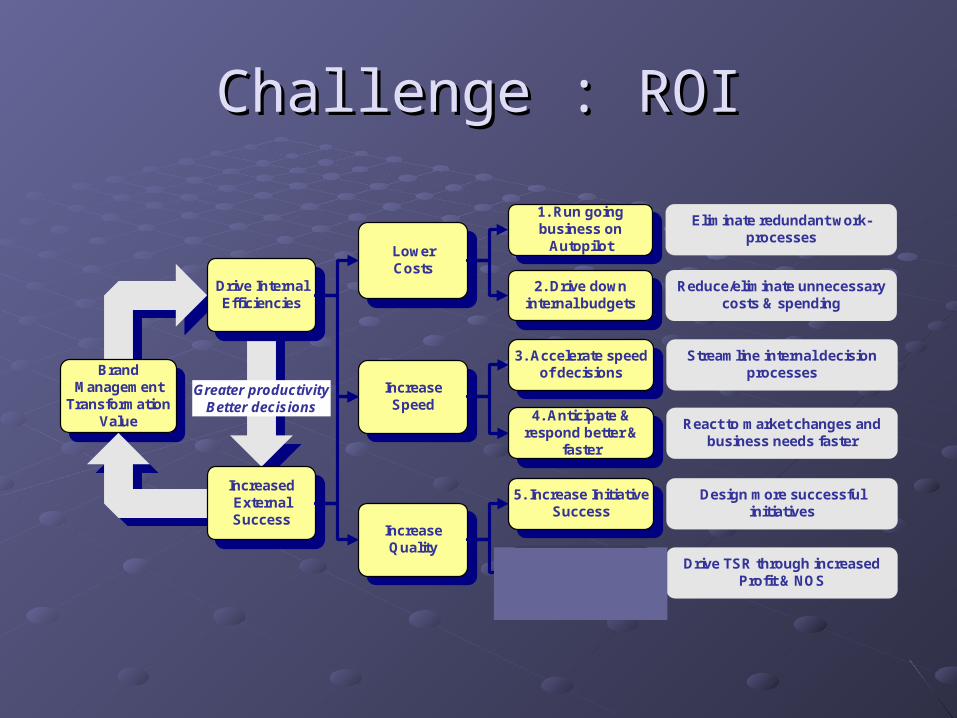
Challenge : ROIChallenge : ROI
BrandManagement
TransformationValue
Greater productivityBetter decisions
Drive InternalEfficiencies
IncreasedExternalSuccess
1. Run goingbusiness on
Autopilot
2. Drive downinternal budgets
4. Anticipate &respond better &
faster
5. Increase InitiativeSuccess
6. Become mostsuccessful HairCare company
Eliminate redundant work-processes
Reduce/eliminate unnecessarycosts & spending
React to market changes andbusiness needs faster
Design more successfulinitiatives
Drive TSR through increasedProfit & NOS
3. Accelerate speedof decisions
Streamline internal decisionprocesses
LowerCosts
IncreaseSpeed
IncreaseQuality
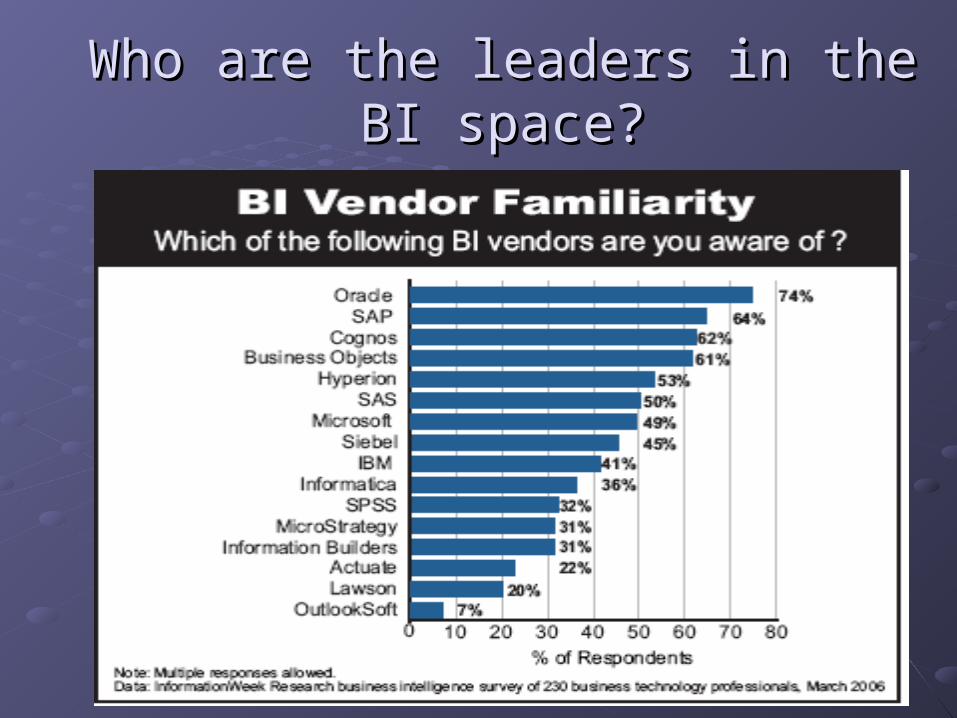
Who are the leaders in the BI space?Who are the leaders in the BI space?

Questions?Questions?