Embed Size (px)
Citation preview

B I a t G u t h y - R e n k e r | 1
Case version 1.2 – April 27, 2010
BUSINESS INTELLIGENCE AT GUTHY-RENKER:
THE PROMISE AND CHALLENGES OF SENSING THE PULSE1
Steve Johnson came out of a meeting feeling like a million bucks. He had just heard Guthy-Renker’s Vice President
of Marketing Planning and Analysis, Rob Reynolds, tell the attendees that for the first time, he had been able to
make a meaningful prediction about the future, based on data, and watch that prediction come true. As Vice
President of Information Technology, Steve was in charge of the business intelligence project that made it possible
for managers like Rob to get the data and analysis they needed to make timely and well-informed decisions.
The praise he just heard was the latest of several recent, unexpected signs that the business intelligence project
was turning a corner. Just the previous week, the Executive Vice President of Marketing loudly thanked Steve for
the “daily flash” report, “I love it, I use it daily, and it’s the number one report in my tool kit!” What made this so
extraordinary was that, only six months earlier, the same EVP had firmly asserted that the daily flash was less than
useless. After nearly two years working mostly behind-the-scenes – acquiring new data sources, improving IT
capabilities, and re-engineering processes – the project was beginning to yield real dividends for managers at all
levels, winning over hearts and minds in the process.
When Guthy-Renker’s then-CIO placed Steve in charge of business intelligence two years before, it had been a
parochial project of the IT department that automated labor-intensive tasks but had little impact on business
processes in other departments. The CIO had a vision of using it as a driver of organizational transformation, and
to realize this lofty goal, Steve and his team would learn many important lessons along the way. Steve measures
success by asking himself, “Are people involved? Are people invested in the project?” and he is proud to say that
now, in 2010, the answer is “definitely yes.”
Nevertheless, Steve realized many challenges remain. The IT staff under his leadership are still learning how to
develop technology in cooperation with business users – whose ways of working and communicating are very
different from those of software developers. Steve has been able to provide several business users with
intelligence of genuine value, but is still only beginning to learn what effects this information will have on the way
people work – and what unintentional side-effects will follow. And looking to the future, Steve has to decide how
best to provide a business intelligence infrastructure for Guthy-Renker’s development into an increasingly virtual,
increasingly international organization.
1 This teaching case was prepared by Joseph Clark, PhD Candidate in Information Systems at the USC Marshall
School of Business, under the direction and editorial guidance of Professor Omar El Sawy. We are grateful for the
time, access, and insights provided by Steve Johnson and Manish Gupta of Guthy-Renker, and Sanjay Kucheria and
Vijay Manickam of Trinus Corporation. For permission to use the case, contact [email protected].

B I a t G u t h y - R e n k e r | 2
GUTHY-RENKER: FROM INFOMERCIAL STUDIO TO DIRECT RESPONSE MARKETING LEADER
Guthy-Renker is one of the largest and most respected direct marketing companies in the world, with distribution
in 61 countries. Since 1988, Guthy-Renker has discovered and developed dozens of well-loved, high quality
consumer products in the beauty, skincare, entertainment and wellness categories. Known for award-winning
productions and marketing campaigns featuring some of today's biggest stars, Guthy-Renker has been credited
with transforming the broadcast direct marketing industry.2
Direct marketing is a business model based on what Guthy-Renker’s
website calls “the immediacy of great ideas”, designed to get products into
consumers hands as quickly and directly as possible, with equally quick and
measurable feedback on marketing campaigns. It is distinct from other
forms of marketing in two primary ways: first, it reaches consumers
directly with a sales proposition, or “call to action”, instead of pursuing
more indirect goals such as brand-building; second, it is designed to elicit
immediately measurable responses from customers. The broad category of
direct marketing includes direct mail, telemarketing, email marketing, and
other forms, as well as direct response television marketing – Guthy-
Renker’s specialty.
The basic business plan is simple: find products that offer genuine value to a wide range of consumers, produce
infomercials with celebrity spokespeople that demonstrate the value in a compelling way, add a “call to action”
such as a toll-free number, buy the media, and measure the responses from each campaign – how many calls came
in, how many orders were placed, and how many people became repeat customers.
From www.guthy-renker.com: “With so many options for consumers in our media-soaked culture, you
need to create highly-targeted communications programs. At Guthy-Renker, we go directly to the
consumer with meaningful and transformative products. And we present the benefits of these products in
such a way that consumers can begin to experience the effects of having the brand in their lives. The pure
chemistry between our products and high-profile celebrities is a refreshing truth in a time of deep
consumer skepticism. As we’ve discovered over the years, a compelling, honest, and authentic
demonstration of remarkable products is the most direct way to move our brands into fast-forward
mode.”
The directness and authenticity of the direct response marketing model is refreshing not only for consumers but
also for the marketers, who are able to roll out campaigns very quickly upon adopting a product, and measure the
performance of products and campaigns very quickly and unambiguously. Not all products are well-suited to direct
marketing (see sidebar for Guthy-Renker’s product criteria) but plenty of them are – enough for Guthy-Renker to
report sales of more than $1.5bn per year and an average annual growth rate of 25% per year over the past
decade.3
2 Source: www.guthy-renker.com.
3 Source: www.guthy-renker.com.
direct marketing: “delivering
targeted offers to identifiable
targets through specific media
and measuring the response”
Source: Frankland, D., Anderson,
E., & Joseph, J. “The Direct
Marketing Services Ecosystem”.
Forrester Research.
www.forrester.com
B I a t G u t h y - R e n k e r | 3
Guthy-Renker got its start in the mid-1980s as an infomercial marketing
partnership between Bill Guthy and Greg Renker. Their first breakout
success was marketing Napoleon Hill’s “Think & Grow Rich” series of
books and lectures, grossing $10 million in 1987. They came to believe
that there was substantial opportunity in owning the products they
marketed. Instead of merely making infomercials to advertise other
companies’ products, they would acquire and control their products from
development to marketing to distribution, and in 1988 they founded
Guthy-Renker to put this idea into practice.
Unlike a traditional marketing agency, Guthy-Renker takes ownership of
the product designs, and manages them all the way through from
manufacturing to order-taking. The firm now markets no fewer than
sixteen products in the categories of beauty, fitness, health and nutrition,
entertainment, personal development and business opportunities. By far
its star product has been Proactiv® Solution, a skin care treatment that has
fuelled Guthy-Renker’s growth for the past 15 years.
Guthy-Renker continues to seek new opportunities. The growth strategy
currently focuses on international expansion as a way for the company to
stay among the leaders in its industry. Each year, international sales
typically account for about 30% of Guthy-Renker’s revenue. Over the years, the company has launched offices in
India and Russia, and it also owns offices in Sweden, Finland, Germany, Japan, China, Australia, and the UK. Guthy-
Renker continues to expand its consumer brands product portfolio through acquisitions. In 2008 it paid $15 million
to buy Scalp Med, a line of hair care products that stimulate hair growth. The next year it signed an agreement to
begin promoting CyberDefender computer security software, its first foray into technology products.4
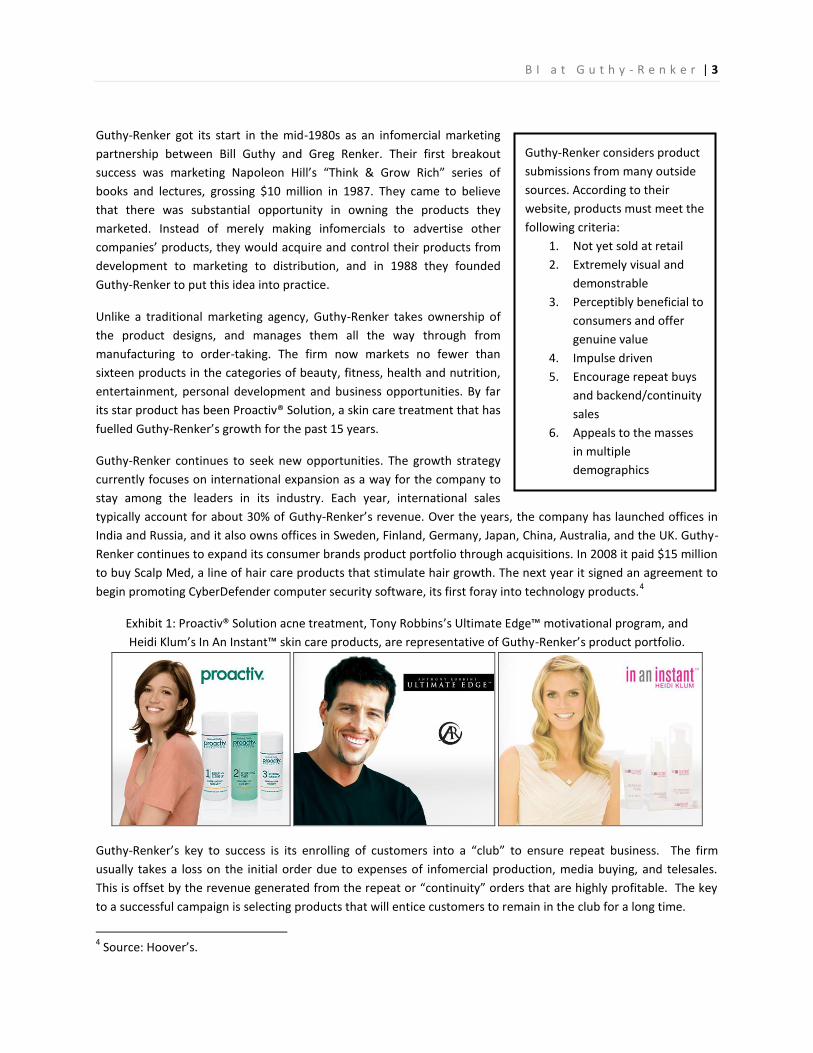
Exhibit 1: Proactiv® Solution acne treatment, Tony Robbins’s Ultimate Edge™ motivational program, and
Heidi Klum’s In An Instant™ skin care products, are representative of Guthy-Renker’s product portfolio.
Guthy-Renker’s key to success is its enrolling of customers into a “club” to ensure repeat business. The firm
usually takes a loss on the initial order due to expenses of infomercial production, media buying, and telesales.
This is offset by the revenue generated from the repeat or “continuity” orders that are highly profitable. The key
to a successful campaign is selecting products that will entice customers to remain in the club for a long time.
4 Source: Hoover’s.
Guthy-Renker considers product
submissions from many outside
sources. According to their
website, products must meet the
following criteria:
1. Not yet sold at retail
2. Extremely visual and
demonstrable
3. Perceptibly beneficial to
consumers and offer
genuine value
4. Impulse driven
5. Encourage repeat buys
and backend/continuity
sales
6. Appeals to the masses
in multiple
demographics

B I a t G u t h y - R e n k e r | 4
BUSINESS VALUE NETWORK AND “THE FUNNEL”
Today, Guthy-Renker is the entrepreneurial hub of a group of businesses that make up its value network. Guthy-
Renker produces the infomercials internally, but almost all other functions – product design, manufacturing,
media, call centers, fulfillment, shipping, customer service – are outsourced. Yet Guthy-Renker owns the
intellectual property (such as product formulas), the customers, and the data, and thus plays the leading role in
determining the future of the whole network. This makes Guthy-Renker the ideal vantage point from which to
evaluate and manage not only its own performance, but that of the entire network.
Exhibit 2: Guthy-Renker’s value network
Data
Data
Inbound
Orders
Infomercials
Media Spend
Call To Action
Toll-free Number
Web Address
Direct
Response
Data
Data
Data
International
Distributors
Kiosk & Retail
Partners
Fulfillment
Customer Service
Distribution
Telemarketing
Call Centers
Media
Inbound
OrdersProduct
Websites
Infomercial Production
Media Buying
Campaign Management
… and Business Intelligence
The success or failure of direct response marketing depends on the business’s ability to convert “responses” into
“net shipped orders” (that is, orders paid for and shipped, minus any that have been returned). Steve Johnson uses
a diagram called “The Funnel” to illustrate the steps in this process, and the numerous ways a response can “drop
off” and fail to become a net order (exhibit 3).

B I a t G u t h y - R e n k e r | 5
Exhibit 3: “The Funnel” with drop-offs explained on the left side
Managing “the Funnel” requires the ability to evaluate what is happening in many parts of the value chain, such as
the telemarketing call centers , the fulfillment centers, shipping , and customer service – all of which are
outsourced activities. Gathering information from all of these partnerships is tricky, but is essential to evaluating
and improving performance.
BUSINESS INTELLIGENCE: DISCIPLINE AND METHODOLOGY
Vital to successful competition in a dynamic and turbulent business environment are a company’s abilities to
collect and analyze data, to sense and respond to changes, and to make decisions informed by the latest and most
accurate information. For a largely virtual organization like Guthy-Renker, whose stock-in-trade is information, this
need is even more acute.
Since its earliest days, Guthy-Renker has met the need for information by relying upon its IT department to acquire
data and produce reports – phone calls received, orders placed, products shipped, etc. That required a lot of time

B I a t G u t h y - R e n k e r | 6
and labor – IT staff were often crunching numbers manually in one-off Excel worksheets – and IT didn’t understand
the business well enough to provide sophisticated analysis beyond just reporting the data. Before long, the
company’s growth and the accelerating pace of business demanded a more formal and professional approach to
decision support.
Over the same time period, the business-technology discipline of business intelligence (BI) (“a broad category of
applications, technologies, and processes for gathering, storing, accessing and analyzing data to help business
users make better decisions”)5 had grown increasingly sophisticated in its capabilities and practical accessibility to
new users.
Not long ago, a business intelligence capability typically referred to a few highly-trained analysts crunching a firm’s
historical data on powerful computers in search of patterns that could inform future decision-making (also called
“data mining”). Over the past few years, however, the BI paradigm has morphed into an approach that strives to
provide business users at all levels of authority and technical skill with the information they need, at the time they
need it, to make informed decisions. Based on the adage, “what gets measured, gets done”, BI has become faster,
cheaper, easier-to-use, and pervasive throughout the organization.
Guthy-Renker realized that in order to make the most out of its products, customers, and marketing campaigns, it
would need first-class capabilities to collect data from its partners and produce timely, accurate reports of what
was happening at all stages of “the Funnel”. In 2006, it launched its first formal business intelligence project.
EARLY BI COMES TO A STALEMATE
Before the BI project, Guthy-Renker’s data was managed with FoxPro, a database management system (DBMS)
and programming language (now called Visual FoxPro and distributed by Microsoft). The FoxPro database was
obsolete, poorly structured, and unable to scale up with the business. Furthermore, it required an enormous
amount of manual work by the IT department, which had to import and format data, run queries, and produce
reports, with little automation. The FoxPro system incorporated data from some of the partner companies, but not
all, and the IT department was too burdened with its maintenance to develop more advanced capabilities.
Guthy-Renker’s first business intelligence project scope was, to quote Steve Johnson, “kill FoxPro”. The project
replaced the outdated DBMS with IBM Cognos business intelligence software, running on an Oracle database, with
Informatica as ETL (extract, transform, load) tool. However, this initial project lacked what Steve calls
“methodology” – it primarily replicated the same table structure as the old, inadequate FoxPro system, and was
undertaken without seriously thinking about how to serve business objectives.
Steve Johnson: “When the CIO asked me to help, the first thing I noticed is that we didn’t fix the data, we
just replicated the poor FoxPro table structure. Secondly, I noticed that the business was involved in the
discussion, but not the vision. An oversight that can lead to frustrated business users later on.
5 Watson, H. J. (2009). “Tutorial: Business Intelligence – Past, Present, and Future.” Communications of the
Association for Information Systems 25, article 39, pp. 487-510.
B I a t G u t h y - R e n k e r | 7
As the business began to use the new tool, and compare the results with what they were receiving from
the partners, the data did not match. Since the BI tool was new, the assumption was that BI was wrong.
This led the business to hold BI in suspect and therefore they began to abandon the tool altogether.”
By failing to consider the business’s data needs, Guthy-Renker’s IT department had developed a costly new tool
that failed to provide any meaningful new capabilities for the business, built a bad reputation for business
intelligence, and arrived at a sort of stalemate in which no one used the tool. In order to trigger a “change wave”,
around 2008, Guthy-Renker’s CIO asked Steve Johnson and Manish Gupta to take over the BI project and put it on
the right track.
THE NEW BI TEAM: DEVELOPMENT WITH METHODOLOGY
Steve Johnson’s title is Vice President of Information Technology, and Manish Gupta’s is Director of Information
Technology. Though neither Steve nor Manish had extensive experience with business intelligence, they are both
IT leaders with many years of experience, who had worked together before and enjoyed a consistent track record
of success on projects such as enterprise resource planning (ERP) implementation as well as Supply Chain
Management. It was because of their track record that the CIO placed them in charge of turning around the
business intelligence project. Steve and Manish immediately realized that business intelligence was a different kind
of IT project that required its own methodology.
Manish Gupta: “Very early in the game I realized unlike other enterprise projects I have done, BI is not a
fixed duration project but it’s a journey with continuous evolvement. The important thing is to
understand big picture. The only way we can navigate and enjoy the ride is to make all stakeholders part
of that journey – business users, technical team, stakeholders and other leaders in the organization.”
The third pillar of the business intelligence team at Guthy-Renker is Trinus Corporation, a 15-year-old consultancy
founded by industry veteran Sanjay Kucheria and with expertise in data integration, data warehousing, business
intelligence, and enterprise planning. Guthy-Renker was initially introduced to Trinus by IBM, the provider of the
Cognos software, thus beginning a partnership Johnson describes as “an incredible, non-stop, momentous effort
since then.” Trinus’ team includes several highly-skilled Cognos and Informatica architects and developers, and is
led by Vijay Manickam, whose title at Trinus is Director, Client Services. His role at Guthy-Renker has been that of a
project architect and agenda-setter:
Vijay Manickam: “Within Guthy-Renker I play the role of business intelligence ‘lead’ or ‘solutions
architect’. The solutions architect is responsible for the development of the overall vision that underlies
the projected solution and transforms that vision through execution into the solution. The solutions
architect doesn’t look only at technology, but also is involved in process re-engineering and providing
leadership to the development team to achieve the common vision. I work very closely with the business
to understand their ‘pain points’ and convert their pain points into actionable items which results in
actually fixing those problems.”
The Trinus team’s expertise confirmed Steve and Manish’s own intuitions about what needed to be done, helping
them to generate the initiative and momentum to get the new BI project rolling. The team has articulated a
methodology for the BI project that calls for attention to three parallel “management tracks”: technology
readiness, business process re-engineering, and organizational readiness (or “change management”).

B I a t G u t h y - R e n k e r | 8
Exhibit 4: Guthy-Renker’s BI methodology
TECHNOLOGY READINESS
The technology readiness track is the primary responsibility of Manish Gupta, who recognizes that “good ideas are
only good if you can execute them” and has worked relentlessly to improve the BI team’s ability to execute on
management’s vision. From the unsuccessful BI project in 2006, Manish took away one important lesson: switching
to a new technology is not enough to bring about a vision for business transformation, if you merely migrate the
same bad processes, bad data, and bad behavior from the old systems. Changing the “attitude and aptitude” of the
development team is a vital necessity for a successful project, even if it is invisible to end users.
When Manish took the reins, he conducted a full audit of the BI project, discovering a dysfunctional software
development environment and shoddy programming practices instituted as standard operating procedures (for
example, a blurring of the lines between development and production servers). Early on, he overhauled the
development infrastructure and instituted best practices in order to create “the right environment for the right
work,” an organizational investment that has reaped dividends in terms of the team’s ability to execute on tasks.
In addition to improving infrastructure, Manish knew he would have to “shake up” the developer team. By
shuffling team members’ responsibilities, he hoped to disrupt habitual ways of thinking so that his developers
would not repeat the errors of the past. Getting it right also meant that the team would need experience with
successful BI implementation. One of the problems of the first BI project had been that the project leader didn’t
know who to trust for quality advice. Manish rebuilt the BI team by changing roles, bringing in new developers,
and importantly, by bringing in Trinus’s consultants, resulting in a team that was ready to move the ball forward.

B I a t G u t h y - R e n k e r | 9
One of the ongoing challenges in technology readiness includes the fully-outsourced nature of Guthy-Renker’s
business model. Each of Guthy-Renker’s vendors has its own independent technology infrastructure, and they vary
widely in sophistication, quality, and speed. Manish has recently been working with the vendor management team
to make sure that a commitment to technology investment is part of each new or renewed vendor agreement.
Manish Gupta: “Because of Guthy-Renker’s business model, since most of the information resides
outside; as an organization we felt that we need full command of managing information across analytical
and operational processes for organizational excellence. The key here is to have a common data model for
all data of interest regardless of the data's source, so we have taken the hub-and-spoke model approach
where Guthy-Renker’s BI system collects the information from all sources, validates it and then
redistributes to other partners for consumption.”
ORGANIZATIONAL READINESS
Organizational readiness is the primary responsibility of Steve Johnson, and it has become one of the most
important parts of a successful business intelligence project. Managing organizational readiness means “selling” BI
to the business, teaching people how to use it, and advocating and evangelizing adoption of the new tools.
Focusing on organizational readiness is a key improvement upon the previous BI projects at Guthy-Renker, which
were mainly technology-oriented and were rejected by business users.
One of the keys to preparing the organization for new BI capabilities is to involve business users at various stages
of the design and implementation process (see business process re-engineering, below). But not just anyone is
chosen – Steve’s team “cherry-picks” business people who are open-minded to the new tools, or are well-
positioned as “change agents”, to convince others to enroll into the vision. Only later are people considered “hard
to convert” brought in for training or otherwise involved.
These basic guidelines are not new – all good IT project leaders devote some resources to involving and convincing
business users – but Steve Johnson has gone further, developing a professional methodology for managing
organizational readiness. One of the tools that his leadership team uses is a version of Guthy-Renker’s organization
chart, color-coded to indicate degrees of “conversion” to business intelligence.

B I a t G u t h y - R e n k e r | 10
Exhibit 5: Part of a “traffic light chart” (names changed)
Wilma Hagans
Don't Know About Project
Tara Barclay
Lawrence Barros
Attended at least 1 Meeting
Basic Training
Go-Live Ready
Manager/
Supervisor I/C Analysts
Inventory
ControlKatie Roller
April Chatham
Ana Mcchesney
Martin Kellner
Nicholas Ludwick
Erma Franke
Ronald Wills Cora Blunt
Manager Supervisor
Order
ManagementCarolyn Shuck
Daniel Fecteau
Verna Powell
Louise Kaufman
Coordinators
Bobby Roseman Margie Woosley
Manager Specialists
Sourcing Todd Carrasquillo
Roger LayneClaudia Dickens
Theresa LacombSuzanne Dias
VP Director
Operations
Executive
This “traffic light chart” allows project managers to decide who needs persuasion, training, or other attention; it
also helps them identify departments or groups that are particularly likely to have problems with the new tools.
Some of these problems can be particularly serious – especially where jobs are threatened by the new technology
– so Steve’s team has developed strategies for mitigating them. One such strategy is an “ambassador plan”, in
which “fully-converted” project ambassadors are positioned in departments that may resist the new tools, either
to address problems when they appear or to make sure conflicts “bubble up” instead of quietly boiling.
BUSINESS PROCESS RE-ENGINEERING
At the intersection of technology readiness and organizational readiness, business process re-engineering (BPR) is
where much of the value of business intelligence is created. In the BPR track, business analysts identify the “gap”
between the current way of doing things, and the best possible way to do them. This requires an understanding of
the needs of the business as well as knowledge of the capabilities of technology, so that the team can go beyond
the question, “Can the tools do what the business wants?” and ask, “Can the tools enable us to do more than the
business realized was possible?”
The term “processes” in this context includes business rules, the way the data is transformed, ownership of data,
report reviews by business users, and more. One example is the way that conversion rates of calls to orders was
calculated; before the BI project, different departments such as telemarketing, fulfillment, and accounting may
have had different ways of calculating the same metric. The BI team introduced a standard approach by
implementing a process to determine metrics that are commonly adhered to by the enterprise, helping to create a
“single version of truth” that the business could use to make better decisions.

B I a t G u t h y - R e n k e r | 11
Vijay Manickam: “The process of consuming data by the business was not standardized before - i.e.
without any governance. BI introduced data governance and data stewardship - standardized the
definitions, improvised the insights into data and delivered the data at the right time to the right people.”
The BPR track is where the needs of the business are translated into action items for the BI developers. Trinus’s
Vijay Manickam helped Guthy-Renker develop a “get well plan”. “We came in from a strategic standpoint, where
we said ‘Let’s try to understand what is going on. Let’s try to list out every ‘pain point’ that we have in this
organization at this point.’” Trinus looked at the way processes were performed, and proposed ways to improve
them. These action items, along with explicit requests from the business, were prioritized according to their
potential for creating value. Although led by IT, the effort is jointly “owned” by other business departments.
Vijay Manickam: “The business of course shares ownership of the data. Steve leads the Business
Intelligence team in the capacity of the VP of IT. However, BI is driven by Business Interests! The
prioritization of what needs to be made available for analysis is completely owned by business. We
leverage their expertise for validation and approval of data and reports.”
BPR at Guthy-Renker proceeds in several “levels” of both current and future state and at each level, different
members of the business are invited to collaborate with the IT team. At the first, highest level meetings, high-level
managers are invited to help IT leaders understand the major activities of the enterprise, and determine what
kinds of BI capabilities are needed. At the second level, middle managers might be brought in to explain the
processes and transactions that make up a particular high-level activity. This allows the IT staff to begin planning
the technology solution, and to identify the specific hands-on users that will be using the tool. In a third or fourth
round of BPR, these hands-on users are brought in, and IT can begin to write training manuals and SOPs (standard
operating procedures) for the yet-to-be-built systems.
The BPR track goes hand-in-hand with technology readiness and organizational readiness. It supports technology
readiness by helping IT to understand business problems and determine the solutions that they must implement. It
supports organizational readiness by giving business users a chance to participate in the development and make
sure the tool suits their needs. When business people feel that their input is incorporated into the development
process, it’s far more likely that they’ll “buy in” and feel positively inclined toward using the new tool.
GOVERNING BI
One of the lessons Guthy-Renker has learned from experience is that a successful project requires effective
governance. The three project management tracks – technology readiness, organizational readiness, and business
process re-engineering – are overseen and reviewed by a project management office (PMO), and their high-level
agenda is set by a steering committee including VP-level executives from several departments. These layers of
governance serve two important purposes: to learn and improve the efficiency and effectiveness of project
implementation, and to make sure business intelligence remains aligned with Guthy-Renker’s strategic and tactical
objectives.
The steering committee is fortunate to have the sponsorship of Guthy-Renker’s two co-CEOs, Kevin Knee and Ben
Van de Bunt.6 Their sponsorship of the project gave it the momentum it needed to begin winning the trust of
6 Founders Bill Guthy and Greg Renker are now co-Chairmen of the Board.

B I a t G u t h y - R e n k e r | 12
managers who had been disappointed by the previous BI implementation, and encouraged the steering committee
to align BI with the company’s strategic objectives. As a multi-disciplinary team, the committee’s major role is to
prioritize BI initiatives, taking into consideration the company’s strategy but also their own goals. Forcing
departments to agree on which projects will be done first makes each of them think about which of their projects
will have the greatest impact on performance. Being involved in the governance committee motivates executives
to take “ownership” of the BI reports and capabilities they request, and to make sure their employees use them.7
Though Steve, Manish, and Vijay are all part of the IT team, they stress that business intelligence would be doomed
to failure if it came to be seen an “IT project”. At its heart, the goal of implementing BI is to transform the way
Guthy-Renker does business – to create new ways of evaluating performance, uncover hidden opportunities, and
make new information-based strategies possible. IT has an important job to do as far as architecting and building
the technology, but it is the partnership with other departments, and the multidisciplinary leadership, that makes
BI a “digital transformation” project. In the next section, we describe how the project has unfolded.
A NEW ARCHITECTURE FOR BUSINESS INTELLIGENCE
The changes implemented at Guthy-Renker are best visualized by comparing Exhibit 6, the state of data processing
at Guthy-Renker before the first business intelligence project, with Exhibit 7, the BI team’s goal scenario. The
earlier FoxPro-based IT system was characterized by few data sources, a few simple reports for a limited group of
users, and several labor-intensive manual steps (represented by the blue arrows in Exhibit 6).
One of the implications of the manual effort required in the “before” scenario was that it limited IT’s ability to add
capabilities to the system. FoxPro developers already spent many hours gathering and formatting data to be put
into FoxPro, and many more hours querying the database and producing reports. Adding new data sources and
producing new reports would have multiplied their work. To get from this scenario to a practical business
intelligence implementation required not just an increase in scale or computer power, but a new IT architecture.
Exhibit 7 shows the ideal business intelligence architecture envisioned by Steve, Manish, and Vijay. A key
difference is that all data sources supply data directly to a business intelligence system (such as a data warehouse
– see next section), by way of automatic ETL (extract, transform, and load) tools, so that IT staff no longer have to
manually load data every day, week, or month that they are produced. Then developers and analysts who want to
produce reports deal directly with the BI system, and don’t have to worry about the quirks and idiosyncracies of
the original data sources.
7 For more on the role of executive sponsors and the steering committee, see: Eckerson, Wayne W. (2009).
“Performance management strategies: How to create and deploy effective metrics.” TDWI Best Practices Report.
Accessed April 17, 2010 from: http://tdwi.org/research/2009/01/performance-management-strategies-how-to-
create-and-deploy-effective-metrics.aspx?sc_lang=en

B I a t G u t h y - R e n k e r | 13
Exhibit 6: Processing data at Guthy-Renker before BI
Exhibit 7: Intended BI architecture at Guthy-Renker

B I a t G u t h y - R e n k e r | 14
In order to achieve the ideal architecture, therefore, IT had to first get to work upgrading its behind-the-scenes
capabilities and automating the most tedious work. Some of the first improvements were the implementation of
audits, balances, and checks (“ABC”) to improve “data hygiene” and reduce the manual corrections that need to be
done in data loading. One these tasks were complete, the BI team was able to add new data sources and roll out
new reporting tools for a wider range of business users. The next section describes the components of the business
intelligence system Guthy-Renker is building.
ELEMENTS OF A BUSINESS INTELLIGENCE SOLUTION
Data source systems
Part of implementing a business intelligence solution is identifying and locating the relevant data within an
organization. These may be structured data stored in relational databases, or unstructured data kept in
spreadsheets and other formats. They may be dispersed among departments and functions, or centralized. In
Guthy-Renker’s case, most of the data originates from its partners and vendors, each of which may use different
technologies and terms. Potential problems include redundant data, stored in multiple sources with varying levels
of accuracy and completeness.
Enterprise Data Warehouse (EDW)
A data warehouse is a central repository for organizational data, built to ensure that all data is validated,
consistent in its definition, and permanently stored for historical analysis. It solves the problem of redundant and
inconsistent data sources, by reconciling all data into “one version of the truth” that all business users and BI
analysts can draw on. Guthy-Renker is in the process of rolling out an EDW, and currently uses an operational data
store (ODS) instead, a more dynamic kind of data repository with the principal difference being the lack of
complete data history.
Extract, transform, load (ETL) tools
Data from diverse sources are “cleaned”, rendered consistent, and loaded into the data warehouse or ODS by
means of an ETL tool. Before Guthy-Renker adopted business intelligence, its FoxPro developers had to clean and
transform data manually by manipulating complex Excel spreadsheets, wasting countless hours. Implementing ETL
software to automate this work was a major “behind-the-scenes” fix that freed up the IT staff to work on higher-
level functionality like providing new reports for business users.
Reports, Dashboards, Scorecards, and Alerts
From the point of view of most business users, business intelligence is about asking business questions and getting
timely answers. There are a number of “interfaces” by which BI can satisfy their needs. Reports can be daily,
weekly, monthly, or on-demand documents that provide information in a pre-defined format. Guthy-Renker’s
reporting capabilities have significantly matured from the FoxPro days; with Cognos they can provide more types
of reports, faster, with analysis, charts, graphs, and other content that was not possible before. Dashboards and
scorecards represent simple interfaces that allow users to monitor a small set of key performance indicators
(KPIs) in near real-time via a computer screen, web page, or mobile device. Alerts are software programs that
monitor KPIs and send an e-mail or some other kind of message when a condition is met, such as a KPI falling
below acceptable levels.

B I a t G u t h y - R e n k e r | 15
Analytics/Cubes
In addition to pre-defined reports, dashboards, scorecards, and alerts, business users also need to be able to ask
one-off, “ad hoc” queries of the data, and receive answers on the fly. Some of the tools for this include data marts
and OLAP cubes, bounded subsets of data prepared for specific types of questions, which can be queried much
faster than the entire data warehouse. Power users and professional analysts have always demanded these
capabilities, but the trend in BI software design is to try to make them more accessible to common users.
Reports, dashboards, scorecards, alerts, and analytics interfaces like OLAP cubes serve different goals for different
users. They may serve operational, tactical, and strategic purposes for everyone from line managers to executives,
casual users to professional analysts. Trinus describes these interfaces in terms of a “BI continuum”:
Exhibit 8: The BI continuum
Exhibit 9 (next page) shows what some of Guthy-Renker’s report, dashboard, and analytics interfaces look like.

B I a t G u t h y - R e n k e r | 16
Exhib
it 9: Sam
ple
s of G
uth
y-Ren
ker Rep
orts an
d D
ashb
oard
Interface
s
B I a t G u t h y - R e n k e r | 17
BI SOFTWARE PLATFORM
Guthy-Renker’s business intelligence project employs IBM’s Cognos BI platform and Informatica’s data integration
platform. Cognos is one of the top BI solutions on the market, and competes with such brands as SAP’s Business
Objects, Oracle’s Business Intelligence, SAS, and MicroStrategy. Cognos distinguishes itself from its competitors by
offering a comprehensive package based on open standards, modular deployment, and compatibility with third-
party software. Its appeal to business users is that it can leverage the investments they have already made by
integrating the data from legacy systems seamlessly into the new Cognos interface; its appeal to IT departments is
that they can deploy Cognos module-by-module and scale up and out as the business’s needs grow. IBM’s
marketing for Cognos stresses the different, and at times hard-to-balance, needs of business and IT:
IBM: “Business intelligence epitomizes the classic struggle between IT and business. Business users will
not embrace business intelligence until they can get it on their own terms. They protest that they can’t
wait for IT and need direct access to information. They say they need to see things their way. They may
say BI is too hard to use and they prefer a different interface.
Still, IT has an important job to do. IT delivers the platform that secures information, integrates data
sources, provides a foundation that masks the complexity of heterogeneous data sources and provides
complete, consistent access to information throughout the enterprise. Only IT can ensure the security,
availability and reliability of business intelligence.”8
Some of Cognos’s key features include:
Reports, dashboards, scorecards, and alerts designed for users of very different levels of technical skill,
including casual users. Role-based security makes sure each user gets access to all the data they need, and
no more. Easy interfaces empower users to take advantage of self-service BI without needing to know SQL
or be technically savvy.
Complete, consistent access to information the business understands. Multiple data sources in numerous
locations can be integrated seamlessly. Data is explained by a common business model that makes it
intelligible to casual users without deep technical expertise.
Service-oriented architecture (SOA), based on open standards, and completely environment neutral.
These features facilitate scaling up and out as business needs change. The modular architecture and open
API means that Cognos modules can incorporate, or be incorporated by, third-party applications.
INFORMATICA PLATFORM
The foundation upon which Guthy-Renker’s Cognos BI system is built is the Informatica data integration platform,
also referred to as an ETL (extract, transform, load) tool. A data integration platform is “a comprehensive set of
technologies for accessing, discovering, cleansing, integrating, and delivering data to the extended enterprise”, and
8 IBM (2008). “The full promise of business intelligence” (white paper). Accessed March 31, 2010 from:
http://www-01.ibm.com/software/data/cognos/products/cognos-8-business-intelligence/capabilities.html

B I a t G u t h y - R e n k e r | 18
it is a vitally important behind-the-scenes technology that makes BI possible.9 Informatica allows Guthy-Renker to
draw upon data from a variety of sources from within and without, and importantly, to maintain access to the data
as projects and technologies change.
One of the biggest problems as a business intelligence project grows is the burden of ongoing maintenance.
Informatica’s website states that “a new data integration challenge is born with every IT project” but the burden of
maintaining integration solutions remains even after the project is finished. Over time, a larger and larger amount
of an IT department’s time becomes dedicated to maintaining existing systems, and less time is available for
developing new ones. Informatica offers solutions to this problem:
Reusability of skills and assets from project to project helps developers avoid reinventing the wheel.
Shared metadata means that every BI application built on the Informatica platform draws on the same
metadata (“data about data” such as the location, meaning, and business rules that define a data source)
so that new coding doesn’t have to be done each time.
A unified software engine means that software upgrades don’t have to be coordinated enterprise-wide; if
a new version of Informatica comes out, the system can be upgraded in one place and done, without
breaking any connections between subsystems.
Informatica is the leading ETL platform, and its
website claims that “three times more developers
know Informatica than any other data integration
software on the market”. It differentiates itself by
offering a complete package of tools that serve
the entire “data integration life cycle”: access
(data from all kinds of sources without and within
an organization), discover (the meaning,
structure, and rules of each data set), cleanse (the
data to ensure quality, accuracy, and
completeness), integrate (multiple data sources
into one resource), and deliver (the right data at
the right time to the people who need it).
Among the platform’s other features are role-based tools for different kinds of BI developers and team members
to help administrators “audit, manage, and monitor” the platform, and to help developers “define, design, and
develop” data integration processes. Like Cognos, Informatica is also an open platform, designed to allow IT
departments to use it with other software from almost any brand. This not only allows Guthy-Renker to leverage
existing investments in legacy systems, but is also indispensible in integrating data from its vendors’ and partners’
databases. Informatica helps Guthy-Renker move from “keeping the lights on” to bringing new projects to light.
9 Informatica (2009). “The Power of the Platform: How a data integration platform can help IT organizations lower
costs, improve efficiency, and deliver greater value to the business” (white paper). Accessed April 22, 2010 from:
http://www.informatica.com/products_services/Pages/index.aspx
Exhibit 10: Informatica Platform Diagram

B I a t G u t h y - R e n k e r | 19
DELIVERING KEY PERFORMANCE INDICATORS AT GUTHY-RENKER
Business intelligence is based on the philosophy that “what gets measured, gets done”, and BI capabilities are
often described in terms of key performance indicators, or KPIs. KPIs are more than just measurements; they are
measurements that embody strategic objectives. They help executives to evaluate performance but also to
communicate strategic and tactical goals to their departments. For IT, the challenge was figuring out how the data
could be collected, but for the project’s business participants, an equally important question was what ought to be
measured, and when the data needed to be known.
Steve Johnson: “We approach data in what do we need to know daily, weekly, and monthly. Secondly, just
because we historically did things in monthly cycles did not mean that we had to continue using the same
cycles. We identified what data we could access more frequently and determined if it made sense to
calculate on a shorter cycle time.
The Daily Flash is the focus of daily reporting (the pulse). This represents how many times the phone
rings, how many calls are converted into orders, and this is represented by the channel from which the
order derived. Weekly reporting is a reconciliation of shipments to orders and the revenue generated.
This would represent both acquisition (starts) as well as retention (continuity) orders. Monthly is geared
towards contra revenue transactions (returns), closing the general ledger, forecasting, and identifying
trend lines against the Enterprise Key Performance Indicators.”
Exhibit 11 highlights some of the most important KPIs for Guthy-Renker.
Exhibit 11: Guthy-Renker KPIs
Marketing / Sales Customer ExperienceSupply Chain Management
Enterprise KPI’s
• Cost Per Order
• Call to Order Ratio
• Conversion Rate
• Abandon Rate
• Total Average Order Volume
• Average Order Value (AOV)
• Customer Life Time Value
• First Call Resolution
• Cancel Save
• Retention / Attrition Rate (stick
rate)
• Fill Rate
• Returns / Refunds
• Order to Ship Rate
• Fill Rate
• Back Order
• Inventory Turns
Departmental KPI’s
• Return on Promotional
Investment (ROPI)
• Return on Variable Investment
(ROVI)
• Average Talk Time
• Return Rate by Ship Date
• First Call Resolution
• Abandon Rate
• Order to Ship Rate
• Back Order Percentage
Operational KPI’s • TBD • TBD • TBD
Standard Reporting
(daily, weekly, monthly)
• BI DIOR
• Weekly Budget vs Shipment
• Shipped % by Channel
• TBD • TBD
Analytics
(data marts, cubes)
• Orders – USA
• Telemarketing Orders – USA
• Web Orders & Campaigns
• Sales & Financial Returns
• Sales Attrition
• Back Order
P & L

B I a t G u t h y - R e n k e r | 20
Of the several KPIs implemented to date, three in particular represent important milestones in the evolution of the
business intelligence project:
COST PER ORDER
One of the most important KPIs for a direct response marketing company is media cost per order (CPO). It is
simple division – the cost of media spending on a product, divided by the numbers of orders that come in. Guthy-
Renker has been able to approximate this figure since its very earliest days, but business intelligence has enhanced
the KPI significantly. Now, instead of dividing total media spend by total orders, the company can calculate the
number of orders for an individual infomercial – based on the time the calls come in, and unique toll-free numbers
assigned to each campaign.
CUSTOMER LIFETIME VALUE
Since Guthy-Renker operates on a “club” model, enrolling customers to make multiple, “continuity” purchases of
products like Proactiv® Solution, some of the other important metrics are retention rate and customer lifetime
value (LTV). Even at a relatively high CPO for initial orders, Guthy-Renker can have a very profitable campaign if its
products have a consistently high retention rate. The initial CPO is offset by repeat purchases, making for a high
lifetime value. Potentially, the company can also distinguish between types of customers in terms of lifetime value
– customers who return products often, or fail to pay their bills, are less valuable to the company than those who
make consistent repeat orders. Distinguishing between customers allows Guthy-Renker to decide which customers
are worth targeting with “win-back” campaigns if they fall off “the Funnel” at any stage, and which customers are
worth just letting go.
RETURN ON PROMOTIONAL INVESTMENT
Steve Johnson considers the latest, greatest success of the BI project to be the development of a new KPI: return
on promotional investment (ROPI). Essentially, it divides the lifetime profit from a group of customers back to the
cost of the individual infomercial that brought them in. Calculating this KPI represents a monumental effort in data
collection, data integration, and analysis. Consider what goes into the calculation:
For each new order, BI has to determine which specific infomercial (at what time, on what channel, at
what cost) brought the customer in. This relies on the new CPO capability just recently rolled out.
Everything that happens with that order has to be kept track of; in the past, many of the databases used
by Guthy-Renker’s partner companies were inconsistent. The order number used by the call center might
be different from that used by the fulfillment center. Guthy-Renker would know how many orders were
taken, how many credit cards were rejected, how many orders were returned, and so on, but could not
tell for any particular order what happened to it, whether it was a profit or a loss. The solution to this
problem required implementing a persistent order ID (POID) uniting all of the databases so that orders,
shipments, and returns could be tracked back to the initial call.
Similarly, when customers called to order more of a product, Guthy-Renker had to know which customer
was making a continuity order. It was not enough to simply calculate the average retention rate based on
the ratio of continuity orders to initial orders. BI first had to develop a continuity ID for each individual

B I a t G u t h y - R e n k e r | 21
customer, again connecting multiple databases, that gave them the abilty to determine each customer’s
LTV, including initial and repeat orders as well as returns and customer service costs.
Only when the lifetime value of every customer, including every order, return, repeat order, and customer service
costs, could be tracked back to the individual infomercial that they responded to, could BI implement the ROPI
report. It was a landmark achievement in terms of integrating the data from all of Guthy-Renker’s partner
companies.
Exhibit 12:POID and Continuity ID make the ROPI calculation possible
ONGOING CHALLENGES
IT DEVELOPMENT FOR AN “ATTENTION-SHIFTING” ORGANIZATION
Steve describes Guthy-Renker as an organization of high-energy entrepreneurs; constantly shifting the focus of
their attention to new initiatives. This poses a difficult challenge for cooperation between IT and business, because
software developers are trained to complete their projects in a linear, step-by-step manner, whereas
entrepreneurial managers need to be able to test ideas and evaluate feedback in a quick, cyclical manner. The
greatest advantage of the direct response marketing business model is the near-instant feedback loop, and to take
advantage of this, Guthy-Renker’s managers need to be able to change plans frequently. They would rather have
“good-enough” reports immediately than perfect, bug-free reports months later.
When Steve and Manish took over the BI project, the
tension between IT and business was palpable – every
mistake they made was met with anger and rejection, as
the business had no patience for the failed BI undertaking.
Indeed from Steve’s point of view, one sign that the project
has turned around now is that BI can make mistakes and
expect forgiveness.
BI has adapted its approach to suit the organization. Instead
of the classic “waterfall” development approach favored by
software engineers who want to bring projects to perfect
completion, Guthy-Renker’s BI development team uses an
“agile” approach that allows them to serve the business’s
needs and deliver frequent, small successes. “One of the
things we try to do is to add incremental value. So maybe
we’re not hitting a home run, but we try to hit a single
waterfall approach: “a sequential software
development process, in which progress is seen as
flowing steadily downwards (like a waterfall)
through the phases of conception, initiation,
analysis, design (validation), construction, testing
and maintenance”
agile approach: “a group of software development
methodologies based on iterative development,
where requirements and solutions evolve through
collaboration between self-organizing cross-
functional teams”
Source: Wikipedia

B I a t G u t h y - R e n k e r | 22
every month, or at least a couple of singles in a quarter.”
Steve’s idea of the best possible relationship between BI and the business is one characterized by dialogue,
feedback, and “hefty debate” that helps them to make sure they’ve thought of everything that needs to be done,
and smoothes the launch of new BI tools.
MANAGING OVER-REACTION
When Steve Johnson prepared to take on the organizational readiness part of the problem, he expected to deal
with lots of legacy reports, data silos, and inconsistencies between BI and third party reports – typical problems of
organizational resistance to adopting new technology – but one problem took him totally by surprise: the problem
of business users over-reacting to new reports.
Steve Johnson: “In a company that literally in the span of a couple of years went from a million points of
data, and not really good… to having true information that is being measured correctly, quantified, and
being displayed in a manner that gets you to the critical piece quickly… has been a bit of a challenge. And,
one of the things we had to become acutely aware of was people’s desire to over-react to the information
they were seeing…
So all of a sudden we have an organization that’s starved for information and they start getting it. And
they want to over-react. I always use the analogy of ants. Ants march along, they’re just on their path and
they’ll do that all day, every day, until there is no more of whatever it is they’re collecting at that spot…
but if you drop a leaf in front of them, they kind of go crazy, until someone realizes they can just walk
around the leaf and keep going. Well for us, when we started dropping reports for people, reports that
people got a sense were valid and accurate and had integrity, that’s what started to happen. People just
started swarming…
So when you provide a flash report, the notion of a flash report is it’s just a pulse. It doesn’t say anything
about what the heart’s doing… It’s going to the doctor and the nurse comes in and takes your pulse. But
it’s not an EKG. But people wanted it to mean an EKG. So how do you get people to understand that?”
Steve’s team thought that providing information quickly and accurately would be meaningful, not disruptive, but
to their surprise they found that new BI tools caused enormous distractions. In addition to the job they expected,
of having to persuade users to adopt business intelligence, they also had to do the opposite: temper expectations
and teach business people how to use the data properly.
BI FOR THE VIRTUAL ENTERPRISE
Guthy-Renker is different from many other companies in that it does very little within its walls except infomercial
production and campaign management. Almost all the functions of its business, from manufacturing, to order-
taking, shipment, and customer service, are outsourced to other companies. Furthermore, the structure of these
relationships is hard to fit into the traditional notion of a “supply chain”. Instead, Guthy-Renker is the hub of a
“value network” or “value ecosystem”. Guthy-Renker controls all of the intellectual property for its products and
marketing, and works with third-party vendors who are mostly dependent on Guthy-Renker for the bulk of their
revenue. (Only the call centers do a significant portion of their business with other customers.) Exhibit 2 (printed
again below) captures just some of this complexity.

B I a t G u t h y - R e n k e r | 23
Adding to the complexity of the situation are Guthy-Renker’s international partnerships. International distribution
has been the biggest driver of growth for the company in recent years, and it has primarily proceeded by
acquisition, so Guthy-Renker’s many overseas branches each have their own IT systems with varying levels of
sophistication.
Gathering and integrating data from this “extended enterprise” to create a successful business intelligence
infrastructure has been no easy task, and it has been an ongoing technical challenge. It is also an organizational
challenge, as the control of information is intimately tied up with decision-making authority. Speculating about the
company’s international expansion, Manish Gupta states, “The first question is how the organization will be
structured, then we can determine how to serve the international community with business intelligence.” Yet, in
addition to challenges, this unusual set of circumstances may offer hidden opportunities for profit and innovation.
Exhibit 2: Guthy-Renker’s value network
Data
Data
Inbound
Orders
Infomercials
Media Spend
Call To Action
Toll-free Number
Web Address
Direct
Response
Data
Data
Data
International
Distributors
Kiosk & Retail
Partners
Fulfillment
Customer Service
Distribution
Telemarketing
Call Centers
Media
Inbound
OrdersProduct
Websites
Infomercial Production
Media Buying
Campaign Management
… and Business Intelligence