Embed Size (px)
Citation preview
Business Dynamics on American Indian Reservations: Evidence
from Longitudinal Datasets
by
Randall Akee
UCLA, Brookings Institution and NBER
Elton Mykerezi
University of Minnesota
Richard Todd
Federal Reserve Bank of Minneapolis
CES 20-38 November, 2020
The research program of the Center for Economic Studies (CES) produces a wide range of
economic analyses to improve the statistical programs of the U.S. Census Bureau. Many of these
analyses take the form of CES research papers. The papers have not undergone the review accorded
Census Bureau publications and no endorsement should be inferred. Any opinions and conclusions
expressed herein are those of the author(s) and do not necessarily represent the views of the U.S.
Census Bureau. All results have been reviewed to ensure that no confidential information is
disclosed. Republication in whole or part must be cleared with the authors.
To obtain information about the series, see www.census.gov/ces or contact Christopher Goetz,
Editor, Discussion Papers, U.S. Census Bureau, Center for Economic Studies 5K038E, 4600 Silver
Hill Road, Washington, DC 20233, [email protected]. To subscribe to the series,
please click here.

Abstract
We use confidential US Census Bureau data to analyze the difference in business establishment
dynamics by geographic location on or off of American Indian reservations over the period of the
Great Recession, and subsequent recovery (2007-2016). We geocoded U.S. Census Bureau’s
Longitudinal Business Database, a dataset with records of all employer business establishments in
the U.S. for location in an American Indian Reservation and used it to examine whether there are
differences in business establishment survival rates over time by virtue of their location. We find
that business establishments located on American Indian reservations have higher survival rates
than establishments located in comparable counties. These results are particularly strong for the
education, arts and entertainment, wholesale and retail, and public administration industries. While
we are not fully able to explain this result, it is consistent with the business establishments being
positively selected with respect to survival given the large obstacles necessary to start a business
on a reservation in the first place. Alternatively, there may be certain safeguards in a reservation
economy that protect business establishments from external economic shocks.
Keyword: Entrepreneurship, Great Recession, American Indians, Employment, Business
Deaths
*
* The views here are those of the authors and not necessarily those of the U.S. Census Bureau, Federal Reserve Bank
of Minneapolis or the Federal Reserve System. This material is based upon work that is supported by the National
Institute of Food and Agriculture, U.S. Department of Agriculture, under award number MIN- 14-G19. Any
opinions, findings, conclusions, or recommendations expressed in this publication are those of the authors and do
not necessarily reflect the view of the U.S. Department of Agriculture. Any errors are ours alone. Author contact
information: Akee: [email protected]; Mykerezi: [email protected]; Todd:[email protected]

1 Introduction
In the United States, employment growth is driven primarily by new business start-up and
entrepreneurship activities. Entrepreneurship activities have often been seen as an impor-
tant pathway to employment creation and economic development in particular for parts of
the country that have persistent unemployment. One important example of this is American
Indian reservations, which have historically had some of the highest rates of unemployment
and under-employment in the U.S. Generations of policy-makers, tribal leaders and academics
have explored various obstacles to business development on reservations. The lack of economic
opportunity on American Indian reservations was an important justification for the passage of
the Indian Gaming Regulatory Act (1988), for instance, which was intended to stimulate rev-
enue but also employment opportunities on American Indian reservations. However, a relative
shortage of reliable business data for reservations has presented substantial limitations.
Indeed, Cornell and Kalt (1992) discuss the possibility of establishing micro-enterprises as
a viable strategy for American Indian economic development on reservation lands. The authors
view private micro-enterprises as a strategy that is consistent with the scarcity of capital in
Indian reservations. The authors acknowledge that this is similar to the economy of much of
the rural and small town United States, where raising large amounts of capital is difficult, but
capital tends to be even scarcer in reservations.
In their pioneering work, Cornell and Kalt established a connection between tribal gov-
ernance, institutions and economic development success in their influential book, ”What Can
Tribes Do?” This book discussed two findings that have permeated much of their work: the
separation and limitation of political powers; and the separation of electoral politics from day-to-
day management of business enterprises (Cornell and Kalt, 1992, p.21 and 26). In subsequent
work, Cornell and Kalt (1995) examined differences across the Apache and Sioux tribes and
their economic development success. They arrived at the conclusion that constitutional form
and cultural match was an important determinant in the political legitimacy and eventual long-
run economic development outcomes. In the case of the Apache, there was a fortuitous match
between political and legal authority at the tribal level and cultural norms; for the Sioux there
was no match and poor economic development outcomes have ensued. This analysis, based on
case studies, reinforced their prior findings.
Following their conceptual models and case studies, Cornell and Kalt (2000) embarked
upon an empirical analysis of American Indian economic development. Cornell and Kalt ex-
amined the determinants of economic development on American Indian reservations using data
from the U.S. Census and the Bureau of Indian Affairs. Their analysis serves as the founda-
tion for all subsequent research which takes as a basis that the separation of powers, checks
on tribal government authority over business operations authority are important factors for
long-run success. They have shown that there is an important link between reservation insti-
tutions and economic development success on reservations. In their seminal empirical analysis,
they identified several characteristics that tend to describe the most successful American In-
dian reservations, governments and economic activities. Examining 67 of the largest American
Indian tribes, they find that there is a strong relationship between having a strong executive
and a strong legislative branch on reservation-level employment. Additionally, they found that
1

a congruence in the political institutions at the tribal level and cultural institutions are often
associated with better economic outcomes.
Building upon this research, others have identified potential obstacles to business cre-
ation, expansion and success. For instance, trust lands are notoriously difficult to use as collat-
eral with commercial mortgage lenders. As a result, land ownership does not necessarily imply
that tribal or individual American Indian landowners are able to access the capital necessary
for investment in new business ventures (Carlson, 1981). However, Akee (2009); Akee and Jor-
gensen (2014) have found that tribes are able to innovate and devise solutions that allow for
housing and business development to converge in value to that of non-reservation areas.
Nevertheless, many untested hypotheses and questions about reservation-based firms re-
main unanswered. While economists have been able to study minority or other small population-
base entrepreneurship in the past (Fairlie and Meyer, 1996; Fairlie and Robb, 2010) this has not
been possible for the American Indian population due to small sample sizes or the lack of firm
or establishment location information. As a result, very little is known about the determinants
of business start-up and success for American Indians in general. Many of the established find-
ings and results for other groups on business-start up and determinants of entrepreneurship are
woefully understudied in the American Indian context. For instance, it is well-established that
parent’s prior entrepreneurship is an important determinant in business success; additionally
access to capital is an important input as well.
In recent years, improvements in data infrastructure has made it easier to identify and
track firm and establishment creation, expansion and closures. For instance, the the Census
Bureau’s Longitudinal Business Database and Integrated Longitudinal Business Databases have
made it possible to reliably observe birth and longevity for almost all employer and non-employer
establishments nationwide. In this study we are using an version of the LBD that was augmented
with better geospatial data to make it possible to identify whether these firms or individual
establishments are located on or off of American Indian reservations. Previously, data was
only available at the county or state-level, which obscured reservation location of business
establishments. It is now possible to test a series of hypotheses about the viability, composition
and competitiveness of firms on and off of reservation lands using national-level data.
Our current analysis focuses on a core question that results from the Cornell and Kalt
research agenda. Specifically, we ask whether there is any difference in establishment survival
on or off of American Indian reservations. We examine business establishment survival over the
period of the Great Recession and subsequent recovery (2007-2016) for establishments located
on American Indian reservations as compared to establishments in all other counties. Given
the lessons learned from the Cornell and Kalt research regarding the differences in institutional
political structures, accountability and access to finance for tribal governments and reservations,
we expect there to be significant differences in business survival for reservation-based establish-
ments. There are significant obstacles to business start-up on reservations in terms of access to
capital and, potentially, additional bureaucracy at the tribal level. This would imply that there
is positive self-selection at birth; only the viable ideas are able to get off the ground. On the
other hand, customer loyalty and the lack of competitors may improve establishment success
for those that are able to open up on reservations. Both of these factors would argue for higher
2

survival rates among existing firms in reservations. Conversely, access to capital during oper-
ations and other institutional factors may inhibit reservation firms’ ability to overcome shocks
and cause lower survival rates.
In order to conduct this analysis, we link the U.S. Census Bureaus Standard Statistical
Establishment List (SSEL) and Longitudinal Business Database (LBD) of establishments with
employees (employer establishments).1 We geocode (i.e., assign longitude and latitude coor-
dinates to) the address of each establishment and use the location coordinates to create new
variables that identify whether an establishment is located in an American Indian reservation
(and if so, which one). We were able to geocode establishments in existence between 2007 and
2012 and are able to use the LBD as a geocoded panel data set for this time-frame. As a result,
we can examine whether firms have a differential probability of going out of business by virtue
of their location on or off of reservation lands.
In this analysis, we find that, on average, location on a reservation is associated with
higher business establishment survival rates than is location off of reservations. These results
are robust to the inclusion of the age of the establishment and other control variables such
as average regional educational attainment and poverty rates. We also separate the analysis
by two-digit North American Industry Classification System codes (NAICS) and find broadly
similar results for the education, arts and entertainment, accommodations and food, wholesale
and retail, information and finance, and the public administration industries. We find that the
age of the business establishment has a positive effect on the survival of establishments over
time but that each year has a diminishing positive effect on survival. This holds for all industries
except for the Arts and Entertainment industries, for which the effect is linear.
This research will serve as the beginning of additional analyses that will focus more
directly on the broader determinants of business survival and creation. There are several ad-
ditional hypotheses that should be investigated which also follow directly from the Cornell
and Kalt research. For instance, we will examine in future work whether there are important
differences for existing reservation-based establishments based upon the specific mix of tribal
government institutions on each reservation. In future analysis we will extend this research
to show whether different levels of government accountability and/or access to capital affects
long-run business duration as predicted by the work of Cornell and Kalt.
The next section provides a description of the data used and the geocoding for reservation
location. Section 3 describes our empirical strategy and Section 4 provides the results. In Section
5 we discuss the results and conclude.
2 Data Description
We primarily use the U.S. Census Bureau Center for Economic Studies Longitudinal Business
Database (LBD), which is available to researchers as a restricted-use data set. From 1975 on,
1Our prior research using these datasets (Akee et al., 2017) identifies differences in the distribution offirms by industry and the total employment for establishments by location on or off of reservations in 2010.We find that reservations have a similar industry mix of establishments but fewer total establishmentsper capita. On the other hand, we find that establishments in the casino and government sectors givereservations an edge in total jobs.
3

the LBD contains annual employment, payroll, and industry classification data for all workplace
establishments that file social security taxes or withhold federal payroll taxes for their employees
(Jarmin and Miranda 2002; Fairman et al. 2008; 2016 personal communication from Kristin
McCue of the U.S. Census Bureau). We link individual business establishments using their
unique identification number across the years 2007-2012.
The LBD records are linked to establishment data in the SSEL maintained by the U.S.
Census Bureau in order to obtain the establishment location information. We also use SAS
procedures and geographic data files to conduct our own geocoding of the establishment ad-
dresses.2
Once we have the addresses for the business establishments, we are able to assign whether
the business is located on or off a federally-recognized American Indian reservation. We use
their geographic coordinates and TIGER/Line Shapefiles for reservation boundaries in order
to identify these geographic units. Finally, we override a small percentage of these reservation
codes in cases where the establishments 5-digit ZIP code is inconsistent with our geocoding
results.
In this analysis we restrict our sample to only federally recognized reservations in the
contiguous 48-states. The analysis is based on all employer firm establishments that were
operating at some point between 2007 and 2012. We use establishment-level observations for
all firms in existence at some point between 2007 and and 2012, and record firm failure and
age at failure during the observable period. While we could only geocode establishments in
existence between 2007 and 2012, the LBD, in each wave, provides information on when each
establishment was first and last observed; these dates range between the first year of the LBD
(1975) and the most recent wave available (2016 in this study). These data make it possible to
compute age in 2007 (when we first observe location for all establishments in existence that year)
and each subsequent year including the year of eventual failure (up to 2016). Establishments
not in existance in 2007 are born during the observation period (thus age first observed is 0),
while those that do not fail during the observation period are treated as top-censored in 2016.
We provide descriptive statistics in Table 1 below. Column 1 provides the means for
all business establishments combined. Column 2 provides the means for the business establish-
ments in non-reservation counties. Column 3 provides the means for establishments located on
reservations.3 For all observations in total, the average age at death (or censoring) is about 13
years and about 40% of all establishments die at some point in our observation period. The
average initial age at which we observe an establishment is about 7 and a half years old. The
poverty rate in the local community is on average 14% and about 30% of the local population
has a BS degree or higher. About 15% of the observations are rural locations while 10% are
2Multiple considerations led us to this decision. Although the SSEL contains some Census-providedgeolocation data, this information was not ideal for our purposes. Many SSEL records have missinglatitude-longitude or Census block data, so we attempt to expand the set of records with usable geocodes.In addition, we have only limited documentation explaining how the geographic coordinates and Censusblock codes in the SSEL were determined. We use SAS procedures to geocode the physical addresseswhere available and the mailing address otherwise (on the assumption that the mailing address is alsothe physical address for those records). For more information, see (Akee et al., 2017).
3Note that we show the table of means completely dissaggregated for these same three groups by eachindustry in Appendix Tables A1, A2 and A3.
4

remote (which indicates the furthest from urban centers and sparsest locations among rural
counties according to Economic Research Service, US Dept of Agriculture Rural-Urban Contin-
uum Code Definitions). These two variables are not mutually exclusive; rural locations have a
RUCC score of 4 or more while remote locations have a score of 7 or more.4 Finally, less than
1 percent of the observations are located on reservations in this data. This is not surprising
given the small population size of American Indians in general (which is also approximately 1
to 2 percent of the population).
In the next column we provide the means for establishments located off of reservations;
we find that the characteristics are quite similar to those in column 1. For the observations
located on reservation in column 3, however, we do notice some differences from the previous two
columns. The age at death or censoring is almost half a year larger and there is a slightly lower
probability of business death during the recession years. The average age of the establishment at
the start of the panel is higher at 8 years and the average poverty rate in the local communities
is higher at 18%. The population has a lower percentage of adults with a BS degree or more at
only 20% and a larger proportion appear to be rural and remote as compared to the all other
counties.
3 Empirical Strategy
Our analysis uses the longitudinal nature of the data set and examines the death of business
establishments over the Great Recession located on American Indian reservations as compared
to business establishments located in (non-reservation) county areas. As a result, we employ a
proportional hazard model to identify the probability of survival of the business establishment
in each subsequent year.
We include all establishments that are present in the data across the years 2007-2012,
however are able to track survival up to year 2016. Our outcome variable measures whether
the establishment operates in a given year and it is considered as censored in 2016 for all
establishments that are still in existence.
∆lnh(t)
h(0)= β1 ×Xi + β2 ×ReservationLocation (1)
In the equation above h(t) indicates that an establishment does not survive into time
period t. We include a vector of covariates which is denoted by X. However, in our most basic
specification the vector X is empty and we report only the differential establishment survival
rates for being located on or off of the reservations. In additional specifications, we control
for the age of the establishment and age squared on the first year observed in the vector X.5
Finally, in a third specification we include the same age control variables as well as for poverty
4These are based on Rural-Urban Continuum Codes or RUCC codes that exist for every county inthe U.S.
5In additional analysis not reported here we only use the number of years present in the panel datawhich ranges from 1-5, instead of taking advantage of LBD reported years first and last observed, andfind very similar results.
5

Table 1: Table of Means for All Industries
All Off OnObs Reserve Reserve
Highest age 13.09 13.08 13.67(10.85) (10.85) (10.93)
Died in Panel 0.40 0.40 0.38(0.49) (0.49) (0.49)
Age 7.63 7.63 8.01(9.63) (9.63) (9.73)
Poverty Rate 13.92 13.91 18.16(5.04) (5.02) (7.95)
% BS or More 0.30 0.30 0.21(0.11) (0.11) (0.07)
Rural 0.15 0.15 0.63(0.36) (0.36) (0.48)
Remote 0.10 0.10 0.44(0.29) (0.29) (0.50)
On Reservation 0.00 0.00 1.00(0.05)
Standard deviations in parentheses. Data have been appropriately rounded as required by U.S. CensusBureau rules for confidentiality. All analyses provided have been approved by the U.S. Census Bureauto ensure no confidential information has been disclosed.
levels, adult educational attainment measures, and rural or remote status indicator variables.
The Cox Proportional Hazard Model is a standard one for examining business and firm
deaths over time. The model requires several assumptions, the most important being that
there is an independence of individual establishments in the analysis and survival times. We
attempt to control for potentially correlated economic shocks in a region by including population
characteristics for the geographic units studied in the regression. This allows us to separate
shocks across different regions that may result in above average firm closures.
4 Research Results
In Table 2 we provide the results from the Cox Proportional Hazard model as described above
in Equation 1. The outcome is establishment death in a particular year between 2007 and 2012.
In the table below, we pool all observations across all industries in the data; subsequent analysis
will separate out the observations by two-digit North American Industry Classification System
(NAICS) industries.
The first column provides the simplest model specification where we include a single
6
right hand-side covariate – a dummy variable for whether a firm is located on a reservation.
The estimated coefficients are provided in odds-ratio form; the smaller the size of the coefficient
(smaller than one), the lower the likelihood that the particular characteristic is associated with
business death. Conversely, odds-ratios that are larger than one indicate that the covariate
is associated with a higher likelihood of death. We find that the odds-ratio for a business
establishment that is located on a reservation is less than one and statistically significant in all
three specifications in the table; we provide Z-scores for the estimated coefficients in parentheses
in this table. This indicates that residing on a reservation is associated with a lower probability
of business death over the observation period than a similar business establishment anywhere
outside of a reservation. Each column in the table below adds additional covariates to the
model. In column two, we include the age of the business (measured in 2007) as an additional
control. The odds-ratio is smaller than one and it is statistically significant indicating that older
business establishments, on average, are less likely to die in any given year over the observed
time period. The next row provides the age squared variable which has an odds-ratio of one in
all cases. It is also statistically significant. We have rounded the odds-ratio to two significant
decimal places as required by the U.S. Census Bureau. Jointly the two age parameter estimates
imply a convex survival curve consistent with the literature. This means that age increases the
chances that a business establishment will survive into the next period but at a decreasing rate.
We find that rural establishments are also less likely to die over this time period as
compared to more urban establishments.6 On the other hand, establishments in much more
remote communities are slightly more likely to die over this time period. We also observe that the
probability of establishment death increases slightly for communities with higher proportion of
adults with a college degree or more. The relationship between the local community poverty rate
is equal to one and statistically significant. We have rounded the odds-ratio to two significant
decimal places as required by the U.S. Census Bureau; these results indicate that higher local
levels of poverty are associated with higher probability of business deaths.
Table 3 provides the same analysis as previously except that we have disaggregated the
data into two-digit NAICS categories. This table provides analysis for the Education, Construc-
tion, Manufacturing and Transportation industries. Location on a reservation is associated with
a lower probability of business establishment deaths for the education industry. While location
on reservation is also associated with lower probability of business deaths for manufacturing and
transportation, the odds-ratios in those regressions are not statistically different from one. For
the construction industry, the odds-ratios are greater than one and statistically significant in
column 6; this indicates that business establishments located on reservations in the construction
industry have a higher likelihood of going out of business than those located off of reservations.
We again see across all four industries that the older a firm in 2007, the lower its chances
are of going out of business. Once again, the odds-ratio coefficient for age squared is greater than
one but due to rounding requirements we are unable to show the actual ratio. Nevertheless, it is
statistically significant in these regressions. In general the relationship between rural community,
6Note that rural community identifier is based on the U.S. Department of Agriculture Rural EconomicResearch Service Rural-Urban Continuum Codes (RUCC) codes that exist for every county in the U.S.;larger values indicate a community is more remote. Any community with a score of 4 or higher isclassified as ”rural” while a score of 7 or higher is classified as ”remote”.
7
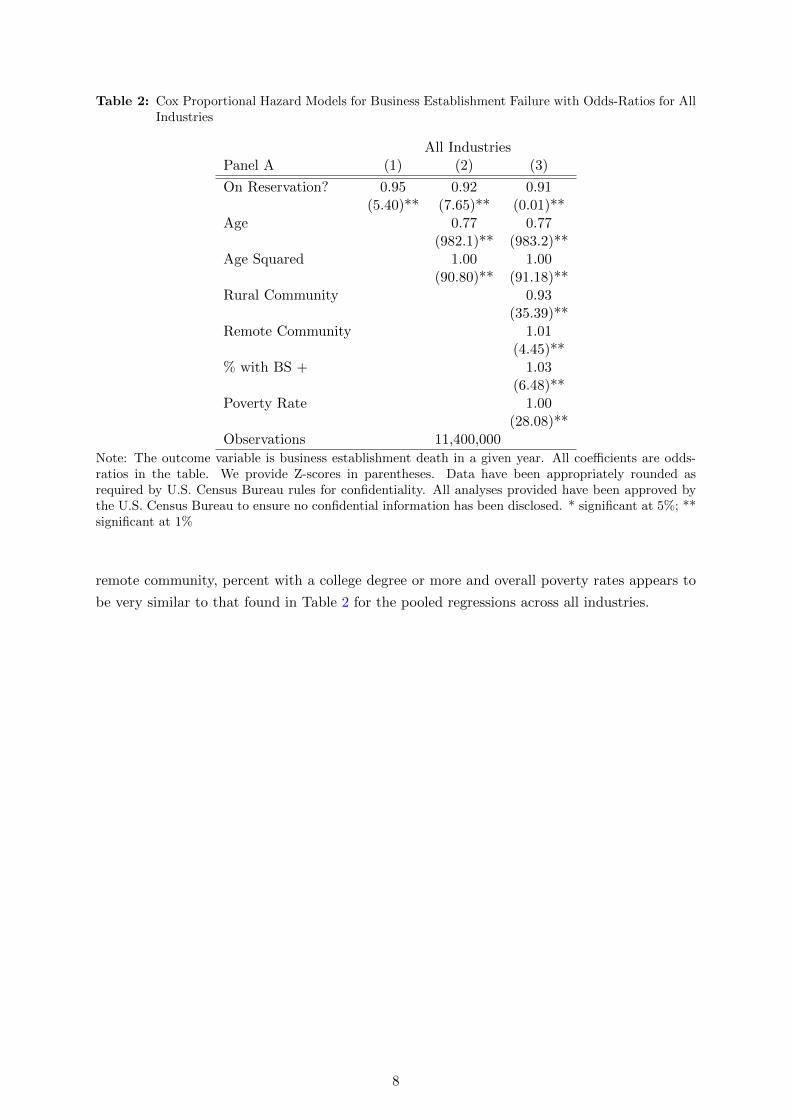
Table 2: Cox Proportional Hazard Models for Business Establishment Failure with Odds-Ratios for AllIndustries
All IndustriesPanel A (1) (2) (3)
On Reservation? 0.95 0.92 0.91(5.40)** (7.65)** (0.01)**
Age 0.77 0.77(982.1)** (983.2)**
Age Squared 1.00 1.00(90.80)** (91.18)**
Rural Community 0.93(35.39)**
Remote Community 1.01(4.45)**
% with BS + 1.03(6.48)**
Poverty Rate 1.00(28.08)**
Observations 11,400,000
Note: The outcome variable is business establishment death in a given year. All coefficients are odds-ratios in the table. We provide Z-scores in parentheses. Data have been appropriately rounded asrequired by U.S. Census Bureau rules for confidentiality. All analyses provided have been approved bythe U.S. Census Bureau to ensure no confidential information has been disclosed. * significant at 5%; **significant at 1%
remote community, percent with a college degree or more and overall poverty rates appears to
be very similar to that found in Table 2 for the pooled regressions across all industries.
8

Table 3: Cox Proportional Hazard Models for Business Establishment Failure with Odds-Ratios for Selected Industries
Education Construction Manufacturing TransportationPanel B (1) (2) (3) (4) (5) (6) (7) (8) (9) (10) (11) (12)
On Reservation? 0.82 0.80 0.50 1.02 1.01 1.10 0.94 0.92 1.05 0.95 0.95 1.02(0.08)* (0.08)* (0.05)** (0.03) (0.03) (0.03)** (0.05) (0.05) (0.06) (0.04) (0.04) (0.04)
Age 0.79 0.79 0.77 0.77 0.76 0.76 0.77 0.77(0.00)** (0.00)** (0.00)** (0.00)** (0.00)** (0.00)** (0.00)** (0.00)**
Age Squared 1.00 1.00 1.00 1.00 1.00 1.00 1.00 1.00(0.00)** (0.00)** (0.00)** (0.00)** (0.00)** (0.00)** (0.00)** (0.00)**
Rural Community 0.93 0.93 0.92 0.94(0.02)** (0.01)** (0.01)** (0.01)**
Remote Community 0.94 0.97 1.08 1.05(0.03)* (0.01)** (0.01)** (0.01)**
% with BS + 0.74 0.78 1.87 1.01(0.04)** (0.01)** (0.06)** (0.03)
Poverty Rate 1.00 1.01 1.01 1.01(0.00) (0.00)** (0.00)** (0.00)**
Observations 146,000 1,110,000 420,000 348,000
Note: The outcome variable is business establishment death in a given year. All coefficients are odds-ratios in the table. Standard errors in parentheses. Datahave been appropriately rounded as required by U.S. Census Bureau rules for confidentiality. All analyses provided have been approved by the U.S. CensusBureau to ensure no confidential information has been disclosed. * significant at 5%; ** significant at 1%.

Table 4 provides a continuation of the Cox Proportional Hazard model for the Health-
care, Arts and Entertainment, Accommodations and Food, and the Food and Retail industries.
Across all four industries and all specifications, the odds-ratio for location on a reservation is less
than one and statistically significant. This indicates that reservation location is associated with
a lower incidence of business death for these industries over these years. The other odds-ratios
for the other covariates are quite similar to our prior findings. We note that in the regressions
for the Arts and Entertainment industries that the odds-ratio for the age squared variable is not
statistically significant; indicating that the age-survival profile is not convex for this particular
industry which is in stark contrast to our results for all other industries.
10

Table 4: Cox Proportional Hazard Models for Business Establishment Failure with Odds-Ratios for Selected Industries
Healthcare Arts and Entertainment Accommodation and Food Wholesale and RetailPanel C (1) (2) (3) (4) (5) (6) (7) (8) (9) (10) (11) (12)
On Reservation? 0.91 0.96 0.95 0.80 0.80 0.76 0.91 0.95 0.91 0.89 0.87 0.86(0.04)* (0.04) (0.04) (0.06)** (0.06)** (0.06)** (0.03)** (0.03) (0.03)** (0.02)** (0.02)** (0.02)**
Age 0.76 0.76 0.78 0.78 0.76 0.76 0.77 0.77(0.00)** (0.00)** (0.00)** (0.00)** (0.00)** (0.00)** (0.00)** (0.00)**
Age Squared 1.00 1.00 1.00 1.00 1.00 1.00 1.00 1.00(0.00)** (0.00)** (0.00) (0.00) (0.00)** (0.00)** (0.00)** (0.00)**
Rural Community 0.98 0.93 0.97 0.92(0.01)* (0.02)** (0.01)** (0.00)**
Remote Community 1.01 1.01 1.10 1.05(0.01) (0.02) (0.01)** (0.01)**
% with BS + 0.83 0.69 0.76 1.35(0.02)** (0.03)** (0.01)** (0.02)**
Poverty Rate 1.01 1.00 1.00 1.00(0.00)** (0.00)* (0.00)** (0.00)**
Observations 1,100,000 184,000 980,000 2,160,000
Note: The outcome variable is business establishment death in a given year. All coefficients are odds-ratios in the table. Standard errors in parentheses. Datahave been appropriately rounded as required by U.S. Census Bureau rules for confidentiality. All analyses provided have been approved by the U.S. CensusBureau to ensure no confidential information has been disclosed. * significant at 5%; ** significant at 1%.

Table 5 provides the Cox Proportional Hazard ratio regressions for the following broad
industry categories: Information, Finance and Real Estate; and Professional, Management
and Administrative services; and Public Administration and Other Services; and Agriculture,
Mining and Utilities industries. The odds-ratio in the information and finance industry is less
than one and statistically significant which indicates that reservation establishments in this
industry are less likely to die than those located in adjacent counties over this time period. The
same holds for public administration and other industries as well. For professional and other
services as well as for agriculture, mining and utilities the odds-ratios are all close to one or
larger than one, however, none are statistically significant. Again, the other covariates appear
to be approximately the same size and statistical significance as found in previous tables.
12

Table 5: Cox Proportional Hazard Models for Business Establishment Failure with Odds-Ratios for Selected Industries
Info, Finance, Real Estate Prof, Manage, Admin Svs Public Admin and Other Agri/Mining/UtilitiesPanel D (1) (2) (3) (4) (5) (6) (7) (8) (9) (10) (11) (12)
On Reservation? 0.95 0.85 0.82 1.00 0.98 1.03 0.82 0.80 0.78 0.99 1.02 1.06(0.03) (0.03)** (0.03)** (0.03) (0.03) (0.03) (0.03)** (0.03)** (0.03)** (0.03) (0.03) (0.03)
Age 0.78 0.78 0.76 0.76 0.76 0.76 0.75 0.75(0.00)** (0.00)** (0.00)** (0.00)** (0.00)** (0.00)** (0.00)** (0.00)**
Age Squared 1.00 1.00 1.00 1.00 1.00 1.00 1.00 1.00(0.00)** (0.00)** (0.00)** (0.00)** (0.00)** (0.00)** (0.00)** (0.00)**
Rural Community 0.85 0.93 0.91 0.93(0.01)** (0.01)** (0.01)** (0.01)**
Remote Community 0.96 1.01 0.96 1.01(0.01)** (0.01) (0.01)** (0.01)
% with BS + 1.22 0.94 1.01 1.25(0.02)** (0.01)** (0.02) (0.05)**
Poverty Rate 1.00 1.00 1.01 1.01(0.00)** (0.00) (0.00)** (0.00)**
Observations 1,530,000 1,970,000 1,080,000 318,000
Note: The outcome variable is business establishment death in a given year. All coefficients are odds-ratios in the table. Standard errors in parentheses. Datahave been appropriately rounded as required by U.S. Census Bureau rules for confidentiality. All analyses provided have been approved by the U.S. CensusBureau to ensure no confidential information has been disclosed. * significant at 5%; ** significant at 1%.

Overall, while we find that firms in reservations are more likely to survive in any given
year between 2007 and 2016, on average, the pooled result masks some heterogeneity across
industries. In Figure 1 we provide the transformed values of the odds-ratios from the first
columns of Tables 3 to 5. We took the natural log of these odds-ratios (and multiplied them by
negative one) to provide the differential probability of business survival by industry for reser-
vation establishments. The black columns are statistically significant while the gray columns
are not. This provides a more succinct presentation of the differences in business survival by
industry and location on or off of a reservation.
The figure shows that lodging and food establishments located on reservations have about
a 4% higher probability of survival into the next year on average than an establishment located in
an adjacent county. For the arts and entertainment industry it is as large as almost 10%. Clearly
this is related to the casino and gaming industry. The educational and public administration
industries have almost as high a probability of survival over time as well. Establishments in all
other sectors appear to survive at about the same rate in reservations as they do elsewhere.
Figure 1: Differences in Business Survival Probability for Reservation-Based Establish-ments by Industry
0.0
2.0
4.0
6.0
8.1
Diff
eren
ces i
n Su
rviv
al R
ates
Lodgin
g, Foo
d
Agricu
lture,
Mini
ng
Arts an
d Ente
rtainm
ent
Constr
uctio
n
Educat
ion
Healthc
are
Inform
ation
, Fina
nce
Manufa
cturin
g
Profess
ional
Service
s
Public
Adm
in
Transpo
rtatio
n
Who
lesale
Reta
il
Industries
Note: This figure is based on the first column of Tables 3-5 for the odds-ratio on reservation location.We have transformed the odds-ratios using the log transformation and provide this as an additionalmethod to visualize the differences. The gray bars are not statistically significant, while the black barsare statistically significant. We have also transformed the data so that we are now showing survival; theprevious tables showed the probability of business death.
14

5 Discussion and Conclusion
Our work in this paper builds upon the Cornell and Kalt research agenda that identified dif-
ferences across American Indian reservations in employment and incomes. Our contribution
focuses on business establishment survival over the Great Recession and subsequent recovery
(2007-2016) by location on reservations.
In this work we have created the first comprehensive data set that provides a dynamic
analysis of business establishments located on and off of reservations. We follow business survival
for reservations and compare it to non reservation establishments in the lower 48 U.S. States.
Prior work has not been able to identify the location of business establishments by reservation
location due to a lack of geographic identifier information for the reservation geographic areas.
Our geocoding of the ILBD and LBD data allow for this analysis for the first time. This paper
uses the LBD to focus on employers.
Inherent in our analysis is the idea that reservation-based establishments differ from
non-reservation establishments due to the institutional climate in reservations. For instance,
trust land tenure often makes it difficult for individuals to access capital through standard
commercial mortgages as the land may not be used as collateral. In other areas, overlapping
legal jurisdictions within Public Law 280 states may create ambiguities and additional difficulties
for establishments located on reservations. Finally, many tribal governments may not have
extensive commercial or business codes to govern the activities and operations for establishments
located on the reservation.7 For all of these reasons, there is good reason to expect that the
business success and survival rates for reservation-based business establishments should differ
from their off-reservation counterparts. The generally more difficult climate and access to capital
might suggest that reservation firms would be less able to overcome negative shocks and might
be expected to show lower survival rates. Alternatively, for those establishments that are able
to get a strong foothold on a reservation, the lack of competitors and customer loyalty may, in
fact, predict for some long-term business stability and success. In reservations, it might also be
the case that a higher barrier to entry limits the number of business ideas that come to fruition
and are able to become employers. This positive self-selection might predict higher survival
rates conditional on being an employer at some point in time.
We, in fact, find some striking evidence for this hypothesis. Establishments located on
reservations over the period of the Great Recession and subsequent start of the recovery are
about 5% more likely to survive on average than their off-reservation counterparts. This striking
difference persists even when we control for other characteristics such as age of the establishment
and local community characteristics such as poverty and education levels. Additionally, we find
even stronger differences across certain industries such as the education, arts and entertainment,
wholesale and retail, and public administration industries.
While uncovering the reasons for these differences is not possible in this preliminary
analysis, we do have a couple of hypotheses that merit further investigation. For instance, given
that we know the business climate on reservations may already be quite difficult to navigate, then
7Very few tribal governments, for instance, have adopted the Uniform Commercial Code that all 50U.S. states have adopted to facilitate business transactions and other activities. These codes standardizebusiness practices and the scope of legal actions between different parties.
15

any establishments that survive into our data are probably positively-selected to begin with.
This may contrast with establishments located off of the reservation which may have lower
start-up and entry costs than reservation-based establishments. As a result, these businesses
located on reservation may be positively selected and more resilient than their non-reservation
based counterparts; they may be better able to weather economic shocks – such as the Great
Recession. This could have negative consequences for development as fewer ideas get a shot
at becoming firms in reservations; this could come at the cost of significant limitations in the
potential for innovation. While we have not devised a test of this in this preliminary work, the
fact that the reservation survival differential does not change after inclusion of firm age suggest
that the higher survival rates are not concentrated among newborn firms. More deliberate
analysis can test this hypothesis directly and also examine churn more explicitly (accounting
for births and replacement not just survival of existing stock). More explicit analysis can also
focus on specific institutional features and their ability to explain the reservation survival gap,
as well as implication for growth and development.
Alternatively, the establishments that have the highest differential probability of survival
are also in industries related to casino operations and tourism. The relatively high rate of firm
survival over the Great Recession may be attributable to the presence of the casino industry
that was still a draw for many customers to the adjacent business establishments located on
reservations. While casino revenues did decline over the Great Recession it may have still
been less sensitive than entertainment and tourism expenditures in the rest of the nation, and
revenues may have still been large enough to sustain the surrounding businesses. Future work
should be focused on identifying whether this is an important causal pathway to explaining the
observed results.
Overall, geocoding the SSEL for location in reservations opens the door for substan-
tial improvements in our understanding of reservation economies. This is interesting because
reservations are underdeveloped in general, but it is also interesting because they display a
large variation in institutions that can be used for obtaining a greater understanding of rela-
tionships between institutions and development in general. Here we only present evidence of a
survival gap between reservation and non-reservation employers, but the potential explanations
for this, its relationship to the various institutional differences in reservations and implications
for mechanisms of development are interesting future research areas that are now feasible.
16
References
Akee, R. (2009). Checkerboards and coase: The effect of property institutions on efficiency in
housing markets. The Journal of Law and Economics 52 (2), 395–410.
Akee, R. and M. Jorgensen (2014). Property institutions and business investment on american
indian reservations. Regional Science and Urban Economics 46, 116–125.
Akee, R., E. Mykerezi, and R. M. Todd (2017). Reservation employer establishments: Data
from the us census longitudinal business database. Federal Reserve Bank of Minneapolis,
Center for Indian Country Development Working Paper (2017-02).
Carlson, L. A. (1981). Land allotment and the decline of american indian farming. Explorations
in Economic History 18 (2), 128.
Cornell, S. and J. P. Kalt (1995). Where does economic development really come from? con-
stitutional rule among the contemporary sioux and apache. Economic Inquiry 33 (3),
402–426.
Cornell, S. and J. P. Kalt (2000). Wheres the glue? institutional and cultural foundations of
american indian economic development. The Journal of Socio-Economics 29 (5), 443–
470.
Cornell, S. E. and J. P. Kalt (1992). What can tribes do?: Strategies and institutions in American
Indian economic development. American Indian Studies Center, University of California,
Los Angeles Los Angeles, CA.
Fairlie, R. W. and B. D. Meyer (1996). Ethnic and racial self-employment differences and
possible explanations. Journal of human resources, 757–793.
Fairlie, R. W. and A. M. Robb (2010). Race and entrepreneurial success: Black-, Asian-, and
White-owned businesses in the United States. MIT Press.
17

A Appendix Tables
18

Table A1: Table of Means for All Observations Inclusive of On and Off Reservation Business Establishments
All Const Manu Transport Edu Health Arts Hotel Whole Extract Info Prof PubPanel A: Total Rec HFood Retail Finan Svcs Admin
Highest age 13.09 12.12 17.66 10.89 15.07 14.22 13.08 10.88 13.98 14.61 11.77 11.38 16.45(10.85) (10.12) (12.65) (9.63) (13.01) (10.88) (11.41) (9.41) (11.06) (10.04) (10.26) (9.43) (12.90)
Died in Panel 0.40 0.48 0.36 0.46 0.33 0.31 0.40 0.42 0.38 0.35 0.44 0.42 0.34(0.49) (0.50) (0.48) (0.50) (0.47) (0.46) (0.49) (0.49) (0.49) (0.48) (0.50) (0.49) (0.47)
Age 7.63 7.00 11.80 5.86 9.30 8.29 7.65 5.68 8.39 8.74 6.56 6.08 10.60(9.63) (8.89) (11.51) (8.39) (11.66) (9.88) (10.09) (8.17) (9.96) (8.91) (9.02) (8.23) (11.57)
Poverty Rate 13.92 13.23 13.94 14.38 13.64 14.15 13.78 14.13 14.19 15.27 13.93 13.36 14.13(5.04) (4.86) (4.79) (5.28) (5.09) (5.12) (4.72) (5.05) (5.12) (5.85) (4.90) (4.83) (5.10)
% BS or More 0.30 0.29 0.28 0.27 0.32 0.30 0.31 0.30 0.29 0.21 0.31 0.32 0.29(0.11) (0.10) (0.10) (0.10) (0.11) (0.10) (0.11) (0.11) (0.10) (0.09) (0.11) (0.11) (0.11)
Rural 0.15 0.16 0.17 0.21 0.12 0.14 0.15 0.16 0.15 0.51 0.12 0.09 0.18(0.36) (0.37) (0.38) (0.40) (0.33) (0.34) (0.36) (0.36) (0.36) (0.50) (0.33) (0.29) (0.38)
Remote 0.10 0.10 0.10 0.14 0.07 0.08 0.09 0.09 0.09 0.40 0.07 0.05 0.11(0.29) (0.30) (0.31) (0.34) (0.26) (0.27) (0.29) (0.29) (0.29) (0.49) (0.26) (0.22) (0.31)
On Reservation 0.00 0.00 0.00 0.00 0.00 0.00 0.00 0.00 0.00 0.01 0.00 0.00 0.00(0.05) (0.05) (0.04) (0.06) (0.06) (0.04) (0.05) (0.05) (0.04) (0.09) (0.04) (0.04) (0.05)
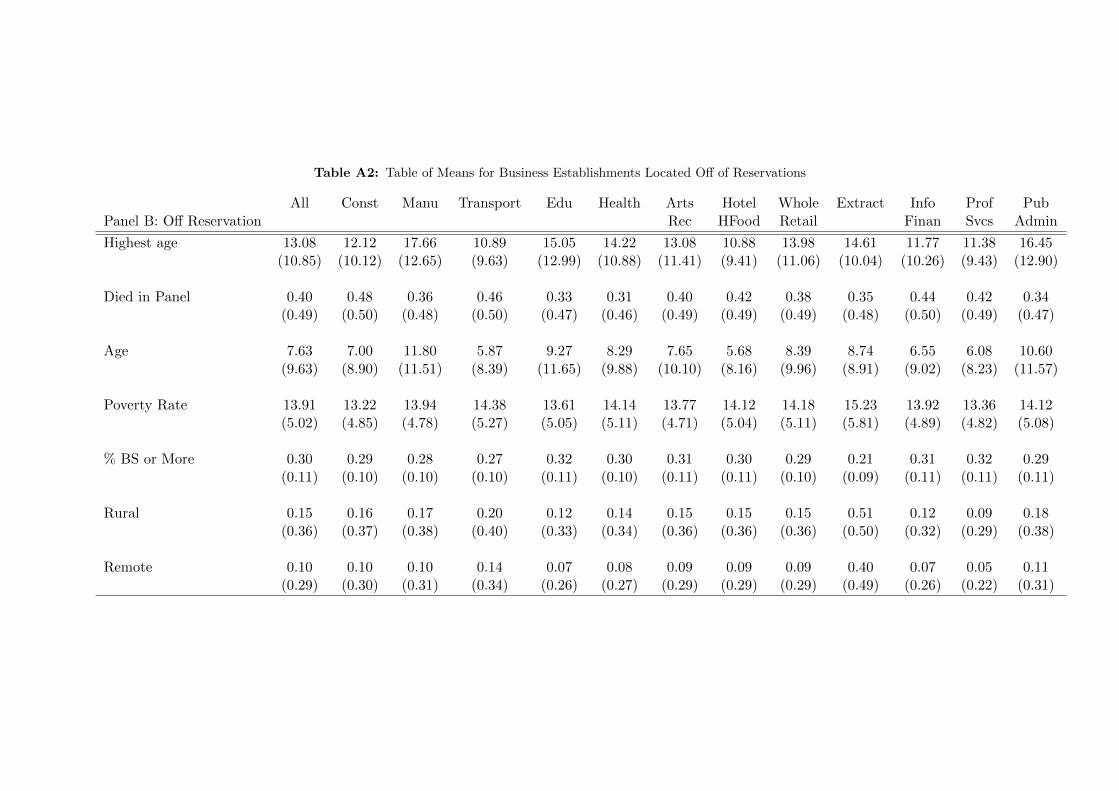
Table A2: Table of Means for Business Establishments Located Off of Reservations
All Const Manu Transport Edu Health Arts Hotel Whole Extract Info Prof PubPanel B: Off Reservation Rec HFood Retail Finan Svcs Admin
Highest age 13.08 12.12 17.66 10.89 15.05 14.22 13.08 10.88 13.98 14.61 11.77 11.38 16.45(10.85) (10.12) (12.65) (9.63) (12.99) (10.88) (11.41) (9.41) (11.06) (10.04) (10.26) (9.43) (12.90)
Died in Panel 0.40 0.48 0.36 0.46 0.33 0.31 0.40 0.42 0.38 0.35 0.44 0.42 0.34(0.49) (0.50) (0.48) (0.50) (0.47) (0.46) (0.49) (0.49) (0.49) (0.48) (0.50) (0.49) (0.47)
Age 7.63 7.00 11.80 5.87 9.27 8.29 7.65 5.68 8.39 8.74 6.55 6.08 10.60(9.63) (8.90) (11.51) (8.39) (11.65) (9.88) (10.10) (8.16) (9.96) (8.91) (9.02) (8.23) (11.57)
Poverty Rate 13.91 13.22 13.94 14.38 13.61 14.14 13.77 14.12 14.18 15.23 13.92 13.36 14.12(5.02) (4.85) (4.78) (5.27) (5.05) (5.11) (4.71) (5.04) (5.11) (5.81) (4.89) (4.82) (5.08)
% BS or More 0.30 0.29 0.28 0.27 0.32 0.30 0.31 0.30 0.29 0.21 0.31 0.32 0.29(0.11) (0.10) (0.10) (0.10) (0.11) (0.10) (0.11) (0.11) (0.10) (0.09) (0.11) (0.11) (0.11)
Rural 0.15 0.16 0.17 0.20 0.12 0.14 0.15 0.15 0.15 0.51 0.12 0.09 0.18(0.36) (0.37) (0.38) (0.40) (0.33) (0.34) (0.36) (0.36) (0.36) (0.50) (0.32) (0.29) (0.38)
Remote 0.10 0.10 0.10 0.14 0.07 0.08 0.09 0.09 0.09 0.40 0.07 0.05 0.11(0.29) (0.30) (0.31) (0.34) (0.26) (0.27) (0.29) (0.29) (0.29) (0.49) (0.26) (0.22) (0.31)

Table A3: Table of Means for Business Establishments Located On of Reservations
All Const Manu Transport Edu Health Arts Hotel Whole Extract Info Prof PubPanel C: On Reservation Rec HFood Retail Finan Svcs Admin
Highest age 13.67 11.06 16.47 10.24 22.66 14.54 14.44 11.66 14.86 14.18 12.96 11.02 17.48(10.93) (9.42) (12.15) (9.35) (14.63) (10.94) (10.56) (9.53) (11.16) (9.76) (10.78) (9.11) (12.87)
Died in Panel 0.38 0.50 0.36 0.45 0.21 0.30 0.33 0.40 0.35 0.36 0.39 0.43 0.28(0.49) (0.50) (0.48) (0.50) (0.41) (0.46) (0.47) (0.49) (0.48) (0.48) (0.49) (0.49) (0.45)
Age 8.01 6.02 10.53 5.19 16.08 8.50 8.57 6.31 8.97 8.35 7.36 5.64 11.24(9.73) (8.17) (11.11) (8.04) (13.33) (9.95) (9.47) (8.42) (10.15) (8.64) (9.54) (7.91) (11.60)
Poverty Rate 18.16 16.61 16.65 16.08 21.27 19.63 17.68 18.29 18.30 19.17 17.95 17.18 18.77(7.95) (7.19) (7.15) (7.36) (9.87) (8.38) (6.90) (7.46) (8.00) (8.07) (7.65) (7.50) (8.26)
% BS or More 0.21 0.23 0.22 0.21 0.20 0.21 0.22 0.21 0.22 0.19 0.22 0.23 0.21(0.07) (0.07) (0.06) (0.06) (0.07) (0.06) (0.07) (0.06) (0.07) (0.05) (0.07) (0.07) (0.07)
Rural 0.63 0.64 0.56 0.64 0.70 0.66 0.61 0.66 0.60 0.76 0.59 0.53 0.64(0.48) (0.48) (0.50) (0.48) (0.46) (0.48) (0.49) (0.47) (0.49) (0.43) (0.49) (0.50) (0.48)
Remote 0.44 0.45 0.37 0.53 0.47 0.41 0.42 0.46 0.39 0.63 0.37 0.32 0.43(0.50) (0.50) (0.48) (0.50) (0.50) (0.49) (0.49) (0.50) (0.49) (0.48) (0.48) (0.47) (0.49)