Embed Size (px)
Citation preview

Business Cycles :Theories, Evidenceand Analysis
Proceedings of a conference held by the Internationa lEconomic Association, Copenhagen, Denmark
Edited byNiels Thygese nKumaraswamy VelupillaiandStefano Zambelli
M in association with theINTERNATIONAL ECONOMIC
MACMILLAN ASSOCIATION
12 A War-EconomyTheory of the LongWaveJoshua S . GoldsteinSCHOOL OF INTERNATIONAL RELATIONSUNIVERSITY OF SOUTHERN CALIFORNI A
INTRODUCTIO N
Long waves of roughly fifty years in economic and social life haveintrigued many scholars because they offer an alternative perspectiv efrom which to view history and the present situation – an alternativeto either static or linear projections of the future . Past empirica lstudies of long waves have agreed on the dating of long wave shistorically but not on the scope of those waves in terms of variablesencompassed, relevant time-periods, or causal mechanisms (see re-view in Goldstein, 1988 : ch . 3) . I have sought to advance the empiri-cal evidence relevant to long waves by sorting and testing conflictin ghypotheses in the long-wave debate against about fifty historica ltime-series (Goldstein, 1988) . Based on the most salient laggedcorrelations among variables found in my empirical analysis, I ad-duced a set of causal dynamics among variables that could accoun tfor the sequence of phenomena making up the long wave – as bestthat sequence could be inferred from spotty empirical data . Theadduced theory is a tentative one, with many remaining loose endsand anomalies . But it is better-grounded empirically than past long -wave theories .
My theory of long waves centres on the relationship between warand economic growth in the world system . Periods of severe warfollow phases of robust economic growth and lead to phases o fstagnant growth . The empirical evidence that war plays a central rol ein long waves is quite strong . Long waves in prices can he explaine dlargely by the inflationary effects of recurrent wars . Economic inno-vations, capital investment, and real wages also play reinforcing role sin generating long waves, in my view – and all are also affected b y
303

304
Political Economy of Long Waves
major wars . The theory thus builds on, rather than contradicts, othe rlong-wave theories stressing innovation, over-investment, and clas sstruggle .
In this paper, I investigate the adduced causal dynamics among warand economic variables directly, setting aside the idea of long wave s(as the expression of those underlying dynamics in the historicalbehaviour of the system) . That is, I begin from the micro level ofshorter-term relations among the variables in a system, rather tha nthe macro level of how that system behaves over the long term . First Iwill summarise these causal dynamics, posited in my long wav etheory . Then I will present evidence from a new analysis of several o fthe longest and highest-quality historical time-series in the period1750-1935, using VAR modelling .
Finally, I will discuss the question of whether the underlying causa ldynamics continue to operate in the present-day world system, de -spite the unusual nature of the most recent long wave . In terms of afour-phase dating scheme of long waves, I argue that the 1940-6 8`expansion' phase was distorted by the extension of the core of th eworld system to America, which poured huge new economic re -sources into the European war system at the time of the Secon dWorld War. Despite this disruption, there is some evidence tha tlong-wave dynamics continue in the present .
1 GOLDSTEIN'S LONG-WAVE THEORY
My theory posits causal dynamics among war, production, prices ,real wages, technical innovation, and capital investment . These vari-ables are all conceived at a global level of analysis — i .e . in the core ofthe world system, roughly equivalent to the `Great Power system' inpolitics or the `leading industrial countries' in economics .
1 .1 War and Prices
Long waves in prices, more than in any other economic or politica lphenomenon, have attracted attention to the phenomenon of lon gcycles . Price waves are clearly visible in many untransformed histori-cal price-series (including that of Kondratieff in the 1920s), whereaslong waves in production, innovation, and other aspects of economi cor social life have been sharply debated and require more contro-versial methodologies . As for the price waves, some critics of long

Goldstein : A War-Economy Theory
305
waves argue that the price peaks about every fifty years are merel ythe by-product of severe wars, and hence are not `endogenous 'economic cycles .
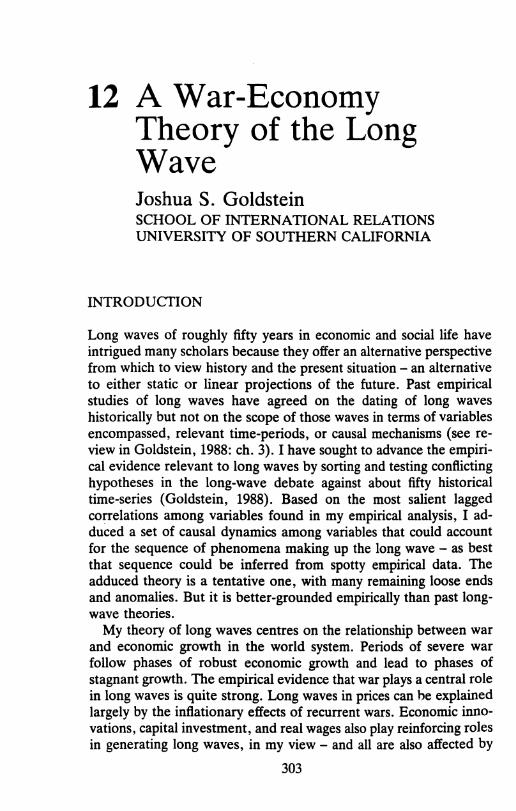
The bulk of evidence supports the idea that wars cause the lon gwaves in prices . Figure 12 .1 is a graph of Levy's (1985) data on GreatPower war fatalities, which I transformed into a 500-year time-series .The long-wave dating for prices – my `base dating scheme' – is acomposite of the dates given by Braudel (1972), Frank (1978) ,Kondratieff (1935), and Mandel (1980), with a minor modificatio n(Goldstein, 1988) . The price peaks in this scheme are shown at th etop of Figure 12 .1 as vertical arrows. On the graph of Great Powerwar battle fatalities, I have marked the recurrent, particularly sever eand prolonged wars as `war peaks' (WP) . The dates and peak warsare listed in Table 12 .1 . Clearly each spurt of inflation ending along-wave price upswing corresponds with a high severity of war i nthe Great Power system . The only exception is the Second Worl dWar which I will discuss later .
Wallerstein's three periods of `world war' are shown at the botto mof Figure 12 .1 : the Thirty Years' War, Napoleonic Wars, and th eFirst and Second World Wars . I call these `hegemonic wars' becausethey are struggles for the dominant position in the world system. Outof each war has emerged a new hegemon – the leading country on thewinning side that survives with its economy intact and reorganises th eworld system around itself, while its adversaries and allies ar edrained by war. The three hegemons were the Netherlands, Britain ,and the USA .
It is tempting to assign the struggle for hegemony – including thegreat hegemonic wars (`world wars', `global wars', `systemic wars' ,etc .) – a place in the long wave . Several past schemes have tied pairsof long waves to hundred-year cycles of war . However, in my viewthe relationship is more irregular . There is no fixed number of lon gwaves that makes up a cycle of hegemony. Rather, there is a longer-term cycle, the rise and fall of hegemony, which does not appea rstrongly linked to long waves in a causal sense. The two cycles, ofcourse, overlap in that hegemonic wars are also war peaks in the longwave (again, except the Second World War) . But other long-wavewar peaks occur at times of intermediate hegemony, adjusting bu tnot rewriting the political arrangements in the world system .
What accounts for the regularity of war recurrence? I find explana-tions based on endogenous `war cycle' mechanisms, such as th e`social memory of war' or the `alternation of generations', incom-
1 000 000 )—
WP = War Pea k
100 000
10 000
1000
Arrows at top indicate economic long wave peaks (base dating scheme )
WP
WP
WP
(30 Years War )
WP WP
n
(Napoleonic)
(WWI )
WP
WP
(WWII )
W P
n
1700
0
Year 1500
mm rnliiilnrl
1600
m mmm ®
1800
cmmoinims) •It, nn II 41,1 . 1.11111 1
1900
111,11
uinl
2000
_ I I
Wallerstein's three 'world war' periods (see text )
Source : Goldstein (1988) p . 290
Figure 12 .1 Great Power war severity, 1495—1975

Goldstein: A War-Economy Theory
307
Table 12 .1 Dating of long war cycles, 1495—1975
Cycle Starting date Peak war years Length Ending date ofof war cycle (years) corresponding
long wavephase perio d
1 (1495) 1521—1529 (35) 152 82 1530 1552—1556 28 155 83 1558 1593—1604 47 159 44 1605 1635—1648 44 164 95 1649 1701—1713 65 171 96 1714 1755—1763 50 176 17 1764 1803—1815 52 181 38 1816 1870—1871 56 187 19 1872 1914—1918 47 191 7
10 1919 1939—1945? (27) (1968/80? )
Cycle Peak wars Annual fatalityrate at pea k(thousands)
1 First and Second Wars of Charles V(Ottoman War v . Hapsburgs) a
1 3
2 Fifth War of Charles V(Ottoman War v . Hapsburgs) a
22
3 War of the Armada(Austro-Turkish War) a
1 1
4 Thirty Years' War : Swedish/French Phase 885 War of the Spanish Succession 1076 Seven Years' War 1247 Napoleonic Wars 15 68 Franco—Prussian War 909 First World War 193 4
10 Second World War 2158
a Dating of war peaks in cycles 1—3 based primarily on intra-European war srather than those against Turkey. Wars against Turkey are included in thestatistics, however, and are shown above in parentheses .
Source : Goldstein (1988) p . 241 .
plete. These contributing factors notwithstanding, I have propose dthat the war cycle cannot be explained independently of economics .While prices merely respond to war, trends in economic productio nboth affect and respond to the severity of Great Power wars . Pros-perity gives the Great Powers the wherewithal to fight bigger wars .

308
Political Economy of Long Waves
Big wars, however, drain the world economy, which must be slowlyrebuilt over decades . Periodic big wars also serve as regulatin g`shocks' to cycles of capital investment and- technical innovation, an dthey drive down real wages .
1 .2 War and Production
The growth of world production appears to vary in a manner consist-ent with this war-growth theory of the long wave, although th echanges in growth rates are generally not dramatic . Upswings offaster and more robust growth in production precede upswings in warand prices, which in turn precede production downswings marked b yslower and less stable growth . The production waves appear to leadwar/price waves by about a quarter of a cycle (ten to fifteen years) o naverage . These production waves are less sharply defined than th eprice waves, resembling `swells' rather than the more extreme peak sand troughs in prices . Wo j tyla (1988) illustrates one possible datin gscheme (see Table 12 .2) which leads my price dating by ten to fiftee nyears on average, and which seems to show alternating phases ofeconomic growth in leading industrial countries (based on Maddi-son's data) .
Production upswings, then, provide the economic surplus in th eworld system to fill the `war chests' of the Great Powers . Severe warsdrain those war chests and end the robust growth of the worl deconomy (through the obvious disruption and destruction wrought b ywar, which is not fully compensated by the full mobilisation o feconomic resources for the fight) . Toward the end of the war up -swing, as production has already begun stagnating, sharp world-wid einflation often results from the severity of war (which increase sdemand and reduces supply) ; this phase of `stagflation' has historica lprecedents before the 1970s (around 1920, 1872, 1815) . Finally, aswars give way to peace (often in a flurry of bankruptcies), the worl deconomy recovers and eventually a new period of robust economicgrowth gets under way .
The central dynamic of the long wave, then, is the long-term`lagged negative feedback loop' of world economic growth and Grea tPower wars . I posit that this central dynamic is reinforced by thre eother such feedback loops involving variables that affect productio nand are affected by war — real wages, innovation, and capital invest -ment .

Goldstein : A War- Economy Theory
309
Table 12.2 Growth rates by production phase periods
Kondratieffphase*
Average growthrate for conten -
ding Great Powers Germany France UK
Downswing 1 .5% 1 .3% 0.8% 2.4% +1790—1830Upswing 2 .0 1 .9 1 .8 2 .2+1830—186 0Downswing 1 .8 2.3+ 1 .1 2 . 01860—189 0Upswing 2 .1 3 .1+ 1 .5 1 . 61890—191 0
Downswing 1 .7 1 .5 1 .2 1 .4USA2 .8+
1910—1950Western Europe USSR
Upswing 4.6 5 .0 3 .5 5 .2+1950—197 0Downswing 2 .3 2 .4 2 .5+ 2 . 01970—Date
* This dating for production phases leads price phases by 10 to 15 years .+ Leade rSource : Based on data in Angus Maddison Phases of Capitalist Development
(Oxford University Press, 1982) ; Angus Maddison `A Compariso nof Levels of GDP Per Capita in Developed and DevelopingCountries, 1700—1980 : Journal of Economic History, vol . XLIII ,no 1, March 1983 .
Source : Wojtyla (1988 :5 )
1 .3 War, Production, Prices and Real Wages
Although my empirical analysis for real wages extends only to tw oBritish series, it shows evidence of an inverse correlation of rea lwages with the price phases of the long wave . When prices rise, rea lwages fall . This timing makes particular sense in relation to thetiming of Great Power wars — during the biggest wars, with hig htaxation and inflation, real wages fall way behind prices ; duringpeacetime, economic resources are channelled back to the civilianeconomy and workers end up better off in real terms . In short ,workers suffer in wartime .
The long waves in real wages should, in principle, bear som e

310
Political Economy of Long Waves
Source : Goldstein (1988) p . 260 .
Figure 12 .2 Adduced causality, production/war/prices/wage s
relation to long waves of `class struggle' described by some researchers(e .g . Mandel, 1980) . However, I have not been able to identify tha trelationship to date .
Figure 12.2 maps out the adduced causal dynamics at the core ofthe long wave . Most important is the cycle in which productio ngrowth stimulates war severity, but war severity dampens productio ngrowth in the world system . War severity also affects prices (posi-tively) and real wages (negatively, both directly and by way ofprices) . Real wages appear, from the lagged timing, to have apositive effect on production – a plausible connection since better -paid workers would be more productive . Finally, I adduce a direct ,positive effect of production on prices (as well as the indirect effec tthrough war) . This connection rests on the idea that as a productio nupswing proceeds, demand increases while supply at some pointbegins to experience limits .
1 .4 Innovation and Capital Investment
Two other economic phenomena come into play in this account oflong-wave dynamics . First, an innovation cycle reinforces the lon gwave in that a higher rate of innovation stimulates (with some lag )stronger economic growth, but strong economic growth in tur ndampens the innovation rate . This is the majority view among long-wave scholars (e .g . Mensch, C . Freeman, Van Duijn) focusing on
Goldstein: A War-Economy Theory
31 1
Socia lmemor yof war
Wa rseverity
Price s
Productiongrowth
InnovationCapital
investmen t
L ._J
Source : Goldstein (1988) p . 275
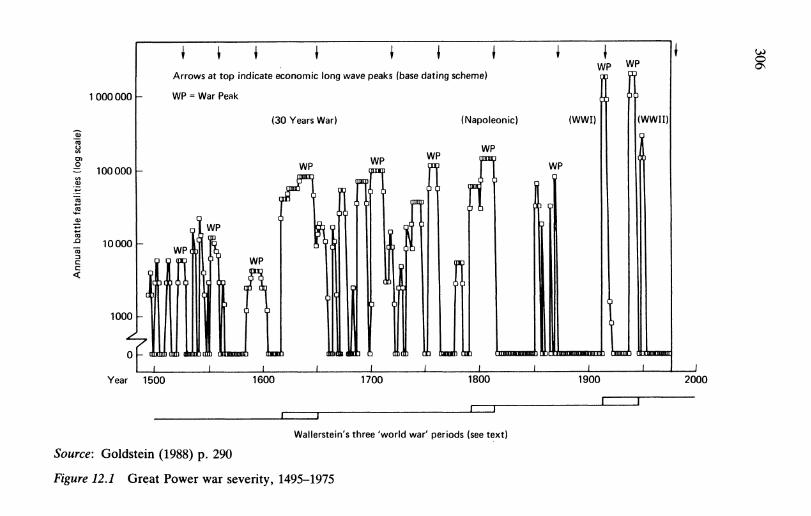
Figure 12 .3 Theoretical model of long-wave dynamics
innovation . My empirical evidence on the timing of innovations ,although sketchy, is consistent with this interpretation . The timingsuggests that innovations are highest in the rebuilding phase afte rpost-war stagnation . I tried to test whether inventions lead innova-tions, as some researchers believe ; but the data on patents gav eanomalous results (British long waves of invention being half a cycl eout of phase with American ones) .
Second, a capital-investment cycle also reinforces the long wave .Production upswings lead to upswings of capital investment, ulti-mately leading to overinvestment and retrenchment, dampenin gproduction growth . The Massachusetts Institute of Technolog y(MIT) group suggests that this cycle of over- and under-investment

312
Political Economy of Long Waves
(their `self-ordering of capital') may extend the wavelength of th elong wave (Sterman, 1983) .
Figure 12 .3 illustrates my causal model of long waves with theinclusion of innovation and capital investment . Also shown in th efigure are two possible influences on war that may also help regulat ethe timing of the long wave . The first, social memory of war, has bee nmentioned above. The second is the possible effect of `nationa lcapabilities distribution' (in the Great Power system) in perpetuatin gthe war-cycle component of the long wave . Immediately after asevere war, the capabilities of winners usually far overshadow thos eof losers . Under these conditions a severe war is unlikely (Organski' spower transition theory) ; rather, war is likely to occur after thelow-capability countries have recovered and embarked on long-termgrowth that brings their capabilities within striking distance of adver-saries . Thus war severity disequalises national capabilities distribu-tion, which in turn dampens war severity (which allows capabilities t oequalise, thus increasing war severity) . National capabilities areaffected by relative national rates of innovation and productiongrowth, in addition to the effects of war . The national capabilitie sdistribution also connects with the hegemony cycle, but (as men-tioned above) I consider this only a weak causal connection . Themost important point of Figure 12 .3 is that an adequate model of th elong wave must bridge economics and politics .
2 A NEW STATISTICAL ANALYSI S
In order to explore further the causal connections among the ke yvariables of the long wave, I have conducted a new analysis usin gVAR modelling. The VAR model is essentially a multivariate ,multi-equation reduced-form statistical model in which each variabl eis regressed on its own past behaviour and the past behaviour o fevery other variable in the system . This method was developed b yeconomist Christopher Sims (1980), and its applications to politica lscience are discussed by Freeman, Lin, and Williams (forthcoming) .
The data I used in this exploratory exercise consisted of several ofthe best time-series (highest quality and longest duration) from m yearlier analysis (described and listed in Goldstein, 1988, Appendice sA, B) . For each of six variables of interest, I chose one time-series . Inone case (world industrial production) I spliced together two series

Goldstein: A War-Economy Theory
313
(1740—1850 and 1850—1975) by multiplying the second series by theratio of the two in 1850 . The six series were :
War Logged war severity (from Levy) 1495—1975Production World industrial production (spliced) 1740—1975Prices British wholesale price index 1750-1975Innovation Haustein's list of innovations 1764—1975Real wages S . English real wage index 1736—1954Investment US private building volume 1830—1957
The use of US private building volume as a measure of worl dinvestment was particularly questionable, and the time-frame cov-ered by that series is considerably less than the other series . There-fore, I dropped capital investment from this analysis, pending bette rdata . This left five variables, spanning the years 1764—1954 .
In specifying the time-frame and number of included lags in th emodel, I used a Bayesian approach of imposing prior theoretica lexpectations . One must decide how many lags of the independen tvariables should be included on the right-hand side of each equation .There are statistical tests to induce this from the data, but since m ytheory calls fer up to 10—15 lags I began by simply using 15 lags . Thatis, the lagged effects of one variable's past behaviour in influencin ganother variable's current behaviour may extend up to fifteen year s(just over one quarter of a cycle) . My theory has no lagged effectslonger than this .
Since in my theory, the Second World War is considered unusua land because the war years have many extremes in the time series tha twould have a heavy influence on the statistical results, I decided no tto include the years after 1935 in the analysis . The years 1936—5 4would add few degrees of freedom and might well introduce aninstability that would mask earlier patterns . The Second World Warin any case cannot be fully included with 15 lags in the model an ddata up through only 1954 . This left a time-frame for the five-variableVAR model of 1764—1935 . While VAR analysis allows the testing oftime-stability within the time-frame covered (to see whether thecoefficients change significantly at a certain candidate break-point) ,preliminary tests merely show that the great wars (Napoleonic, andthe First and Second World Wars) are unstable relative to th epeaceful years . Of course I could not use only peaceful times in thisanalysis, so I relied on my prior analysis which suggested omittin g
314
Political Economy of Long Waves
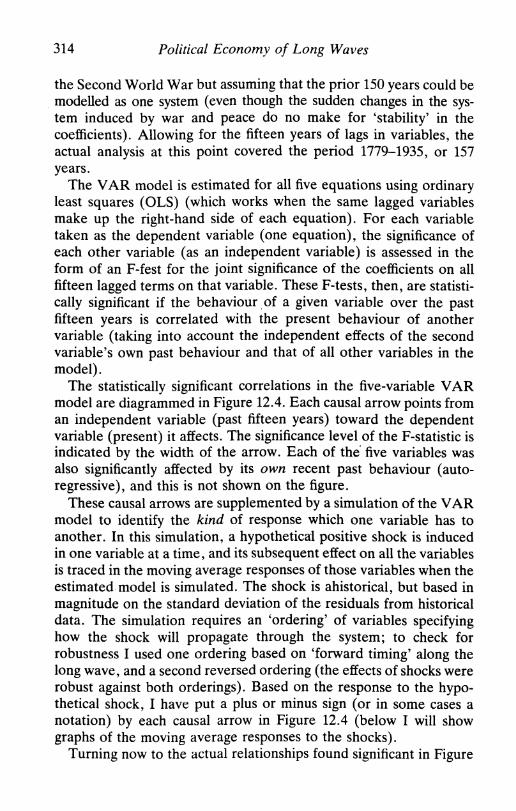
the Second World War but assuming that the prior 150 years could b emodelled as one system (even though the sudden changes in the sys-tem induced by war and peace do no make for `stability' in thecoefficients) . Allowing for the fifteen years of lags in variables, th eactual analysis at this point covered the period 1779-1935, or 15 7years .
The VAR model is estimated for all five equations using ordinar yleast squares (OLS) (which works when the same lagged variable smake up the right-hand side of each equation) . For each variabl etaken as the dependent variable (one equation), the significance ofeach other variable (as an independent variable) is assessed in th eform of an F-fest for the joint significance of the coefficients on al lfifteen lagged terms on that variable . These F-tests, then, are statisti-cally significant if the behaviour of a given variable over the pastfifteen years is correlated with the present behaviour of anothe rvariable (taking into account the independent effects of the secondvariable's own past behaviour and that of all other variables in th emodel) .
The statistically significant correlations in the five-variable VA Rmodel are diagrammed in Figure 12 .4. Each causal arrow points froman independent variable (past fifteen years) toward the dependen tvariable (present) it affects . The significance level of the F-statistic i sindicated by the width of the arrow . Each of thé five variables wasalso significantly affected by its own recent past behaviour (auto -regressive), and this is not shown on the figure .
These causal arrows are supplemented by a simulation of the VA Rmodel to identify the kind of response which one variable has toanother. In this simulation, a hypothetical positive shock is inducedin one variable at a time, and its subsequent effect on all the variable sis traced in the moving average responses of those variables when th eestimated model is simulated . The shock is ahistorical, but based inmagnitude on the standard deviation of the residuals from historicaldata. The simulation requires an `ordering' of variables specifyin ghow the shock will propagate through the system ; to check forrobustness I used one ordering based on `forward timing' along thelong wave, and a second reversed ordering (the effects of shocks wer erobust against both orderings) . Based on the response to the hypo-thetical shock, I have put a plus or minus sign (or in some cases anotation) by each causal arrow in Figure 12 .4 (below I will sho wgraphs of the moving average responses to the shocks) .
Turning now to the actual relationships found significant in Figure

Goldstein : A War-Economy Theory
31 5
War severity (log )
ten years —then +
+
Price s
Production
Real wages
Innovation rate
Note : Arrows indicate direction of causality (forward through time) sug-gested by lagged correlations . Statistical significance shown by size ofarrow is given by the F-test on the joint (1–15) lagged coefficients fo reach variable in each equation .
Statistical significance :
Less than 0 .0 1Less than 0 .05Less than 0 .1 0
Notations by arrows indicate direction of (moving average) respons ein the second variable, to a hypothetical shock in the first variable, in aVAR simulation . (+ indicates response in kind ; – indicates oppositeresponse) .
Figure 12 .4 Significant lagged correlations (over 1–15 lags taken jointly )in VAR model of five long-wave variables, 1779–1935 .
12.4, there was good support for the relationships postulated in m ytheory (Figure 12 .2 above) :
1 . The two-way relationship of war and production was significant –although the direction of response of war to production was

316
Political Economy of Long Waves
unclear and the postulated negative response of production to warlasted only about ten years .
2. The one-way causation from war to prices was highly significan tand positive as postulated in the theory .
3. The positive effects of production on prices, and of real wages o nproduction, were significant in the VAR model, although ther ewere also significant reverse linkages not postulated in the theory .
4. Prices did exert a significant influence on real wages, but a positiv eone ; this is because the negative effect of prices on real wages i sinstantaneous, while the effect seen here, over 1–15 years, is th epartial return of real wages toward where they were before th eprice shock (instantaneously) changed them .
In the model wages also had a significant reverse effect on prices .Surprisingly, no significant relationships involving innovation wer efound in the model (perhaps just because of data quality) .
Since innovation did not appear significant in the five-variablemodel, I dropped it from the analysis and created a four-variabl eVAR model. This allowed the time-frame to be extended t o1750-1935, which after allowing for 15 lags left an analysis of1765-1935, or 171 years . In this four-variable model, with a slightl ylonger time-frame, the degrees of freedom are increased .
Using this four-variable model, I then checked whether the 15 lagscould be shaved down somewhat to increase degrees of freedom .Using Sims's modified likelihood test to check whether additiona llags significantly change the estimated model, I tested 10, 12, and 1 5lags, staying within the general confines of my theory (roughly aquarter of a cycle maximum for lagged effects) . 12 lags turned out t obe significantly different (at .01) from 10 lags, but 15 was not signifi-cantly different from 12 . Thus I reduced the specification of 15 lagge dterms to 12 for each independent variable .
The results of this four-variable analysis are shown in Figure 12 .5(the graphs of moving average response curves are included o nFigure 12.6) :
1. Both the positive liiik from production to war and the negativ elink fv m war to production are still significant .
2. The positive effect of recent war on present prices is still extremelysignificant .
3. Unlike the five-variable model, here war exerts a significant ,negative effect on real wages, as in the theory .

Goldstein: A War-Economy Theory
317
War severity (log)
+
Price s— excep t+ yrs 12-1 6
Production
+
Real wage s
Note : Arrows indicate direction of causality (forward through time) sug-gested by lagged correlations . Statistical significance shown by size o farrow is given by the F-test on the joint (1–12) lagged coefficients foreach variable in each equation .
Statistical significance :
Less than 0 .0 1Less than 0 .0 5Less than 0 .1 0
Notations by arrows indicate direction of (moving average) respons ein the second variable, to a hypothetical shock in the first variable, in aVAR simulation . (+ indicates response in kind ; – indicates opposit eresponse) .
Figure 12 .5 Significant lagged correlations (over 1–12 lags taken jointly )in VAR model of four long-wave variables, 1762–1935 .
4. The two-way interaction of production with prices and productio nwith real wages resembles the five-variable model (the effects o fproduction on prices, and wages on production, are still positive astheorised .
5. The price-wage interaction is also similar to the five-variablemodel .
As a further test, I ran a VAR model identical to the four-variabl emodel just discussed except that only 5 annual lags, rather than 12,

318
Political Economy of Long Waves
War severity (log)
Price s
Production
Real wage s
Note : Arrows indicate direction of causality (forward through time) sug-gested by lagged correlations . Statistical significance shown by size o farrow is given by the F-test on the joint (1–12) lagged coefficients foreach variable in each equation .
Statistical significance :
—~► Less than 0 :0 1--► Less than 0 .0 5--= Less than 0 .1 0
Graphs by each arrow indicates moving average response in thesecond variable, to an orthogonalised shock in the first variable, in aVAR simulation . Solid lines represent main ordering of variables ;dashed lines rep
Figure 12 .6 Significant lagged correlations (over 1–12 lags taken jointly )in VAR model of four long-wave variables, 1762–1935, wit hMAR responses

Goldstein : A War-Economy Theory
319
are included for each variable . Although this model is presumabl ymis-specified, it opens, in a sense, a window on shorter-term causa lconnections while becoming blind to longer-term effects beyond fiveyears .
According to my theory, the lagged correlations between war an dproduction, postulated as operating over a ten-to-fifteen year period ,should disappear in the 5-lag model . This is exactly the case in theresults of the 5-lag VAR analysis, shown in Figure 12 .7 . Theproduction-war connection is no longer significant, and war become sthe only `exogenous' variable in the system if we consider just th eshort-term interactions (one-to-five years) . Only in considerin glonger-term effects (one to twelve years, Figure 12 .5 & 12 .6) do wesee that war is endogenous, responding to changes in production . Allthis fits my long-wave theory well, and calls in question models of th eeconomic long wave which leave out war .
Finally, the contemporaneous correlations of residuals in the VA Rmodel reflect very short-term causal effects on a time-frame of les sthan one year (thus appearing contemporaneous in annual data) . Thecorrelations are :
Prices – real wages
-0 .32War – prices
+0 .12War – real wages
-0.10War – production
-0.23Prices – production
+0.24Production – real wages
0 .00
Here the statistics say nothing about the directions of causality whic hI will instead draw from those adduced in my theory . The price–wagecorrelation confirms that the immediate effect (not the delayed effectsafter one-to-fifteen years) of prices on wages is negative, as on ewould expect . The residual correlations also suggest same-year ef-fects of war on prices (positive), on production (negative), and o nreal wages (negative) . There is also a same-year positive correlationof production and prices, the causal direction of which is unclear .
These new analyses were undertaken for exploratory purposes . Iconsider the results a success in largely supporting my long-wav etheory. The causal diagrams that emerge from a VAR analysis o fselected time-series contain almost all the relationships postulated i nmy long-wave theory. The main exceptions were the failure toestablish any relationships using Haustein's list of innovations, and

320
Political Economy of Long Waves
War severity (log)
+
Price s
Production
(+
Real wage s
* In reverse ordering simulation, response is — then + .Note : Arrows indicate direction of causality (forward through time) sug-
gested by lagged correlations . Statistical significance shown by size o farrow is given by the F-test on the joint (1—5) lagged coefficients fo reach variable in each equation .
Statistical significance :
Less than 0 .0 1Less than 0 .05Less than 0 .10
Notations by arrows indicate direction of (moving average) respons ein the second variable, to a hypothetical shock in the first variable, in aVAR simulation . (+ indicates response in kind; — indicates opposit eresponse) .
Figure 12.7 Significant lagged correlations (over 1—5 lags taken jointly) i nVAR model of four long-wave variables, 1755—1935 .
the unexpected reverse feedbacks among production, prices, and wages .The elements of the theory concerning war are supported, overall ,
by the VAR analysis . War is affected by, and in turn affects, pro-duction . War exerts a one-way influence on prices (positive), and onreal wages (negative) . In the short time-frame, war seems to be exogen-ous, driving prices and real wages ; but in fact war is endogenous an dresponds to production on a time frame of up to twelve years .

Goldstein : A War-Economy Theory
321
3 A FOUR-PHASE DATING SCHEME
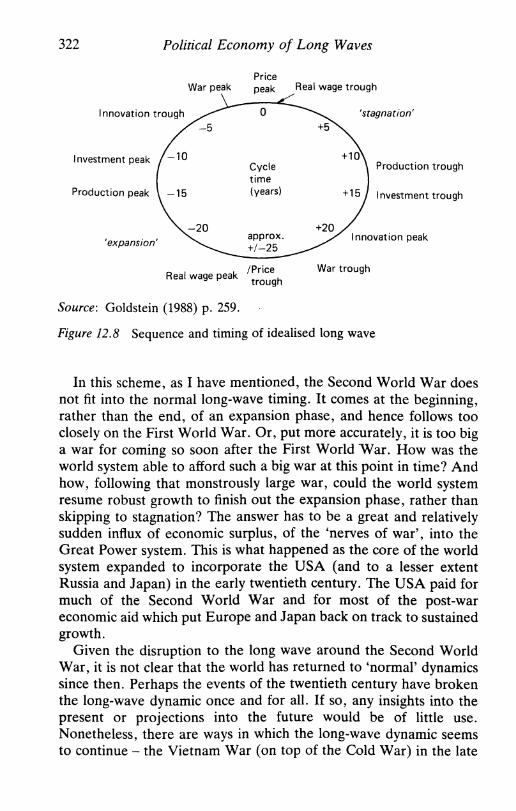
Given the important time-lags among variables in this theory, wemust abandon the simple two-phase dating scheme for long waves .Figure 12.8 illustrates the timing sequence of the variables in mylong-wave theory . There is not simply an `A' phase and a `B' phase ,but a series of lagged phases .
Concentrating on the crucial production and war variables, whic hlag each other by about a quarter of a cycle, we can define afour-phase scheme of the long wave :
1. Expansion — production, investment, war severity, and prices al lrise ; innovation is stagnant; real wages flatten out .
2. Stagflation — war severity is high, prices rise rapidly, and pro-duction and investment stagnate (stagflation) ; innovation is low ;real wages fall .
3. Stagnation — production growth is low and uneven ; investment i s1( .,v ; war severity declines ; inflation is low (or prices even decline) ;innovations begin rising ; real wages recover .
4. Rebirth — production growth picks up again, investment follows ;prices are low ) war severity is low ; innovation is high ; real wagesare high.
The traditional conception of long waves in terms of synchrony o fprices and production gives rise to an A-phase, B-phase rendition o fall-round economic expansion or stagnation . These phases do occur —they are phases 1 and 3 above — but account for only half of the story .The other half is in certain ways even more interesting . The wa rphase and the rebirth phase seem to represent extremes of th eundesirable and desirable points in the long wave .
This four-phase timing may be tentatively matched with historica ldates . The beginning dates of `expansion' and `stagnation' woul dcome from the price troughs and peaks listed in my base datin gscheme (Goldstein, 1988) — except that I would change 1917 to 1920 ,which seems a better date for the price peak. The following dating i sput forward as a starting-point, and may need adjustment :
Expansion 1790—1803? 1848—60? 1893—1910 1940—6 8War 1803?—14 1860?—72 1910—20 1968—8 0Stagnation 1814—30 1872—(?) 1920—33 1980-95?Rebirth 1830—48 (?)—1893 1933—40 ?1995—2010?
322
Political Economy of Long Waves
War peakPricepeak
Real wage troug h
'stagnation '
'expansion'
Real wage peak /Pricetrough
War troug h
Source : Goldstein (1988) p . 259 .
Figure 12 .8 Sequence and timing of idealised long wave
In this scheme, as I have mentioned, the Second World War doe snot fit into the normal long-wave timing . It comes at the beginning ,rather than the end, of an expansion phase, and hence follows tooclosely on the First World War . Or, put more accurately, it is too biga war for coming so soon after the First World War . How was theworld system able to afford such a big war at this point in time? An dhow, following that monstrously large war, could the world syste mresume robust growth to finish out the expansion phase, rather tha nskipping to stagnation? The answer has to be a great and relativel ysudden influx of economic surplus, of the `nerves of war', into th eGreat Power system . This is what happened as the core of the worldsystem expanded to incorporate the USA (and to a lesser exten tRussia and Japan) in the early twentieth century . The USA paid fo rmuch of the Second World War and for most of the post-wareconomic aid which put Europe and Japan back on track to sustainedgrowth .
Given the disruption to the long wave around the Second WorldWar, it is not clear that the world has returned to `normal' dynamicssince then. Perhaps the events of the twentieth century have broke nthe long-wave dynamic once and for all . If so, any insights into th epresent or projections into the future would be of little use .Nonetheless, there are ways in which the long-wave dynamic seem sto continue -- the Vietnam War (on top of the Cold War) in the late

Goldstein: A War-Economy Theory
323
1960s, the `stagflation' on schedule in the 1970s, the end of robus tworld economic growth in the 1970s and 1980s, and the downturn o finflation in at least some key economies in the 1980s .
If this timing sequence is correct, we are now in the `stagnation 'phase of stagnant production, low inflation, and reductions in GreatPower war (or in the cold war, which has been the economic equiv-alent of a low-intensity, drawn-out Great Power war) . The historicalanalogies to our present phase are in 1920-33, or perhaps mor eappropriately (as I argue in Goldstein, 1988) in the 1870s and 1880s .
In such a sequence, the Reagan military build-up of the 1980s i scounter-cyclical . That build-up could not last and, after less than adecade, came to a halt under a cloud of national debt . The Reaganpolicy of priming economic growth by cutting taxes and increasin gmilitary spending led to massive deficits in part because the underly-ing production-downswing phase could not respond strongly enoug hto such stimulation . On the other hand, the policy did not trigger highinflation because the underlying price-downswing phase (notable indecreasing oil prices in the late 1980s) kept inflation under controland production creeping forward despite the drain of increase dmilitary spending.
The US military build-up of the 1980s appears as a delayed `las tgasp' of the war-stagflation phase . It has, at best, applied counter -cyclical pressure to smooth out the transition to out-and-out stag -nation . At worst, it has delayed true stagnation by a few years bu tincreased its potential severity . The policy has also thwarted the rea lwage increases that should be the due of workers in this phase, as theeconomy readjusts away from war .
The debt for those years must still be paid off or written off, an dthis may hold back the coming of `rebirth' and perhaps bring financia linstability, even crashes . But the long-term picture, which even theUS frenzy of spending did not change, is that the world economy an dthe world military system are moving toward a truly `peacetime 'economy for the first time since before the Second World War . Thatis, the world may finally demobilise from the last great war in a waythat was done quickly after most wars in centuries past . The `perma-nent' war economy may be long-lived but not immortal after all .Thus, the peaceful character of these years offers one consolation forcontinuing stagnation and possible financial collapses in the earl y1990s . By 1989 these trends have clearly emerged, and it is `no acci-dent' (as the Soviets like to say) that the trends have moved furthes tand fastest in that greatest of military economies, the Soviet Union .

324
Political Economy of Long Waves
A second consolation in this late stagnation period is the high rat eof innovation as new sectors are arising to carry the next wave o fprosperity . The most interesting of these innovations may be occur -ring in the biotechnology, electronics, telecommunications, an dspace industries (the latter and much of the rest depending on th eability of political leaders to resist militarising space) .
If this difficult transition through `stagnation' can be navigate dsuccessfully, we may look forward to the `best of times' in the rebirt hphase around the turn of the century . This all-important time ofpeace and prosperity for the great powers may offer the best hope fo rrestructuring the war system in fundamental ways . Those years mayoffer a `window of opportunity', toward which we should now b eaiming, to get off the merry-go-round of Great Power war once an dfor all .
Note
* Acknowledgements : For their comments on and criticisms of an earlie rdraft of this paper, I thank John Freeman, David Gordon, GiovanniArrighi, Richard Goodwin, Dina Zinnes, Paul Pudiate, Andra Rose,André Gunder Frank, Alfred Kleinknecht, Thomas -Kuczynski, Beverl ySilver, Andrey Poletayev, Stanislav Menshikov, Ernest Mandel, and Im-manuel Wallerstein . A previous version of this paper was presented at th e`Long Wave Debate' conference, Vrije Universiteit Brussels, 12–1 4January 1989 .
References
Braudel, Fernand (1972) The Mediterranean and the Mediterranean World i nthe Age of Philip II (London : Collins) .
Frank, André Gunder (1978) World Accumulation, 1492–1789 (New York :Monthly Review Press) .
Freeman, Christopher, Clark, John and Soete, Luc (1982) Unemploymen tand Technical Innovation (London: Frances Pinter) .
Freeman, John R ., Lin, Tse-min and Williams, John (forthcoming) `VectorAutoregression and the Study of Politics', American Journal of PoliticalScience .
Goldstein, Joshua S . (1988) Long Cycles : Prosperity and War in the Moder nAge . (New Haven : Yale University Press) .
Goldstein : A War-Economy Theory
32 5
Haustein, Heinz-Dieter and Neuwirth, Erich (1982) `Long Waves in WorldIndustrial Production, Energy Consumption, Innovations, Inventions, an dPatents and Their Identification by Spectral Analysis', Technological Fore -casting and Social Change, no 22, pp . 53–89 .
Kondratieff, Nikolai D . (1935) `The Long Waves in Economic Life', Reviewof Economic Statistics, vol . 17 no 6 (November) pp. 105-15 .
Levy, Jack S . (1983) War in the Modern Great Power System, 1495–1975(Lexington, Kentucky : University Press of Kentucky) .
Mandel, Ernest (1980) Long Waves of Capitalist Development (Cambridge :Cambridge University Press) .
Mensch, Gerhard (1979) Stalemate in Technology : Innovations Overcome theDepression (Cambridge, Massachusetts : Ballinger) .
Sims, Christopher (1980) `Macroeconomics and Reality', Econometrica ,vol . 48, no 1, pp . 1–48 .
Sterman, John D . (1983) `A Simple Model of the Economic Long Wave' ,MIT System Dynamics Group, working paper D–3410, March .
Van Duijn, J . J . (1983) The Long Wave in Economic Life (Boston: Allen &Unwin) . (From the Dutch version of 1979 . )
Wojtyla, Henry L . (1988) `Going for Growth and Global Diversification :An Investment Strategy for the Post-Reagan Era', Investment Strateg ySpecial Report (New York: Rosenkrantz, Lyon, and Ross) 17 Augus t1988 .