Embed Size (px)
Citation preview

TECHNICAL REPORT STANDARD TITLE PAGE
1. Repo,t No. 2. GO"'OmM ... t Acco .. lon No.
FHWA/TX-85/ll+35l-lF
... Titlo ond Subtitlo
THE EFFECT OF BENTONITIC SLURRY ON DRILLED SHAFTS
1. Autho,I.)
Karen L. Tucker and Lymon C. Reese
9. po"o,.ift, Or,anilotion N_o and A4Idro ..
Center for Transportation Research The University of Texas at Austin Austin, Texas 78712-1075
~~~----~--~--~~--------------------------~ 12. Sponloriftl AtOftC, N_. Oftd Add,o .. Texas State Department of Highways and Public
Transportation; Transportation Planning Division P.O. Box 5051 Austin, Texas 78763 15. Su".I ••• ftto" Noto.
3. Roclpi.ftt· I Cotololl No.
S. R.port D.to
July 1984 6. P.,foI'Minll Orllonilotion Code
B. Po,to_in, O'lloniaotion Ropo,t No.
Research Report 35l-lF
10. Worle Unit No.
11. Cont,oct 0' Gront No. Research Study 3-5-83-351 13. Typo of R.po,t on41 P.riod Co ... ,od
Final
I... Sponlorinl Alloncy Codo
Study conducted in cooperation with the U. S. Department of Transportation, Federal Highway Administration
Research Study Ti tIe: tiThe Effec t of Bentonite Slurry on Drilled Shafts" 16. Ablt,oct
A series of laboratory and field studies were performed to determine the effect of bentonitic slurry on drilled shafts. Suggestions for construction procedures and slurry specifications are made. When such procedures were followed, no adverse effects have resulted.
17. Ko, w .. 4I.
drilled shafts, bentonitic slurry, laboratory, field tests, construction procedures, specifications, filter cake
18. Oiltrleu.i ... s ........ t No restrictions. This document is available to the public through the National Technical Information Service, Springfield, Virginia 22161.
19. Socllnty Clo .. ll. (of thl. r.,.,t)
Unclassified
». Se_lty CI ... If. (of thi I ,I ... '
Unclassified
21. No. of p.... 22. P,lco
97
Form DOT F 1700.7 ,,-It)
I
THE EFFECT OF BENTONITIC SLURRY ON DRILLED SHAFTS
by
Karen L. Tuck.er Lymon C. Reese
Research Report Number 351-1F
Research Study 3-5-83-351
conducted for
Texas State Department of Highways and Public Transportation
in cooperation with the U.S. Department of Transportation
Federal Highway Administration
by the
CENTER FOR TRANSPORTATION RESEARCH
BUREAU OF ENGINEERING RESEARCH
THE UNIVERSITY OF TEXAS AT AUSTIN
July 1984
The contents of this report reflect the views of the authors, who are responsible for the facts and the accuracy of the data presented herein. The contents do not necessarily reflect the official views or policies of the Federal Highway Administration. This report does not constitute a standard, specification, or regulation.
There was no invention or discovery conceived or first actually reduced to practice in the course of or under this contract, including any art, method, process, machine, manufacture, design or composition of matter, or any new and useful improvement thereof, or any variety of plant which is or may be patentable under the patent laws of the United States of America or any foreign country.
i i
PREFACE
This report presents the results of laboratory and field studies of the
effect of bentonitic slurry on drilled shafts. Suggestions are made regarding • construction procedures and slurry specifications.
The authors wish to thank the State Department of Highways and Public
Transportation for their sponsorship of the work and to express their appreci-
ation for the assistance given by many members of their staff. Appreciation is
also expressed to Farmer Foundation Company for their assistance and many sug-
gestions throughout the project. Lola Williams and Linda Iverson provided sup
port in the office for both field testing and manuscript preparation.
Karen L. Tucker
Lymon C. Reese
July 1984
; i i

ABSTRACT
A series of laboratory and field studies were performed to determine the
effect of bentonitic slurry on drilled shafts. Suggestions for construction
procedures and slurry specifications are made. When such procedures are fol
lowed, no adverse effects have resulted.
iv
SUMMARY
This study concerns the effect of bentonitic slurry on drilled shafts.
Studies were performed in the laboratory and in the field. The build up of fil
ter cake in the field was found to be much less than in the laboratory. In
addition, construction of drilled shafts using reverse circulation was found to
produce a shaft with a uniform diameter.
Suggestions are made regarding proper construction procedures and slurry
specifications.
v

IMPLEMENTATION STATEMENT
This study presents construction procedures and slurry specifications for
drilled shafts constructed using bentonitic slurry. Periodic testing of the
slurry is an integral part of the specifications.
It is suggested that calipers be used to monitor shaft profiles. In that
way, any caving or enlarging of the shaft can be detected.
vi

TABLE OF CONTENTS
PREFACE .
ABSTRACT
SUMMARY .
IMPLEMENTATION STATEMENT
LIST OF TABLES
LIST OF FIGURES
CHAPTER 1. INTRODUCTION
Use of Bentonite .. Filter-Cake Formation Concrete Placement. Investigations ... Experimental Studies
CHAPTER 2. SLURRY PROPERTIES
Thixotropy ...... . Chemical Structure Suspension of Detritus
Engineering Properties Density .... pH . . . . . . Sand Content Shear Strength Vi scosi ty . . .
Specifications ...
CHAPTER 3. LABORATORY INVESTIGATIONS
Considerations .... Filter-Cake Growth ..
Testing Apparatus Testing Procedure Data Accumulation Data Ana lysi s . .
vii
iii
iv
v
vi
x
xi
1 2 5 7
10
11 11 11 13 13 15 15 15 17 19
20 20 20 21 24 25

Sample Sedimentation Sedimentation Process Testing Procedure Data Analysis ... .
Application ....... .
CHAPTER 4. DEVELOPMENT OF SIDE-WALL SAMPLER AND CALIPERS
Objective ...... . Considerations ... .
Sampling at Depth Sample Retrieval . Versatility .. .
Sampler Specifics .. . Hydraulic Cylinders Sampling Tubes Guide . . . . Frame and Pump
Trial Test Calipers .... .
Objective ..... . Configuration Diameter Determination.
CHAPTER 5. TESTING AT LAVACA BAY
Site Specifics ..... . Project Specifics Construction Sequence
Construction Problems Start-Up Delays Drilling Delays Clogging in Clay
Sampling Problems ... Testing at Lavaca Bay
Initial Results Weather Problems Final Testing
CHAPTER 6. SPECIFICATIONS
Need for Specifications Specifications .....
CHAPTER 7. CONCLUSIONS AND RECOMMENDATIONS
Conclusions .............. . From Literature Research .... . Laboratory vs. Field Investigation From Field Experiments
Recommendations ........... .
vi;;
25 25 33 3J 35
39 39 39 40 40 40 40 42 42 42 42 45 45 45 45
49 49 49 50 50 50 51 53 55 55 58 58
61 61
68 68 69 69 70

ix
REFERENCES . . . . . . . . . . . . . . . 72
APPENDIX A. RESULTS OF LABORATORY TESTS 74
APPENDIX B. SAND SIEVE ANALYSIS. . . . 79
APPENDIX C. SPECIFICATION FOR CAST IN PLACE PILES FORMED UNDER BENTONITE SUSPENSION. . . . . . . . . . . . . . . .. 81

Table
3.1
4.1
5.1
5.2
6.1
6.2
6.3
6.4
6.5
LIST OF TABLES
Shear Strength of Sedimented-Slurry Samples Using Laboratory-Vane Test .
Caliper Readings
Caliper Readings
Results of Field Testing
Slurry Specifications (Fleming and Sliwinski, 1975)
Slurry Specifications (Hutchinson, Daw, Shotton and James, 1975) ............... .
Slurry. Specifications (Hodgeson, 1977) ...
Slurry Specifications (Federation of Piling Specialists, 1977) . . . . . . . . . . . . . . .
Slurry Specifications (Holden, 1983) ....
x
Page
34
48
56
57
62
63
64
66
67

LIST OF FIGURES
Figure
1.1 Surface Filtration
1.2 Deep Filtration
1.3 Concrete Placement by Tremie
1.4 Action of Fresh Concrete
2.1 . Mud-Density Balance
2.2 pH Paper . . . . . .
2.3 Equi pment for Sand-Content Test.
2.4
2.5
3.1
3.2
3.3
3.4
3.5
3.6
3.7
3.8
3.9
4.1
4.2
4.3
Shearometer
Marsh Funnel .
Permeameter
Test i ng System
Water Content vs. Filter-Cake Thickness
8% Bentonitic Slurry.
10% Bentonitic Slurry
3 psi Development Pressure
15 psi Development Pressure.
30 psi Development Pressure.
Shear Strength vs. Water Content
Side-Wall Sampler
Sampling Tube
Basket Retainer
xi
Page
3
4
6
8
14
16
16
18
18
22
23
26
27
28
29
30
31
36
41
43
43
Figure
4.4
4.5
5.1
5.2
Sampler Guide • .
Calipers ...... .
Soil Profile at Site of Test Excavation
Devi ce for Sampling Sl urry. . • . . . .
xii
Page
44
46
52
59
CHAPTER 1. INTRODUCTION
Use of Bentonite
In the past few decades, the construction industry has borrowed technology
from the petroleum industry, primarily in the usage of bentonitic slurry as a
drilling aid. In drilled-shaft construction, the slurry is used to stabilize
the shaft during and after drilling and, at times, to circulate cuttings out
of the shaft during drilling. Sodium montmorillonite, such as is found in
Wyoming, U.S.A., is the base from which bentonitic slurry is formed. The
plate-like particles which compose the sodium montmorillonite expand greatly
in the presence of water, absorbing a large portion of the water present. Due
to the molecular structure of the sodium montmorillonite, bonds are formed
between the particles as they swell, and a gel is formed. When the mixture
is agitated, the bonds are easily broken, creating a less viscous fluid. The
bonds are re-established as the mixture 1s allowed to stand. A mixture with
these characteristics is said to be thixotropic. It is the thixotropic nature
of bentonitic slurry which allows it to stabilize an excavation and suspend
detritus, making the slurry useful 1n construction.
The construction industry uses bentonitic slurry in the construction of
slurry walls, cut-off walls. and drilled shafts. This report is concerned with
drilled-shaft construction. The slurry-displacement method of drilled-shaft
construction is used where soil conditions are such that caving or excessive
deformation will occur when a hole ;s excavated. As mentioned previously. the
slurry is used to stabil i ze the excavat 1 on. The slurry is then di sp 1 aced by
1

2
concrete which is placed through a tremie. The bentonitic slurry is able to
stabilize the excavation, preventing caving or excessive deformation, through
the formation of a filter cake.
Bentonitic slurry is also used to stabilize the initial stages of an exca
vation if the casing method is employed. While the research reported herein is
principally directed at the slurry-displacement method of construction, the
results of the studies are also applitable to the casing method.
Filter-Cake Formation
There are three mechanisms by which a seal is formed at the soil surface,
causing filter-cake development. Surface filtration is the most efficient
mechanism by which a filter cake is formed. In surface filtration, very little
bentonite penetrates the soil. The bentonitic particles remain in the pore
spaces as the water from the slurry passes into the soil. As the pore spaces
are filled with bentonitic particles, a filter cake is formed on the soil sur
face (Fig. 1.1). The process continues with time, so that the filter cake
thickens and the amount of water passing into the soil decreases.
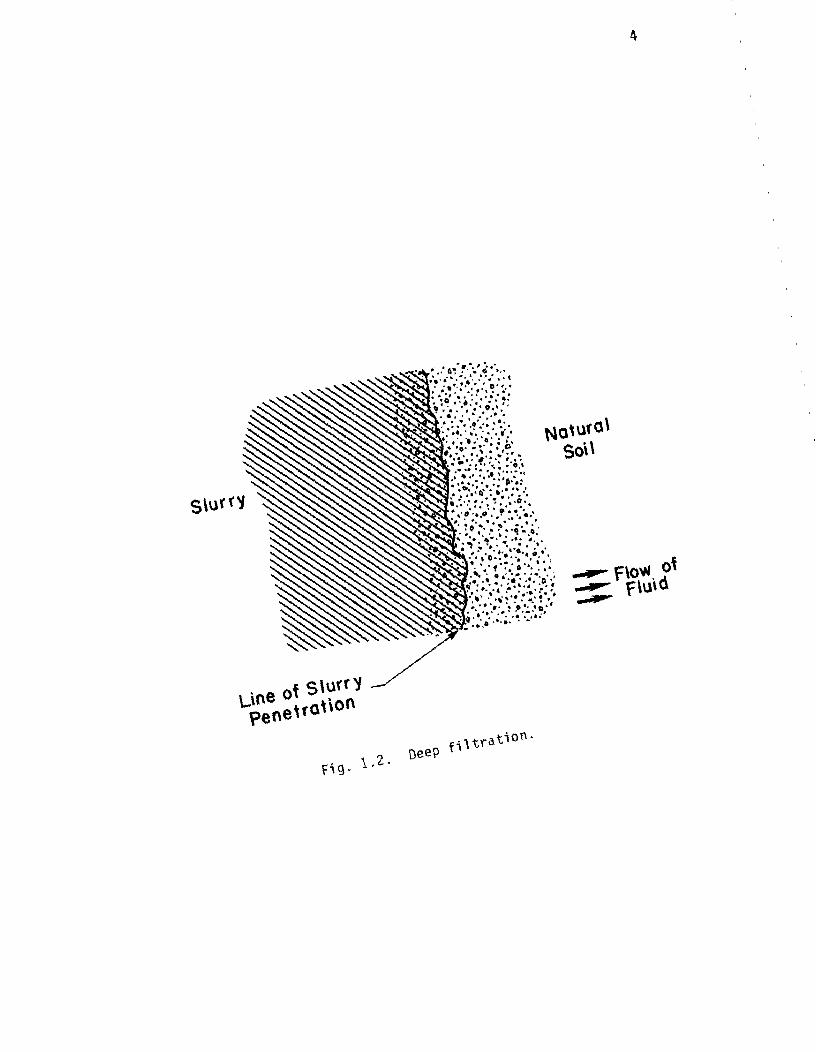
Deep filtration is a more complex mechanism of filter-cake development
than is surface filtration. During deep filtration, the slurry penetrates the
soil several millimeters before a seal is formed (Fig. 1.2). As a result, a
seal is not formed as quickly as in surface filtration, and, thus, filter-cake
development is slower. The third mechanism of filter-cake development is rheo
logical blocking and is the least efficient of the three mechanisms. In rheo
logical blocking, a seal is formed as a result of the shear stresses between
the slurry and the soil particles. The slurry penetrates the soil until the
shear stresses are such that the slurry can go no further. In some instances,
the slurry will penetrate several meters into the soil. As would be expected,
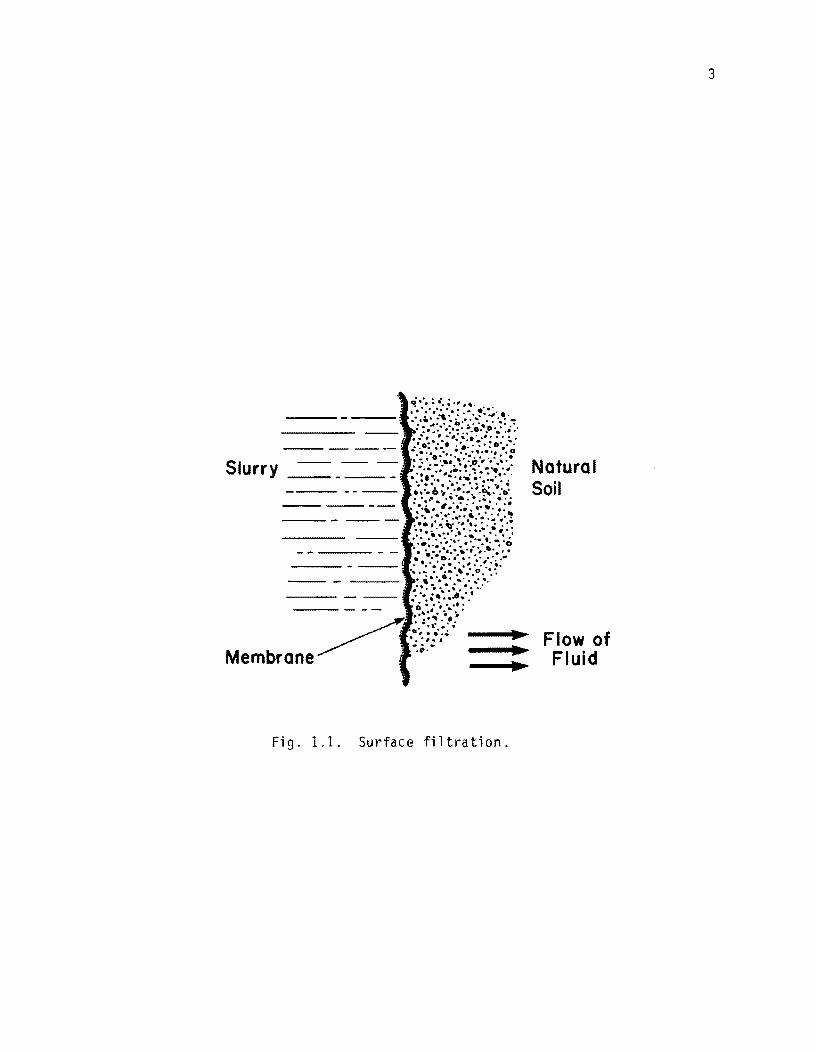
Fi g. 1.1. Surface filtration.
Natural Soil
Flow of Fluid
3
L\ne of S\urr1 peneHoHon
5
the amount of time required for a seal to form is much greater than with the
other mechanisms, and the slurry loss is also greater. In addition, the pres
ence of the slurry in the soil coul d reduce the ang 1 e of i nterna 1 fri ct ion,
thereby decreasing the stability of the soil.
Rheological blocking, as stated above, is the least efficient mechanism
for filter-cake development. Deep filtration is less efficient than is surface
filtration, but is still very effective. Surface filtration, and deep filtra
tion to a lesser extent, lead to substantial filter-cake development. Regard
less of the mechanism by which the filter cake develops, the longer the slurry
remains in an excavation, the thicker the filter cake. Thus, the amount of
time between completion of the excavation and the placement of the concrete
influences the filter-cake thickness. Little filter-cake development, and,
thus, time between completion and concrete placement, is desirable due to con
cern over whether or not the filter cake is removed when the concrete displaces
the slurry.
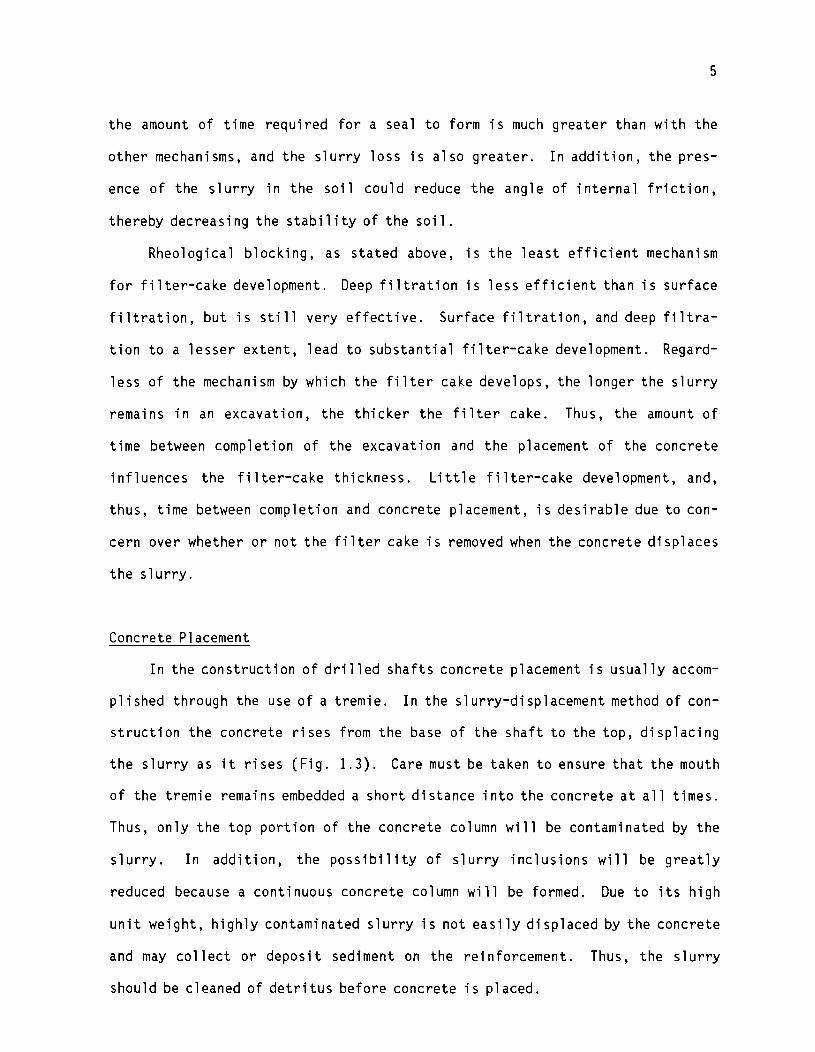
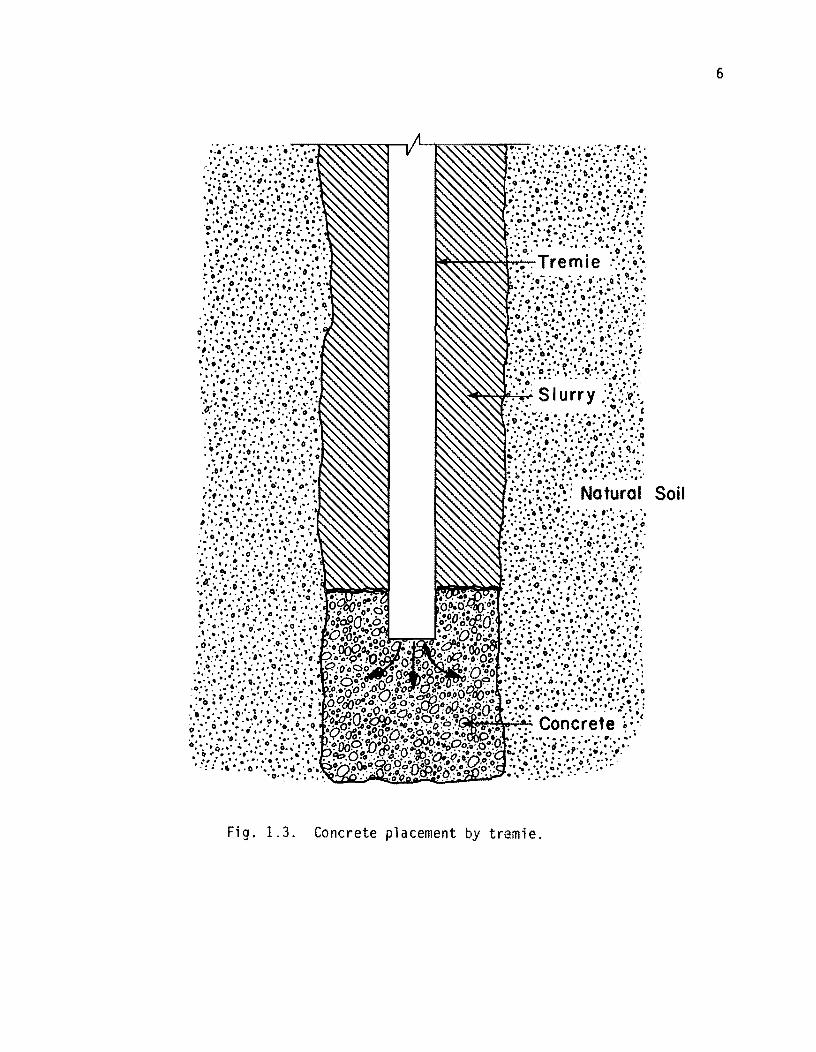
Concrete Placement
In the construction of drilled shafts concrete placement is usually accom
plished through the use of a tremie. In the slurry-displacement method of con
struction the concrete rises from the base of the shaft to the top, displacing
the slurry as it rises (Fig. 1.3). Care must be taken to ensure that the mouth
of the tremie remains embedded a short distance into the concrete at all times.
Thus, only the top portion of the concrete column will be contaminated by the
slurry. In addition, the possibility of slurry inclusions will be greatly
reduced because a continuous concrete column will be formed. Due to its high
unit weight, highly contaminated slurry is not easily displaced by the concrete
and may collect or deposit sediment on the reinforcement. Thus, the slurry
should be cleaned of detritus before concrete is placed.
6
Soil
Fig. 1.3. Concrete placement by tramie.

7
In the casing method of constructing drilled shafts, the casing may be
driven through a surface stratum of sand with a vibratory hammer. Construction
proceeds by excavating through the casing into non-caving soil below the cas
ing. But, as is frequently the case, excavation can be initiated through the
surface sand by use of bentonitic slurry until a relatively impermeable,
non-caving soil is reached. Then a casing is set, the slurry is bailed from the
casing, and excavation proceeds. The casing is sealed at its bottom in the
non-caving soil by use of downward force and torque with the result that slurry
is trapped in the annular space between the outside of the casing and the exca
vation. It is important that the trapped slurry be displaced by concrete when
the casing is pulled. Thus, the behavior of slurry and its interaction with
concrete is important in this latter casing method.
As the concrete ri ses, it scrapes the wa 11 s of the shaft, presumably
removing the filter cake (Fig.l.4). However, evidence exists that the filter
cake is not always completely removed by the rising concrete, particularly in
pervious soils. Fleming and Sliwinski (1977) report observations of the
excavated faces of diaphragm walls in pervious soils on which the bentonitic
cake remained partly, or totally, on the surface of the concrete. Wates and
Knight (1975) also conclude that the filter cake remains during casting. In
view of these observations, questions arise as to what effect, if any, does the
remaining filter cake have on shaft capacity, particularly in terms of skin
fri ct ion. Also, how does the strength of the fil ter cake compare with the
strength of the surrounding soil, and how strong are the bonds between the soil
and the filter cake and between the concrete and the filter cake?
Investigations
Various investigations have been undertaken to determine whether or not
the slurry-displacement method of drilled-shaft construction has any effect on

Slurry
Fresh Concrete Being Placed
Fi!J. 1. 4 .
8
Action of fresh concrete.

9
shaft capacity. Most of the studies, both in the field and in the laboratory,
have concentrated on the effect of bentonitic slurry on skin friction. Weiss
(1965), Farmer and Goldberger, (1969) and Wates and Knight (1975) have all con
ducted laboratory investigations to determine any effects of the slurry. All
three investigations were concerned with the effects on skin friction developed
between sand and concrete. Weiss (1965) performed his tests on slabs cast hor
izontally on compacted sands, whereas Farmer and Goldberger (1969) and Wates
and Knight (1975) conducted their tests on model piles cast in compacted sand.
All three investigations determined that some degree of reduction in skin fric
tion resulted from the presence of bentonitic slurry. Farmer and Goldberger
(1969) reported reductions of up to 20%, and Wates and Knight (1975) reported
reductions of up to 30%. In addition, both of these studies found that very
little filter cake is removed by the scouring action of the rising concrete.
Field investigations, on the other hand, generally have implied that there
are no adverse effects on the skin friction of drilled shafts when they are
constructed using bentonitic slurry. Fleming and Sliwinski (1977) report on a
variety of field investigations. The report includes comparative tests,
instrumented-pile tests, and individual tests on piles without special instru
mentation. In addition, piles in cohesive soils, granular soils, and chalk
were investigated by at least one of the methods. In granular soils, there is
an indication that shaft capacity may be reduced by large axial displacements.
However, the reductions occurred on a shaft for which the excavation remained
filled with contaminated slurry for a long period of time and which was not
cleaned prior to concrete placement. Such conditions are not considered as
good construction practices. Other tests in granular soils did not show such
effects, nor did the tests in cohesive soils or in chalk. Thus, although the
testing procedures differ for the various soil types, the general conclusion by
10
Fleming and Sliwinski from the field investigation is that there are virtually
no adverse effects on skin friction resulting from the use of bentonitic slur
ry.
Touma and Reese (1972) and OINeill and Reese (1970) report on studies that
were carried out at The University of Texas. Several full-sized drilled
shafts, instrumented for the measuring of the distribution of axial load with
depth, were tested and the influence of the construction method was discussed.
It was found that the load transfer in skin friction was about the same for the
dry method (hole could be drilled without using any support) and for the slur
ry-displacement method. However, in at least one case it was found that slurry
was trapped in the excavation when the casing method was used.
Experimental Studies
As shown above, there is conflicting evidence as to whether or not the use
of bentonitic slurry has any adverse effects on skin friction. It has also
been shown that construction practices can impact the slurry effects. The
investigation reported in this document consists of both laboratory and field
studies. The laboratory work serves primarily as background for the field
work. The investigation is concerned with filter-cake development and charac
teristics. In particular, the slurry properties and construction practices
which influence the filter cake are studied. The aim of the investigation is
to provide information that will assist in the development of specifications
for the construction of drilled shafts when bentonitic slurry is used in the
construction technique.
The principal field investigation was done at Lavaca Bay and was in
connection with a construction contract at that site.
CHAPTER 2. SLURRY PROPERTIES
Thixotropy
Chemical Structure. As stated earlier, bentonite is a sodium
montmorillonite and exhibits thixotropic properties when combined with water.
The thixotropic properties of the slurry are a result of bonds formed between
the clay particles. A thorough explanation of the chemical structure of the
bentonitic suspension can be found elsewhere (Fleming, and Sliwinski, 1977).
Briefly, in the presence of water, the clay crystals separate, forming a sus
pension of thin, plate-like particles. The particles have a negative charge on
the surface and a positive charge on the edge. A gel is formed through the
three-dimensional bonding of the negative faces with the positive edges. The
bonds are weak, so they are easily broken by agitating the slurry. The bonds
reform as the slurry is allowed to remain still.
Suspension of Detritus. The ability of bentonitic slurry to gel serves
two purposes in the construction of drilled shafts. First, as described earli
er, the slurry forms a filter cake on the shaft wall, stabilizing the shaft.
Second, the formation of the gel enables the slurry to hold detritus in suspen
sion. Hence, cuttings can be circulated out of the shaft during drilling and
detritus settlement will be minimized. The ability of the slurry to hold
detritus in suspension is determined in part by the amount of bentonite pres
ent.
Laboratory investigations were conducted to determine the effect of the
amount of bentonite in the slurry on the abil ity of the slurry to suspend
11
12
detritus. Slurries composed of 2~~ to 10~~ bentonite were investigated. The
percentage of bentonite is based on the weight of bentonite to the weight of
water. After the slurry had been thoroughly blended so that optimal hydration
of the bentonite was achieved, sand and small pebbles (smaller than 1/2 in.)
were added to the slurry in small amounts, and the amount of settlement with
time was observed. Slurries composed of less than 3 to 4% of bentonite were
virtually ineffective in holding detritus in suspension. The pebbles and a
large portion of the sand remained suspended for a few hours in slurries com
posed of 4 to 4 1/2% of bentoni te. S 1 urri es composed of 4 1/2 to 5% of
bentonite were very effective in suspending detritus. All of the sand was held
in suspension and settlement of the pebbles occurred only after several hours.
Slurries composed of greater than 4 1/2 to 5% of bentonite showed virtually
no settlement of detritus over time. Large amounts of sand and pebbles were
mi xed into the slurry wi thout settlement occurri ng. Hence, 4 to 4 1/2% of
bentonite is a turning point in slurry behavior. Below this percentage,
detritus settles rapidly, while above that percentage virtually no settlement
occurs.
The ability of the slurry to hold detritus in suspension is determined
by factors other than the percentage of bentonite present. Thorough mixing
of the benton i te is very important. Wi thout thorough mi xing, the benton i te
will clump so that not all of the particles are exposed to the water and a very
non-un iform slurry results. The un iformity or non-un iformi ty of the slurry
affects the ability of the slurry to build up a filter cake and ability of the
slurry to hold detritus in suspension. In short, the engineering properties
of the slurry are affected.
13
Engineering Properties
The engineering properties of bentonitic slurry include shear strength,
viscosity, and density. Sand content and pH are also of interest. Measurement
of these characteristics aids in the determination of the slurry's ability to
build up a filter cake and to hold detritus in suspension. These properties
are influenced by the amount of bentonite present, the method of mixing, the
duration of mixing, the amount of time without agitation, and the amount of
contamination.
Density. The density of the slurry is determined by the amount of bento
nite and the amount of contamination. Ideally, proper mixing will result in
the bentonite being distributed uniformly through the slurry. However, the
degree of contamination will most likely vary over the length of the shaft,
with the highest percentage at the base. The density of the slurry is of con
cern for a number of reasons. First, a relatively high density aids in pre
venting sloughing of the soil surrounding the excavation because as the density
increases the pressure of the slurry increases. Second, a very dense slurry
can be difficult to circulate if reverse circulation is used, and third, a very
dense slurry may be difficult for concrete to displace, possibly resulting in
slurry inclusions. With these considerations in mind, the density of slurry
should be such that it aids in supporting the shaft walls and in keeping the
shaft free of water, while at the same time it allows for circulation and con
crete placement.
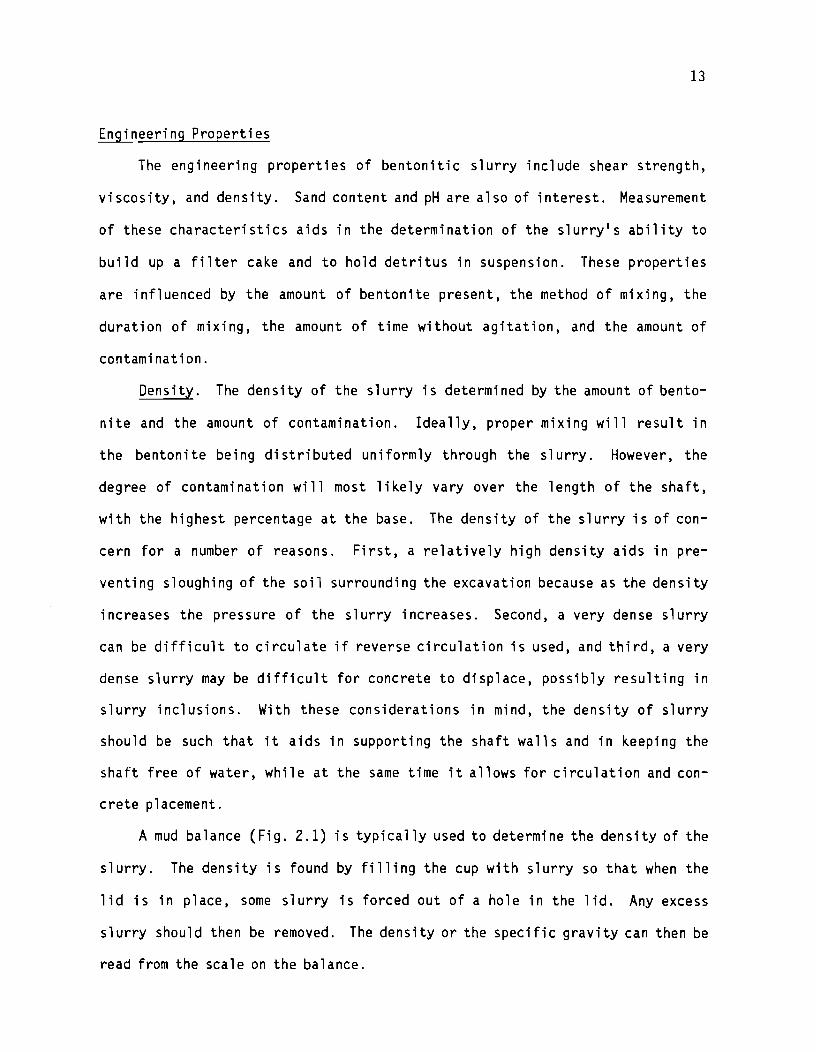
A mud balance (Fig. 2.1) is typically used to determine the density of the
slurry. The density is found by filling the cup with slurry so that when the
lid is in place, some slurry is forced out of a hole in the lid. Any excess
slurry should then be removed. The density or the specific gravity can then be
read from the scale on the balance.

14
Fig . 2.1. Mud-density balance.

15
£t!. The pH of the slurry can be influenced by minerals present in the
water and in the soil. The pH should be kept in a range such that it would have
no adverse effects on the shaft reinforcement, casing, or concrete. The pH of
the slurry can be determined by pH paper (Fig. 2.2) or an electric pH meter.
Sand Content. The sand content is a means of estimating the amount of
slurry contami nat ion. As mentioned above, the presence of detri tus wi 11
increase the density of the slurry and can cause the slurry to be difficult to
circulate and to be displaced. In addition, a high sand content may cause a
thick filter cake to build up due to the added particles in the slurry. Also,
as the slurry is displaced, sand may collect on the reinforcement if the slurry
is highly contaminated and proper bonding between the concrete and reinforce
ment would be hindered. When slurry is to be circulated and/or reused, it is
possible to remove most of the contamination through the use of slurry shakers
and desanders.
A sand-content test is performed by mi xi ng a specifi c amount of sl urry
with water. The mixture is poured through a No. 200 screen so that sand parti
cles are retained on the screen. The sand particles are then washed into a
marked tube. The percentage of sand can be read from the tube once the sand has
settled. The testing equipment is shown in Fig. 2.3.
Shear Strength. The shear strength of the slurry is determined by the
amount of bentonite present, the thoroughness of mixing, and the amount of time
since agitation. Without agitation, the slurry will gel, resulting in an
increased shear strength. As the shear strength of the slurry increases, the
ability of the slurry to hold detritus in suspension increases. It is possible
for the slurry to be satisfactory regarding density, pH, sand content and even
viscosity, and have very little shear strength. Hence, determination of shear
strength is instrumental in evaluating slurry performance.

16
Fig. 2.2. pH paper.
Fi g. 2.3. Equipment for sand-content test.
17
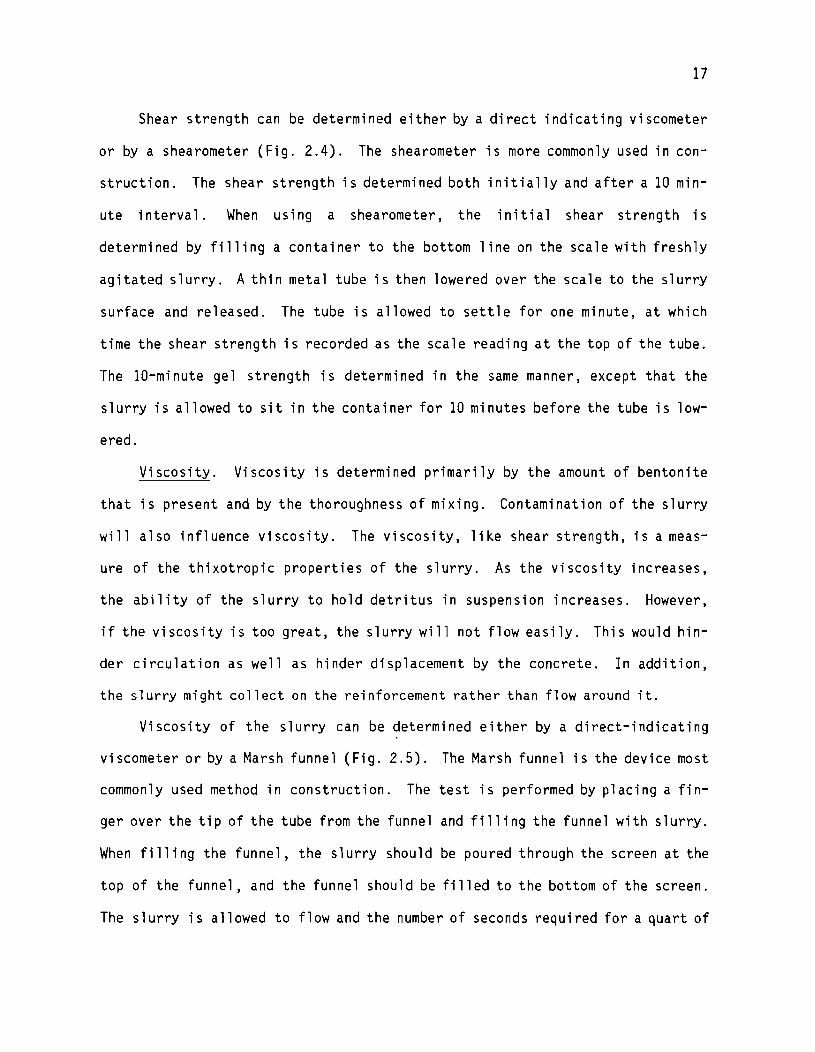
Shear strength can be determined either by a direct indicating viscometer
or by a shearometer (Fig. 2.4). The shearometer is more commonly used in con
struction. The shear strength is determined both initially and after a 10 min
ute interval. When using a shearometer, the initial shear strength is
determined by filling a container to the bottom line on the scale with freshly
agitated slurry. A thin metal tube is then lowered over the scale to the slurry
surface and released. The tube is allowed to settle for one minute, at which
time the shear strength is recorded as the scale reading at the top of the tube.
The 10-minute gel strength is determined in the same manner, except that the
slurry is allowed to sit in the container for 10 minutes before the tube is low
ered.
Viscosity. Viscosity is determined primarily by the amount of bentonite
that is present and by the thoroughness of mixing. Contamination of the slurry
will also influence viscosity. The viscosity, like shear strength, is a meas
ure of the thixotropic properties of the slurry. As the viscosity increases,
the ability of the slurry to hold detritus in suspension increases. However,
if the viscosity is too great, the slurry will not flow easily. This would hin
der circulation as well as hinder displacement by the concrete. In addition,
the slurry might collect on the reinforcement rather than flow around it.
Viscosity of the slurry can be determined either by a direct-indicating
viscometer or by a Marsh funnel (Fig. 2.5). The Marsh funnel is the device most
commonly used method in construction. The test is performed by placing a fin
ger over the tip of the tube from the funnel and filling the funnel with slurry.
When filling the funnel, the slurry should be poured through the screen at the
top of the funnel, and the funnel should be filled to the bottom of the screen.
The slurry is allowed to flow and the number of seconds required for a quart of

18
Fig. 2.4. Shearometer.
Fig. 2,5. Marsh funnel.

19
slurry to drain from the funnel is recorded. This measure of time, in seconds,
is the viscosity.
Specifications
The above properties can have a wide range of values and in a variety of
combinations. The effectiveness of a slurry is determined by the combination
of these properties. Because the properties should fall within a range of val
ues, specifications are needed to ensure the effectiveness of a slurry. Vari
ous organizations and individuals have developed slurry specifications. A few
of these are presented in Chapter 6.
CHAPTER 3. LABORATORY INVESTIGATIONS
Considerations
Laboratory investigations were conducted in which filter-cake growth was
observed and the resulting filter cake was analyzed. The purpose of the test
ing was to gain an understanding of filter-cake development and filter-cake
properties as a basis for field investigations. The laboratory investigations
were two phase. The first phase of the investigations consisted of filter-cake
development on a compacted-sand sample and water-content analysis of the filter
cake. Factors i nfl uenci ng fil ter-cake growth were vari ed to determi ne the
impact of the factors on filter-cake development. These factors include slurry
composition, development time, applied pressure, and initial water content of
the sample. The second phase of the investigation consisted of vane-shear
tests in the laboratory on sedimented samples of slurry. The samples were of
various water contents to allow the determination of the variation of shear
strength of the filter cake with water content.
Filter-Cake Growth
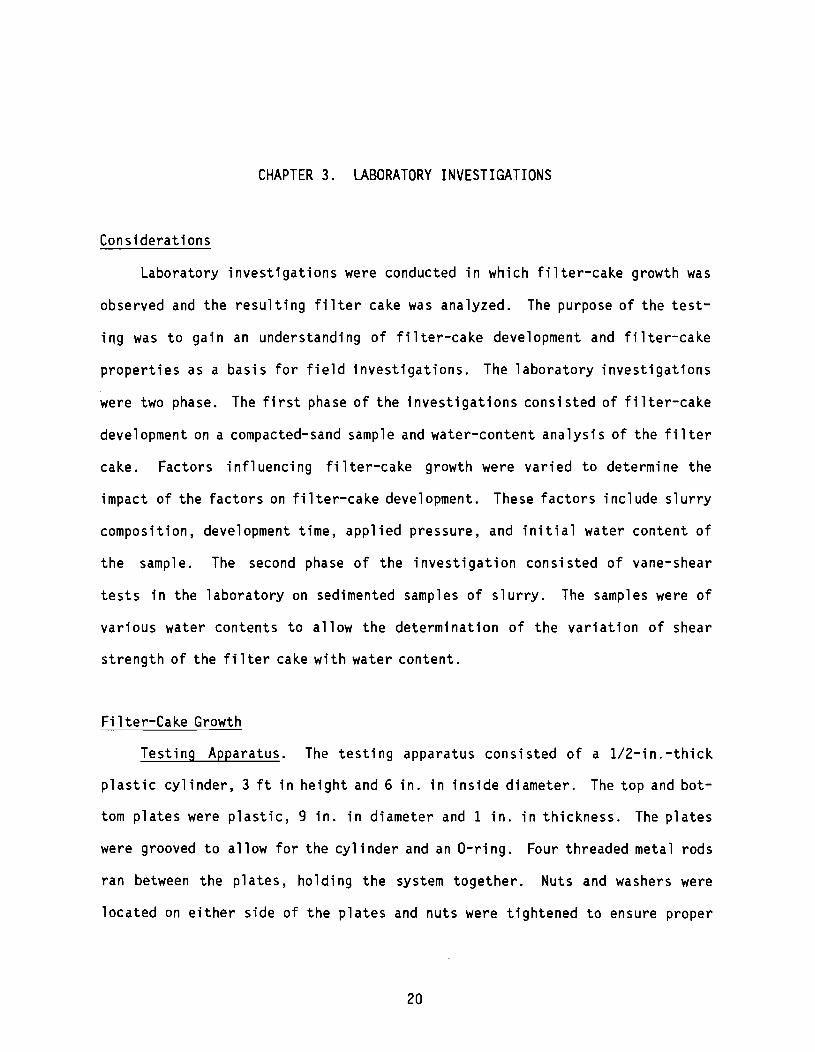
Testing Apparatus. The testing apparatus consisted of a 1/2-in.-thick
plastic cylinder, 3 ft in height and 6 in. in inside diameter. The top and bot
tom plates were plastic, 9 in. in diameter and 1 in. in thickness. The plates
were grooved to allow for the cylinder and an O-ring. Four threaded metal rods
ran between the plates, holding the system together. Nuts and washers were
located on either side of the plates and nuts were tightened to ensure proper
20
21
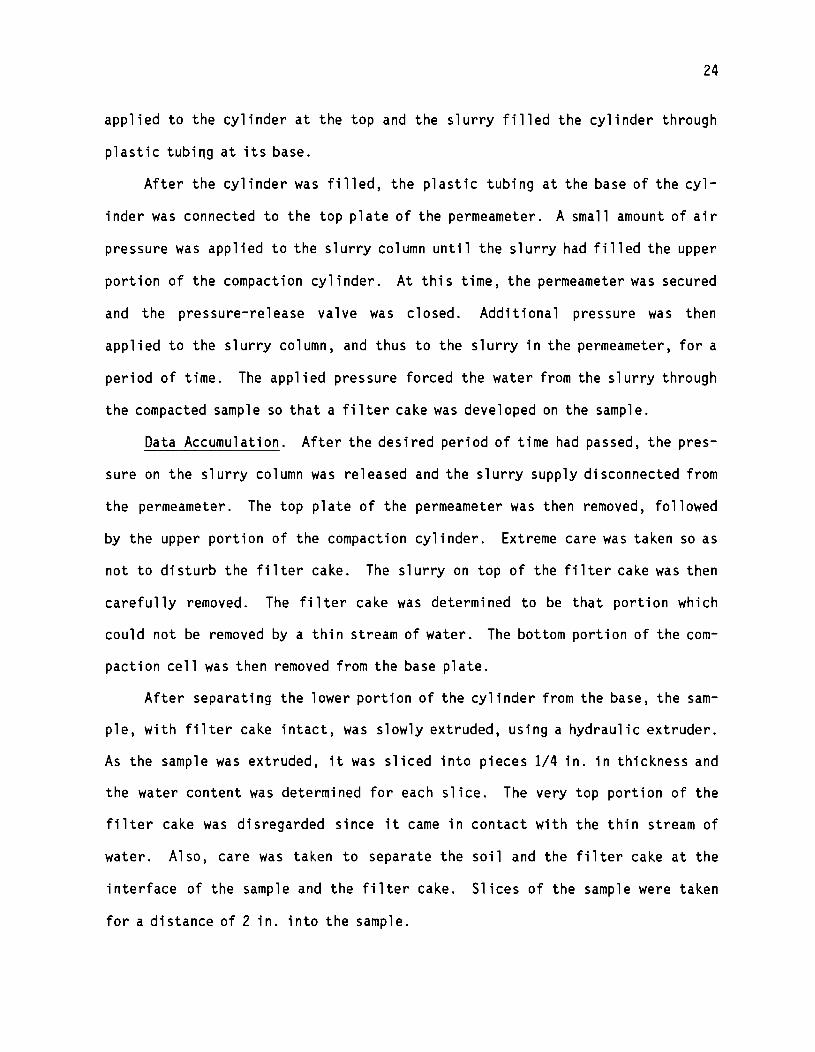
sealing of the system. Air pressure was supplied to the system by plastic
tubing connected to the top plate. Plastic tubing connected the base plate of
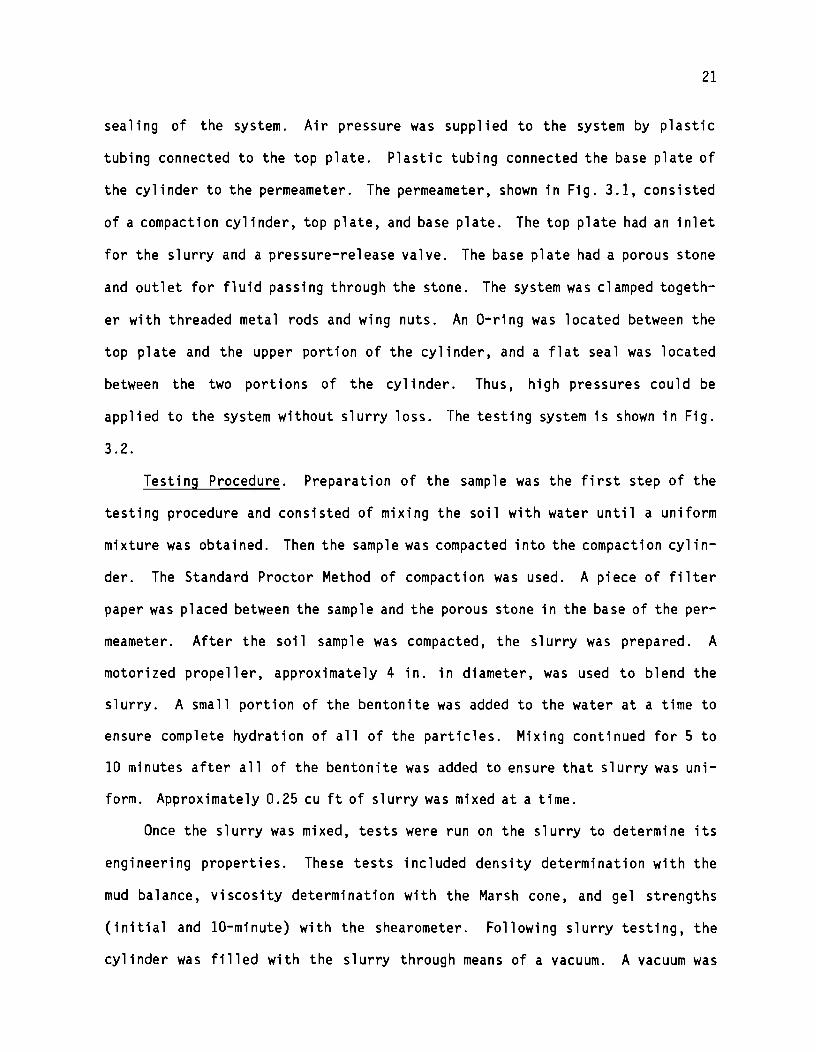
the cylinder to the permeameter. The permeameter, shown in Fig. 3.1, consisted
of a compaction cylinder, top plate, and base plate. The top plate had an inlet
for the slurry and a pressure-release valve. The base plate had a porous stone
and outlet for fluid passing through the stone. The system was clamped togeth
er with threaded metal rods and wing nuts. An O-ring was located between the
top plate and the upper portion of the cylinder, and a flat seal was located
between the two portions of the cylinder. Thus, high pressures could be
applied to the system without slurry loss. The testing system is shown in Fig.
3.2.
Testing Procedure. Preparation of the sample was the first step of the
testing procedure and consisted of mixing the soil with water until a uniform
mixture was obtained. Then the sample was compacted into the compaction cylin
der. The Standard Proctor Method of compaction was used. A piece of filter
paper was placed between the sample and the porous stone in the base of the per
meameter. After the soil sample was compacted, the slurry was prepared. A
motorized propeller, approximately 4 in. in diameter, was used to blend the
slurry. A small portion of the bentonite was added to the water at a time to
ensure complete hydration of all of the particles. Mixing continued for 5 to
10 minutes after all of the bentonite was added to ensure that slurry was uni
form. Approximately 0.25 cu ft of slurry was mixed at a time.
Once the slurry was mixed, tests were run on the slurry to determine its
engineering properties. These tests included density determination with the
mud balance, viscosity determination with the Marsh cone, and gel strengths
(initial and 10-minute) with the shearometer. Following slurry testing, the
cylinder was filled with the slurry through means of a vacuum. A vacuum was

From SlUrry,
Fi g. 3.1. Permeal7leter.
---
22
Porous Stone

o
-CD C
CD ~
~ fI) fI)
CD ~
n. ~
~
CD -I) E o CD E ~ I)
n.
23
ID +> III >, III
Cl C
or-
+> III (!)
t-
N
M
0) or-l.L.
24
applied to the cylinder at the top and the slurry filled the cylinder through
plastic tubing at its base.
After the cylinder was filled, the plastic tubing at the base of the cyl
inder was connected to the top plate of the permeameter. A small amount of air
pressure was applied to the slurry column until the slurry had filled the upper
portion of the compaction cylinder. At this time, the permeameter was secured
and the pressure-release valve was closed. Additional pressure was then
applied to the slurry column, and thus to the slurry in the permeameter, for a
period of time. The applied pressure forced the water from the slurry through
the compacted sample so that a filter cake was developed on the sample.
Data Accumulation. After the desired period of time had passed, the pres
sure on the slurry column was released and the slurry supply disconnected from
the permeameter. The top plate of the permeameter was then removed, followed
by the upper portion of the compaction cylinder. Extreme care was taken so as
not to disturb the filter cake. The slurry on top of the filter cake was then
carefully removed. The filter cake was determined to be that portion which
could not be removed by a thin stream of water. The bottom portion of the com
paction cell was then removed from the base plate.
After separating the lower portion of the cylinder from the base, the sam
ple, with filter cake intact, was slowly extruded, using a hydraulic extruder.
As the sample was extruded, it was sliced into pieces 1/4 in. in thickness and
the water content was determined for each slice. The very top portion of the
filter cake was disregarded since it came in contact with the thin stream of
water. Also, care was taken to separate the soil and the filter cake at the
interface of the sample and the filter cake. Slices of the sample were taken
for a distance of 2 in. into the sample.
25
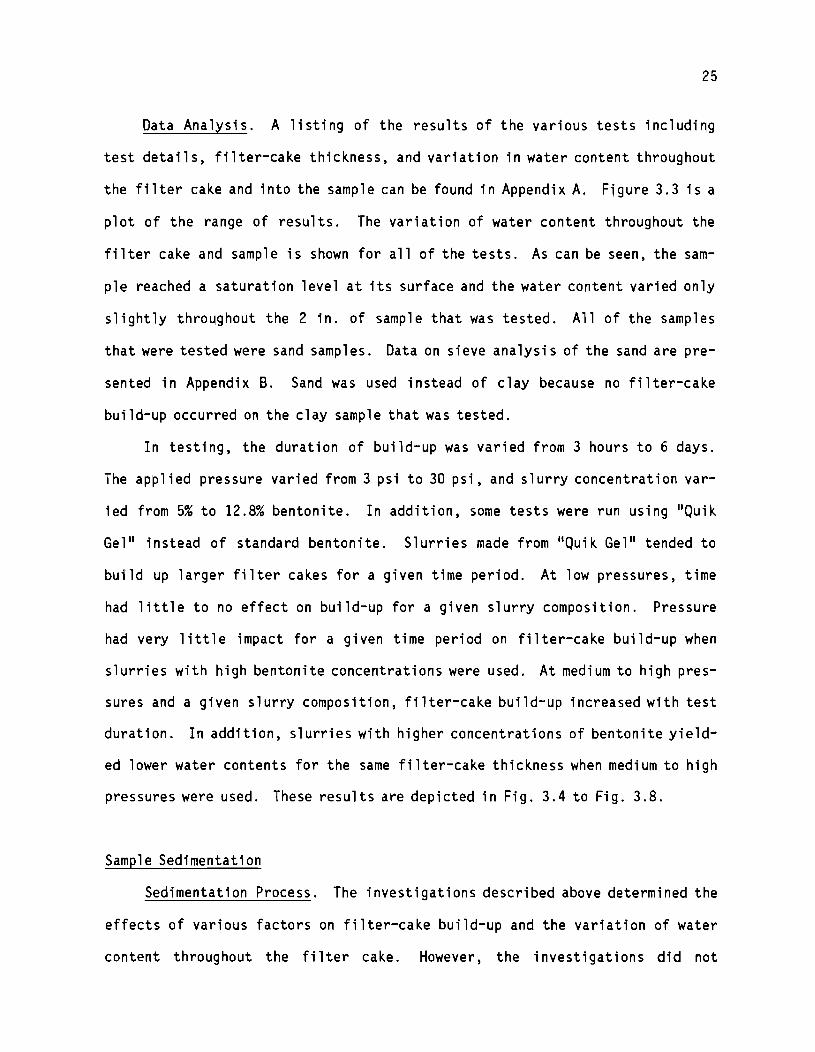
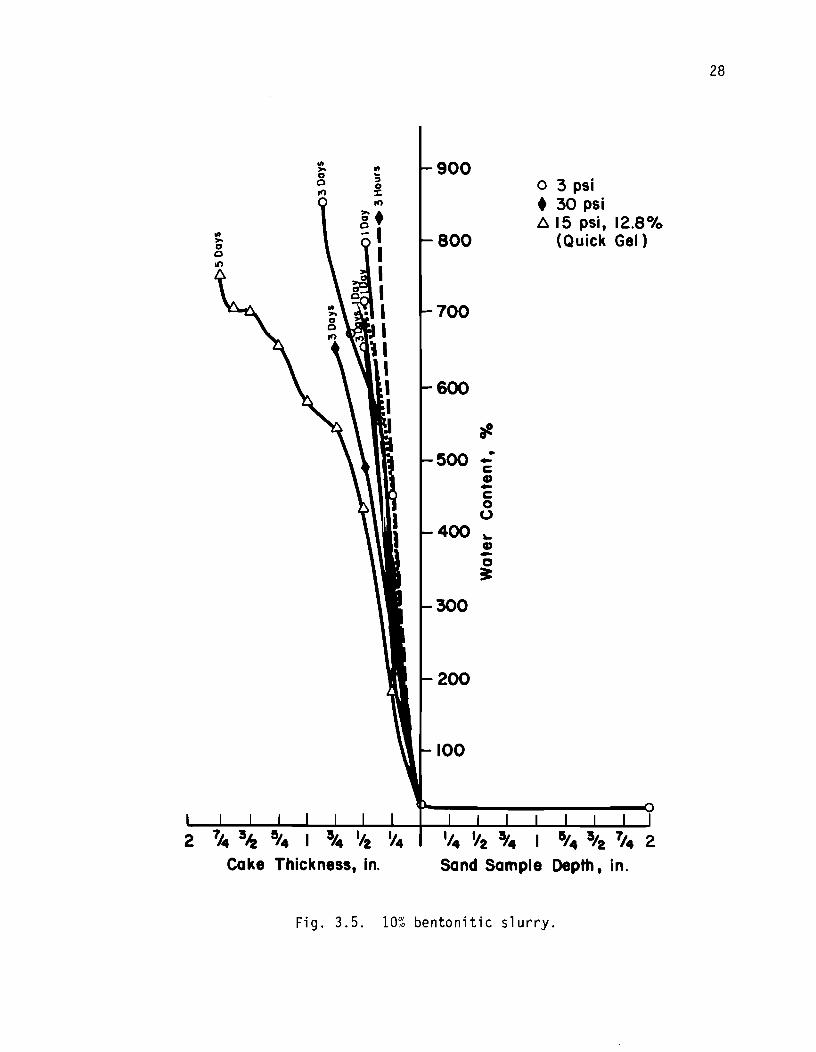
Data Analysis. A listing of the results of the various tests including
test details, filter-cake thickness, and variation in water content throughout
the filter cake and into the sample can be found in Appendix A. Figure 3.3 is a
plot of the range of results. The variation of water content throughout the
filter cake and sample is shown for all of the tests. As can be seen, the sam
ple reached a saturation level at its surface and the water content varied only
slightly throughout the 2 in. of sample that was tested. All of the samples
that were tested were sand samples. Data on sieve analysis of the sand are pre
sented in Appendix B. Sand was used instead of clay because no filter-cake
build-up occurred on the clay sample that was tested.
In testing, the duration of bUild-up was varied from 3 hours to 6 days.
The applied pressure varied from 3 psi to 30 psi, and slurry concentration var
ied from 5% to 12.8% bentonite. In addition, some tests were run using "Quik
Gel" instead of standard bentonite. Slurries made from "Quik Gel" tended to
build up larger filter cakes for a given time period. At low pressures, time
had little to no effect on build-up for a given slurry composition. Pressure
had very little impact for a given time period on filter-cake build-up when
slurries with high bentonite concentrations were used. At medium to high pres
sures and a given slurry composition, filter-cake bUild-up increased with test
duration. In addition, slurries with higher concentrations of bentonite yield
ed lower water contents for the same filter-cake thickness when medium to high
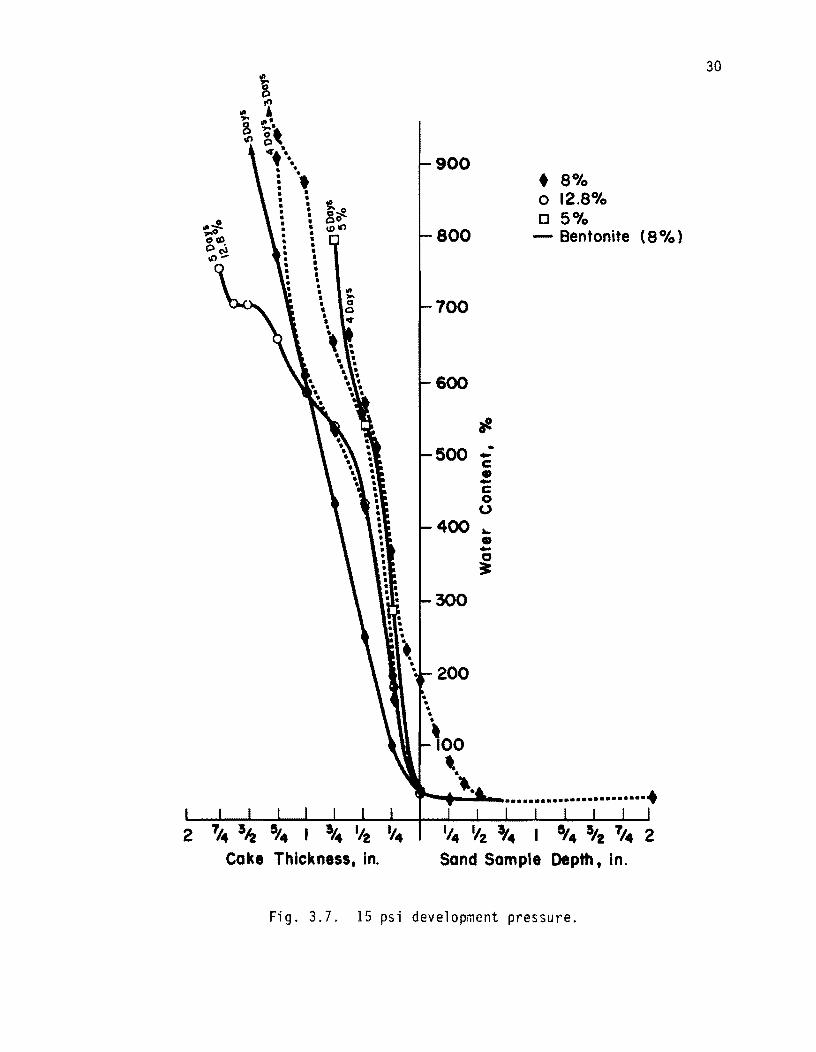
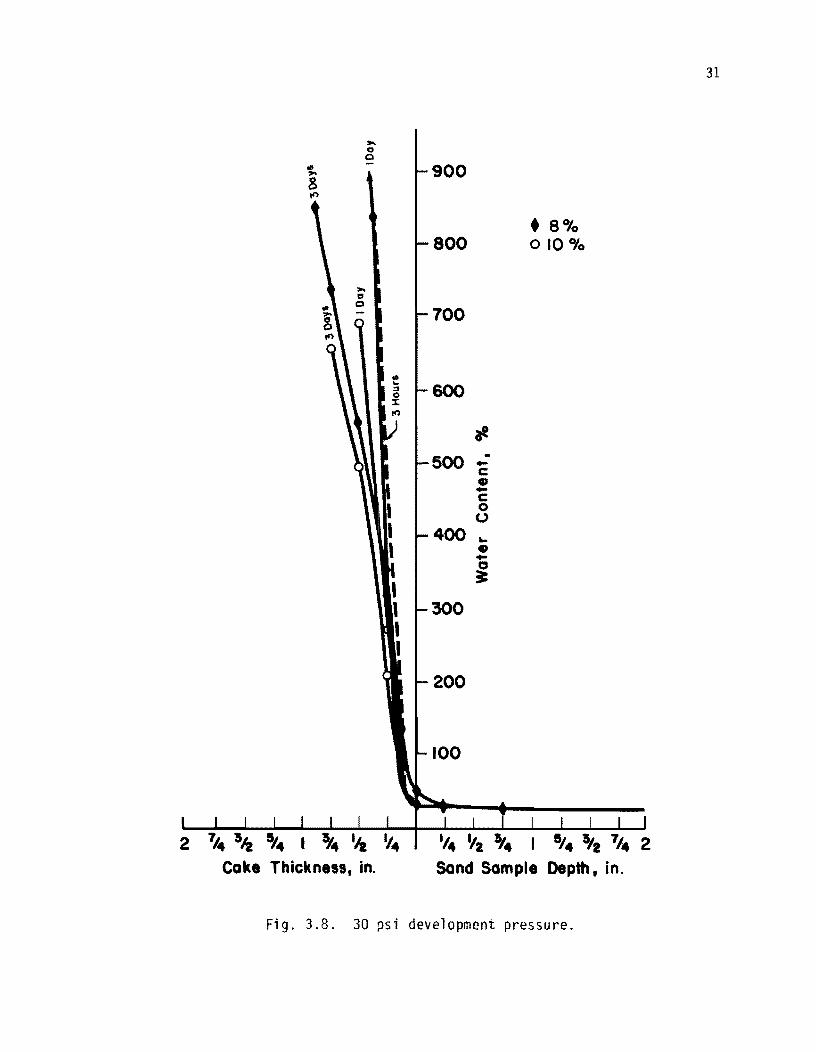
pressures were used. These results are depicted in Fig. 3.4 to Fig. 3.8.
Sample Sedimentation
Sedimentation Process. The investigations described above determined the
effects of various factors on filter-cake build-up and the variation of water
content throughout the filter cake. However, the investigations did not

Range of Results
2 Cake Th~kness, I~
Y.
900
800
700
600
it 500 .:
c • -c o o
400 ... • -o ~
300
200
100
1/. Y2 'I. I 5/. '/2 7/4 2 Sand Sample Depth, in.
Fig. 3.3. Water content vs. filter-cake thickness.
26

III >..
III 0 >.. 0 8 It') 10
>.. o o
2 7/4 5-'l 5/4 I 5/4 I/Z '14
Cake Thickness, in.
900
• 30 psi 6 15 psi
800 -Quick Gel
700
600
~
500 .: c • -c o o
400 ... • -o :t
300
1/4 1/2 5J4 I 5/4 5/2 7/4 2
Sand Sample Depth, in.
Fig. 3.4. 8% bentonitic slurry.
27
'" ~ £ 10
~. ~ I
I I I I I I I I
2 7/4 5~ 5/4 I 5/4 liz '14
Cake Thickness, in.
900
800
700
600
~
500 .: ~ 4) -~ o o
400 ~ CD -a ~
300
200
100
o 3 psi • 30 psi ~ 15 psi, 12.8%
(Quick Gel)
1/4 '12 5/4 I 2
Sand Sample Depth, in.
Fig. 3.5. 10% bentonitic slurry.
28

900
800
700
600
~
500 .: c • -c o o
400 '•
I 300 I
100
-o ~
• Fresh Slurry
o Day Old Slurry
All Tests with 10°/0 Slurry
2 7/.. 5~ 51.. I 51.. liz 'I .. II .. 1/2 51.. I 15/ .. 5/2 7/4 2 Sand Sample Depth, in. Cake Thickness, in.
Fig. 3.6. 3 psi development pressure.
29
30
900 • 8°10 o 12.8°/0 o 5°10
800 - Bentonite (8 °/0)
700
600
.,. 500
.. -c ., -c 0 (,)
400 ... • -0 ~
300
200
2 1/4 lIz 2 Cake Thickness, in. Sand Sample Depth tin.
Fig. 3.7. 15 psi development pressure.
,.. o o
, , , I
2 7/4 5~ '14 I 5/4 liz 1t4 Coke Thickness, in.
900
• 8°10 800 0 10 OJo
700
600
ill 500 .: c • -c
o o
400 ... • -o ~
300
1/4 '12 st4 I 8'4 5/2 7/4 2 Sand Sample Depth. in.
Fig. 3.8. 30 psi development pressure.
31

32
provide any information regarding the variation in strength throughout the
filter cake. Such testing was not feasible due to the non-uniform nature of
the build-up. Hence, a uniform filter-cake sample was required to determine
strength characteri st i cs. Uniform samples were produced through sedi menta
tion.
A sedimented sample was produced by application of pressure to a column of
slurry, with porous stones and filter paper at top and bottom, so that water
passed out of the slurry, leaving the bentonitic particles behind. The sedi
mentation tubes were of plastic, 1 112 in. in inside diameter and 12 in. in
height. The top and base plates were plastic, connected by threaded metal
rods, and grooved to accommodate the tube. An O-ring was located in the groove
of the base plate, and the system was sealed by the tightening of nuts located
above the top plate. The base plate was inset with a porous stone and contained
a horizontal tube leading from the stone to the exterior, so that water could
pass through the stone and out of the base. The top plate contained a hole, 1
in. in diameter, to allow for the piston. The piston fit snugly inside the tube
and contained a porous stone, above which were small holes to allow the water
to pass through. A collar around the piston rod fit into the top plate and held
the piston erect. The top of the piston rod was connected to a flat plate on
which weights were set. Thus, pressure was applied to the slurry through the
addition of weight to the piston.
The initial step of the sedimentation process was to mix the slurry. The
slurry was mixed in small amounts, about 500 ml at a time. Care was taken to
ensure optimal hydration of the bentonitic particles. Slurries of concen
tration of 10 percent were generally used. Slurries of lower concentration
contained a large amount of water, while those of higher concentration were
extremely viscous, presenting problems in filling the sedimentation tube. When

33
filling the tube, care was taken not to trap any air in the slurry column, thus
a fairly fluid slurry was better than a viscous slurry. Initially a vacuum was
applied to the slurry before filling the tube in an effort to remove entrapped
air. However, due to the thixotropic nature of the slurry, virtually no air
was removed by the process and filling of the tube was more difficult due to the
more viscous nature of the slurry that resulted from the period of time between
mixing and filling the tube. Because only a minimal amount of entrapped air
was present in the slurry, the effort to remove the air before filling the tube
was abandoned.
The sedimentation tube was filled by slowly pouring the slurry into the
tube. The tube was tilted and the slurry forced to run down the side of the
tube in a thin, continuous stream to avoid entrapping air. The tube was filled
approximately one-half to two-thirds full. The piston, coated with vacuum
grease, was inserted and an initial pressure of 1 psi was applied. The pres
sure was slowly increased to 15 psi, and in some cases to 20 psi, over a period
of about 3 days. The slurry remained under pressure for periods ranging from 1
to 6 weeks, so that various water contents were attained. The sedimented sam
ples ranged in height from 2 in. to 4 in., depending on the initial height of
the slurry column and on the sedimentation time.
Testing Procedure. The sedimented sample was extruded slowly and sliced
into l-in.-thick pieces. Each portion was transferred to a mold and the shear
strength was measured by use of a laboratory vane-shear device. The water con
tent of the soil was then determined. Extreme care was taken while extruding
and handling the sample so as not to fail or disturb the sample.
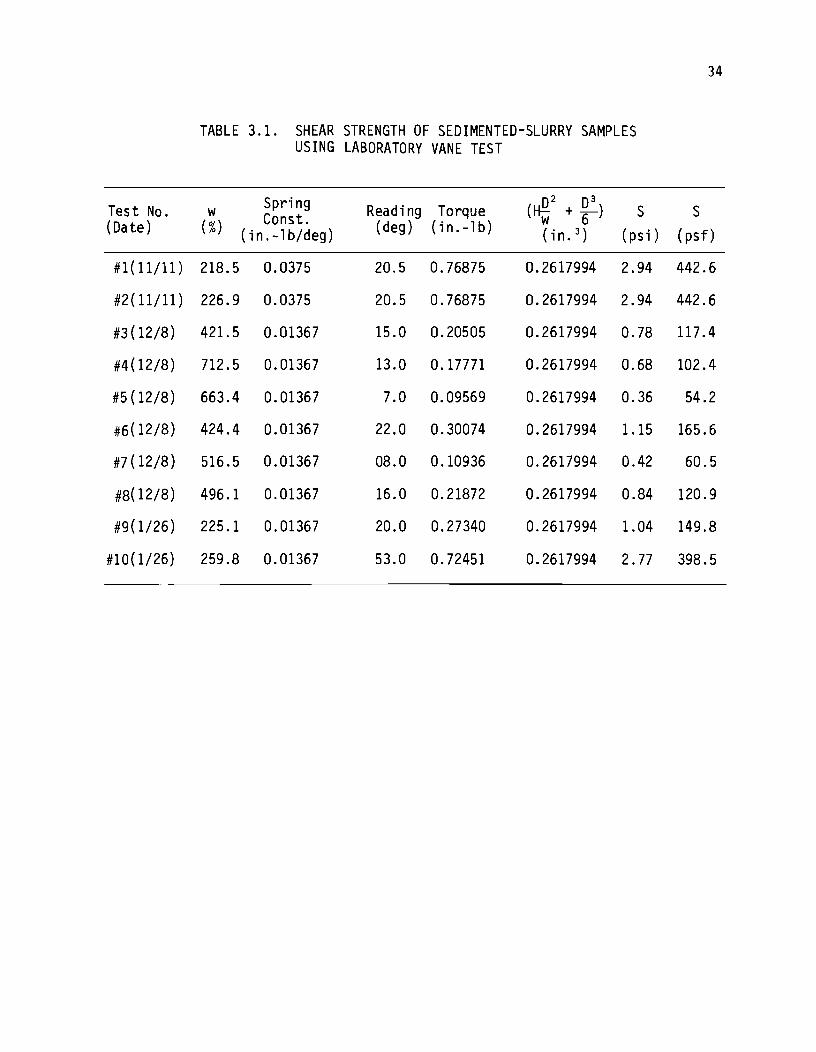
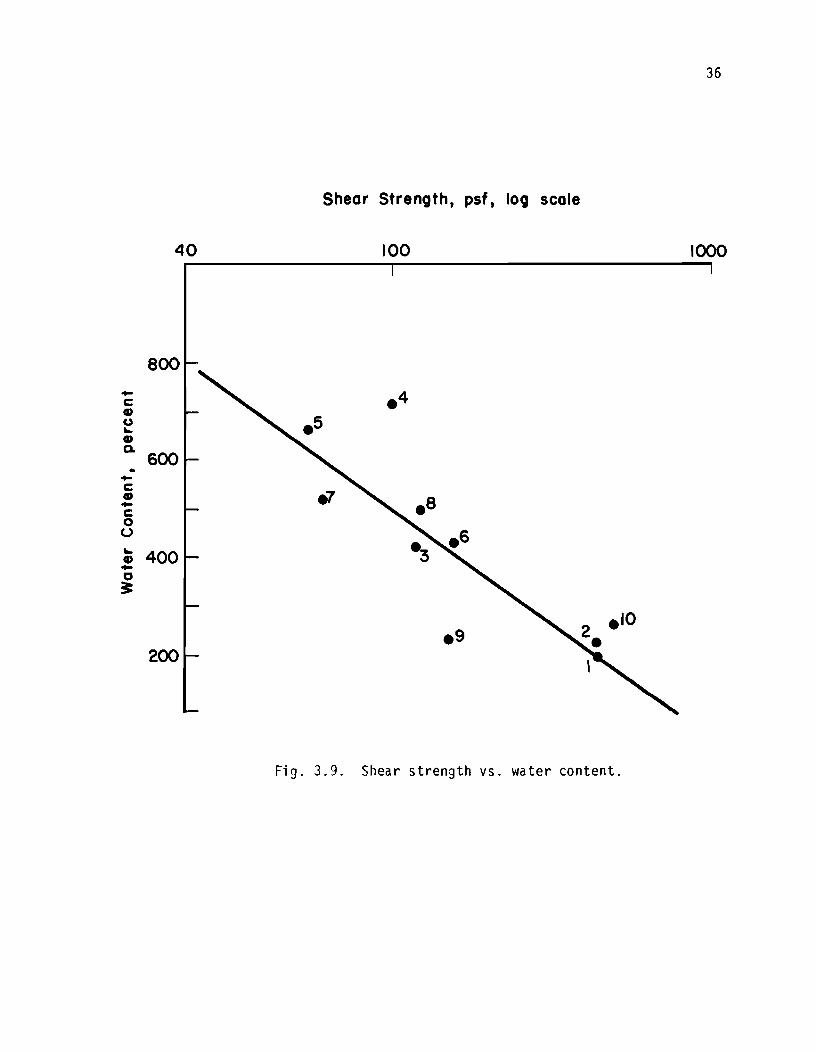
Data Analysis. Results of the soil testing are shown in Table 3.1 and are
depicted in Fig. 3.9. The lowest water content that was attained by the sedi
mentation process, after the loading was maintained for six weeks, was over
Test No. (Date)
#1(11/11)
#2(11/11)
#3 (12/8)
#4(12/8)
#5 (12/8)
#6(12/8)
#7(12/8)
#8(12/8)
#9(1/26)
#10(1/26)
TABLE 3.1. SHEAR STRENGTH OF SEDIMENTED-SLURRY SAMPLES USING LABORATORY VANE TEST
w Spr-i ng Reading Torque (HQ2 + ~) S ( %) Const. (deg) (in.-lb) w 6
(in.-lb/deg) (in. 3 ) ( psi)
218.5 0.0375 20.5 0.76875 0.2617994 2.94
226.9 0.0375 20.5 0.76875 0.2617994 2.94
421.5 0.01367 15.0 0.20505 0.2617994 0.78
712.5 0.01367 13.0 0.17771 0.2617994 0.68
663.4 0.01367 7.0 0.09569 0.2617994 0.36
424.4 0.01367 22.0 0.30074 0.2617994 1.15
516.5 0.01367 08.0 0.10936 0.2617994 0.42
496.1 0.01367 16.0 0.21872 0.2617994 0.84
225.1 0.01367 20.0 0.27340 0.2617994 1.04
259.8 0.01367 53.0 0.72451 0.2617994 2.77
34
S (psf)
442.6
442.6
117.4
102.4
54.2
165.6
60.5
120.9
149.8
398.5
35
200%. The water content of the fi 1 ter cake at the surface of the soi 1 wi 11
perhaps be less than that.
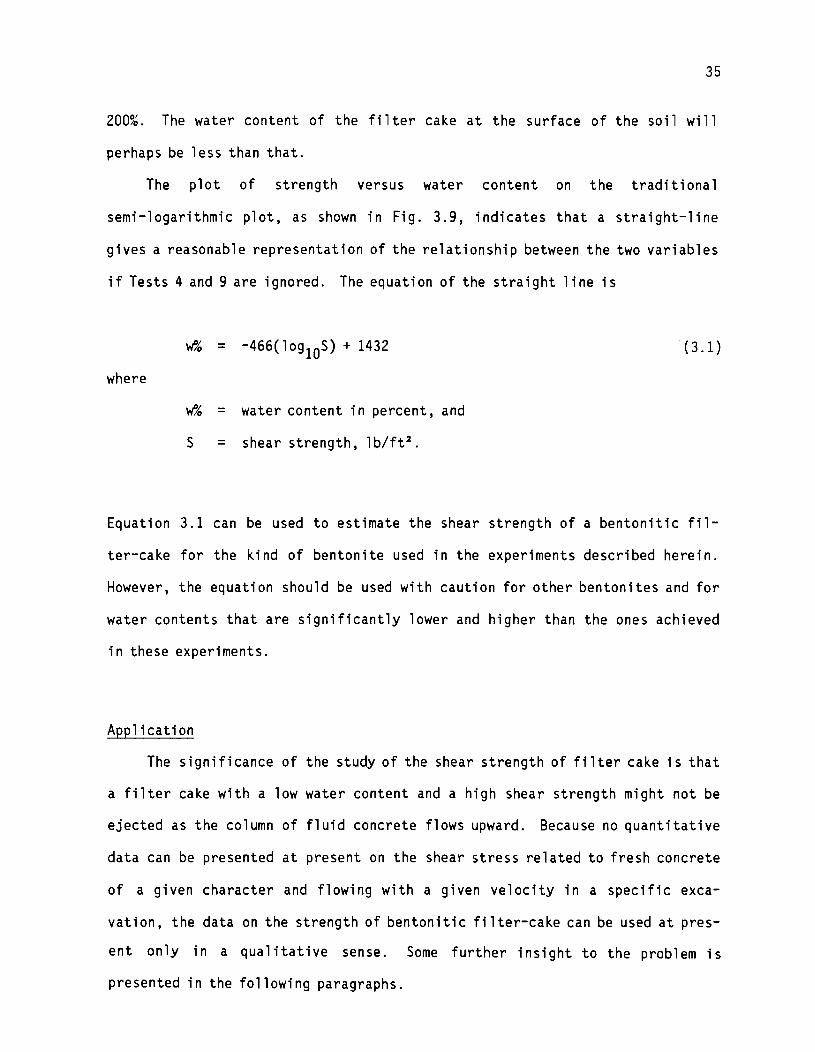
The plot of strength versus water content on the tradit i ona 1
semi-logarithmic plot, as shown in Fig. 3.9, indicates that a straight-line
gives a reasonable representation of the relationship between the two variables
if Tests 4 and 9 are ignored. The equation of the straight line is
where
w% = -466(10g10S) + 1432
w% = water content in percent, and
5 = shear strength, 1b/ft2.
(3.1)
Equation 3.1 can be used to estimate the shear strength of a bentonitic fil
ter-cake for the kind of bentonite used in the experiments described herein.
However, the equation should be used with caution for other bentonites and for
water contents that are significantly lower and higher than the ones achieved
in these experiments.
Application
The significance of the study of the shear strength of filter cake is that
a filter cake with a low water content and a high shear strength might not be
ejected as the column of fluid concrete flows upward. Because no quantitative
data can be presented at present on the shear stress related to fresh concrete
of a given character and flowing with a given velocity in a specific exca
vation, the data on the strength of bentonitic filter-cake can be used at pres
ent only in a qualitative sense. Some further insight to the problem is
presented in the following paragraphs.
36
Shear Strength, psf, log scole
40 100 1000
800
-c ., () ~ ., Q.
600 .. -c ., -c 0 0 ~ 400 CD -C ~
200
Fig. 3.9. Shear strength vs. water content.
37
With regard to the nature of the flow of concrete, Tattersall (1976) and
others are of the opinion that fresh concrete can be represented as a Bingham
fluid where:
t = to + II dv/dx (3.2)
where
t = shear stress in the concrete
to = yield stress in the concrete
II = plastic viscosity of concrete
dv/dx = shear.
Popovics (1982) states that there is no reliable method for the determination
of to and ll, and numerical values for the parameters are not frequently quoted.
However, Fleming and Sliwinski (1977) suggest that values of to are in the
range of 5 to 20 lb/sq ft and go on to say that they expect the upward flowing
concrete to scour the filter cake from the walls of vertical boreholes.
Recent studies (Bernal and Reese, 1984) give information on the lateral
stress from fresh concrete on the sides of a borehole. The studies showed that
higher lateral stress came from concrete with higher slump. The shearing
stress from the upward-flowing concrete should assuredly depend on this lateral
stress as well as on the concrete properties and the velocity of the upward
flow.
Additional research can lead to methods of developing the shearing stress
against the sides of an excavation from the concrete column as the concrete
flows upward. Information from such research can allow an engineer to make
compu~ations as to whether or not a particular filter cake could be removed
from a borehole by concrete with particular characteristics.

38
In the absence of a specific analytical technique the recommendations
given later should provide sufficient guidance in order to achieve good con
struction with the slurry-displacement method.
CHAPTER 4. DEVELOPMENT OF SIDE-WALL SAMPLER AND CALIPERS
Objective
The first portion of this study consisted of laboratory work. The second
portion consisted of field work which could be compared with the laboratory
work and could serve as a basis for recommendations concerning slur
ry-construction of drilled shafts. The thrust of the field work was similar to
that of the laboratory work, monitoring filter-cake build-up and the properties
of the filter cake. In order to monitor filter-cake build-up, a tool was need
ed which would sample the soil-slurry interface at depth. A side-wall sampler
was developed for this purpose.
Considerations
Sampling at Depth. When developing the side-wall sampler, consideration
was given to the circumstances under which it would be used. The sample would
be taken at depth from the wall of an excavation filled with bentonitic slurry.
Thus, the sampler could not be seen or reached and would function horizontally,
not vertically, during sampling. These circumstances imposed several require
ments on the sampling system. The depth at which the sample was being taken
should be known, every caution should be taken to ensure that the sampler did
not become stuck or lodged during lowering, sampling, and removing, and the
sampler must be controlled from ground level. More specifically, the sampler
had to be able to extend and sample, and then retract the sample, all on a hori
zontal plane, with control being above ground. To ensure that the sampler
39
40
would not become lodged, it should maintain a horizontal position throughout
lowering, sampling and removing, and should remain centered during lowering and
removing. Some means was required to ensure that the sampling tube did not
become embedded to a point where it could not be removed.
Sample Retrieval. Because the sample was obtained on a horizontal plane
rather than on a vertical plane, it would be difficult to twist the sampling
tube in order to shear the end of the sample. Hence, some means of retaining
the sample during retraction of the sampling tube was required. Also, the
slurry in the sampling tube must be provided with an escape route to make room
for the sample as the tube was forced into the shaft wall.
Versatility. With the requirements that the sampler be centered, that it
not lodge, nor become stuck during sampling, it appeared that a guide would be
useful to center the sampler and keep it from lodging. Such a guide would need
to be close in size to the diameter of the shaft. Not all shafts, however, are
the same size. Thus, it was desired that whatever type of guide and sampler
were decided upon, they should be adjustable to be able to sample a variety of
shaft sizes.
Sampler Specifics
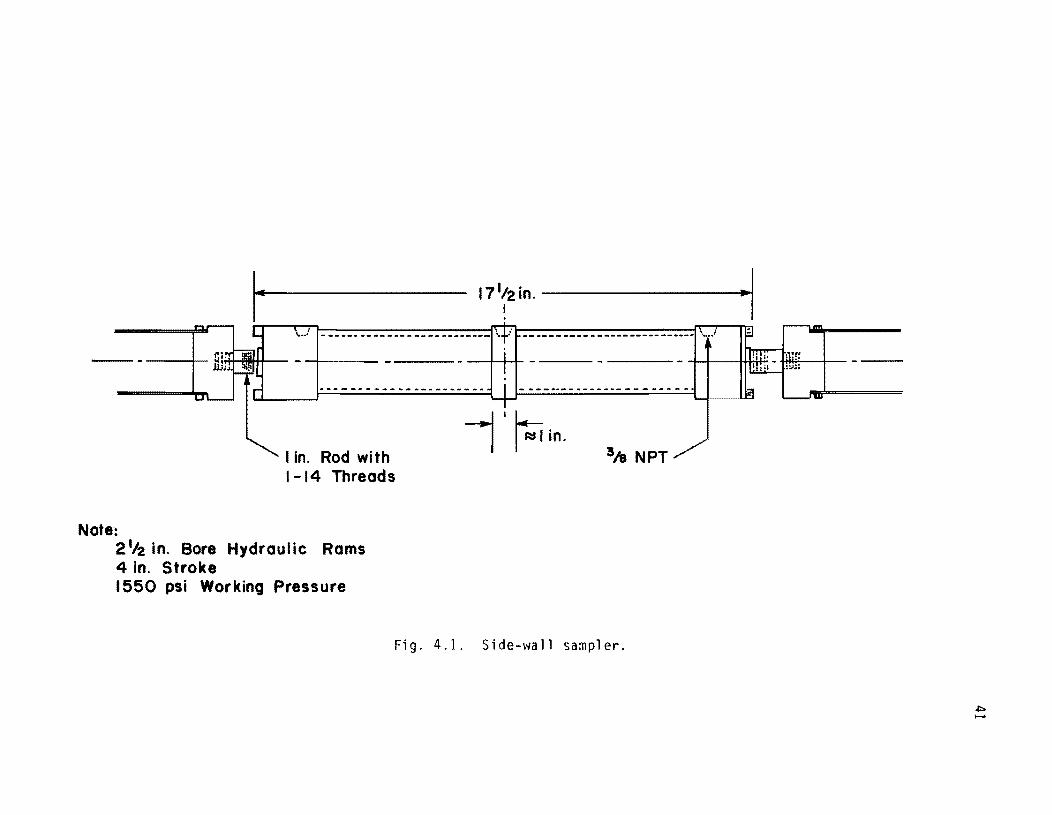
Hydraulic Cylinders. Two double-acting hydraulic cylinders were used for
the body of the sampler. Two cylinders were used so that two samples could be
obtained at one time. The two cylinders were mounted end to end to balance the
forces developed when the system was activated. Thus, the cylinders remained
centered and did not twist. The sampler is shown in Fig. 4.1. Each cylinder
was 8 3/4 in. long, with a 2 112 in. bore, and with a 4 in. stroke. Each cylin
der had a 3.7 ton capacity in extension and 3.1 ton capacity in retraction.
L 171~in. .1 . I .. :'l- _________________________ 1'\:1/l _______________________ u __ r··~.}
---- ------. - ----------W - . --.---. -. -. --- - - ---- -"I
Note:
I in. Rod with 1-14 Threads
2112 in. Bore Hydraulic Rams 4 in. Stroke 1550 psi Working Pressure
-1' 1~lln. 3/8 NPT
Fig. 4.1. Side-wall sampler.
"'" .....
42
Sampling Tubes. Three-in. diameter She"lby tubes, 4 1/2 in. in length were
used as sampling tubes. The tubes were mounted to a base as shown in Fig. 4.2.
The tubes were attached using four screws. The base had four holes drilled
thro~gh it to allow the slurry to escape. The base was then attached to the
piston by means of a threaded connection. The sampling tubes contained a bas
ket retainer, as shown in Fig. 4.3, to secure the sample in retraction.
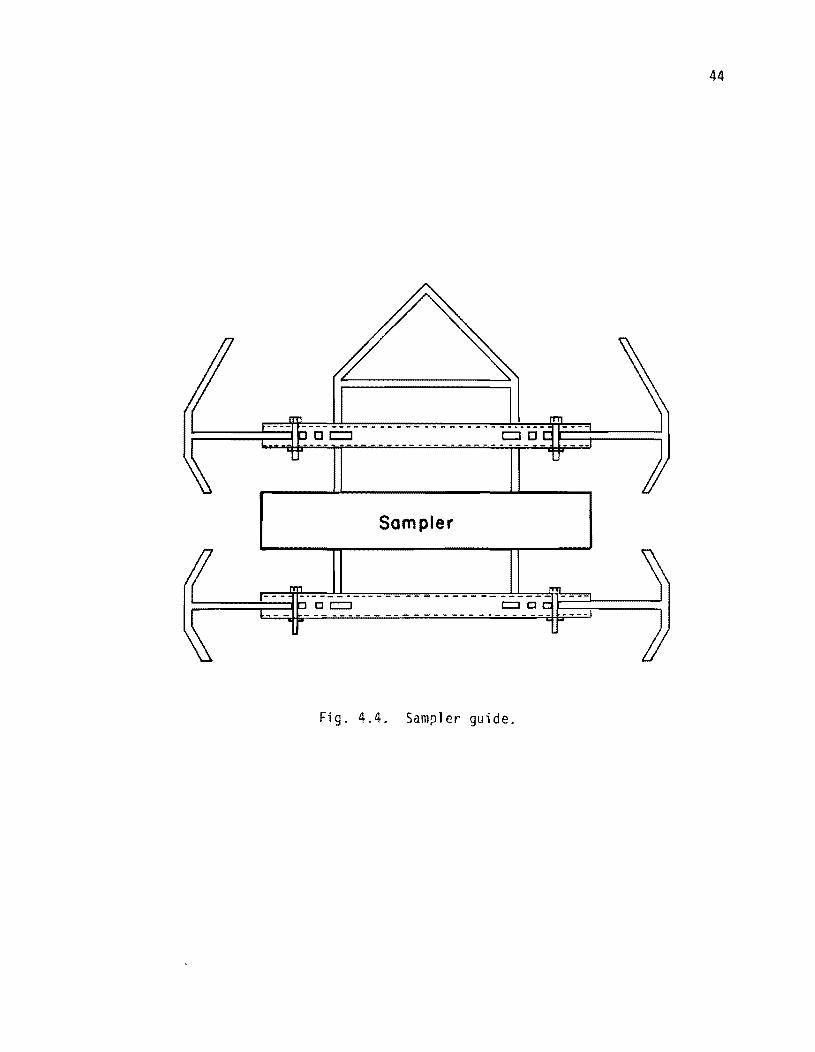
Guide. The guide for the sampler is shown in Fig. 4.4. The bearing plates
were 4 in. in width and 6 in. in length. The plates were angled on the ends to
keep them from hanging up as they were lowered or raised. Bearing plates
extended 1/2 in. past the sampling tubes so that the tubes did not come in con
tact with the wall until the system was activated. The bearing plates kept the
cylinders centered in the shaft so that the sampling tubes did not get stuck in
the shaft wall. The bearing plates were attached to a metal rod which fit
inside a metal tube. The rod was held in place by a bolt and was bored every
inch so that it could be adjusted for various shaft diameters. The sampler
length was adjusted by adding spacers between the cylinder and sampler-tube
base.
Frame and Pump. The sampler was raised and lowered by means of a cable
attached to a manual winch. The cable was plastic coated and 140 ft in length.
The cable coating was scored every 5 feet. The cut in the coating was then
filled with paint. A system was used for marking the cable so that the depth of
the sampler was known.
Trial Test
In March of 1983, the sampling system was tested in the yard of Farmer
Foundation Company in Houston, Texas. The test shaft was 30 in. in diameter
and 10 ft in depth. The soil was a stiff clay. No problems were encountered in

Spacer
Slurry Escape
----- ---
Holes Shelby Tube
Fig. 4.2. Sampling tube.
Fig. 4.3. Basket retainer.
43
44
Sampler
Fig. 4.4. Sampler guide.
45
testing the system. The guide kept the sampler centered, allowing for sampling
and removal of the sampling tubes. Due to the nature of the soil, removal of
the samples from the tubes by hand was difficult. Thus, the need was recog
nized for a mechanical extruder in the field.
Calipers
Objective. The need for calipers arose when some difficulty, which will
be addressed in the next chapter, was encountered in lowering the sampler dur
ing testing at Lavaca Bay. As a result, determination of the variation in the
diameter of the shaft along its length was necessary for proper sizing of the
guide and sampler. The uniformity in the diameter of the excavation could be
determined, allowing the detection of any caving or expansion of the soil.
Configuration. The calipers developed had four legs, 3 ft in length, and
of 1 1I4-in.-square aluminum tubing. A lightweight lawn mower wheel was
attached to each leg. The legs were attached to the four sides of a 7-ft-long,
2-in.-square aluminum tube. Screen-door springs ran from the legs to the
square tubing, such that when the legs were vertical, the springs were fully
extended. The calipers are shown in Fig. 4.5. The legs were held in place by a
strap which could be released easily once the calipers were lowered. When the
strap was released, the legs moved out from the tubing until they came in con
tact wi th the sha ft wa 11. The ca 1 i pers were ra i sed and lowered by the wi nch and
cable used in raising and lowering the sampler.
Diameter Determination. The configuration of the legs of the calipers
allowed the diameter of the shaft to be determined in two complementary
directions at one time. Two variable resistors, each with a lO,OOO-ohm rating,
were utilized in determining the shaft diameter. A four-conductor cable ran
between the battery, the variable resistors, and the voltmeter. The calipers
46
4 COnductor Cables
2-in. Square Metal Tubing
1"4 in. Square Metal Tubing
Fig. 4.5. Calipers.

47
were callibrated such that the voltage reading corresponded to the position of
the legs, and, thus, the shaft diameter. Two readings were taken at each level
so that the diameter was known in two directions. Table 4.1 gives a sample
listing of depth, readings, and the corresponding diameter.
The use of the calipers with production shafts that are constructed by the
slurry-displacement method would allow concrete overrun (or underrun) to be
investigated as concrete ;s poured. The level of concrete in the excavation
could be measured from point to point and the value of concrete that was placed
could be compared with the theoretical volume as determined from measurements
with calipers. A graph could be made and would allow the inspector to gain use
ful information about the probable shaft configuration.

48
TABLE 4.1. CALIPER READINGS
Depth Below Diameter. in. Casing, ft
117 27 - 19
116 391 - 391
115 391 - 391
114 391 - 391
112 391 - 391
107 401 - 391
102 391 - 391
97 391 - 391
92 40 - 40
87 40 - 40
82 391 - 391
77 391 - 391
72 40 - 40
67 46 - 42
Casing 401 - 401
CHAPTER 5. TESTING AT LAVACA BAY
Si te Speci fi cs
Project Specifics. Field work for the filter-cake investigation took
place in South Texas where a construction project was underway for the Texas
Department of Highways and Public Transportation. The TDHPT project was to
replace three deteriorated bents under a bridge between Lavaca Bay and Point
Comfort. A test shaft was to be drilled as part of the construction. The total
project cost was $750,000 and was to last 125 working days. The tentative
starting date was set as October 17, 1983,and the completion date as April I,
1984.
Construction Sequence. A 41-in.-diameter test excavation was the first
item on the construction agenda. The excavation would be drilled using a drill
rig mounted on a barge. Support equipment, such as the slurry tanks, would
also be located on barges. After completion of the test excavation, drilling
for the bent shafts would begin.
Each bent had six drilled shafts; two on each side of the bridge and two
beneath the bridge. A beam connected the six shafts. The shafts beneath the
bridge were scheduled to be drilled first. The central shafts for all three
bents were to be constructed before the exterior shafts and would be drilled
from the bridge deck. After they were completed, the drill rig would again be
mounted on a barge and the exterior shafts would be constructed. The shafts
for all three bents would be constructed on one side of the bridge and then the
49

50
shafts on the other side would be constructed. Following shaft completion, the
beams would be constructed to complete the project.
Construction Problems
Start-Up Delays. Drilling of the test shaft did not begin until October
24, 1983, one week later than scheduled. At this time, discussions took place
as to the importance of the exact location of the test shaft. Exact placement
would cause further delay, so with the researcher's agreement, the shaft was
built within a one foot tolerance of its specified location.
The casing for the test shaft, with an inside diameter slightly less than
41 in., was driven to the specified depth with very little resistance. The
contractor suggested that the casing be driven another 5 ft to 10 ft until it
was secured. Also, the contractor suggested, with agreement from the research
er, that the working platform for the test shaft be lowered from the level of
the bridge deck to a level accessible by boat. This would allow the contractor
to rework the shaft without having to remove, and then replace, the platform,
since drilling was to be from the water rather than from the bridge. Also, the
hazards of working from the bridge during testing would be eliminated. TDHPT
agreed to lower the working platform in exchange for driving the casing until
it was better seated.
Drilling Delays. The casing was driven an additional 5 ft until it was
well seated, followed by rigging for the drilling operation. The shaft was to
be drilled using the reverse-circulation process. At the time the drilling
bucket was to be connected to the drill stem, it was discovered that the adapt
er between the bucket and drill stem was the wrong size. Another adapter had to
be brought in from Houston, Texas, a three-hour drive from the test site.
Shortly after drilling began, the desander for the slurry broke down. A short
51
delay ensued during which time the de sander was repaired. Drilling began
again, with progress being made in the mud and shale layers composing the top
50 ft of soil. A soil profile of the shaft is shown in Fig. 5.1. Drilli~g con
tinued at a rate of 10 ft/hour.
Cloggi~g in Clay. Beneath the mud and shale layer was a 5 ft layer of sand
followed by a 23 ft layer of stiff clay. Shortly after the clay was encount
ered, the bucket became clogged with clay and drilling stopped. Over the next
several weeks several modifications were made to the drilling bucket in an
effort to drill through the clay using reverse circulation. Some of these mod
ifications include changing the cutting teeth, lowering the air lift, shorten
ing the bucket, adding a baffle to direct flow, and modifying the air-lift
configuration. An estimated eleven modifications were made to the drilling
system, none of which was successful. Consultations with oil drilling compa
nies in the area revealed that the clay layer typically caused drilling delays.
Walnut shells and detergents had been added to the slurry by these companies in
an effort to form clay "balls" which could be lifted out of the shaft by the
air. These attempts had not solved the problem. Because the additives might
affect fi lter-cak.e development and had not proven entirely successful, they
were not used.
After several weeks of effort during which modifications to the drilling
system had proven unsuccessful, the attempts to use reverse circulation through
the clay layer were abandoned. Negotiations between the TDHPT and the contrac
tor ended in an agreement to use reverse circulation above and below the clay
layer. The clay layer would be drilled using an auger. The test shaft was com
pleted in this manner, seven weeks after the project began. Because of the
long delay in the completion of the excavation, another excavation was drilled

52
...... -"n-- - - - - - - - - - - - - +14
+7
Mudline
-50
-55
-78
Sand
-100
F; g. 5.1. Soil profile at site of test excavation.
53
on which to run tests. The excavation was 100 ft deep and approximately 40 in.
in diameter, rather than 41 inches.
Sampling Problems
Sampling began on December 1, 1983. The slurry supplied to the shaft had
a specific gravity of 1.09; the reading with the Marsh cone was 40 sec. The
sampler, measuring 39 1/2 in. in length, was lowered down the shaft to a depth
of 55 ft below the mudline, but could not be lowered further. The clay layer
began at approximately the depth at which the stoppage occurred. Hence, it
appeared that the clay had expanded enough so that the sampler was blocked,
given the close tolerances of the sampler length and shaft diameter. The deci
sion was made to sample the 5 ft sand above the clay while the sampler was in
the shaft. A sample was taken and the sampler raised. However, the sampler was
raised only a short distance before it stopped, presumably at the base of the
casing. After raising and lowering the sampler several times within the 5 ft
space between the clay and the casing, along with working the sampler from side
to side, the sampler was retrieved.
The samples obtained from the sand layer a few hours after shaft com
pletion showed no filter-cake build-up. The sand samples did not completely
fill the sampling tubes, either. Evidently, the sampler had not been fully
extended or the shaft diameter was slightly larger in the sand layer. If the
sand layer had been enlarged slightly due to raising and lowering of the auger,
it would allow the sampler to move off center and become hung on the base of the
casing. In an effort to alleviate the problem of hanging at the base of the
casing, an A-frame was attached to the top of the sampler guide to help guide
the sampler back into the casing.
54
The following morning, December 2, 1983, the depth of the shaft was still
100 ft, showing no signs of caving or settling. The clay layer was reworked,
using the a~ger, in an effort to enlarge the diameter of the shaft in the clay
layer. The sampler was lowered once again and, again, would not pass through
the clay layer. As before, a sample was taken from the sand layer above the
clay and the sampler raised. Once again, the sampler became lodged at the base
of the casing. After working the sampler back and forth and up and down, the
sampler was freed and retrieved. No filter-cake build-up was found on the sand
sample, nor did the sample fully fill the sampling tube, as was the case the
previous day. At this point, the weather worsened to the point that it was
deemed unwise to remain on the bay. The sampler was taken to the contractor's
shop in Houston and the guide, which was not adjustable at this time, was shor
tened approximately 1/2 in. in length. Sampling attempts were resumed on Mon
day, December 5, 1983.
The depth of the excavation on December 5, 1983.' was 20 ft 1 ess than on
December 2, 1983. In addition, the slurry level in the shaft had fallen
several feet. Apparently, either a large amount of settlement of detritus from
the slurry had occurred or caving had occurred over the weekend, presumably
from the sand layer between the casing and the clay. The casing was immediate
ly driven to the clay layer to avoid any further chances of caving. The sampler
was again lowered, but was stopped by the clay as before. Because the casing
was now driven to the clay, no sample could be taken.
At this point, the decision was made to return to the University of Texas
and modify the sampler. The modifications would be to replace the rigid frame
with an adjustable frame, and to add a pressure gauge to the hydraulic pump to
ensure that the sampler was fully extended and fully retracted in sampling.
The finished product is described in the previous chapter. Also, a set of
55
calipers was developed during this period to determine shaft diameter and to
detect any caving which might have occurred. The design of the calipers is
also described in the previous chapter.
Testing at Lavaca Bay
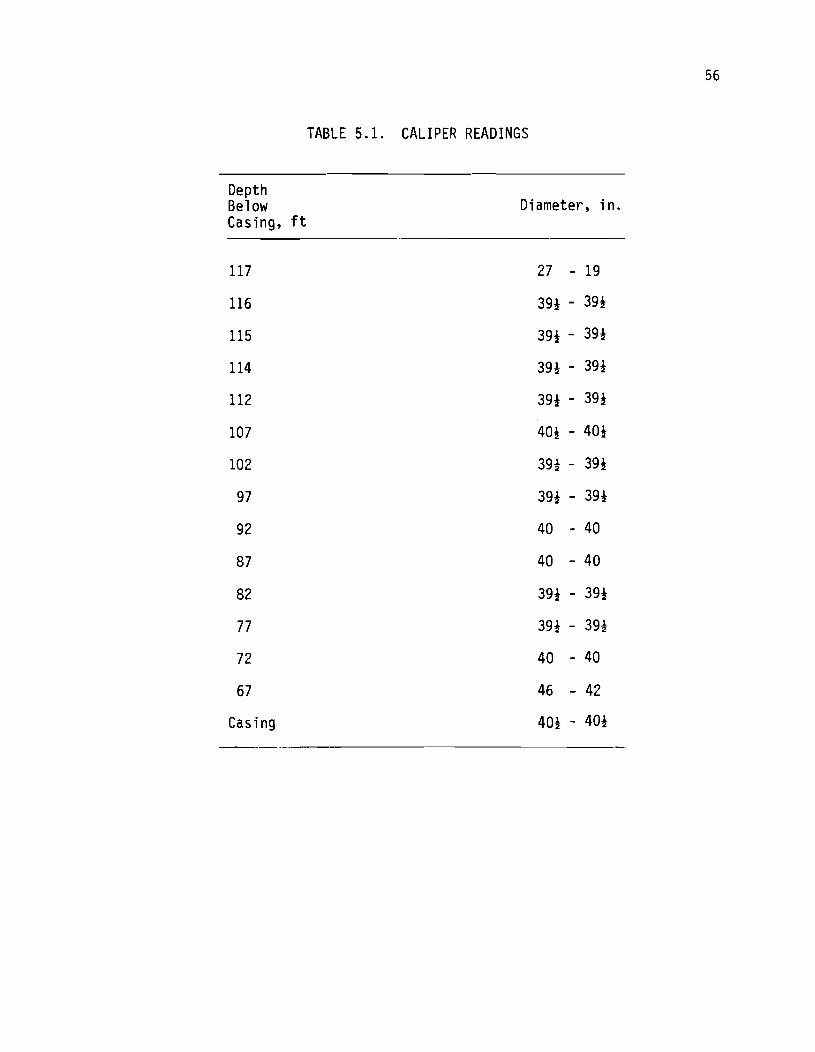
Initial Results. Testing resumed on Wednesday, December 14, 1983. The
shaft was reworked and drilled an additional two feet. The calipers were used
to measure the diameter of the excavation over its length. The results are
shown in Table 5.1. A fairly uniform excavation of 39 1/2 in. to 40 in. in
diameter was found. The sampler as modified was then lowered and adjusted a
total of 3 times before it moved easily in and out of the excavation. The final
configuration was such that one side was 1 in. shorter than the other. The
guide measured approximately 37 in. in length.
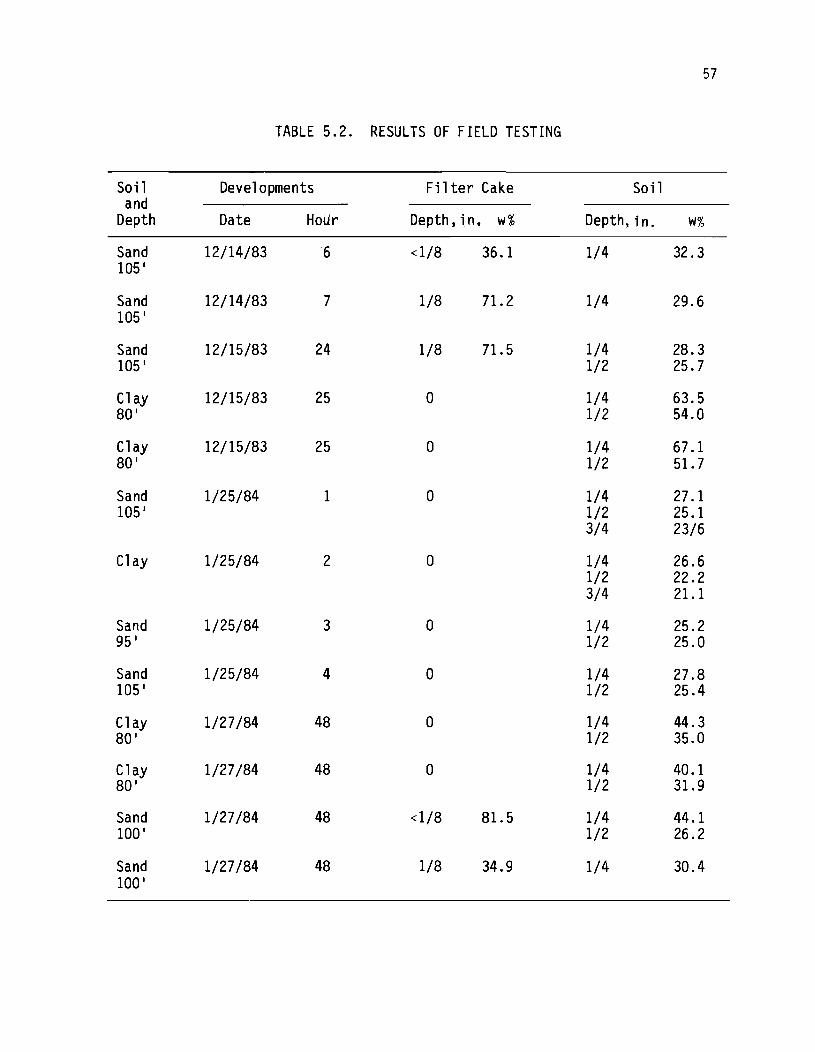
Sand samples were taken at a depth of 91 ft below the mud line at 6,7 and
24 hours after drilling concluded. Very little filter cake was apparent ini
tially; 1/16 in. to 1/8 in. at most. At the end of 24 hours, 1/8 in. of filter
cake was apparent and was slightly firmer than it was the day before. A clay
sample was taken after 25 hours and no filter-cake build-up was apparent. The
specific gravity of the slurry at the base of the shaft was 1.22 after 24 hours
had passed.
After each sample was retrieved, it was slowly extruded from the sampling
tube. As it was extruded, it was sliced into layers approximately 1/4 in. in
thickness. Each layer was wrapped in plastic wrap and secured with masking
tape. The samples were then sealed in wax. At the laboratory at The University
of Texas, the water contents of the samples were determined. The results of
all of the field testing are shown in Table 5.2.
Depth Below Casil1g, ft
117
116
115
114
112
107
102
97
92
87
82
77
72
67
Casing
TABLE 5.1. CALIPER READINGS
Diameter, in.
27 - 19
39i - 39;
39; - 39;
39i - 39;
39; - 39;
40; - 40;
39i - 39;
39i - 39;
40 - 40
40 - 40
39; - 39;
39i - 39i
40 - 40
46 - 42
40i - 40; ---------------------
56
57
TABLE 5.2. RESULTS OF FIELD TESTING
Soil Developments Fi lter Cake Soil and
Depth Date Hour Depth, in. w% Depth, in. w%
Sand 12/14/83 6 <l/8 36.1 1/4 32.3 105'
Sand 12/14/83 7 1/8 71.2 1/4 29.6 105'
Sand 12/15/83 24 1/8 71.5 1/4 28.3 105' 1/2 25.7
Cl ay 12/15/83 25 0 1/4 63.5 80' 1/2 54.0
Clay 12/15/83 25 0 1/4 67.1 80' 1/2 51. 7
Sand 1/25/84 1 0 1/4 27.1 105' 1/2 25.1
3/4 23/6
Clay 1/25/84 2 0 1/4 26.6 1/2 22.2 3/4 21.1
Sand 1/25/84 3 0 1/4 25.2 95' 1/2 25.0
Sand 1/25/84 4 0 1/4 27.8 105' 1/2 25.4
Cl ay 1/27/84 48 0 1/4 44.3 80' 1/2 35.0
Clay 1/27/84 48 0 1/4 40.1 80' 1/2 31.9
Sand 1/27/84 48 <1/8 81. 5 1/4 44.1 100' 1/2 26.2
Sand 1/27/84 48 1/8 34.9 1/4 30.4 100 1

58
Weather Problems. Further testing was scheduled to take place weekly over
a one month period. The following week, preparations were made to return to
Lavaca Bay on December 22, 1983. However, due to bad weather, the job site was
closed down for several days. Preparations were then made to return December
29, 1983 for further testing. However, due to abnormally cold weather, the bay
had frozen over and the job was shut down. In addition, the barges were forced
by the weather move to the inland side of the bridge where they would be better
protected. It was not until January 24, 1984 that the barges returned to the
gulf side of that bridge and testing resumed.
Final Testing. Testing was attempted January 24, 1984, six weeks after
testing began. However, due to thickening of the slurry, the sampler could not
be lowered past the casing to obtain samples. The shaft was reworked and sam
pling initiated. Sand samples at a depth of 91 ft below the mud line were taken
at 1, 3, 4 and 48 hours after completion of the shaft. No filter-cake build-up
was apparent after 4 hours. After 48 hours, a build up of 1/8 in. was observed.
Clay samples were taken at 2 and 48 hours with no build up being observed.
A slurry sample was taken from the shaft at a depth of 91 ft below the mud
line after 3 hours. The specific gravity was 1.13, the March cone viscosity
was 35 seconds, and the sand content was 3 1/2 to 4%. Another slurry sample was
taken after 48 hours at 86 ft below the mudline. The specific gravity was 1.1,
the Marsh cone viscosity was 34 seconds, and the sand content was 0.25%. Evi
dently a good deal of settlement had occurred over the two day period.
A photograph of the device used for sampling slurry in the excavation is
shown in Fig. 5.2. A weight at the end of a flexible cable is lowered to the
depth where a sample is desired. A cylinder with internal guides is then
dropped and is gUided to a seated position at the top of the lower weight. The
upper weight is dropped and slides along the flexible cable and seals the top

59
Fi g. 5.2. Device for sampling sl urry.

60
of the cylinder. The device is then removed and the slurry contained in the
cylinder is available for testing.
CHAPTER 6. SPECIFICATIONS
Need for Specifications
The use of bentonitic slurry in construction has increased over the years.
However, its use has not always been under ideal conditions. Many times the
slurry has been mixed in the excavation using an auger. If any testing is done,
it consists solely of density and viscosity measurements. As a result of the
relaxed conditions associated with bentonitic slurry at times, concern has
arisen as to the integrity of the slurry and the finished product. This con
cern has lead to the development in the last ten years of various specifica
tions.
Sped fi cat ions
Sliwinski and Fleming (1975) suggested general ranges for the various pro
perties of bentonitic slurry. The properties were associated with the function
of the slurry. Table 6.1 shows these relationships. As can be seen, the
desired values of the properties range from low to high depending on the func
tion. Thus, a slurry which would function ideally at all times must change
properties with functions. An ideal slurry, therefore, is impossible. Howev
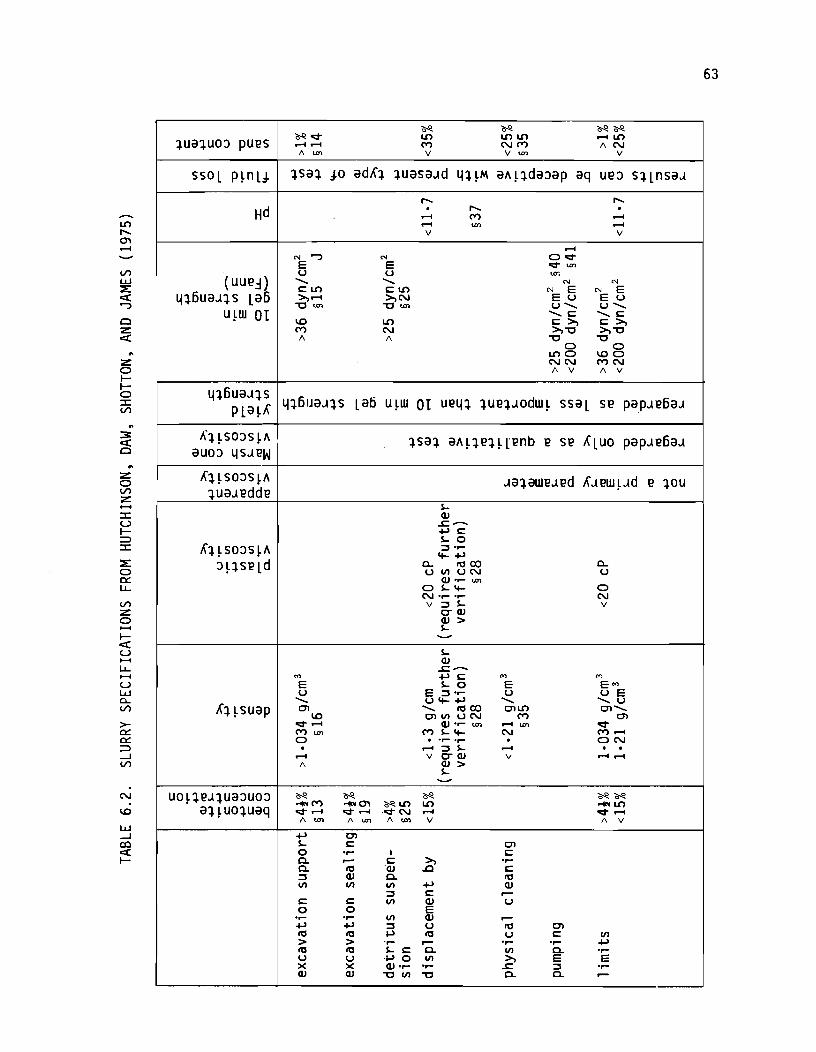
er, an effective slurry is possible with controls. Hutchinson, Daw, Shotton,
and James (1975) suggested a more detailed set of specifications as did P. T.
Hodgeson (1977). Tables 6.2 and 6.3, respectively, show the suggested specifi
cations. Neither set regards the Marsh Cone as more than a qualitative
61
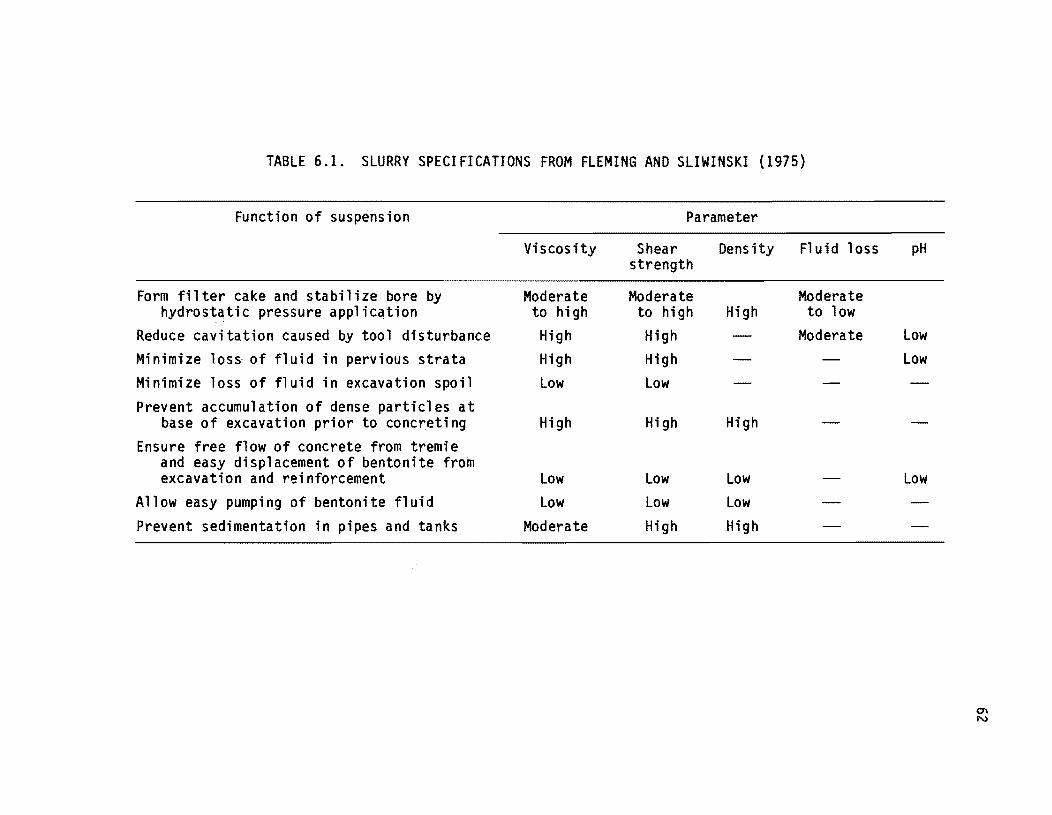
TABLE 6.1. SLURRY SPECIFICATIONS FROM FLEMING AND SLIWINSKI (1975)
Function of suspension Parameter
Viscosity Shear Density Fluid loss strength
Form filter cake and stabilize bore by Moderate Moderate Moderate hydrost9tic pressure application to high to high High to low
Reduce cavitation caused by tool disturbance High High Moderate Minimize 10s~ of fluid in pervious strata High High Minimize loss of fluid in excavation spoil Low Low Prevent accumulation of dense particles at
base of excavation prior to concreting High High High Ensure free flow of concrete from tremie
and easy displacement of bentonite from excavation and reinforcement Low Low Low
Allow easy pumping of bentonite fluid Low Low Low Prevent sedimentation in pipes and tanks Moderate High High
pH
Low Low
Low
CTI N
V')
I.J.J ::E e:( "")
CI :z e:(
:z o lIo ::r:: V')
.. 3: e:( CI
:z o V')
:z ...... ::r:: u I::J ::r:: ::E o c:= I..L.
V')
:z o ...... le:( U ...... I..L. ...... U I.J.J a... V')
>c:= c:= ::J --.J V')
N . 1.0
I.J.J --.J co e:( I-
lUtqUO::> pues
ssoL p~nLJ.
Hd
(UUe.:l) 4lfiua.AlS LaB
u~UJ ot
4lfiua.AlS PLa~A
A'HSO::>S~I\ auo::> 4S.AeW
Al~SO::>S~1\ lUa.Aedde
AH SO::>S ~I\ ::>~lseLd
Al~suap
UOne.Alua::>uo::> al~uoluaq
63
~ ~ ~~ ~q- LO LO LO
- LO -- M NM I\N 1\ tDl V V tDl v
lsal ).0 adAl luasa.Ad 4l~M al\~lda::>ap aq ue::> SlLnsa.A ,..... ,..... . ,..... . - M -- tDl -V V -'" "") '" Oq-
E E q- tDl U U UT.
......... ......... '" '" e::LO e::LO '" E '" E >,- >,N Eu E U "0 tDl "0 tDl u ......... u .........
......... e:: ......... e:: 1.0 LO e::>, e::>, M N >'"0 >,"0
1\ 1\ "0 "0 0 0
LOO 1.0 0 NN MN 1\ V 1\ v
4lBua.AlS Lati u~w Ot ue4l luel.Aodw~ ssaL se pap.Aefia.A
lsal al\nelHenb e se ALUO pap.Aefia.A
.AalaWe.Aed A.A ew ~.Ad e lOU ~ Q)
..c:: ......... +..Ie:: ~o ~ .....
'+- +..I a... to co a... UVIUN U
Q) ..... om O~'+- 0 N·,...·,.... N V ~ ~ v
o-Q) Q) > ~
'-"
~ Q)
..c:: ......... '" +..Ie:: '" '" E ~o E E'" U E ~ ..... U U E
......... U'+-+..I ......... ......... U 0'1 ......... to co O'ILO 0'1 .........
1.0 0'1 VI UN M 0'1 q-- QJ.,... t.al _tDl q-MtDl M~'+- N M_ 0 . . ,...-,... . ON . -~~ - . . - v 0- Q) v --1\ Q»
~ '-"
~ ~ ~ ~~ ..... M ..... ~ ~LO LO ..... LO q-- q- - ·q-N - q- -1\ om 1\ om 1\ om V 1\ V
+..I 0'1 ~ e:: 0'1 0 ..... I e:: a. ..- e:: >, ..... a. to .Q) ..c e:: ~ Q) a. to VI VI VI +..I Q)
~ e:: ..-e:: e:: VI Q) U 0 0 E ..... ..... VI Q) ..-
+..I +..I ~ U to 0'1 to to j...l to U e:: VI > > ..... r- ..... . .... +..I to to ~ e:: a. VI a. ..... U U .j...l 0 VI >, E E x x Q) ..... ..... ..c:: ~ ..... Q) Q) "0 VI "0 a. a. r-

64
TABLE 6.3. SLURRY SPECIFICATIONS FROM HODGESON (1977)
Property Method Supplied to Trench Prior to Concreting 3-5 % 5-8 3-5 % 5-8
plastic Fann 3-10 7-20 20 20 viscosity viscometer
10-min-gel 2 Fann 2-20 10-40 20 40 strength N/m viscometer
density mud 1.02-1. 07 1. 03-1.10 1. 02-1. 20 1. 03-1.15 g/mL balance
API sand API test 5 5 14 9 content % vol
fluid loss API test 40 40 60 60 mL in 30 min
pH pH meter 10.8 10.8 11.7 11.7

65
measurement. However, its use has continued due to its simpl icity and the
expense of alternate methods.
The Federation of Piling Specialists (1977) suggested a set of specifica
tions which not only include slurry properties, but also material requirements
and construction procedures. Table 6.4 is a summary of the FPS slurry specifi
cations. The FPS specifications are not as extensive as are some others. Hol
den (1983) found the FPS specifications to be inadequate for a project in
Australia. He suggests a much more extensive set of specifications (Table
6.5). He also suggests that the specifications be modified, after further stu
dy, to suit the particular equipment, methods, and conditions of a project.
Modification of any specification is necessary for optimal compatibility
for a particular project due to the different soil conditions that may be
encountered. As the development of specifications is in the early stages, more
studies are needed to broaden the scope of specifications. The FPS specifica
tions are a good base on which to build, although they may not always be ade
quate. The entire FPS specifications are in Appendix C.

66
TABLE 6.4. SLURRY SPECIFICATIONS FROM F.P.S. (1977)
Item to be i4easured
density
viscosity
shear strength
pH
Range of Results at 20° C
1 ess than 1. 10 g/mL
30-90 sec or less than 20 cP
1.4 to 10 N/m2 or 4 to 40 N/m?
9.5 to 12
Prior to concreting: density less than 1.25 g/mL
Test Method
mud density balance
Marsh cone method Fann viscometer
shea rometer Fann viscometer
pH indicator paper strips or electrical pH meter

67
TABLE 6.5. SLURRY SPECIFICATIONS FROM HOLDEN (1983)
Bentonite Mud Supply Socket Sl urry Socket Sl urry Property duri ng during during
Excavation InterY'uptions Concreti ng
bentonite type sodium bentonite OCMA spec
bentonite 4 min concentration % wt/wt of water
density, 1. 03 mi n 1. 03 mi n 1. 03 mi n gm/cc 1.08 max 1.08 max 1.20 max
API sand content, o min o min % by vol 2 max 2 max 10 max
API fluid loss, 10 max 10 max mL in 30 min
cake thickness mm 1 max 1 max
pH (field check 8 min 8 min with i ndi cator) 11 max 11 max
plastic viscosity 4 min 4 min (viscometer) cP 10 max 10 max 20 max
yield point Pa 14 max 14 max 10 min gel strength 2 min 7.5 min 7.5 min Pa 10 max 20 max
API marsh funnel 30 min 30 min viscosity sec 40 max 40 max (field check)
head of bentonite 1 m above 1 m above 1 m above water table water table water table (min) (min) (min)
1. 5 m above water table (max)
CHAPTER 7. CONCLUSIONS AND RECOMMENDATIONS
Conclusions
From Literature Research
1. Construction practices dictate the effect of bentonite slurry on the
capacity of drilled shafts. Over the years, conflicting reports have been
issued as to the effect of bentonitic slurry on skin friction. Laboratory
reports indicate that not all of the filter-cake build-up is removed by the
scouring action of the concrete. The remaining filter-cake has shown an
adverse effect on skin friction. Field studies report that although all of the
filter cake may not be removed, rarely does a drilled shaft constructed by use
of the slurry-displacement method carry less in skin friction than a drilled
shaft constructed dry. The only occasion reporting a reduction was one in
which poor construction practices were used; i.e. the excavation remained
filled with slurry for a long period of time and was not cleaned prior to con
crete placement.
2. Improper construction practices may cause inclusions to occur in the
shaft, sand to collect on the reinforcement, and/or heavy filter-cake build-up.
Construction practices include the procedure by which the shaft is excavated,
the amount of time the shaft remains open, cleaning of the shaft, and proper
ties of bentonitic slurry. Thus, specifications regarding the mixing and
cleaning of the slurry as well as the engineering properties of the slurry are
needed for proper construction of a drilled shaft using the slurry-displacement
and the casing method.
68

69
'Laboratory vs. Field Investigation
1. The experimental set-ups for the laboratory studies peformed well.
The procedure by which filter cakes were developed worked very well. The sedi
mentation process also worked well, but its range of application was limited by
time.
2. No build-up of filter cake was observed on clay soil.
3. The results of the laboratory work indicated that at low pressures,
time had little effect on filter-cake build-up on sand for a given slurry com
position. However, at medium to high pressures, time had a pronounced effect
on filter-cake build-up. Pressure had very little impact for a given time
period on filter-cake build-up when slurries with high concentrations of ben
tonite were used. In addition, slurries with the high concentrations of ben
tonite yielded lower water contents for the same filter-cake thickness when
medium to high pressures were used.
4. The sedimentation process yielded an equation of the shear strength of
bentonitic slurry as a function of water content. While there was a consider
able scatter in the experimental results, the equation should provide some gui
dance for estimating whether all of a particular filter cake can be removed by
the upward-flowing concrete.
From Field Experiments
1. The instruments, equipment, and procedures employed in the field for
investigating the characteristics of slurry and the build-up of filter cake
were effective.
The samples of filter cake and soil obtained were of good quality and the
method of sealing the samples for transport worked very well. The calipers
that were designed and built provided very useful information on the profile of
70
the excavation. Data indicated that reverse circulation produced an excavation
of uniform diameter.
2. The filter-cake build-up in the field was much less than that in the
laboratory for the same time period. A build-up of 1/8 in. was the maximum
observed in the field after two days. Build-up over longer periods was not
determined due to the various problems encountered.
3. No filter cake was observed immediately after reworking the shaft.
Prior to reworking, the shaft had remained filled with slurry for a period of
six weeks. During that period, the slurry was not agitated or altered in any
manner. The slurry in the shaft conformed to both FPS specifications (1977)
and Holden's specifications (1983) for slurry prior to concreting. The sand
content of the slurry. however, was higher than that suggested by Holden during
delay periods.
4. Direct comparison of the field and laboratory investigations was dif
ficult due to the limited field data and the difference in soil and slurry com
position. The field slurry was contaminated with sand and other detritus
whereas the laboratory slurry was composed of bentonite and water only.
Recommendations
1. Further field testing at a variety of sites to investigate the
build-up of filter cake is recommended. In this manner, various soil condi
tions would be encountered. Accumulation of data will allow detailed specifi
cations to be developed which will be applicable to a variety of circumstances.
2. The instruments and procedures employed in the investigation described
herein are recommended for use in the field studies.
71
3. When the slurry-displacement method is employed the use of calipers to
detect shaft irregularities and to predict concrete overrun (or underrun) is
recommended. Such a practice would give insight as to the integrity of the
shaft.
4. Laboratory investigations in which the sand content of the slurry is
varied would be informative and more comparable to field work. Other detritus
such as clay and soil particles resulting from drilling could also be added to
the slurry.
5. Detailed specifications cannot be developed on the basis of the rela
tively small amount of data gathered in this study. However, the following
gUidelines are recommended for use in the interim.
A. Specifications should be adopted provisionally for the mixing of
bentonitic slurry and for the condition of the slurry prior to placing concrete
for the slurry-displacement method and prior to placing casing for the casing
method. The FPS Specifications (1977) in Appendix C, with the addition of a
requirement on sand content, should be given strong consideration. (Note:
Such specifications may require the contractor to use de-sanders and to circu
late clean slurry into the excavation to displace sand-laden slurry.)
B. Concrete should be poured during the same day a slurry-stabilized
excavat ion is made or the excavation shoul d be re-worked pri or to concrete
placement.
C. High-slump concrete, which gives higher lateral pressures against
the sides of the excavation than low-slump concrete (Bernal and Reese, 1984),
should be employed in the construction of drilled shafts. (Note: This recom
mendation is aimed particularly at the slurry-displacement method and at the
casing method but it is also beneficial if the dry method of construction is
used.)

REFERENCES
1. Bernal, Juan B. and L. C. Reese, "Study of Lateral Pressure of Fresh Concrete as Related to the Design of Drilled Shafts," Report to Center for Highway Research, The University of Texas at Austin, May 1984.
2. Boyes, R. G. H., Structural and Cut-Off Diaphram Walls, Barking, Essec, England, 1975.
3. Everett, J. and C. M. McMillan, "Bentonite Piles in Durban ," Soil Mechan-ics and Foundation Engineering, Proceedings of the Sixth Regional Conference for Africa, Vol. 1, Capetown, Africa, 1975, pp 155-159.
4. Farmer,!. W., P. J. C. Buckley, and Z. Sliwinski, liThe Effect of Benton-ite on the Skin Friction of Cast in Place Piles," Behavior of Piles, Proceedings of the Conference organized by the Institution of Civil Engineers in London, September 1970, pp 115-120.
5. Farmer,!. W. and M. Goldberger, "Effect of Bentonite on the Skin Friction of Bored Piles," Cementation Research Ltd., Internal Report, 1969.
6. Federation of Piling Specialists, "Specification for Cast in Place Piles Formed under Bentonite Suspension," Ground Engineering, Vol. 8, No. 2, London, March 1975.
7. Fleming, W. K. and Z. S. Sliwinski, The Use and Influence of Bentonite in Bored Pile Construction, London, September 1977.
8. Holden, J. C., liThe Construction of Bored Piles in Weathered Sedimentary Rock," Fourth Autralian-New Zealand Conference on Geomechanics, Perth, May 1984.
9. Hodgeson, P. T., "Design and Control of Bentonite/Clay Suspensions and concrete Diaphragm Wall Construction," A Review of Diaphragm Walls, 1979.
10. Hutchinson, M. T., G. P. Daw, P. G. Shotton, and A. N. James, liThe Properties of Bentonite Slurries used in Diaphragm Walling and their Contro 1 ," Di aphragm Wa 11 s and Anchorages, London, 1975, pp 33-39.
11. OINeill, Michael W. and Lymon C. Reese, "Behavior of Axially Loaded Drilled Shafts in Beaumont Clay," a Research Report conducted for the Texas Highway Department, in cooperation with the U.S. Department of Transpotation, Federal Highway Administration, Bureau of Public Roads, December 1970.
72
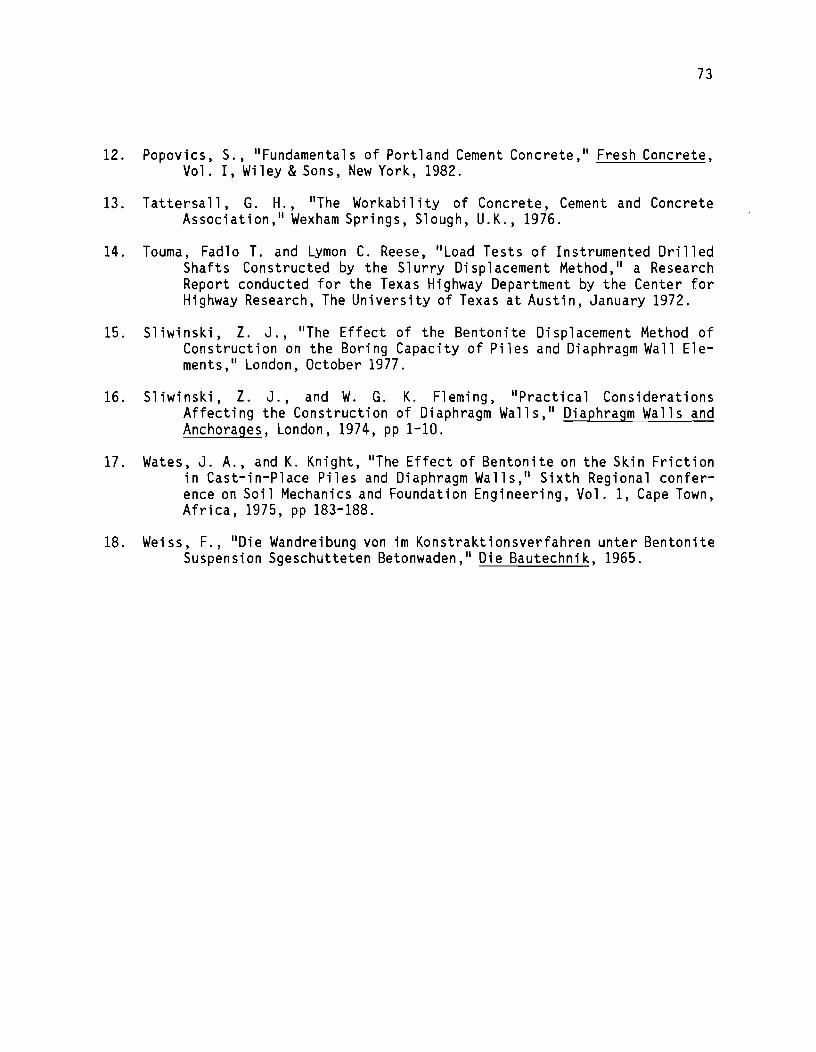
73
12. Popovics, S., IIFundamentals of Portland Cement Concrete," Fresh Concrete, Vol. I, Wiley & Sons, New York, 1982.
13. Tattersall, G. H., liThe Workabi 1 i ty of Concrete, Cement and Concrete Association," Wexham Springs, Slough, U.K., 1976.
14. Touma, Fadlo T. and Lymon C. Reese, IILoad Tests of Instrumented Drilled Shafts Constructed by the Sl urry Di sp 1 acement Method, II a Research Report conducted for the Texas Highway Department by the Center for Highway Research, The University of Texas at Austin, January 1972.
15. Sliwinski, Z. J., liThe Effect of the Bentonite Displacement Method of Construction on the Boring Capacity of Piles and Diaphragm Wall Elements," London, October 1977.
16. Sliwinski, Z. J., and W. G. K. Fleming, "Practical Considerations Affecting the Construction of Diaphragm Walls," Diaphragm Walls and Anchorages, London, 1974, pp 1-10.
17. Wates, J. A., and K. Knight, liThe Effect of Bentonite on the Skin Friction in Cast-in-Place Piles and Diaphragm Walls,1I Sixth Regional conference on Soil Mechanics and Foundation Engineering, Vol. 1, Cape Town, Africa, 1975, pp 183-188.
18. Weiss, F., IIDie Wandreibung von im Konstraktionsverfahren unter Bentonite Suspension Sgeschutteten Betonwaden," Die Bautechnik, 1965.

APPENDIX A
RESULTS OF LABORATORY TESTS
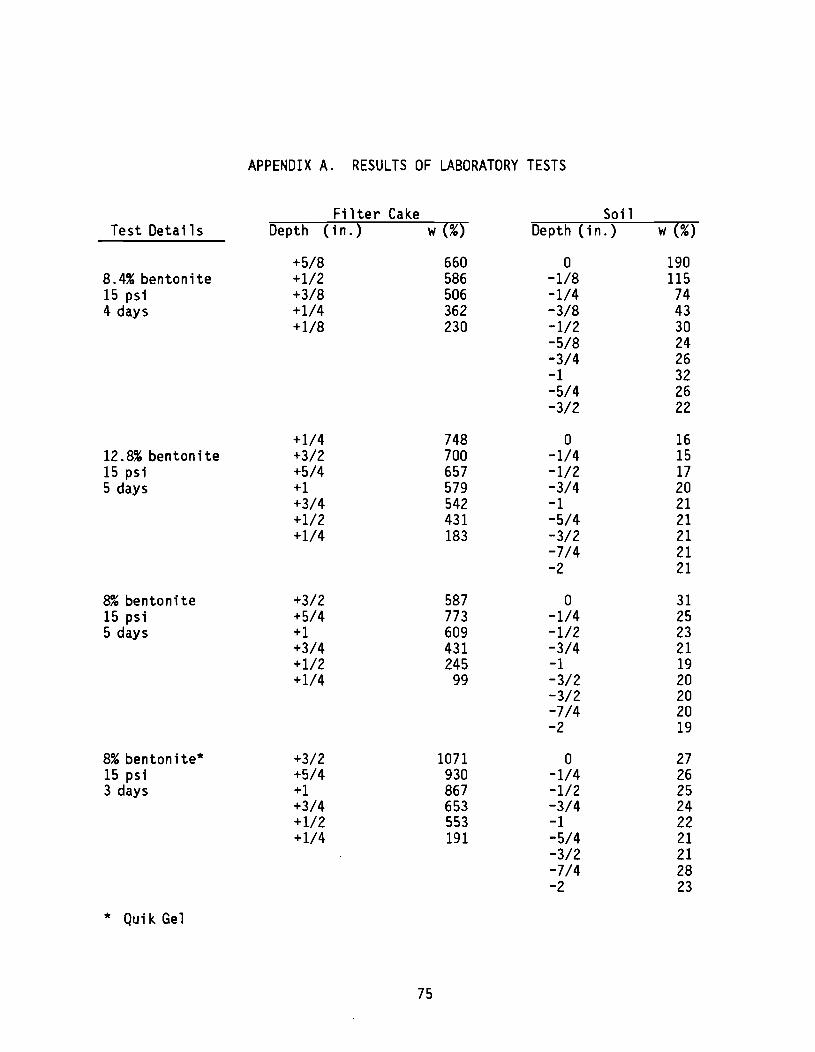
APPENDIX A. RESULTS OF LABORATORY TESTS
Filter Cake Soil Test Details Depth (i n. ) w (%) Depth (in.) w (%)
+5/8 660 0 190 8.4% benton i te +1/2 586 -1/8 115 15 psi +3/8 506 -1/4 74 4 days +1/4 362 -3/8 43
+1/8 230 -1/2 30 -5/8 24 -3/4 26 -1 32 -5/4 26 -3/2 22
+1/4 748 0 16 12.8% bentonite +3/2 700 -1/4 15 15 psi +5/4 657 -1/2 17 5 days +1 579 -3/4 20
+3/4 542 -1 21 +1/2 431 -5/4 21 +1/4 183 -3/2 21
-7/4 21 -2 21
8% bentonite +3/2 587 0 31 15 psi +5/4 773 -1/4 25 5 days +1 609 -1/2 23
+3/4 431 -3/4 21 +1/2 245 -1 19 +1/4 99 -3/2 20
-3/2 20 -7/4 20 -2 19
8% bentonite* +3/2 1071 0 27 15 psi +5/4 930 -1/4 26 3 days +1 867 -1/2 25
+3/4 653 -3/4 24 +1/2 553 -1 22 +1/4 191 -5/4 21
-3/2 21 -7/4 28 -2 23
* Qui k Gel
75

76
Test Details Filter Cake (in.) w (~~) Sand (in.) w (~6)
5% bentonite +1 1065 0 27 15 psi +3/4 789 -1/4 26 6 days +1/2 539 -1/2 24
+1/4 282 -3/4 22 -1 20 -5/4 18 -3/2 18 -7/4 18 -2 17
8% bentonite* +5/4 904 0 25 15 psi +1 583 -1/4 21 4 days +3/4 550 -1/2 20
+1/2 416 -3/4 21 +1/4 160 -1 22
-5/4 22 -3/2 22 -7/4 21 -2 22
8% bentonite +5/8 1081 0 48 30 psi +3/8 836 -1/4 26 1 day +1/8 314 -1/2 25
-3/4 20 -1 19 -5/4 19 -3/2 18 -7/4 18 -2 20
8% bentonite +7/8 844 0 28 30 psi +3/4 731 -1/4 25 3 days +1/2 551 -1/2 23
+1/4 347 -3/4 22 -1 19 -5/4 18 -3/2 18 -7/4 19 -2 19
10% bentonite +1/2 682 0 29 30 psi +1/4 273 -1/4 22 1 day -1/2 24
-3/4 21 -1 20 -5/4 19 -3/2 19 -7/4 19 -2 18
* Quik.Gel
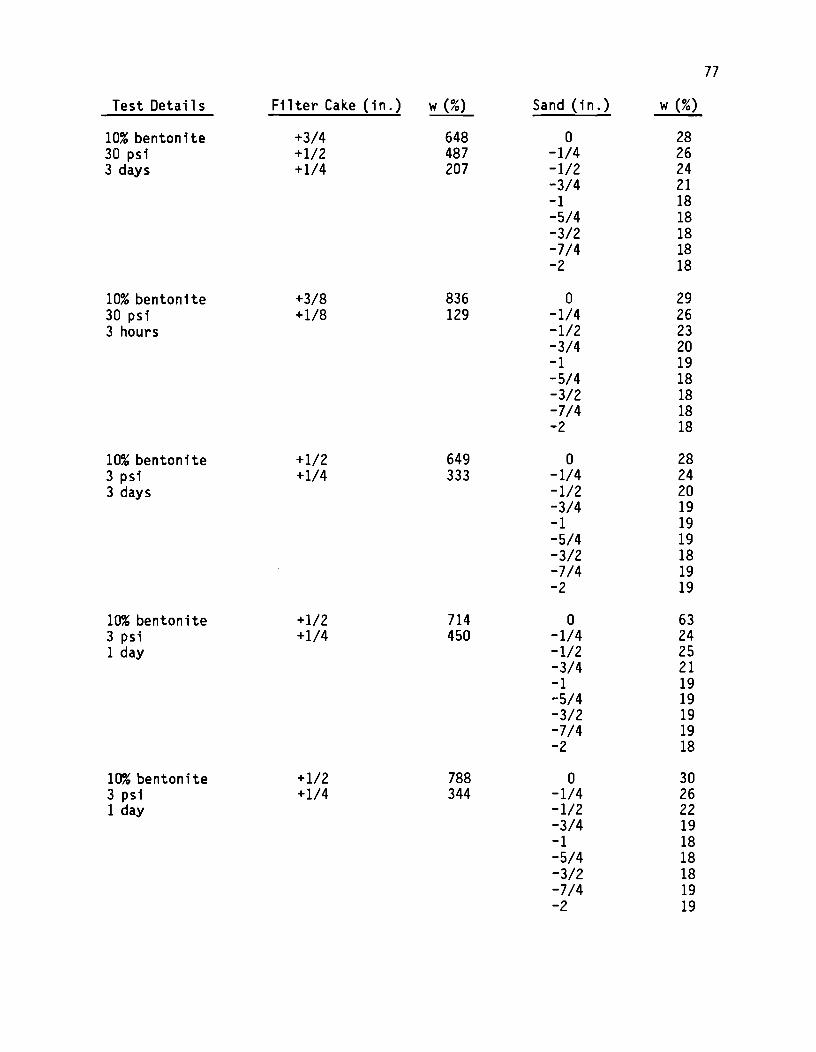
77
Test Details Filter Cake (in.) w (%) Sand (in.) w (%)
10% bentonite +3/4 648 0 28 30 psi +1/2 487 -1/4 26 3 days +1/4 207 -1/2 24
-3/4 21 -1 18 -5/4 18 -3/2 18 -7/4 18 -2 18
10% bentonite +3/8 836 0 29 30 psi +1/8 129 -1/4 26 3 hours -1/2 23
-3/4 20 -1 19 -5/4 18 -3/2 18 -7/4 18 -2 18
10% bentonite +1/2 649 0 28 3 psi +1/4 333 -1/4 24 3 days -1/2 20
-3/4 19 -1 19 -5/4 19 -3/2 18 -7/4 19 -2 19
10% bentonite +1/2 714 0 63 3 psi +1/4 450 -1/4 24 1 day -1/2 25
-3/4 21 -1 19 -5/4 19 -3/2 19 -7/4 19 -2 18
10% bentonite +1/2 788 0 30 3 psi +1/4 344 -1/4 26 1 day -1/2 22
-3/4 19 -1 18 -5/4 18 -3/2 18 -7/4 19 -2 19
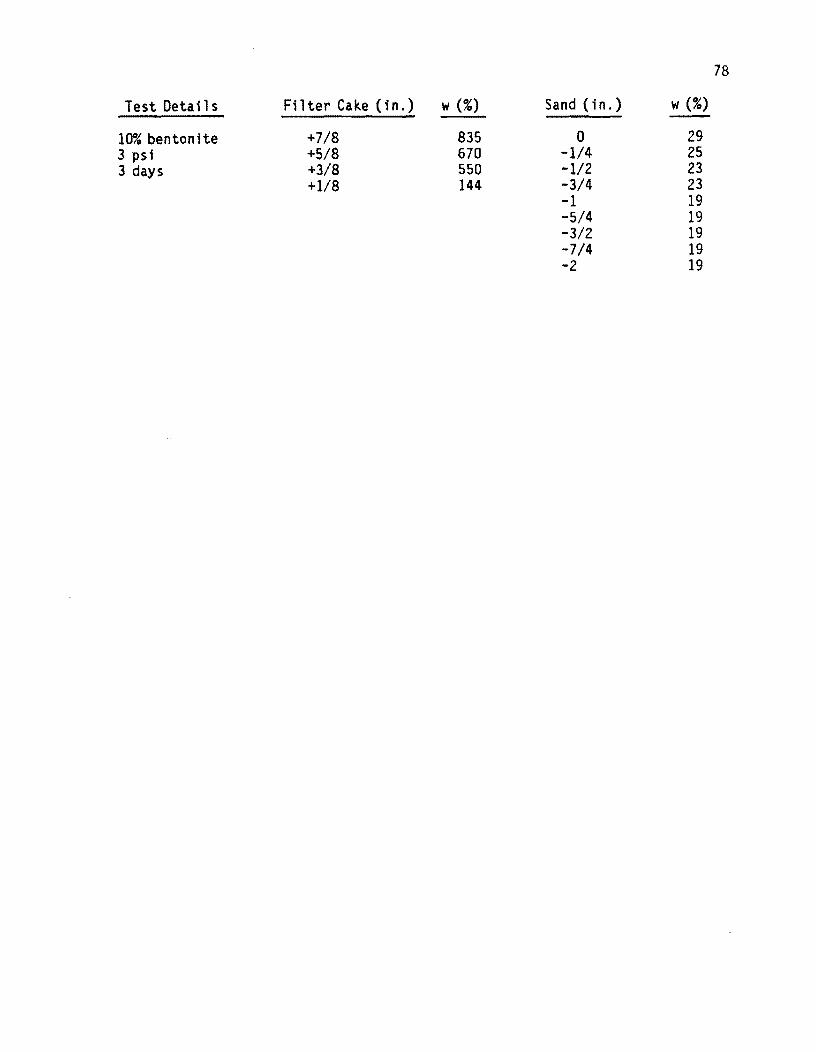
78
Test Detail s Fll ter Cak.e (i n. ) w (%) Sand (i n. ) w (%)
10% bentonite +7/8 835 0 29 3 psi +5/8 670 -1/4 25 3 days +3/8 550 -1/2 23
+1/8 144 -3/4 23 -1 19 -5/4 19 -3/2 19 -7/4 19 -2 19

APPENDIX B
SAND SIEVE ANALYSIS
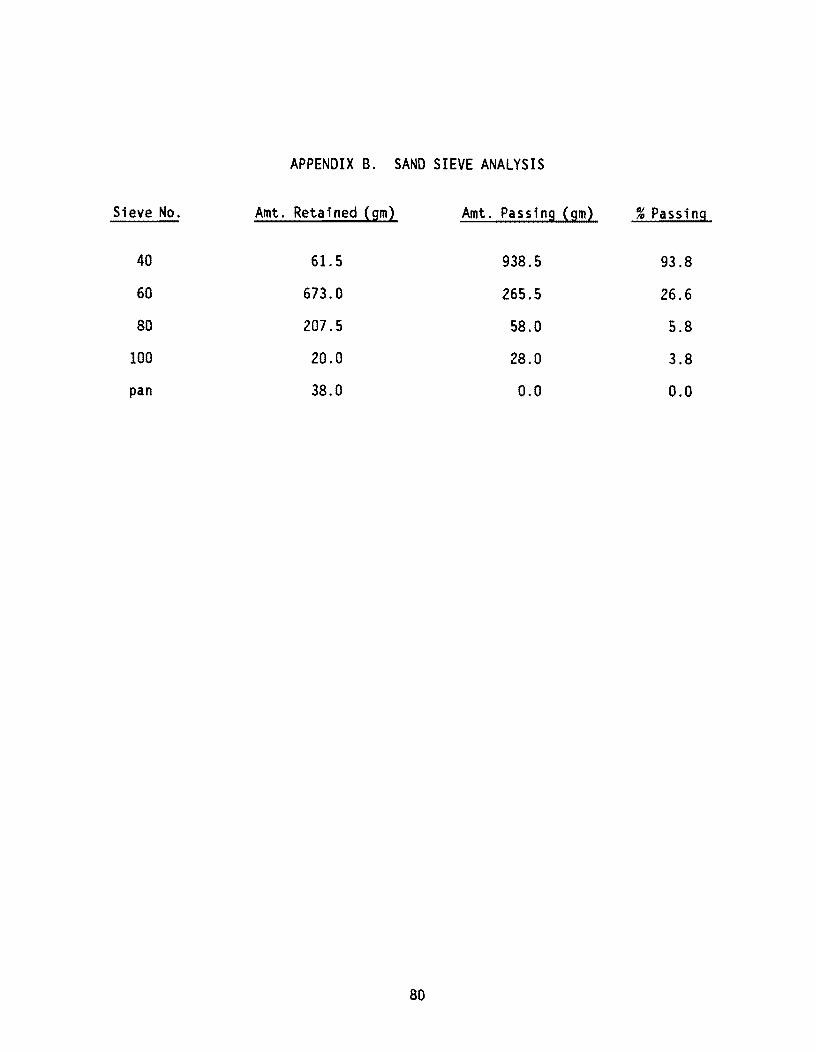
APPENDIX B. SAND SIEVE ANALYSIS
Sieve No. Amt. Retained (gm) Amt. Passing (gm) % Passing
40 61. 5 938.5 93.8
60 673.0 265.5 26.6
80 207.5 58.0 5.8
100 20.0 28.0 3.8
pan 38.0 0.0 0.0
80
APPENDIX C
SPECIFICATION FOR CAST IN PLACE PILES
FORMED UNDER BENTONITE SUSPENSION

Federation of Piling Specialists (whose copyright is retained in the specification) GROUND
ENGINaRlNG
Specification for ".,"°0
0,
Cast in Place Piles formed " . P, ~ under Bentonite Suspension "+0 '"'0""-
Preface THE USE OF bentonite in the formation of piles has now become a normal and accepted practice, though one which involv .. rather different technical skills from those known in traditional bored piling.
Bentonite mey be used in a variety of ways, but the most important at the present time are for (i) The process of "mudding in", (ii) The maintenance of the stability of an unlined
boring until a temporary or permanent caaing, or concrete, h .. been installed within it.
The proceuof "mudding in" is one which is used to a .. ial the insertion of temporary or permanent casing aa a normal pert of pile construction. It involves using a rotary boring machine, usually fined with an auger, to penetrate the ground.
Bentonite and water are mixed into the ground by rotation and vertical motion of the auger, until a column of slurry has been formed. Casing may then be inserted, the slurry baled out, and pile construction can procftd in the normal manner.
Thia process ia not covered by this specification. The other process is one in which a benton ite
suspension ia used instead of casing to retain the ground during boring. This process is based on digging out soil from the base of the excavation, avoiding contamination of a bentonite suspension which is contained within it exc:epting in so far as it may be used to transport excavated material to a screening system in the case of plant based on the "reverse circulation" principle. The process is akin to that of forming cast in piece diaphragm walls and, following from the preparation of a diaphragm wall specification by this Federation, the time would now seem to be opportune to introduc:e D seri .. of specification clauses which can be used for piling wortc in this class in conjunction with the existing FPS SPECIFICATION FOR CAST IN PLACE PILING.
One of the most important aspects of tha method is that the concrete must fully displaca the bentonite suspension in each pile. The bentonite suspension and the concrete both exhibit shear strength characteristics, and the conditiona of displacement might be said to be govemed by the "active" and "passive" pressure statea of the two materials in~lved. The "active" pressure of lowing concrete redu~ aa the mix becomes less wortcable, and the .. ps ..... pressure of tha bentonite suapension inc:rea_ artt becomes denser and more viacoua through contamination. Displacament will cease when a balance condition is reached, and it is essent'ial 10 prevent such a situation arising. Much that is written in the following clauses is aimed at achieving the optimum displacement conditions.
82
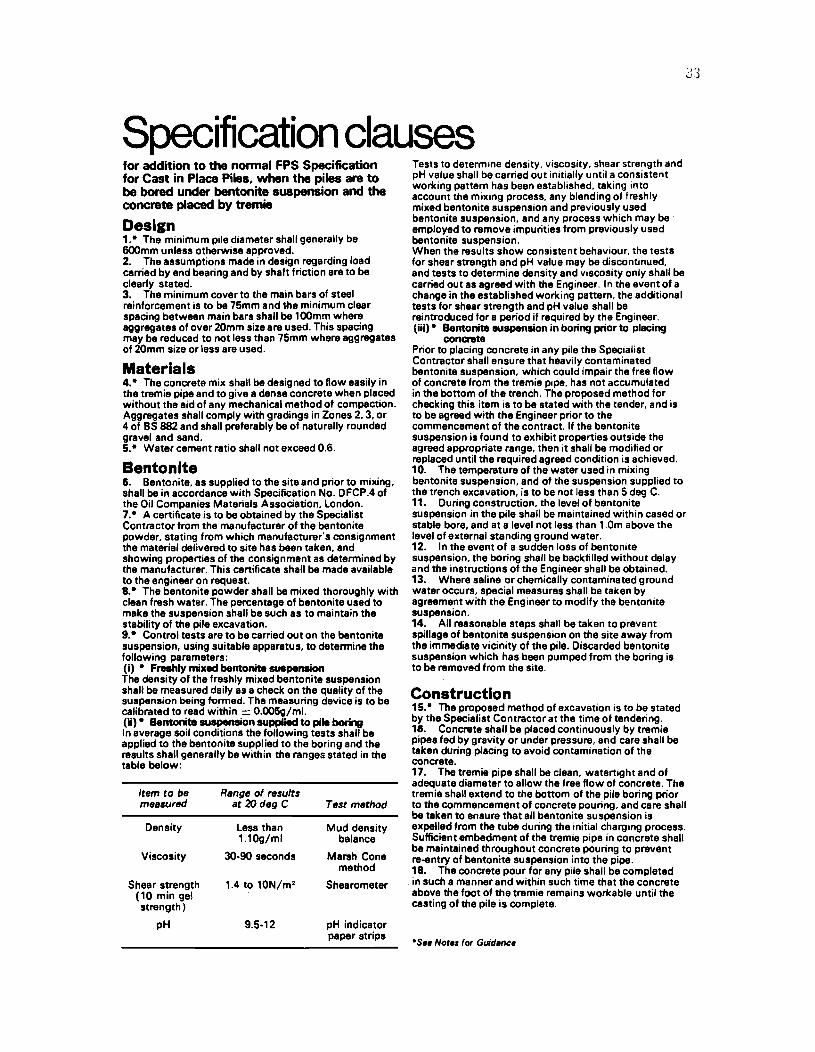
Specification clauses for addition to the normal FPS Specification for Cast in Place Piles, when the piles are to be bored under bentonite suspension and the concrete placed by tremia
Design 1.· The minimum pile diameter shall generally be 600mm unless otherwise approved. 2. The assumptions made in design regarding load carried by end bearing and by shaft friction are to be clearly stated. 3. The minimum cover to the main bars of steel reinforcement is to be 75mm and \he minimum clear spacing between main bars shall be 100mm where aggregates of over 20mm size are used. This spacing may be reducad to not less than 75mm where aggregates of 20mm size or less are used.
Materials 4.· The concrete mix shall be designed to flow easily in the tremie pipe and to give a dense concrete when placed without the aid of any mechanical method of compaction. Aggregates shall comply with gradings in Zones 2. 3. or 4 of BS 882 and shall preferably be of naturally rounded gravel and sand. 5.· Water cement ratio shall not exceed 0.6.
Bentonite 6. Bentonite. as supplied to the site and prior to mixing. shall be in accordance with Specification No. DFCP.4 of the Oil Companies Materials Association. London. 7.· A certificate is to be obtained by the Specialist Contractor from the manufacturer of the bentonite powder. stating from which manufacturer's consignment the material delivered to site has been taken. and showing properties of the consignment as determined by the manufacturer. This certificate shall be made available to the engineer on request. 8.· The bentonite powder shall be mixed thoroughly with clean fresh water. The percentage of bentonite used to make the suspension shall be such as to maintain the stability of the pile excavation. 9.· Control tests are to be carried out on the bentonite suspension. using suitable apparatus, to determine the following parameters: (i) • Freshly mixed bentonite suspension The density of the freshly mixed bentonite suspension shall be measured daily as a check on the quality of the suspension being formed. The measuring device is to be calibrated to read within ± O.OO5g/ml. (Ii)· Bentonite suspension supplied to pile boring In average soil conditions the following tests shall be applied to the bentonite supplied to the boring and the results shall generally be within the ranges stated in the table below:
Item to be measured
Density
Viscosity
Shear strength (10 min gel strength)
pH
Range of results at 20deg C
Less than 1.10g/ml
30-90 seconds
1.4 to 10N/m2
9.5-12
Test method
Mud density balance
Marsh Cone method
Shearometer
pH indicator paper strips
Tests to determine density. viscosity. shear strength and pH value shall be carried out initially until a consistent working pattern has been established. taking into account the mixing process. any blending of freshly mixed bentonite suspension and previously used bentonite suspension. and any process which may be employed to remove impurities .from previously used bentonite suspension. When the results show consistent behaviour. the tests for shear strength and pH value may be discontinued. and tests to determine density and viscosity only shall be carried out as agreed with the Engineer. I n the event of a change in the established working pattern. the additional tests for shear strength and pH value shall be reintroduced for a period if required by the Engineer. (iii)· Bentonite suspension in boring prior to placing
concrete Prior to placing concrete in any pile the Specialist Contractor shall ensure that heavily contaminated bentonite suspension. which could impair the free flow of concrete from the tremie pipe. has not accumulated in the bottom of the trench. The proposed method for checking this item is to be stated with the tender. and is to be agreed with the Engineer prior to the commencement of the contract. If the bentonite suspension is found to exhibit properties outside the agreed appropriate range. then it shall be modified or replaced until the required agreed condition is achieved. 10. The temperature of the water used in mixing bentonite suspension. and of the suspension supplied to the trench excavation. is to be not less than 5 deg C. 11. During construction. the level of bentonite suspension in the pile shall be maintained within cased or stable bore. and at a level not less than 1.0m above the level of external standing ground water. 12. In the event of a sudden loss of bentonite suspension. the boring shall be backfilled without delay and the instructions of the Engineer shall be obtained. 13. Where saline or chemically contaminated ground water occurs, special measures shall be taken by agreement with the Engineer to modify the bentonite suspension. 14. All reasonable steps shall be taken to prevent spillage of bentonite suspension on the site away from the immediate vicinity of the pile. Discarded bentonite suspension which has been pumped from the boring is to be removed from the site.
Construction 15.· The proposed method of excavation is to be stated by the Specialist Contractor at the time of tendering. 18. Concrete shall be placed continuously by tremie pipes fed by gravity or under pressure. and care shall be taken during placing to avoid contamination of the concrete. 17. The tremie pipe shall be clean. watertight and of adequate diameter to allow the free flow of concrete. The tremie shall extend to the bottom of the pile boring prior to the commencement of concrete pouring. and care shall be taken to ensure that all bentonite suspension is expelled from the tube during the initial charging process. Sufficient embedment of the tremie pipe in concrete shall be maintained throughout concrete pouring to prevent re-entry of bentonite suspension into the pipe. 18. The concrete pour for any pile shall be completed
. in such a manner and within such time that the concrete above the foot of the tremie remains workable until the casting of the pile is complete.
·s .. Notlls for GuidlllCII
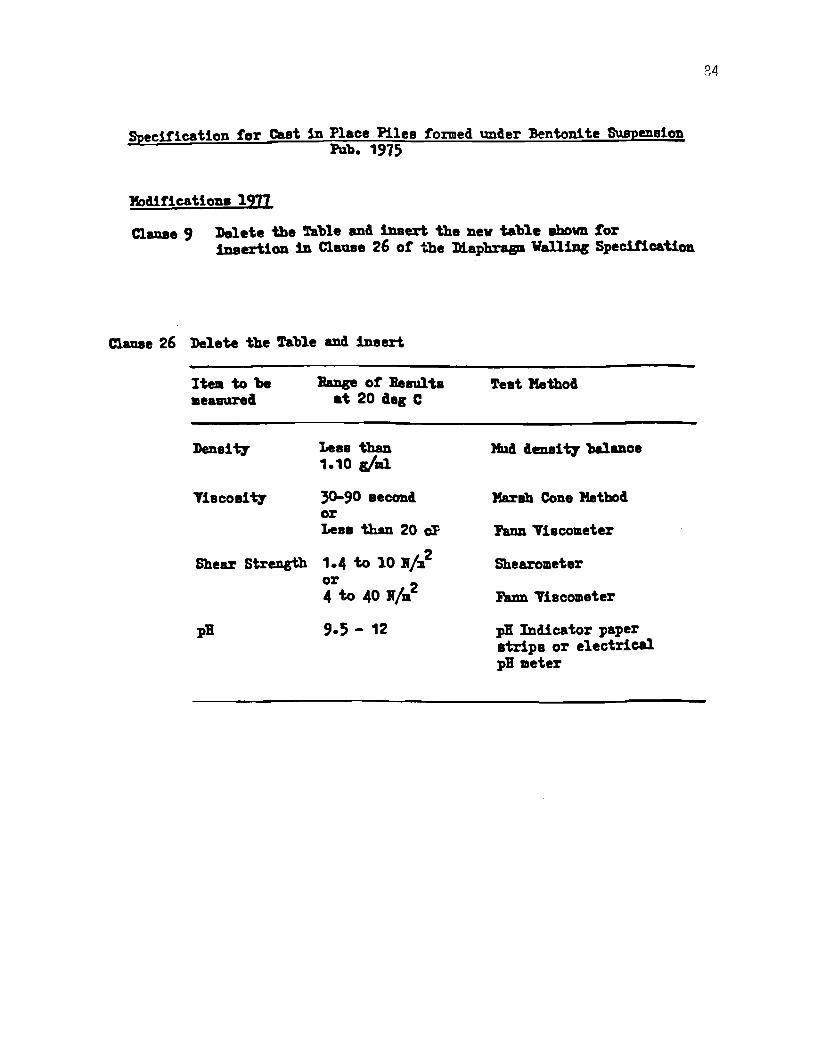
Specification tor Cast in Place Piles formed UDder :BentoDi te Suspensioll Pub. 1975
1'.od!t1catiOIlB 1971
Clawte' Delete the ~ble and iDaert tbe Dew table ahovn for iDsert10n 111 Clause 26 at the Dlapbrap Walling Spec1ticati01l
Claue 26 Delete the !fable and iDaert
Item to 'be BaDp at lIeaulta '.l'eat Method measured at 20 aeg C
Denaiv Leaa thaD Mud lenai V balec. 1.10 £Iml
Viacoaiv 30-90 aeCOlld Marsh Colle Method or Lesa thm 20 cP FanD Viacometer
Shear Strength 1.4 to 10 III Shearometer or 4 to 40 If/m
2 FaJm Viscometer
pB '.5 - 12 pB Indicator paper stripa or electrical pB meter
84
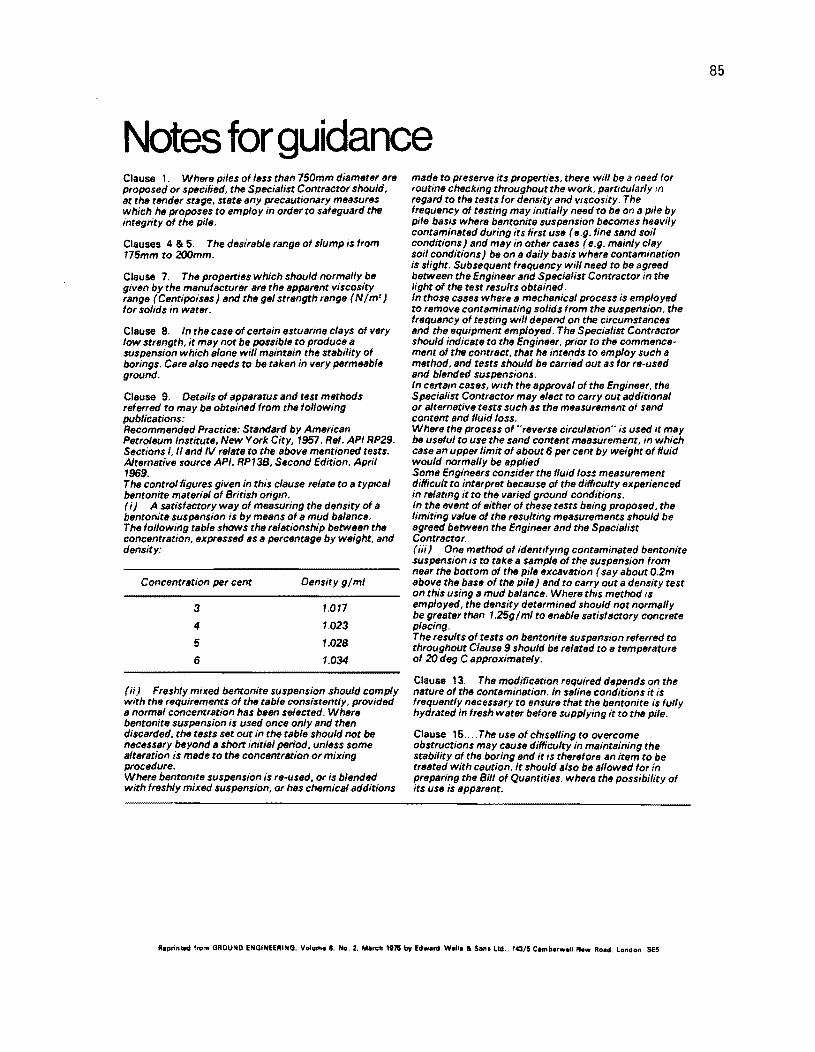
Notes for guidance Clause 1. Where piles of less than 750mm diameter are proposed or specified, the Specialist Contractor should, at the tender stage, state any precautionary measures which he proposes to employ in order to safeguard the integrity of the pile.
Clauses 4 & 5. The desirable range of slump is from 175mm to 2OOmm.
Clause 7. The properties which should normally be given by the manufacturer are the apperent viscosity range (Centipoises) and the gel strength range (N 1m' ) for solids in water.
Clause 8. In the case of certain estuarine clays of very low strength, it may not be possible to produce a suspension which alone will maintain the stability of borings. Care also needs to be taken in very permeable ground.
Clause 9. Details of apparatus and test methods referred to may be obtained from the following publications: Recommended Practice: Standard by American Petroleum Institute, New York City, 1957. Ref. API RP29. Sections I, /I and N relate to the above mentioned tests. Alternative sourCe API. RP13B, Second Edition, April 1969. The control figures given in this clause relate to a typical bentonite material of British origin. (i) A satisfactory way of measuring the density of a bentonite suspension is by means of a mud balance. The following table shows the relationship between the concentration, expressed as a percentage by weight, and density:
Concentration per cent
3
4
5
6
Density glml
1.017
1.023
1.028
1.034
(Ii) Freshly mixed bentonite suspension should comply with the requirements of the table consistently, provided a normal concentration has been selected. Where bentonite suspension is used once only and then discarded, the tests set out in the table should not be necess8ry beyond a short initial period, unless some alteration is made to the concentration or mixing procedure. Where bentonite suspension is re-used, or is blended with freshly mixed suspension, or hes chemical additions
made to preserve its properties, there will be a need for routine checking throughout the work, particularly In regard to the tests for density and viscosity. The frequency of testing may initially need to be on a pIle by pile basis where bentonite suspension becomes heavily contaminated during its first use (e.g. fine sand soil conditions) and may in other cases (e.g. mainly clay soil conditions) be on a daily basis where contamination is slight. Subsequent frequency will need to be agreed between the Engineer and Specialist Contractor in the light of the test results obtained. In those cases where a mechanical process is employed to remove contaminating solids from the suspension, the frequency of testing will depend on the circumstances and the equipment employed. The Specialist Contractor should indicate to the Engineer, prior to the commencement of the contract, that he intends to employ such a method, and tests should be carried out as for re-used and blended suspensions. In certain cases, with the approval of the Engineer. the Specialist Contractor may elect to carry out additional or alternative tests such as the measurement of sand content and fluid loss. Where the process of "reverse circulation" is used it may be useful to use the sand content measurement, in which case an upper limit of about 6 per cent by weight of fluid would normally be applied Some Engineers consider the fluid loss measurement diNicult to interpret because of the diHiculty experienced in relating it to the varied ground conditions. In the event of either of these tests being proposed, the limiting value oJ the resulting measurements should be agreed between the Engineer and the Specialist Contractor. (iii) One mflthod of identifying contaminated bentonite suspension is to take a sample of the suspension from near the bottom of the pile excavation (say about 0.2m above the base of the pile) and to carry out a density test on this using a mud balance. Where this method is employed, the density determined should not normally be greater than 1.25g I ml to enable satisfactory concrete placing. The results of tests on bentonite suspension referred to throughout Clause 9 should be related to a temperature of 20 deg C approximately.
Clause 13. The modification required depends on the nature of the contamination. In saline conditions it is frequently necessary to ensure that the bentonite is fully hydrated in fresh wate, before supplying it to the pile.
Clause 15.. . The use of chiselling to overcome obstructions may cause diNiculty in maintaining the stability of the boring and it is therefore an item to be treated with caution. It should also be allowed for in preparing the Bill of Quantities. where the possibility of its use is apparent.
llaprintod from GROUND ENGINEERING. VoIum.8. No.2. Mlreh 1911 by Edwanl W.lla • Son" Lid .. 143/5 Camborw.n N.w Road. London. SE5
85