Embed Size (px)
Citation preview
DESIGN CHARTSFOR
CATCH BASIN OPENINGSAS DETERMINED BY
EXPERIMENTAL HYDRAULICMODEL STUDIES
BUREAU OF ENGINEERINGCity of Los Angeles
LYALL A. PARDEECity Engineer
OFFICE STANDARD NO. 108STORM DRAIN DESIGN DIVISION
1965

OFFICE STANDARD NO. 108
DESIGN CHARTS
FOR
X-5 CATCH ?%SIN OPENINGS
AND
CATCII BASIN NO. 39, NO. liti AlJD NO. 47 OPENINGS
AS DETti!'IMINED BY
EXPERIKENTAS, HYDRAULIC i'4ODEL STUDIES
CONDUCTED BY
BUREAU 93 EiGI.hiERING
CITY OF LOS ANGELES
STORM DRAIN DESIGN DIVISION
PART I
PART II
PART III ADDED
PART IV ADDED
PART V ADDED
PART VI ADDED
PART VII ADDED
PART VIIIADDED
APRIL 1955
APRIL 1955
JULY 1956
MAY 1957
NOV. 1957
NOV. 1957
JAN. 1959
MAY 1961
L. 0. Tllrner - Division En@_neer 1955-1959 Ulmont Swan - Division Engineer 1960 To Date F. J. Dorm - Project Engineer
June 1, 1961

INDEX -----
Description and Use of Design Charts.
Sample Problem.
Supplement No. 1.
Supplement No. 2
PART I - C.B. No. 45 & No. 46 (X-5 Type Curb Opening).
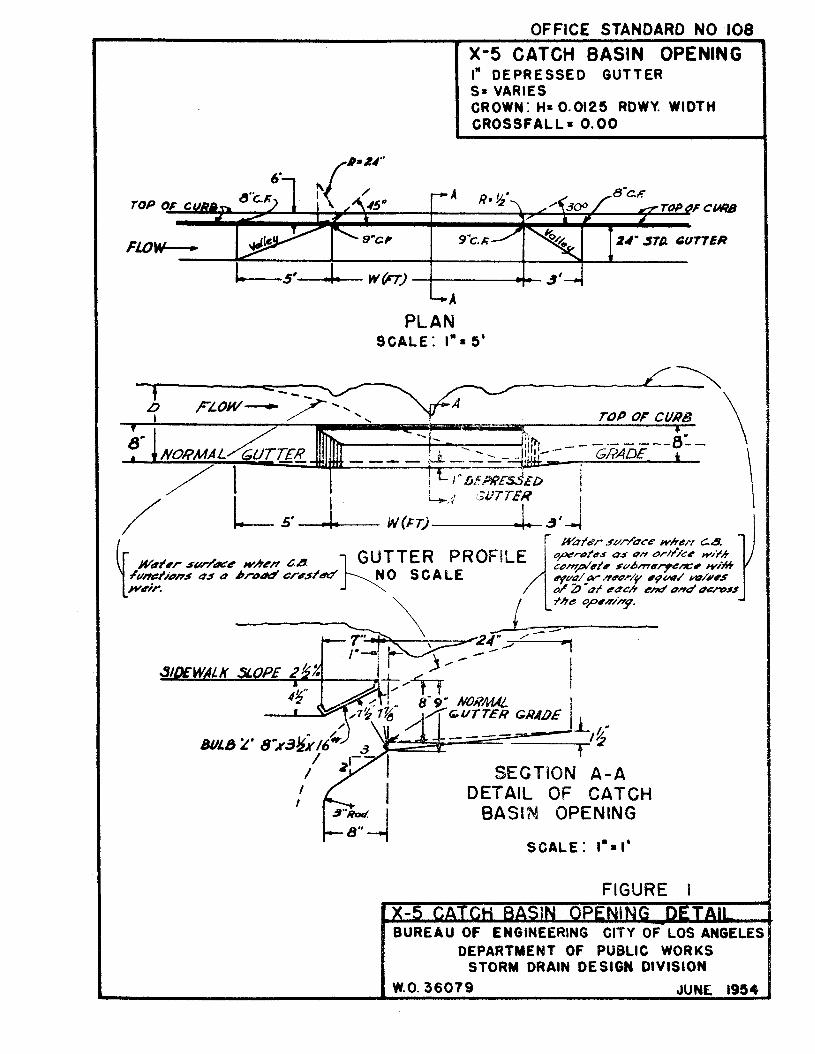
Fig. 1 - Dr-rta'_ls of X-5 Catch Basin Opening.
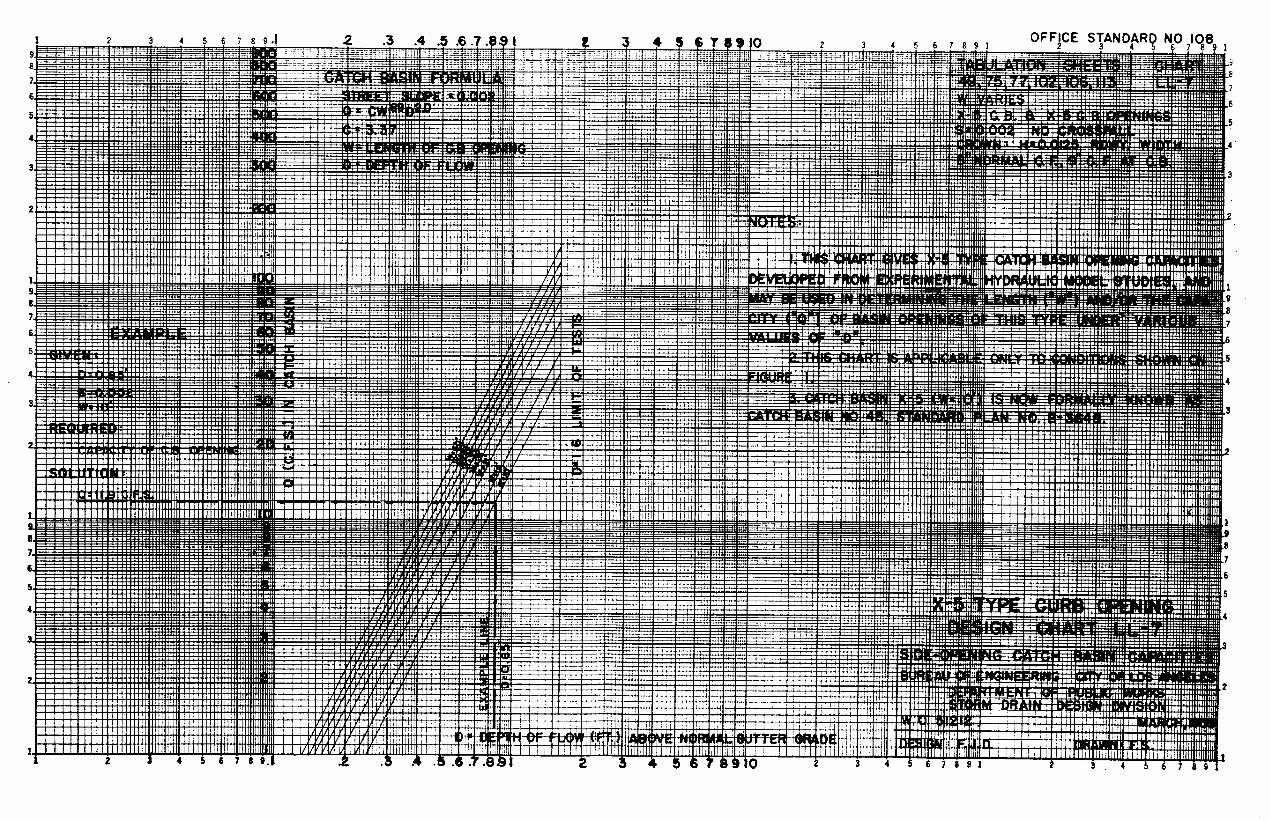
Chart LL-7 - Design Charts, S = 0.002.
Chart LL-8 - Desl.gn Charts, S = 0.005.
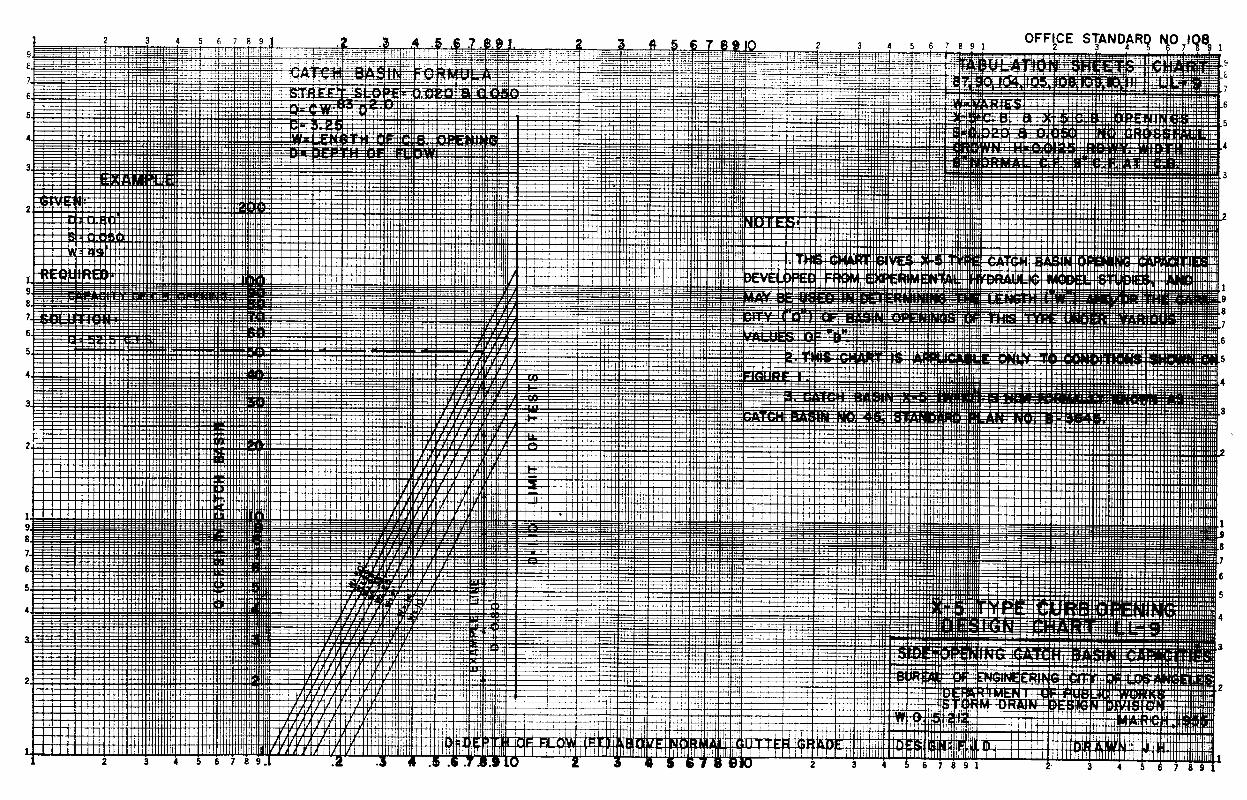
Char,? LL-g - Denigrj Charts, S = 0.02 and 0.05.
Chart LL-10 - Design Charts, Sump Conditions, S = Zero.
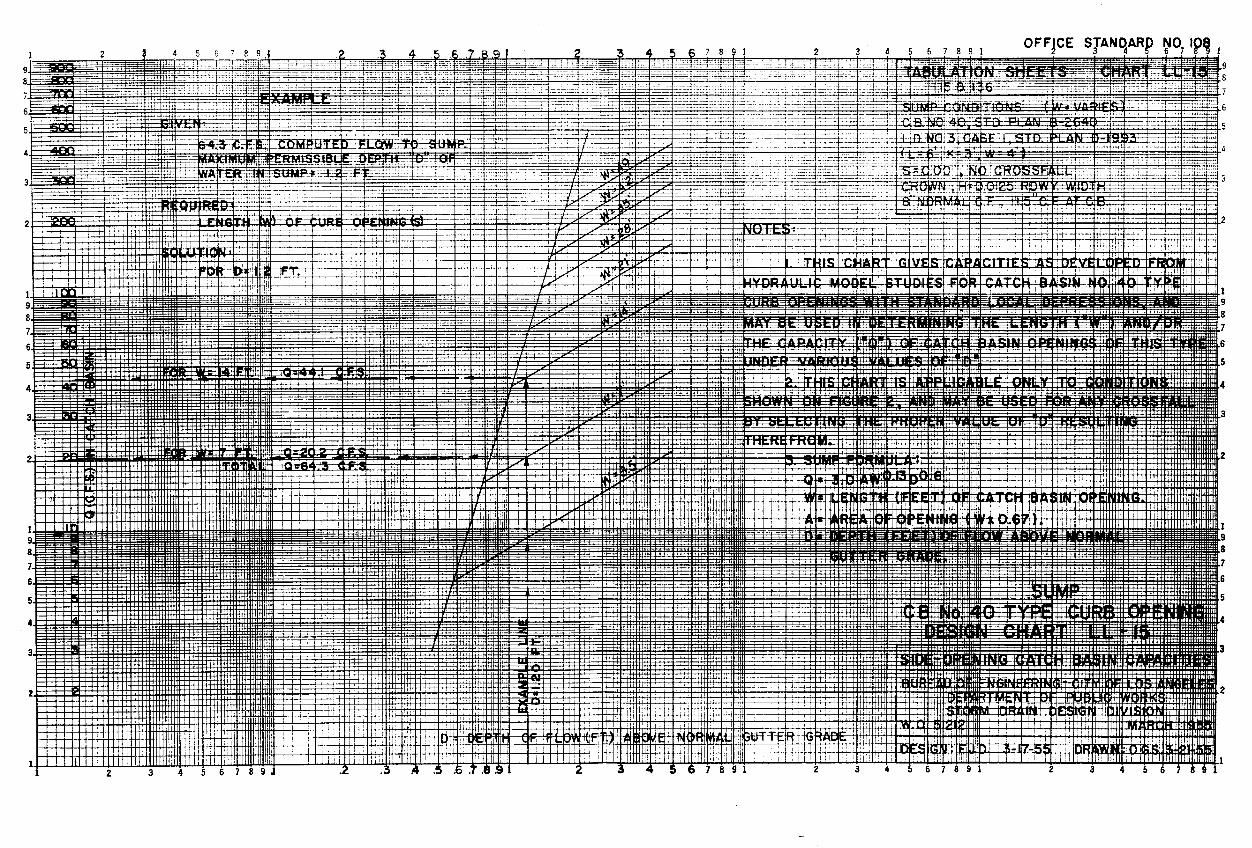
PART II - C.B. No. 40 Type Curb Opening.
Fig. 2 - Details of MO. 40 Type Basin Opening.
Chart LL-22 - Desigr; Charts, Sl = 0.002.
r,'!hart LL-.13 - Design Charts, S - 0.005.
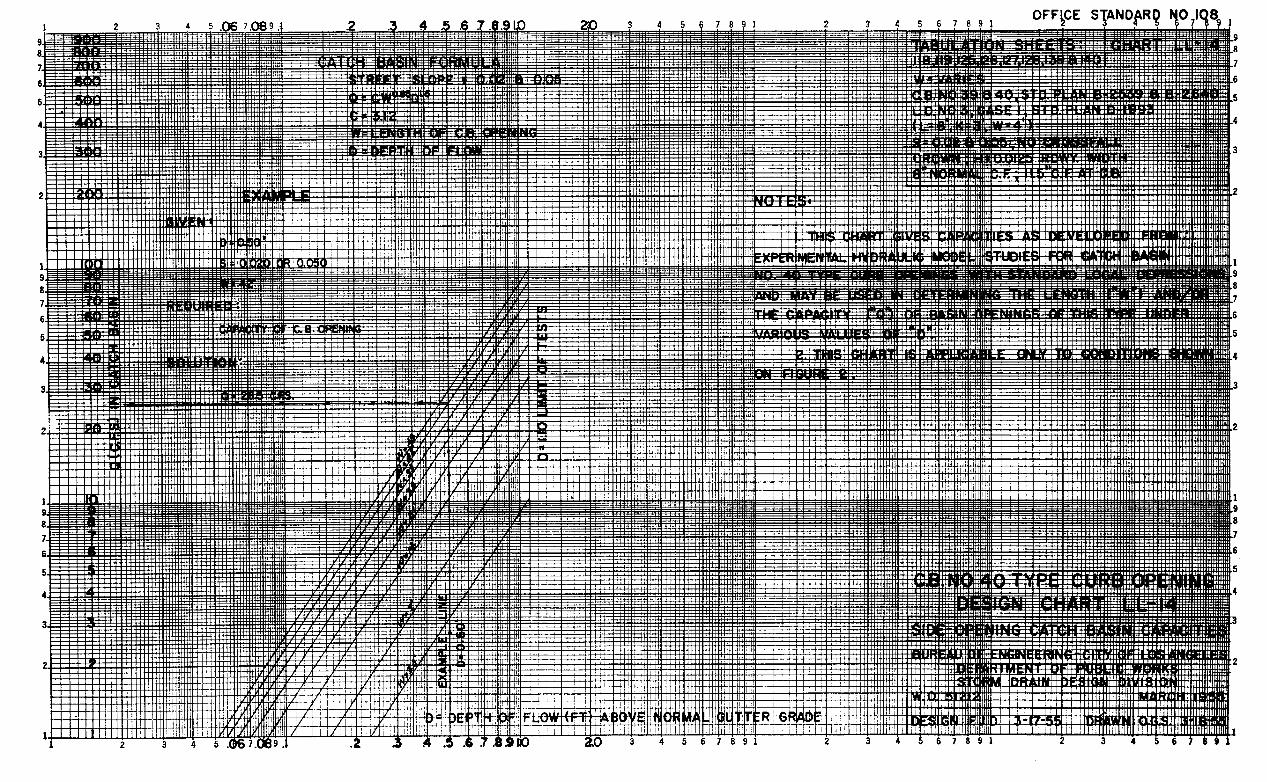
:7hart IL-14 -. Design Charts, S = 0.002 and 0.05.
chxrt I,L- I Ti - DesJ.gn Chart?;, Sump Conditions, S = Zero.
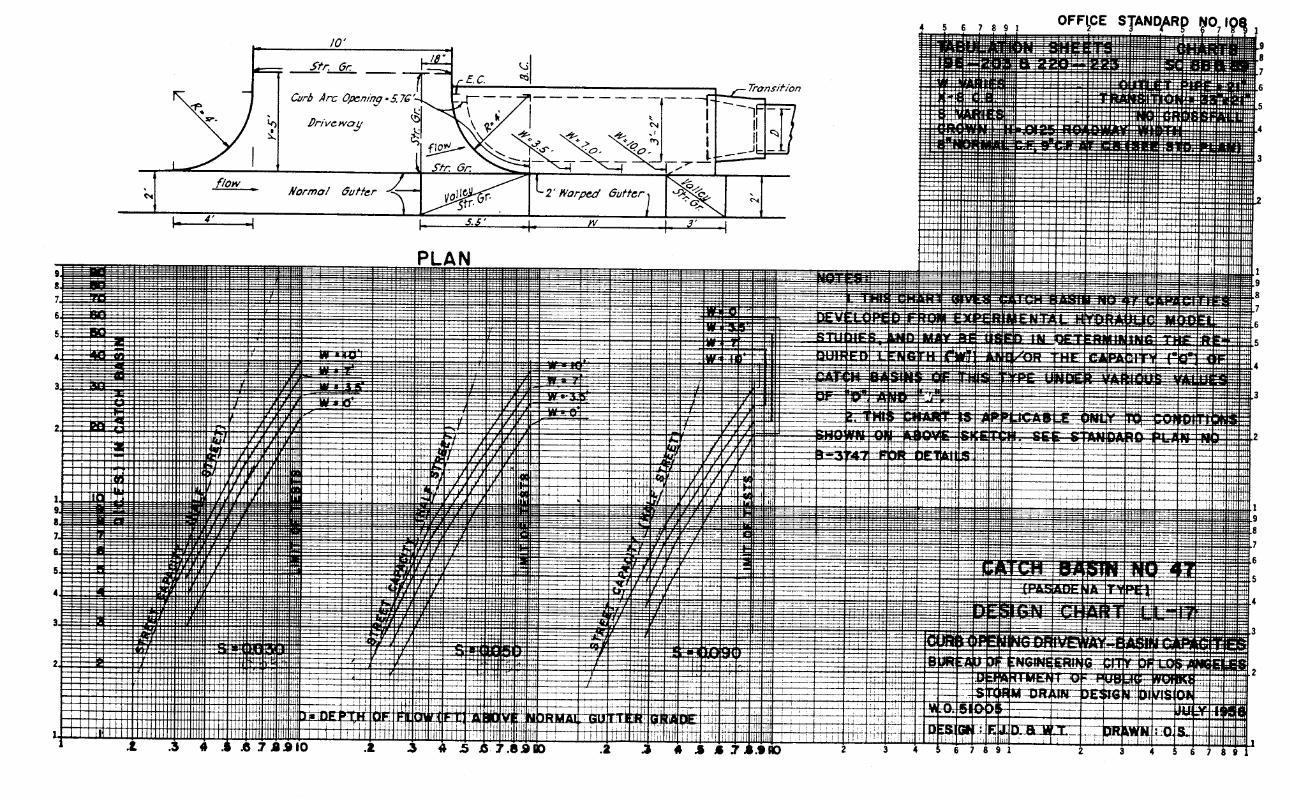
r: /\,v r II -. C.B. No. &7 (Pasadena Type) __ ~ -.._--__-_-----_-.. -_-.
ChTi rt; LEd-. 1 ii - Iksign Charts, S = 0.005; 0.01 and 0.02.
Chart LL-17 - Design Charts, S = 0.03; 0.05 and 0.09.

I N D E X (Continued) -es--
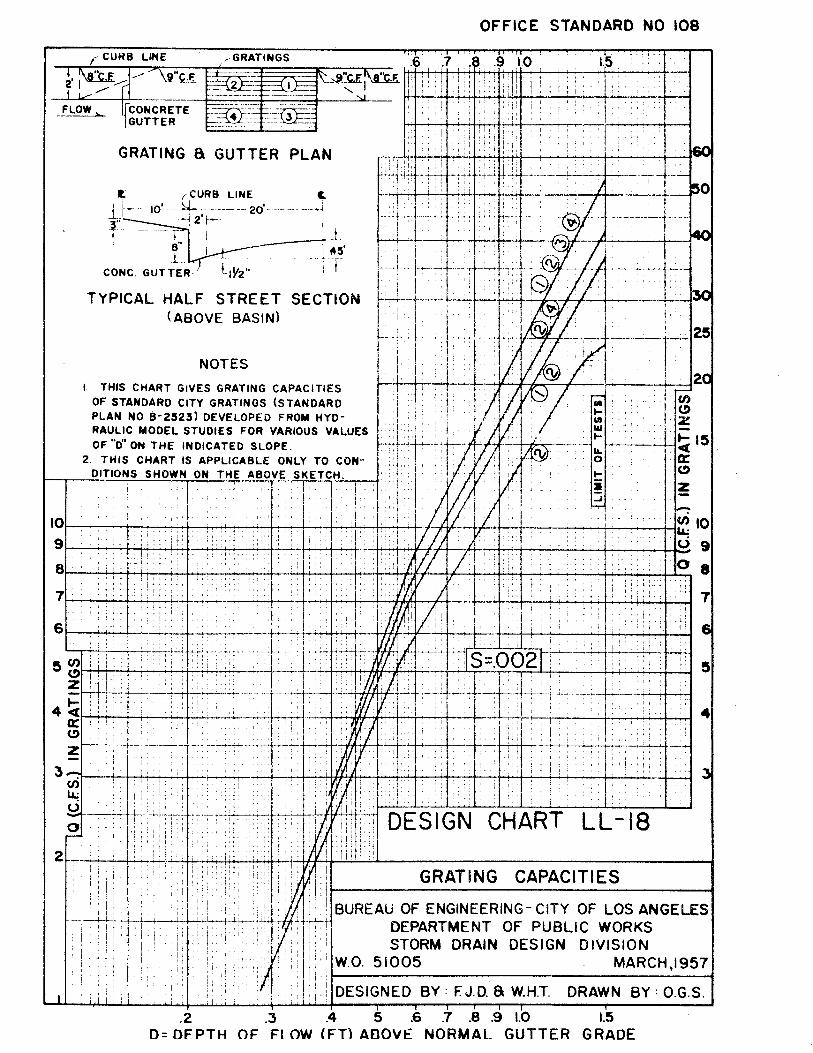
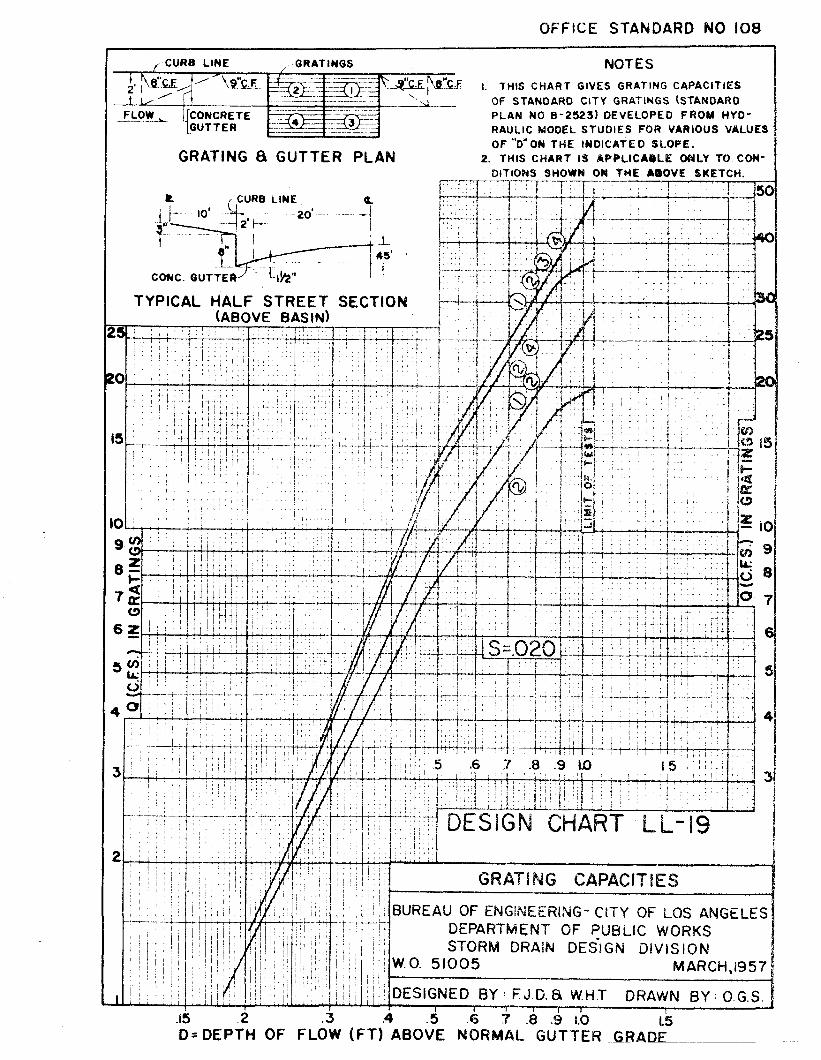
PART IV - City of Los Angeles Standard Grating Capacity Charts
.Chart No. ~~-18 - Standard Curb & Gutter, S = 0.002 u-19 - Standard Curb & Gutter, S P 0.020 LL-20 - Standard Curb & Gutter, S = 0.050 LL-21 - Standard Curb & Gutter, S - 0.090 LL-22 - Standard Curb & Gutter, All Slopes, Grating No. 2 LL-23 U-24
- Standard Curb & Gutter, All Slopes, Grating NO. 1 & 2 - Standard Curb & Gutter, All Slopes, Grating No. 2 bt 4
LL-25 - Standard Cu.rb & Gutter, All Slopes, Gratin NO. 1, 2, 3 and &
PART VII - Description and Use of Catch Basin Connecting Pipe Capacity Charts, combined with "Catch Basin Outlet Transition Structure."
Chart No. 1. - Full PFpe (with Standard Transition Structure) 2. - Control At Inlet (with Standard Transition)
PART VIII - Description and Use of Catch Basin Connecting Pipe Capacity Charts, without Catch Basin Outlet Transition Structure.
Chart No, Full Pipe (without Standard Transition Structure) Control at 'mwlthout Standard Transitlon Structure.)
Added 3/3/!j9 Added 2/j/60
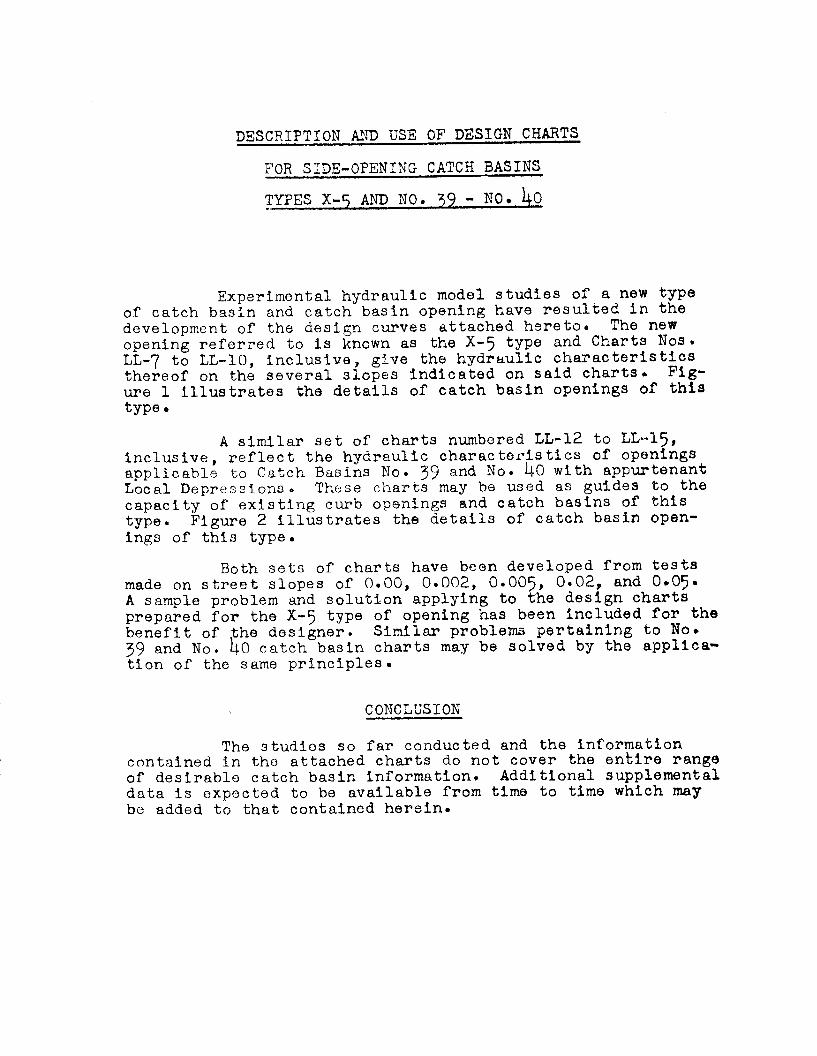
DESCRIPTION AND USE OF DESIGN CHARTS
FOR SIDE-OPENING CATCH BASINS
TYPES X-5 AND NO. 39 - NO. 40
Experimental hydraulic model studies of a new type of catch basin and catch basin opening have resulted in the development of the design curves attached hereto@ The new opening referred to is known as the X-5 type and Charts Nos. LL-7 to LL-10, inclusive, Q ive the hydraulic characteristics thereof on the several slopes indicated on said charts. Fig- ure 1 illustrates the details of catch basin openings of this type.
A similar set of charts numbered LL-12 to LL-15, inclusive, reflect the hydraulic characteristics of openings applicable to Catch Basins No. 39 and No. 40 with appurtenant Local Depressions. These charts may be used as guides to the capacity of existfng curb openings and catch basins of this type* Figure 2 illustrates the details of catch basin open- ings of this type.
Both sets of charts have been developed from tests made on street slopes of 0.00, 0.002, 0.005, 0.02, and 0.05. A sample problem and solution applying to the design charts prepared for the X-5 type of opening has been included for the benefit of the designer. Similar problems pertaining to No. 39 and No. 40 catch basin charts may be solved by the appllca- tion of the same principles.
CONCLUSION
The studies so far conducted and the information contained in the attached charts do not cover the entire range of desirable catch basin information. Additional supplemental data is expected to be available from time to time which may be added to that contained herein.

SAMPLE PROBLEM
USE OF DESIGN CHARTS
GIVEN a
The storm water flow in half a street, constructed on a 0.02 slope, is 90 cfs. and the resultant computed depth of flow “D” above gutter grade is 0.85 feet.
REQIJIRED :
The number of basins and the length of each basin of the X-5 type of opening required to intercept this flow.
SOLUTION:
1, Chart LL-9, S = 0.02 (indicates the capacities of catch basins of various lengths when D = 0.65 feet). The de- signer must now determine from field investigation and proper construction cost the most desirable catch basin length applic- able
feet this
The computed lrDll for 52.5 cfs, is 0.71, feet0
to the particular problem.
2. In this examplep a catch basin length “W” of 28 has been selected which has a capacity of 37@5 cfsr for depth of flowr
30 The difference between the total of 90 cfs. and cfs, (intercepted by the first basin) leaves a remainder of cfs. to be -intercepted by the next or succeeding basins.
4. Again assuming a desirable length of basin of 28 feet, Chart LL-9 indicates that such a basin will intercept 26.0 cfs. cfs.
at a value of “D” of 0.71 feet, leaving a remainder o;hz6.5 to be intercepted by the next or succeeding baains.
calculated “D” for 26.5 cfs. is ,0s60 feet.
r. pacity of 1 d
From Chart LL-9 a 28-foot basit ;ould have a ca- .5 cfs. for a 0.60 foot value of D , leaving a re-
sidual flow of 8 cfs. to be intercepted by a fourth basin,. How- ever, further examination of this chart Indicates that a 42-foot basin will intercept the entire flow of 26.5 cfs. with a depth of 0.60 feet. It remains next for the designer to best judge from the available alternatives which selection of catch basin lengths will best fit the local conditionsr
C OMMENT :
From the above, it is evident that a f afrly wide choice of number and lengths of basins (depending upon local conditions and economic factors) is available to the designer by the intelligent use of these charts. In general the effi- ciency, per foot of length of basin, becomes less as the length of the basin increases. Conversely the efficiency, per foot of basin, increases as its length is reduced6 Economics as well as limiting physics1 conditions, therefore, control the number and. length of basins required to intercept a given quantity of water.
OFFICE STANDARD NO. 108
SUPPLEMENTAL INSTRUCTIONS
August 15, 1955
Since the issuance of this standard, a number of in- stanaes of improper appiiaation and/or interpretation of the use thereof has come to our attention. LL-10 inalusive,
Charts Nos. LL-7 to
Charts Nos. appliaable to the X-5 type of basin, and
LL-12 to LL-15 inclusive, applicable to types 39 and 40 basins (having appurtenant local depressions) were de- veloped to indicate the 'Maximum Interception" of eaah typfi $’ basin for each length on each slope for various values of D . From the experimental data accumulated in the model study, formulas applicable to each chart were developed and the curves shown thereon have been plotted from these formulas.
Subsequent to the issuance of this office standard, attempts have been made to use these charts to determine "Total Interception" of small quantities of water. The charts were not basically conceived or developed to answer such questions. More recent model study has indicatad a deviation between the actual measured quantities of "Total Interception“ and the theoretical quantities cated of "D" (generally below
on the charts for small values feet to Oo7 feet prototype)o
The experimental model studies from which these charts were derived were based upon streets of zero crossfall, uniform crown height "H" (above gutter) of 000125W, where '(H" and "W" are measured in feet0 A specific "Street Capacity" curve should tendeveloped using increasing values of "'3" and proper values of
S for this or any other specific street cross section being studied0 Curve,
When this curve is superimposed on the proper Design the specific use of the Design"CJI.r 1 *r~ is limited to those
Points to the right of and above the Conversely,
Street Capacit$' curve0
capacity" all points to the left of and below the Street
curve are imaginary" In al.1 ca::~s it should be recog- nized that it is necessary to determine the correct value of "D" to seaure valid results and "D" is extremely critical on most street sections when Q fs small, say less than 5 cfsO
For those who desire specific solutions of "Total In- terception" for each of the two general types of catch basins
streets having the characteristics used in the model study, % attached tabulations developed from the model study will supply the desired answerss under any circumstances,
Xt should not be assumed, however, that these answers are applicable to
streets of other crowns and cross sections0
LOT:cd Bureau of Engineering City of Los Angeles Storm Drain Design Division

Bureau of Engineering OFYICE STANDARD NO. 108 city or Loa An@3108 Supplsmemt No. 1 Stoma Drain Design Division August 1955
TABULATION OF TOTAL (1005) IFJZBCEPTION For X-5 Type Catch Basin (See Fibte I)_
On Streeta With Crown H = 0.0129Y Where H and W Am
Total rnterceptfon Formula Q =
Height Measured fn Feat
On Streets With Crown Height H P o~n25w where PI and W Are Measured im Feet
Total Interception Formula Q = 0~353Vf 0.924

SUPPLEMENT NO. 2 OFFICE STANDARD NO. 108 SUPPLEKFWTAL INSTRUCLPIONS
JULY 17, 1959
Since the issuance of this Standard, a number of instances of impro er application of Catch Basins Nos. 45, 4% and 47 with (1 t; Standard Catch 13asin Outlet Structure, and (2) Catch Basin Connecting Pipe Size have comae to our attention.
The efficient of these catch basins is de endent upon the following: (I_7 the improved curb inlet (27 the scientifically shaped catch basin with the propeG value of "V" (depth of basin), (3) the tapered transition section between the lower end wall of the catch basin and the outlet pipe, and (4) a catch basin connecting pipe of proper size and slope.
The following statements of policy are issued for the designer's information and guidance:
1.
2.
3>.
Catch Basins Nos. 45, b6, and 4'7. These catch basins should "Standard C&l;
LL~ most cases> be specifZed with a 3ttsin Outlet Structure" (St&-d
Plan No. B-3649), with the following exception. When the quantity of water to be intercepted by the catch basin is less than 10 cfs., the 'Standard Catch Basin Outlet Structure" viding "V"
ma;l be omitted, (depth of catch basin] is 5 feet or
pro-
more I and " (diameter of catch basin connecting
pipe is 18 inches or greater.
Connecting Pipes. The ;ninimum diameter for catch basin connecting pipe shall. be 18 inches.
Curb Face. The effect of increasing the curb face t the catch basin from 9 inches to 10 inches, as
tas been suggested, is as follot\rs:
a. - The catch basin capacity chart values (Office Standard Rro. 108, Parts I and III) may be in- creased by approximately i0 per cent for values of "Q" greater than those shown in the "Tabula- tion of Total Interception" (Supplenu3nt No. 1, dated August 1955). This increase in capacity varies somewhat with "D" depth of flow In the gutter above the catch basin, "a" slope of the gutter, and "I?" Width of the catch basin opening. When the curb face exceeds 9-k inches, a plain round protection bar 1 inch in diameter is re- quired.
-2-
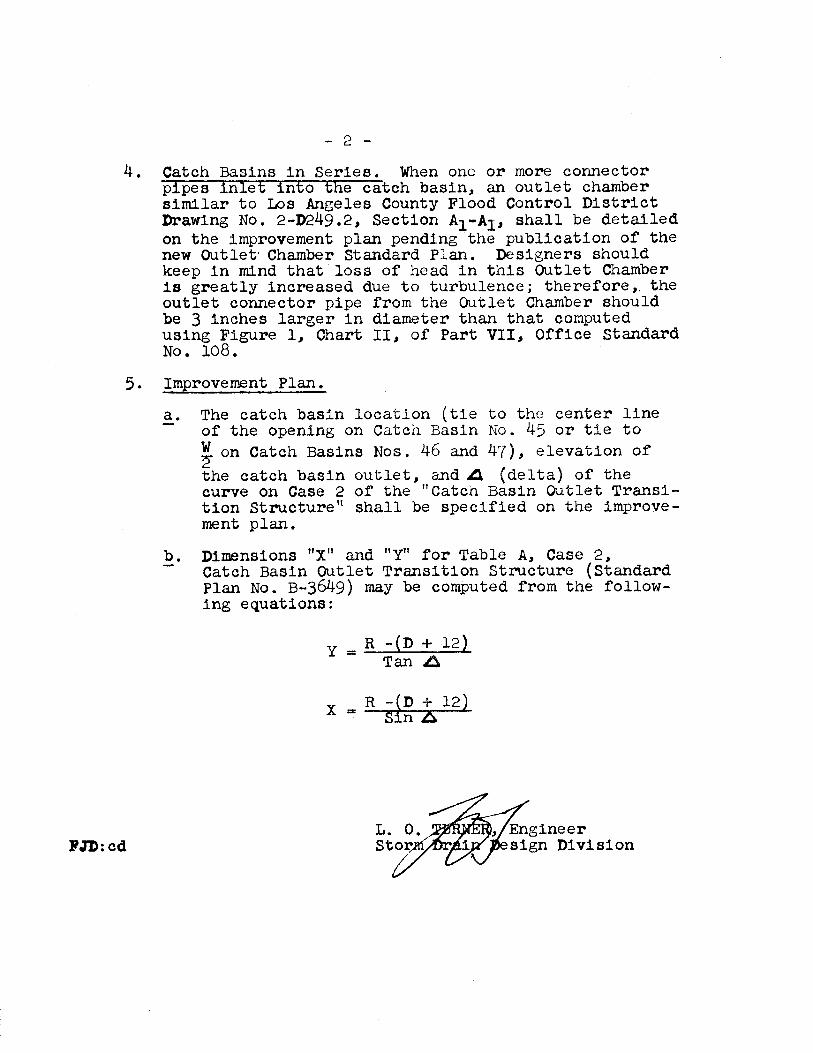
4. Catch Basins in Series. When one or more connector pipes inlet i t the catch basin, an outlet chamber similar to Lot kgeles County Flood Control District Drawing No. 2-D249.2, Section Al-AI, shall be detailed on the improvement plan pending the publication of the new Outlet Chamber Standard Plan. Designers should keep in mind that loss of head in this Outlet Chamber is greatly increased due to turbulence; therefore,, the outlet connector pipe from the Outlet Chamber should be 3 inches larger in diameter than that computed using Figure 1, Chart II, of Part VII, Office Standard No. 1.08.
5. Improvement Plan.
a. The catch basin location (tie to the center line - of the opening on Catch Basin No. 45 or tie to w on Catch Basins Nos. 46 and 471, elevation of z? the catch basin outlet, anda (delta) of the curve on Case 2 of the "Catch Basin Outlet Transi- tion Structure'" shall be specified on the improve- ment plan.
b. Dimensions "X" and "Y" for Table A, Case 2, Catch Basin Outlet Transition Structure (Standard Plan No. B-3649) may be computed from the follow- ing equations:
YzR -(D + 12) Tan&$
FJD: cd sign Division
OFFICE STANOARD NO 108
I v X-5 CATCH BASIN OPENING I” DEPRESSED GUTTER S. VARIES CROWN: H= 0.0125 RDWY. WIDTH CROSSFALLs 0.00
q-- Y-l -A
PLAN SCALE: 1”s 5’
SECTION A-A DETAIL OF CATCH
BASIN OPENING
SCALE: l”=i’
I FIGURE I
BUREAU OF ENGiNEERlNG CITY O+-LOS ANGELE! DEPARTMEN? OF PUBLIC WORKS
STORM DRAIN DESIGN DIVISION
w 1 W.O. 36079 JUNE I954


OFFiCE STANDARD NO 108
STANDARD CATCH BASIN OPENING L.D. NO 3 CASE i 1 STD. PLAN D- 1993) S= VARiES, Il.5 C.F AT C.B. CROWN: H=0.0125 RDWY WIDTH CROSSFALL = 0.00
DEPARTMENT OF PUBLIC WORKS STORM DRAiN DES1GN DsVlSION
MARCH SSSS


Office Standard No. 108
PART IV
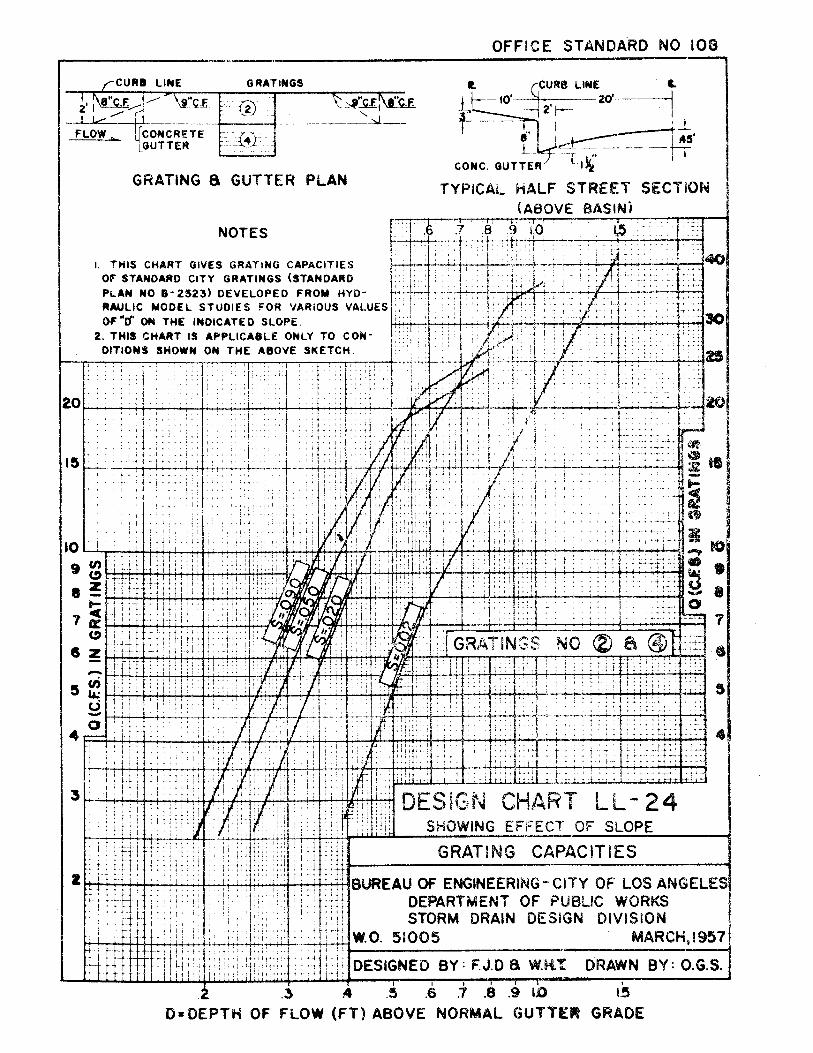
DESCRIPTION AND USE OF GRATING CAPACITY CHARTS
These charts represent the results of Hydraulic Model tests of Standard City gratings (Standard Plan No. B-2523) on half of a typical 6C-foot street, 40 feet between curbs, normal 8-inch curb face, g-inch curb face at gratings, 2-foot gutters, and height of crown above the outside edge of the gutter = .0125 x 36 = .45 feet.
Hydraulic Model tests indicate that the use of 3/4- inch spacers (city Standard Plan No. B-3656 and Des Angeles County Flood Control District Drawing No, 2-D227) instead of l-inch spacers on grating catch basins will Ireduce the inter- ception capacity by as much as 5 per cent, when the grate or grates are clean and completely covered with water. When the grate or grates are only partially covered, no reduction in lnter- ception will occur.
In using these cl‘iialats, consideration must be given to the fact that gratings have a tendency ta clog with debris, such as leaves and paper, and the interception capacities indicated are, therefore, the maximum which can be anticipated. The lower end of each curve indicates "Total Interception" for the slope and grating(s) referred to.
FJD:cd h-25-57
OFFICE STANDARD NO 108
FLOW ~ _- ( CONCRETE
F .GUTTER
GRATING 8 GUTTER PLAN
? /,cURB LINE 5
TYPICAL HALF STREET SECTION (ABOVE BASIN)
NOTES
I. THIS CHART GIVES GRATING CAPACITIES
OF STANDARD CITY GRATINGS (STANDARD PLAN NO B-2523) DEVELOPED FROM HYD- RAULIC YODEL STUDIES FOR VARIOUS VALUES
OF “If ON THE INDICATED SLOPE. 2. THIS CHART IS APPLICABLE ONLY TO CON-
DITIONS SHOWN ON THE ABOVE SKETCH.
i--q-q-i
DESIGN CHART LL-18
GRATBNG CAPACITIES
: !iDESIGNED BY : FJ.D. & W.H.T. DRAWN BY : 0.G.S 1 I , I 1 I , I
2 3 .4 5 .6 J .8 .9 1.0 1.5 D= OFPTH OF FLOW (FTI ADOVE NORMAL GUTTER GRADE
OFFICE STANDARD NO 108
NOTES
I. THIS CHART GIVES GRATING CAPACITIES
OF STANOARO CITY GRATlNGS (STANDARO PLAN NO B-2323) DEVELOPED FROM HYO- RAULIC MODEL. STUDIES FOR VARIOUS VALUE
OF “D*ON THE INDlCAiEQ SLOPE.
GRATING 8 GUTTER PLAN 2. THIS CHART IS APPCICAIILE OevllY TO CON
DITIONS SHOWN ON -7% AOOVE 3KETCH. ~fy---J-:-T:----f-_~ , [ I
CONC. GUTTEd “hk” i I
TYPICAL tiALF STREET SECTION (ABOVE BASIN)
,;‘,,“‘:I .‘. :::: :I,,iI I , ,I ,/, ,,
‘-jj~i:~,;!,I:T-~ .(
M DRAlN DESkN DiVJSlON
D=DEPTH OF FLOW (FT) ABOVE NORMAL GUTTER..GBADF

--
NOTES I. THIS CHART GIVES GRATING CAPACITIES
OF STANDARO CITY GRATINGS (STANDARD PLAN NO B-2523) DEVELOPED FROM HYD-
RAULIC MODEL STUDIES FOR VARIOUS VALUE:
GRATING & GUTTER PLAN OF “D’*DN ?tiE INDICATED SLOPE.
2. THIS CHAWT IS APPLICABLE ONLY TO CON- DITICWS SHOWN ON THE ABOVE SKETCH.
3. THiS tRREGULAHlTY RESULTS FROM THE HYDRAULIC INTERFERENCE OF THE H BEAM
DEi=ARTMENT OF PUBLiC WORKS STORM DRAIN DESIGN Di’VlSlON
MARCH,195

OFFKE STANDARD NO I08
NOTES I. YHIS CHART GIVES GRATING CAPACITIES
of STANDARD CIYY GRATINGS (STANDARD
PLAN NO 8-2523) DEVELOPED FROM WYD-
RAULIC YODEL STUDIES FOR VARlOUS VALUES
GRATING & GUTTER PLAN
_.---- (Lo’.__-_-
OF “d’ ON THE INDICATED SLOPE.
2. THIS CHARY IS APPLICABLE ONLY TO CON-
DITIONS SHOWN ON THE ABOVE SKETCH. 3, THIS IRREOULARITY RESULYS FROM YHE
HYDRAULIC IflYEFWERf)cCE OF OWE H WEAM SUPPORtING THE A0JOWIWG G~AY~~GS.
-. __- -
CONC. GUTTE


OFFICE STANDARD NO. 1.08
PART VII
DESCRIR'ION AND USE OF
CATCH BASIN CONNBXI!?‘& _PJ?E CAPACITY CHARTS
Theee charts were developed from original studies
Wnducted by the Bureau of Engfneerlng in its Experimental
tiydrcLuPic Laboratory and apply specifically to Catch Basins
NOti. 45, 46, and 47 developed by the Laboratory, combined with
8ttandard "Catch BaeSn Outlet Transition Structure" also de-
veloped by the Laboratcwy. Thase atudieis, L5dng connecting
‘Yl3-m Hydr~~l~ ? t&t QF culverte” by F, T. Mavls Si:+ste College, Engineering tion $eriee lekxi8etin No. 56).
“Hydraul3.c~ of Yhoft Pipegs - Eiydratific Connec- t2on Commonly U ed Pipe Entx%.n@bs," John L. French (N&Mona1 Burn& of Stmdazds Report No. 4444).
CH,ART I ie based on the hypothesis that the catch
basin connecting pipe flowfs entirely fulL, and for a given
elevation between the headwater and tailwater levels.
CHART II la based on the hypoxesls that the maxi-
mum discharge of the c;atch basin connecting pipe is controlled
at tha inlet and ie a fusncticrn of “H”/“d” (headwater depth
above inlet invert and diameter of the catch basin connecting

-2-
pm) l Figure 2 of Chart II gives a graphical picture of
the controlling elements.
Figure 3 of .Chart II shows comparative curves of
“H’Y’d” ” Control at Inlet" discharge for (1) Square-edge
inlet (Mavis); (2) Rounded inlet, r = 0.25 d (French); and
(3) City of Los Angeles Design Curve developed from Catch
Basins Nos. 45, 46, and 47 in conjunction with "Catch Basin
Outlet Transition Structure."
LJZGEND
;;ag;;r of catch basin connecting pipe,
freeboard (tic:pth of water surface in catch basin below gutter).
acasleration due to gravity = 32.16.
difference in elevation of headwater and tailwate3? levels, in feet.
height of water in catch basin above invert of outlet pipe, in feet.
hv a velocity head = v2/2 g’ L ra length of catch basin connecting pipe, in
feet.
Q = discharge in second feet.
V P depth of catch basin (difference in eleva- tion between top of curb and catch basin outlet). (- H + f + curb face)
v hi average velocity in feet per second.
1. DIsCUSSION
a. A catch basin connecting pipe may flow either full
or partly full, depending upon the specific hydraulic conditions

-3-
under which it must operate. In part-full flow, the pipe
behaves as an open channel with a free surface. In full-
flow, the hydraulic gradient does not necessarily coincide
with the soffit of the pipe. The headwater level, however,
must be above the soffit of the pipe a distance of at least
equal to the velocity head. The complete range of hydraulic
relationships, between discharge and head on the catch basin
connecting pipe, includes both full-flow and part-full conditions.
b. When a catch basin connecting pipe is short, the
flow characteristics which are knfiuonced by the length become
comparatively unimportant y Con F‘::ciue:,v!t ly, the control section
is essentially at the Lnlet for a.i.1 conditions. Between the
part-full phase and full-flow phase, there is a transition
zone of pulsating flow in which the pipe is alternately full
and partly full. This condition exists when the discharge
from "K"/"d" and "h" are identical I)
C. Chart II, when used in connection with Chart I,
takes into consideration the complete range of hydraulic re-
lationships from a practical standpoint under average field
conditions, and gives the required "Ii" for a specified "Q"
and "d" from which a tinimum "V" may be readily determined
by the addition of the 6-inch value of "f" and the g-inch
curb face.
d. As previously stated, the maximum discharge capacity
of the catch basin connecting pipe may be a function of either
-4-
"h" or "H"/"d." The discharge, using "h", may be less than,
or equal to, but never greater than, that obtained from using
"H"/,' d" . After computing the discharge using "h" and "H"/"d",
select the smaller of the two values as the design capacity
of the catch basin connecting pige.
2. GENERAL RULES
The following general rules are intended for use as
a guide in determining values of "d" and "V" when used in
connection with Catch Basin Nos. 45, 46, and 47 combined with
standard "Catch Basin Outlet Transition Structure." (See Fig.
1, Chart I and Fig. 2, Chart II for typical layout.)
a. Water surface (W.S.) elevation in the catch basin
should not be less than 6 inches below the gutter.
b. Soffit elevation of the upstream end of the "Catch
Basin Outlet Transition Structure" should not be less than 6
inches below the gutter.
c. The minimum "V" (depth of catch basin) is deter-
mined as follows:
(1)
(2)
(3)
For full pipes, Chart I
"V" = d + h, + 6” + 9” or d + 12" + 6” + g”, whichever gives the greater value of "V".
For control at inlet, Fig. 3, Chart II
“V” = "H" + 6” + 9” or d + 12" + 6” + g”, whichever gives the greater value of "V".
For control at inlet, Fig. 1, Chart II (full and partly full pipes)
-5-
For values of "H" above Line A-A "V" f "R" + 6" + 9”
For values of "ii" below Line A-A "V" E d + 12" + 6" + 9"
d, Water surface elevation (hydraulic grade) in the
main line conduit at the time of flow from the catch basin
connecting pipe may vary from a full pipe at the upper end of
the system to a partly full pipe at the lower end of the system.
This data can be computed from Table 6 of "Runoff Instructions
of 1939" (Office Szandard No, 71).
e. The catch basin connecting pipe should have a
mI_Mrmzm construction slope 0 f 0.015 and a velocity of 5 fps.
or greater.
f. The recommended minimum diameter for catch basin
u?onneet%ng pipes is 18 inches for City construction,
3. SAMPEE PROBLEH\I
a* Design Problem (Case 1).
~curb face
$&. The
sILev&&3n
The discharge from a Catch Basin No. 46 with p-inch
,and "C,atch E3asin Outlet Transition Structure" is 28
top of curb elevation is 100.00, hydraulic grade
at the main line 93.75, and the catch basin connecting .
pipe is $0_ fieet long. Determine the foilowing:
:(l‘) "d" (diameter of catch basin connecting pipe)
(2) "V" (depth of catch basin)
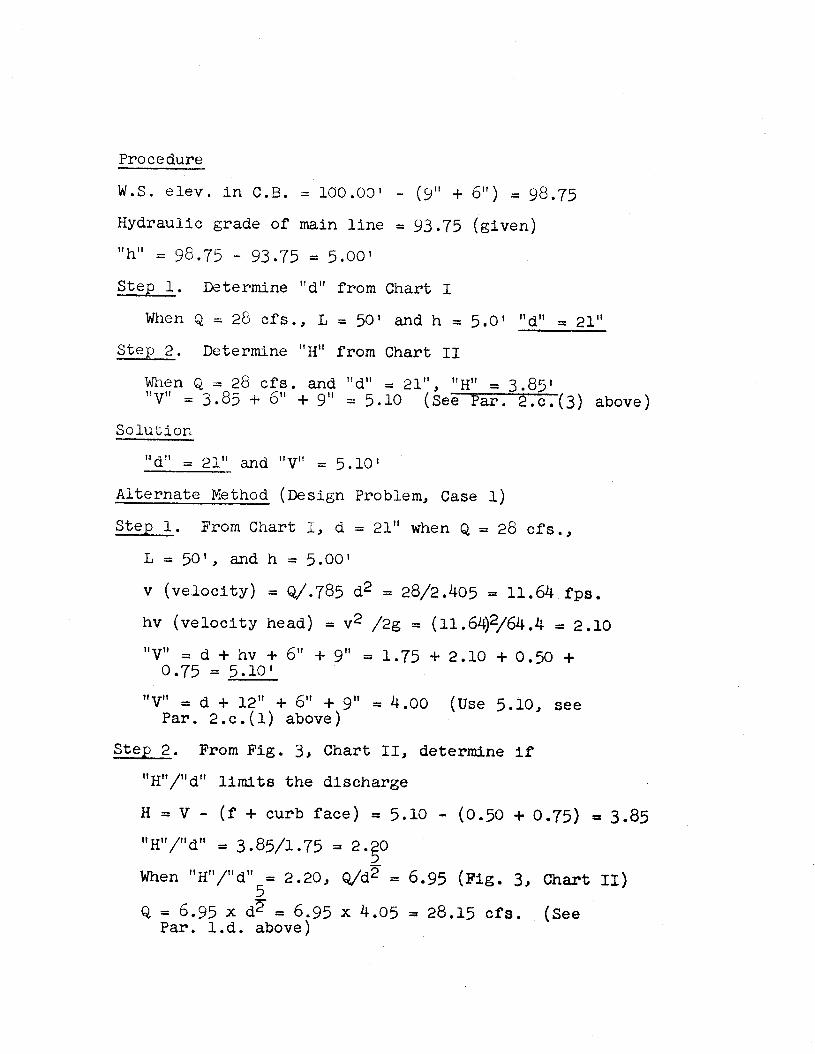
Procedure
W.S. elev. in C.B. = 100.03 - (9" + 6") = 98.75
Hydraulic grade of main line = 93.75 (given)
"h" = 98.75 - 93.75 = 5.00'
Step 1, Determine "d" from Chart I
When Q = 28 cfs., L = 50' and h = 5.0' "d" =: 21"
Step 2. Determine "H" from Chart 11
When Q = 28 cfs. and "d" = 21", "I-I" = 3.85' "V" = 3.85 + 6" + 9" = 5.10 (See Par. Z!.c.(3) above)
Solution
“d” = 21" and "V" = 5.10'
Alternate Nethod (Design Problem, Case 1)
Step 1. From Chart I, d = 21" when Q = 28 cfs.,
L = 50', and h = 5.00'
v (velocity) = Q/.785 d2 = 28/2.405 = 11.64 fps.
hv (velocity head) = v2 /2g = (11.64)2/64.4 = 2.10
"V" = d + hv + 6" + 9" = 1.75 + 2.10 + 0.50 + 0.75 = 5.10'
"V" = d + 12" + 6" + 9" Par. 2.c.(l) above)
= 4.00 (Use 5.10, see
2. Step From Fig. 3, Chart II, determine if
"H"/"d" limits the discharge
H = V - (f + curb face) = 5.10 - (0.50 + 0.75) = 3.85
"H'Y'd" = 3.85/1.75 = 2. 5 0
When "H"/"d"&= 2.20, Q/d2 = 6.95 (Fig. 3, Chart II)
Q= 6.95 x d% = 6.95 x 4.05 =I 28.15 cfs. Par. 1.d. above)
(See

-7-
Solution
"Cl" = 21" and "V" = 5.10'
b. Design Problem (Case 2)
Because of substructure interference, the catch
basin "V" is changed to 6.101, making "H" = 4.85'. All other
data the same as in Case 1. Determine 'Id".
Procedure
Q 1 ;; cfs.
L feet "h" = !
Given (See Case 1) 5.00 feet
“H”= 6.10 - (9" + 6") = 4.85'
step 1. Determine "d" from Chart I.
Wizen Q = 28 cfs., L = 50' and "h" = 5.00' "d" = 21"
SteiJ 2. From Chart II
Wnen "H" = 4.85' and "d" = 21", Q = 34 cfs.
C. Design Problem (Case 3)
Eecausc of substructure interference, the catch basin
"V" is changed to 4.65', making "H" = 3.40'. All other data
the same as in Case 1. Determine I'd".
Procedure
cfs. feet
h = 5.09 feet
" H" = 4.65' -
1 Given (See Case 1) (9" + 6") = 3.4'
Step 1. Determine "d" from Chart I.
When Q = 28 cfs., L = 50', and h = 5.00' I'd" = 21"
Step 2. From Chart II
WI :'r; .> "It" _ 3,Q.i and 'Id" = 21" J Q = 25 cfs.
-8-
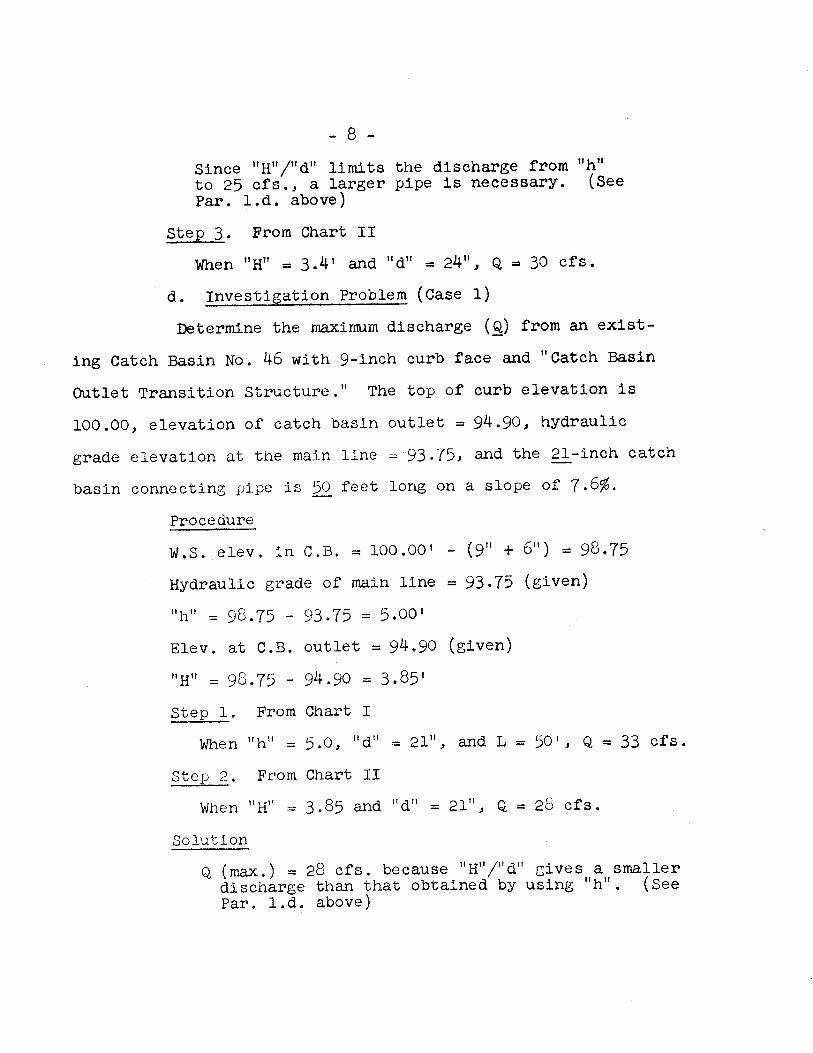
Since "H"/"d" limits to 25 cfs., a larger Par. 1.d. above)
Step 3. From Chart II
the discharge from "h" pipe is necessary. (See
When "H" = 3.4’ and "d" = 24", Q = 30 cfs.
d. Investigation Problem (Case 1)
Determine the maximum discharge (4) from an exist-
ing Catch Basin No. 46 with g-inch curb face and "Catch Basin
Cutlet Transition Structure." The top of
100.00, elevation of catch basin outlet =
grade elevation at the main line = 93.75,
curb elevation is
94.90, hydraulic
and the 21-inch catch -
basin connecting pipe is 50 feet long on a slope of 7.6%. -
Procedure
W.S. elev. in C.B. = 100.00' - (9" + 6”) = 98.75
Hydraulic grade of main line = 93.75 (given)
"h" = 98.75 - 93.75 = 5.00’
Elev. at C.B. outlet = 94.90 (given)
"H" = g8.75 - 94.90 = 3.85’
Step 1. From Chart I
When "h" = 5.0, 'Id" = 21", and L = SO', Q = 33 cfs.
Step 2. From Chart II
When "H" = 3.85 and "d" = 21", Q = 28 cfs.
Solution
Q (max.) = 28 cfs. because "H"/"d" gives a smailSer discharge than that obtained by using "h". ee Par. 1.d. above)

-9-
e. Investigation Problem (Case 2)
Use the same data a8 in Case 1 above except that
the hydraulic grade of the main line Is 95.75, making h =
3.00’. Determine the maximum discharge (4) from the catch
basin.
Procedure
W.S. elev. in C.B. = 100.00' - (9" + 6") pp 98.75
Hydraulic grade of main line = 95.75 (given)
h = 98.75 - 95.75 = 3.00'
Elev. of C.B. outlet = 94.90 (given)
"H" = 98.75 - 94.90 = 3.85'
Step 1. From Chart I
WhenL=w', 'Id" =
Step 2. Prom Chart II
When "H" = 3.85 and
Solution
21", and "h" = 3.00, Q = 25 cfs.
"d" 7 21", Q = 28 cfs.
Q (max.) II 25 cfs. because "h" discharge than that obtained (See Par. 1.d. above)
gives a smaller by using "H"/'d".
FJD:cd l-21-59


OFFICE STANDARD NO. 108 Storm Drain Design Division Bureau of Engineering City of Los Angeles May 25, 1961
PART VIII
DESCRIPTION AND USE OF
CATCH BASIN CONNECTIF PIPE CAPACITY CHARTS (With T' Radius of Rounding at the Catch Basin Outlet)
These charts may be used as guides for computing the capacity of "Catch Basin Connecting Pipes" for all catch basins with the standard 3-inch radius of rounding at the junction of the catch basin and the catch basin connecting pipe. These charts are similar to Charts I and II of Part VII but were basically conceived and developed for use with standard Catch Basins Nos. 38, 39 and kC having side inlet openings. These charts are not applicable for use with curb side opening type standard Catch Basins Nos. 45, 46 and 47 when combined with the standard "Catch BasPn Outlet Trunsitfon Structure."
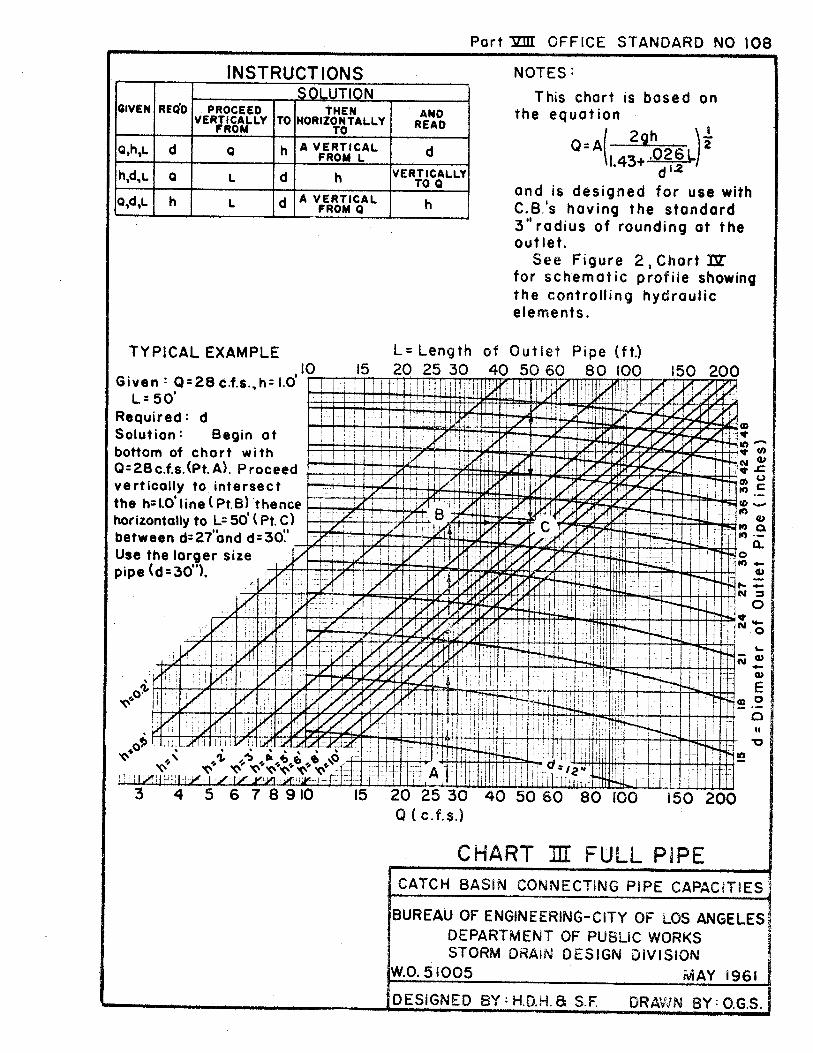
No. 'I, Chart III fs simlla- to Chart I of Office Standard
which was orlgfnaily developed from studies based upon (a) University of Iowa (Bulletin No. l), New Series No 103, titled "Flow of Water Through Culverts"; and (b) the risults of experiments and tests conducted at the California Institute of Technology by Carl Hague (1 27) extended by G. S. y (1946
and as recalculated and Taple of the Storm Drain Design
Division, Bureau of Engineering, City of Los Angeles.
Chart IV, which was developed at the Hydraulic Research Laboratory of the Storm Drain Design Division, was based upon the reference data listed in Part VII.
1. LEGEND AND DISCIJSSION. *
The Legend and Discussion contained in Part VII are appli- cable to Part VIII.
2. GENERAL RULES.
The General Rules established in Part VII are applicable to Part VIII, with the following exceptions and additions:
a. The sofflt of the catch basin outlet plpe should be at least 9 Inches below the designed water surface in the catch basin (minimum "H" = "dr + 9").
b. The minimum "V" should be "H" + 6” + curb face.

3.
4.
-2-
DESIGN FOR SINGLE BASINS.
Tn the design or investigation for single basins, the pro- cedure for the use of Charts III and IV herein is similar to the procedure outlined For Charts I and II, respectively, of Part VII. The smaller value of discharge, as determined from Charts III and IV, shall be the applicable discharge.
DESIGN FOR MULTIPLE BASINS IN SERIES.
There are many combinations of "d" and "V" which will satisfy a given set of conditions. Several trials may be necessary to find the most economical system. sample problem is intended
The following for use as a guide to illustrate
the determination of the catch basin outlet depths "V" and the catch basin outlet connecting pipe sizes.
a. Sample Problem.
(1) Conditions and Assumptions -- C.B. No. 1 C.B. No. 2 C.B. No. 3
I&~;: )top of curb 100 .oo 99.70 99.20
Curb face (C.F.) 9" 9" 9" Length of outlet pipe (L) 32' 40' 85' Flow intercepted by catch basin (Q) 16 cfs. 12 cfs. 8 cfs.
glow in outlet pipe 16 cfs. 28 cfs. 36 cfs. Elevation of hydraulic grade line at the main line storm drain = 93.04.
Determine the following for each catch basin: (a) "d" (diameter of outlet pipe in inches) (b) "V" (depth of catch basin in feet)
(2) Procedure and Solution
A simple approximation is to assume that, in the reach between Catch Basin No. 1 and Catch Basin No. 2 (see Fig. 2, Chart IV) with the freeboard (f) = 6 inches, "hi" is approximately equal to the total

available head (h ) divided by the number of catch basins In t k e series. The minimum value of 'hl" Is (TC1-CFl-f) - (TC2-CP2-I)
Catoh Basin No. 1.
1. Step
Step 2.
Step 3.
4. Step
5. Step
6. Step
Step 7.
Determine W.S. elev. In C.B.
(W.S. elev.)l = 100.00 - 9" - 6” - 98.75
Determine ht.
ht = (W.S. elev.)l - (H.G.L. elev. in main line)
- 98.75 - 93.04 = 5.71’
Set approximate h1*
h1 P: ht f 3 = 5.71 + 3 = 1.90' or
(2321 -CFl-f) - (TC2-CF2-P), whichever value Is larger
Determine d1.
Ql = 16 cfs., L1 - 32’, hl = 1.90'
From Chart III, dl falls between 18” and 21"
Use the larger, dl = 21"
Determine actual hl.
Ql = 16 cfs., L1 = 32', dl = 21"
From Chart III, hp = 1.30'
Determine H1.
Ql = 16 cfs., dl = 21"
From Chart IV, Hl - dl + 9" (below Line A-A)
~~ = 2.50’
Determine V1.
-40
(outlet elev.)l - (w.s. ele+ - ~1 - t&75 -
2.50 = 96.25
Vl = TCl - (Outlet elev.)l = 100.00 - 96.25 = 3.75'
Solution
dl = 21", vl = 3.75'
Catch Basin No. 2.
step 1.
ster, 2.
3. step
4. Step
Step 5.
6. Step
Determine (W.S. elev.J2.
(W.S. elev.j2 = (W.S. elev.)l - hl - 98.75 - 1.30
= 97.45 (or TC2 - g"-6", whichever elevation is lower)
Set approximate h2.
h2 a (ht.hl) t 2 = (5.71 - 1.30.) : 2 = 2.2Wor
(TC2-CF2-f) - (TC3-C"3-')I whichever value ia larger.
Determine d2.
Q2 = 28 cif~., L2 = 40', h2 - 2.20'
From Chart III, d2 I= 27"
Determine actual h2.
Q2 - 28 cfB., L2 = 40'1 d2 p rl"
From Chart III, h2 = 1.40'
Determine H2.
Q2 = 28 cfs., d2 = 27"
From Chart m, H2 - 3.00'
Determine V2.
(Outlet elev.)2 = (W.S. elev.)2 - H2 = 97.45 - 3.00=94.45

-5-
V2 = TC2 - (Outlet elev.)2 = 99.70 - 94.45 = 5.25'
Solution
d2 = 27”, V2 = 5.25'
Catch Basin No. 3
1. Step
Step 2.
Step 3.
Step 4.
Step 5.
Determine (W.S. elev.)3.
(W.S. elev.)3 - 97.45 - 1.40 - 96.05 or
(TC3-9'-6", whichever elevation Is lower).
Find available h-,. 3 h3 = 96.05 - g3.04 = 3.01'
Determine d3.
~~ = 36 C~EL, 5 = &P., h.. = 3.01~ j From Chart III, d3 = 27"
Determine H3.
Q3 = 36 .cfs., d3 = 27"
From Chart IV, H3 = 3.93'
Determine V3.
(Outlet elev.)3 = (W.S. elev.)3 - H3 - 96.05 - 3.93m92.12
v3 = TC3 - (Outlet elev.)3 = 99.20 - 92.12 = 7.08'
Solution
d3 6 27”, v3 = 7.08’
b. Discussion.
The depths “V” computed in theforegoing problem are minimum values required for the system to operate at design capacity. A catch basin may be designed tith a greater depth if necessary for substructure clearance or for other reasons, if the design meets the requirements of Section 2e of Part VII.

-6-
Where interference limits the depth of any basin to a value less than that computed by the method shown, a larger pipe diameter must be provided in order to satisfy the condition. It is essential that the value of "H" be great enough to provide design flow.
5. ANALYSIS FOR EXISTINO CATCH BASINS IN SERIES.
In general, the analysis for existing catch basins in series is similar to the foregoing problem, except that the values of "d' and "V" are known. The value of either !lH" or r!h", or the inlet capacity of the catch basin will conGrol,whichever provides the smallest discharge in the analysis and solution.


![D 700 Vacation of Pub[1]. RW - Los Angeleseng2.lacity.org/techdocs/landdev/sections/D700VacationofPubRW.pdf · of-way may be merged upon the recordation of a final subdivision tract](https://img.dokumen.tips/doc/110x75/5f8053d603f5dc0f046cdeee/d-700-vacation-of-pub1-rw-los-of-way-may-be-merged-upon-the-recordation-of.jpg)