Embed Size (px)
Citation preview

BURDEN OF RESPIRATORY ILLNESSES WITH COUGHIN CHILDREN FROM AN ECONOMIC AND QUALITY
OF LIFE PERSPECTIVE, AND THE COST-EFFECTIVENESS OF EARLY INTERVENTION
Yolanda Grace Lovie-Toon
BHSc (Public Health)
Submitted in fulfilment of the requirement for the degree of Doctor of Philosophy
School of Public Health and Social Work
Faculty of Health
Queensland University of Technology
2020


Burden of respiratory illnesses with cough in children from an economic and quality of life perspective, and the cost-effectiveness of early intervention
i
Keywords
Aboriginal, acute cough, acute respiratory infection, Australia, bronchiectasis,
burden, children, chronic cough, cost-effectiveness, cost of illness, cough, economic
evaluation, Indigenous, paediatrics, quality of life, resource use, Torres Strait
Islander.

ii Burden of respiratory illnesses with cough in children from an economic and quality of life perspective, and the cost-effectiveness of early intervention
Acknowledgement of Aboriginal and Torres Strait Islander peoples
I and the researchers involved in the projects presented in this thesis acknowledge
the Traditional Owners of the Lands on which this research took place and pay our
respect to Elders past, present and future. Aboriginal and Torres Strait Islander
communities in Australia are not homogenous, and the collective term “Indigenous”
masks distinct historical and cultural differences been Aboriginal people and Torres
Strait Islander people. However, for brevity purposes throughout this thesis I have
used the term “Indigenous” and apologise for any unintended offence this may cause.
The exception to this is in Chapter 5 which consists of a publication and therefore
terminology has not been changed from what has already been published.

Burden of respiratory illnesses with cough in children from an economic and quality of life perspective, and the cost-effectiveness of early intervention
iii
Abstract
Background: Respiratory illnesses, both acute and chronic, contribute considerably
to childhood morbidity and use of healthcare services in Australia. This is particularly
true for Indigenous Australian children who are disproportionately affected by
respiratory illnesses as seen in higher incidence and prevalence of disease, and higher
hospitalisation rates, relative to non-Indigenous Australian children. Cough is a
common and important symptom of both acute and chronic respiratory illnesses.
Chronic cough, defined in paediatrics as a cough lasting >4 weeks duration, is
problematic from a clinical perspective, and following an acute respiratory infection
(ARI) is estimated to occur in 25% of ARI episodes. Chronic cough may also be
associated with the development and progression of chronic respiratory diseases
such as bronchiectasis. While the clinical and epidemiological burden of respiratory
illnesses among Australian children is reasonably well-described, there is a lack of
research on the burden from an economic and quality of life (QoL) perspective. In
particular, there are gaps in knowledge of the cost of ARIs with cough (ARIwC) among
Indigenous children and children presenting to emergency departments (ED),
changes in cough-specific QoL over a duration of illness, and factors associated with
higher costs and poorer QoL. Additionally, there are no studies that have evaluated
the cost-effectiveness of early intervention to manage and resolve chronic cough.
Thus, among Australian Indigenous and non-Indigenous children, this thesis aimed to
(a) describe the resource use and cough-specific QoL associated with bronchiectasis,
(b) estimate the cost of ARIwC from the perspective of caretakers, the public
healthcare system and third parties, (c) estimate the impact of ARIwC on cough-
specific QoL over the duration of an episode of ARIwC, (d) examine child, family and
illness characteristics associated with cost of illness and cough-specific QOL and, (e)
evaluate the cost-effectiveness of early intervention using a cough management
algorithm among children with chronic cough.

iv Burden of respiratory illnesses with cough in children from an economic and quality of life perspective, and the cost-effectiveness of early intervention
Methods: This thesis includes data collected from three observational cohort studies
(two focusing on children with ARIwC and one focusing on children with
bronchiectasis) and one randomised controlled trial (RCT) including children
identified with chronic cough 4-weeks post-presentation to a health service with
ARIwC. Three studies were conducted exclusively in South-East Queensland and one
study was conducted in multiple sites across Australia and New Zealand. Three
studies had an emphasis on Indigenous Australian children.
For each study, the characteristics of the study population were described using
counts and proportions, or means and standard deviations, or medians and
interquartile ranges, depending on variable type and distribution. Where applicable,
characteristics were compared between enrolled and not enrolled participants,
between participants with and without missing data, and/or participants who did or
did not complete the study and were lost to follow-up. In the case of the RCT,
characteristics were also compared between participants randomised to the
intervention and usual care group.
For the analysis of resource use associated with bronchiectasis, resource use per
month, per exacerbation, and per clinic review was described using counts and
proportions, or means and standard deviations. Parent- and child-reported cough-
specific QoL and cough severity were correlated using Pearson’s or Spearman’s
correlation.
For the analysis of changes in cough-specific QoL over the duration of an ARIwC
episode, mean QoL scores at the time of presentation to an ED and over the
subsequent four weeks were summarised. Linear regression was used to identify
characteristics associated with QoL at baseline. A linear mixed effects model was
used to identify characteristics associated with QoL over the follow-up period.

Burden of respiratory illnesses with cough in children from an economic and quality of life perspective, and the cost-effectiveness of early intervention
v
For the two analyses of the cost of an episode of ARIwC, unit costs were applied to
each item of resource use reported by parents/guardians, from illness onset and over
the four weeks following notification of illness. Costs were examined from the
perspective of caretakers, the public healthcare system and third parties. Multiple
imputation was used to deal with missing data. Estimates of costs were calculated for
each timepoint and from each perspective, and were summed to obtain a total cost
per episode. Linear regression was used to identify characteristics associated with
cost per episode and per child-month of observation.
For the analysis of the cost-effectiveness of an early intervention using a cough
management algorithm among children with chronic cough, costs post-
randomisation among the intervention and usual care (control) group were
estimated from the perspective of the public healthcare system and caretakers. Unit
costs were applied to each item of parent/guardian-reported resource use. The
proportion of participants among the intervention and usual care group who
experienced the outcome measure of cough resolution by 4 weeks post-
randomisation was determined through weekly parent-report of a break in cough for
≥3 consecutive days and nights, as well as weekly cough severity. Incremental cost-
effectiveness ratios (ICERs) of cost per additional cough resolution were calculated
using regression modelling and bootstrap replications, and were plotted on cost-
effectiveness planes. An intention to treat approach was taken for the main analysis;
a per-protocol approach was taken for the sensitivity analysis.
All analyses were undertaken using either Stata MP Version 13 or Stata MP Version
15 (StataCorp, College Station, Texas).
Results: Among children with bronchiectasis, use of healthcare services and
consumption of antibiotics was high (30 and 50 per 100 child-months of observation
respectively). Absences from school/childcare due to bronchiectasis were 24.9
children per 100 child-months. Parent/carer and child cough-specific QoL scores were

vi Burden of respiratory illnesses with cough in children from an economic and quality of life perspective, and the cost-effectiveness of early intervention
highly correlated, remained stable over time and were negatively associated with
cough severity.
Among Indigenous Australian children, the mean cost of a non-hospitalised episode
of ARIwC was estimated to be $AU252 (95% CI 169, 334). Caretakers, the public
healthcare system and employers incurred 44%, 39% and 17% of costs per episode,
respectively. The mean annual cost of ARIwC per child was $991 (95% CI 514, 1468).
Winter episodes and episodes resulting in chronic cough had the highest costs per
episode. A history of wheezing, connections with traditional lands and
parent/guardian belief that antibiotics should be given until symptoms resolve were
independently and significantly associated with a higher cost per child-month of
observation.
Among children presenting to an ED for ARIwC, the mean cost per episode was
$AU5268 (95% CI 4793, 5743). Caretakers, the public healthcare system and
employers incurred 66%, 22% and 11% of costs per episode, respectively. Factors
associated with cost per episode were (i) cough duration at enrolment, (ii) illness
duration at enrolment, (iii) parent/guardian reported cough-related financial
concerns at enrolment, (iv) discharge destination post-ED, (v) season of ED
presentation, and (vi) maternal education.
Among children presenting to an ED for ARIwC, cough-specific QoL at time of
presentation was low (median of 2.7 on a 1-7 scale), but improved significantly in the
subsequent two weeks. Factors associated with cough-specific QoL at both the time
of presentation to ED and the subsequent four weeks were day-cough severity, night-
cough severity, and parent/guardian reported cough-related financial concerns at
enrolment.
Among the 90 participants with chronic cough included in the intention-to-treat cost-
effectiveness analysis of early intervention with a cough management algorithm,

Burden of respiratory illnesses with cough in children from an economic and quality of life perspective, and the cost-effectiveness of early intervention
vii
33/45 (73%) of the intervention group experienced cough resolution by Week 8,
compared to 23/45 (51%) of the usual care group. Mean costs from the perspective
of the public healthcare system were $179 (95% CI 139, 218) for the intervention
group compared to $135.04 (36, 234) for the usual care group. Mean costs from the
perspective of caretakers were $386 (95% CI 264, 552) for the intervention group
compared to $444 (199, 874) for the usual care group. There was a 52% probability
that the intervention was both more effective and less costly than usual care from
the caretaker perspective, but only an 8% probability from the perspective of the
public healthcare system.
Conclusions: This thesis contains the first studies to describe resource use associated
with bronchiectasis, estimate the cost of ARIwC among Indigenous Australian
children, estimate the cost and impact on QoL of ARIwC among Australian children
presenting to EDs, and to evaluate the cost-effectiveness of early intervention among
Australian children with chronic cough.
Among children with bronchiectasis, use of healthcare services was more frequent
for bronchiectasis than for other reasons. Overall, specialist services were the most
frequently sought type of healthcare, however within an exacerbation use of primary
healthcare services was more common. Cough-specific QoL was consistently high
over the 12 month period. Among children presenting to the ED for an ARIwC, cough-
specific QoL was low at the time of presentation to ED but improved considerably
over the subsequent four weeks. The cost of both community-managed episodes of
ARIwC and episodes of ARIwC resulting in ED presentation and/or hospitalisation was
substantial, particularly for caretakers, followed by the public healthcare system.
A range of demographic, family, cultural and illness-related characteristics were
identified as being significantly and independently associated with QoL and cost of
illness. Cough duration and cough severity were found to influence both QoL and cost

viii Burden of respiratory illnesses with cough in children from an economic and quality of life perspective, and the cost-effectiveness of early intervention
of illness, and therefore cough resolution should be the focus of both public health
and clinical interventions.
The findings from the cost-effectiveness analysis suggest that early intervention using
a cough management algorithm among children with chronic cough may be cost-
saving from the perspective of caretakers. From the perspective of the public
healthcare system, however, the cost per additional cough resolution as a result of
the intervention was estimated to be $704. It is yet to be determined whether this is
an acceptable willingness-to-pay threshold for cough resolution among children.
Future research to explore the cost-effectiveness of the use of the intervention in a
primary care setting, and that incorporates cost-utility measures such as Quality
Adjusted Life Years is required.

Burden of respiratory illnesses with cough in children from an economic and quality of life perspective, and the cost-effectiveness of early intervention
ix
Table of Contents
Keywords .................................................................................................................................... i
Acknowledgement of Aboriginal and Torres Strait Islander peoples ....................................... ii
Abstract .................................................................................................................................... iii
Table of Contents ..................................................................................................................... ix
A Note On Thesis Formatting .................................................................................................. xii
List of Figures ......................................................................................................................... xiii
List of Tables .......................................................................................................................... xiv
List of Abbreviations ............................................................................................................. xvii
List of Publications .................................................................................................................. xx
List of Presentations.............................................................................................................. xxii
Statement of Original Authorship ........................................................................................ xxiii
Acknowledgements .............................................................................................................. xxiv
Funding ................................................................................................................................ xxvi
Introduction ..................................................................................... 1
1.1 Background .....................................................................................................................1
1.2 Research aims, questions and objectives .......................................................................2
1.3 Significance of the research ............................................................................................5
1.4 Definition of terms ..........................................................................................................5
1.5 Thesis outline ..................................................................................................................7
Literature Review............................................................................ 13
2.1 Respiratory illnesses among children .......................................................................... 13
2.2 Resource use associated with respiratory illnesses .................................................... 25
2.3 Impact of respiratory illnesses on quality of life ......................................................... 38
2.4 Economic burden of respiratory illnesses in children ................................................. 44
2.5 Scope for intervention ................................................................................................. 48
2.6 Conclusion ................................................................................................................... 54
Research Methods .......................................................................... 57
3.1 Introduction ................................................................................................................. 57
3.2 Summary of studies ..................................................................................................... 58
3.3 Study-specific methods ............................................................................................... 64
3.4 Common methods across all studies ........................................................................... 72
3.5 Data cleaning and analysis ........................................................................................... 95
3.6 Summary .................................................................................................................... 101

x Burden of respiratory illnesses with cough in children from an economic and quality of life perspective, and the cost-effectiveness of early intervention
Health-resource use and quality of life in children with bronchiectasis: a multi-centre pilot cohort study ............................................... 102
4.1 Abstract ...................................................................................................................... 105
4.2 Introduction ............................................................................................................... 106
4.3 Methods ..................................................................................................................... 106
4.4 Results ........................................................................................................................ 108
4.5 Discussion ................................................................................................................... 118
4.6 Conclusion .................................................................................................................. 121
The cost of acute respiratory infections with cough among urban Aboriginal and Torres Strait Islander children .................................................... 123
5.1 Abstract ...................................................................................................................... 126
5.2 Introduction ............................................................................................................... 128
5.3 Methods ..................................................................................................................... 129
5.4 Results ........................................................................................................................ 138
5.5 Discussion ................................................................................................................... 142
Longitudinal study of the cost of acute respiratory infection with cough among Australian children presenting to an emergency department ....... 149
6.1 Abstract ...................................................................................................................... 152
6.2 Introduction ............................................................................................................... 153
6.3 Methods ..................................................................................................................... 154
6.4 Results ........................................................................................................................ 157
6.5 Discussion ................................................................................................................... 164
Longitudinal study of quality of life among children with acute respiratory infection and cough ........................................................................ 167
7.1 Abstract ...................................................................................................................... 170
7.2 Introduction ............................................................................................................... 171
7.3 Methods ..................................................................................................................... 172
7.4 Results ........................................................................................................................ 175
7.5 Discussion ................................................................................................................... 186
7.6 Summary .................................................................................................................... 191
Cost-effectiveness of a chronic cough management algorithm at the transitional stage from acute to chronic cough in children: a multi-centre randomised controlled trial. .............................................................................. 193
8.1 Abstract ...................................................................................................................... 194
8.2 Introduction ............................................................................................................... 196
8.3 Methods ..................................................................................................................... 197
8.4 Results ........................................................................................................................ 205

Burden of respiratory illnesses with cough in children from an economic and quality of life perspective, and the cost-effectiveness of early intervention
xi
8.5 Discussion .................................................................................................................. 215
Discussion ..................................................................................... 219
9.1 Introduction ............................................................................................................... 219
9.2 Findings, implications and future research ............................................................... 220
9.3 Strengths and limitations ........................................................................................... 236
9.4 Conclusion ................................................................................................................. 240
Bibliography ..................................................................................................... 243
Appendices ....................................................................................................... 271
Appendix A : Published study protocol for the Tooth and Lung Sickness in Murri Kids (TLSIM) study ................................................................................................................................... 271
Appendix B : Published study protocol for the Emergency Department Cough (EDC) study ..... 280
Appendix C : Published study protocol for the Researching Intervention in Chronic Cough in Kids (RICCi) study ................................................................................................................. 290
Appendix D : Chapter 4 (COBS study) supplementary materials ......................................... 303
Appendix E : Chapter 5 (TLSIM study) supplementary materials ........................................ 306
Appendix F : Chapter 6 (EDC study) supplementary materials ............................................ 311
Appendix G : Chapter 7 (EDC study) supplementary materials ........................................... 325
Appendix H : Chapter 8 (RICCi study) supplementary materials ......................................... 326

xii Burden of respiratory illnesses with cough in children from an economic and quality of life perspective, and the cost-effectiveness of early intervention
A Note On Thesis Formatting
This thesis is a thesis by published papers containing three papers which have been
published (Chapter 4, 5 and 7) and two manuscripts which have been submitted for
publication (Chapter 6 and 8). The wording and spelling in these chapters is consistent
with how the papers/manuscripts were published/submitted and therefore Chapters
4 and 5 are written in American English. In contrast, references have been
reformatted to the Vancouver referencing style regardless of the referencing style of
the journal and are numbered sequentially as they appear in the thesis, with a final
reference list provided at the end of the thesis. Table and figure numbers may have
also changed and are numbered sequentially as they appear in each of the chapters.
Supplementary files published/submitted along with the paper/manuscripts have
been re-formatted as Appendices and are numbered accordingly. Some of these
Appendices also contain their own reference lists.

Burden of respiratory illnesses with cough in children from an economic and quality of life perspective, and the cost-effectiveness of early intervention
xiii
List of Figures
Figure 1.1. Diagram of topics of research, research studies and publications included in this thesis and their corresponding chapters. ............................ 8
Figure 3.1. Map of Australia and map of Greater Brisbane area and Toowoomba. ................................................................................................ 61
Figure 3.2. Example of an item listed in Medicare Benefits Schedule. ...................... 83
Figure 3.3. Example of medication listed in Pharmaceutical Benefits Schedule. ...... 84
Figure 5.1. TLSIM study procedure. ......................................................................... 133
Figure 5.2. TLSIM CONSORT diagram. ...................................................................... 139
Figure 5.3. Mean cumulative cost per episode of ARIwC from illness onset to four weeks post illness notification, by final cough duration (n=204). ..... 141
Figure 7.1. Box plots of PAC-QoL scores at baseline and weekly follow-ups, includes all children (n=283). ..................................................................... 181
Figure 8.1. Incremental cost effectiveness planes (and 95% confidence ellipses) using the intention-to-treat approach presented from (a) the public healthcare perspective, (b) the caretaker perspective, and (c) the combined perspective. ........................................................................ 211
Figure 8.2. Incremental cost effectiveness planes (and 95% confidence ellipses) using the per-protocol approach and presented from (a) the public healthcare perspective, (b) the caretaker perspective, and (c) the combined perspective. ........................................................................ 214
Figures in Appendices
Figure H1. Non-specific cough pathway of cough management algorithm. ........... 330
Figure H2. Specific cough pathway of cough management algorithm. ................... 332
Figure H3. CONSORT diagram for cost-effectiveness analyses. .............................. 334

xiv Burden of respiratory illnesses with cough in children from an economic and quality of life perspective, and the cost-effectiveness of early intervention
List of Tables
Table 3.1. Periods of participant recruitment, data collection, and PhD. ................. 58
Table 3.2. Comparisons of the key elements of the methods of the four research studies included in this thesis. ...................................................... 59
Table 3.3. Selected demographic characteristics of locations in which studies were conducted, and comparative characteristics of Australia. ................. 61
Table 3.4. Data collection procedures across each study included in this thesis. ..... 63
Table 3.5. Verbal category descriptive scores used to measure cough severity. ...... 72
Table 3.6. Example parent/guardian responses to weekly follow-up question “Has your child stopped coughing for ≥3 full days and nights in the past week?”, and corresponding classification of cough resolution and duration. ................................................................................................ 74
Table 3.7. Examples of cough severity scores reported at weekly follow-ups using the VCD tool, and corresponding classification of a ≥75% reduction in score over time. ....................................................................... 75
Table 3.8. Use of two measures of cough to determine cough resolution post-randomisation in the RICCi study. ................................................................ 75
Table 3.9. Items of resource use and their respective cost perspective. .................. 79
Table 3.10. Items of resource use and quantities collected. ..................................... 80
Table 3.11. Hospitalisation diagnoses of study participants and the corresponding DRG selected for unit costing purposes. ............................. 91
Table 4.1. Monthly medical resource use, missed school and childcare, and missed parent/carer work (N=85 children). .............................................. 110
Table 4.2. Exacerbation-related resource use, total and by seasona. ...................... 112
Table 4.3. Resource use at quarterly clinic visits. .................................................... 115
Table 4.4. Parent and child-reported cough quality-of-life (QoL) at time of clinic visits. ................................................................................................. 117
Table 5.1. Glossary of terms. .................................................................................... 130
Table 5.2. Unit costs in Australian dollars 2017. ...................................................... 134
Table 5.3. Mean (95% CI) cost per episode after multiple imputation, by timepoint and sector (n=257). ................................................................... 140
Table 6.1. Glossary of terms. .................................................................................... 154
Table 6.2. Summary of resource use related to the acute respiratory infection with cough episode among complete cases, n=127. ................................. 159
Burden of respiratory illnesses with cough in children from an economic and quality of life perspective, and the cost-effectiveness of early intervention
xv
Table 6.3. Mean cost per episode of acute respiratory infection with cough after multiple imputation, in 2017 Australian dollars, by timepoint, and sector, n=286†. .................................................................................... 161
Table 6.4. Multiple linear regression model examining variables associated with total cost per episode of acute respiratory infection with cough, n=274†. ....................................................................................................... 162
Table 7.1. Time-invariant child characteristics of the study cohort, N=283. ........... 176
Table 7.2. Time-variant child characteristics of the study cohort, N=283. .............. 180
Table 7.3. Baseline multiple linear regression model, N=239. ................................ 183
Table 7.4. Follow-up linear mixed model, N=250. ................................................... 185
Table 8.1. Unit costs for each item of resource use reported by parents/guardians between randomisation and end of study period. ..... 201
Table 8.2. Selected baseline characteristics of participants included in the intention-to-treat cost-effectiveness analysis, presented by allocation group. ......................................................................................................... 206
Table 8.3. Mean itemised and total costs for 90 participants included in the intention-to-treat cost-effectiveness analysis, presented by allocation group and cost perspective. ...................................................................... 209
Table 8.4. Mean itemised and total costs for 76 participants included in the per-protocol cost-effectiveness analysis, presented by allocation group and cost perspective. ...................................................................... 213
Tables in Appendices
Table D1. Parent and child-reported cough severity scores at time of clinic visits. .......................................................................................................... 303
Table D2. Correlations between parent and child-reported quality-of-life (QoL) and parent and child-reported cough severity at baseline and months 3, 6, 9 and 12. ............................................................................................. 304
Table D3. Comparison of baseline characteristics between those participants who completed all 12-monthly follow-up tasks and those participants who did not. ............................................................................................... 305
Table E1. Self-reported baseline characteristics of children eligible for inclusion in analysis, of children who reported at least one ARIwC illness during the study period and of children who reported no ARIwC illnesses during the study period. .................................................. 306
Table F1. Unit costs (in Australian dollars 2017) of all parent-reported resource use related to acute respiratory infection with cough. .............. 311
Table F2. Characteristics of all children at enrolment, with comparison of characteristics between participants with and without complete economic data............................................................................................ 316
xvi Burden of respiratory illnesses with cough in children from an economic and quality of life perspective, and the cost-effectiveness of early intervention
Table F3. Mean cost per episode of acute respiratory infection with cough after multiple imputation, in 2017 Australian dollars, by timepoint, and sector, n=292†. .................................................................................... 322
Table F4. Multiple linear regression model examining factors associated with total cost per episode of acute respiratory infection with cough, n=280†. ....................................................................................................... 323
Table G1. Baseline multiple linear regression model, with 7 high leverage participants removed, N=232, adjusted R2 = 44.6%. ................................. 325
Table H1. Itemised summary of resource use for 90 participants included in the intention-to-treat cost-effectiveness analysis, presented by allocation group. ........................................................................................ 326
Table H2. Itemised summary of resource use for 76 participants included in the per-protocol cost-effectiveness analysis, presented by allocation group. ......................................................................................................... 328

Burden of respiratory illnesses with cough in children from an economic and quality of life perspective, and the cost-effectiveness of early intervention
xvii
List of Abbreviations
ABS Australian Bureau of Statistics
ACCP American College of Chest Physicians
AIHW Australian Institute of Health and Welfare
AMA Australian Medical Association
ARE Acute respiratory exacerbation
ARI Acute respiratory infection
ARIwC Acute respiratory infection with cough
ATO Australian Taxation Office
$AU Australian Dollar
BIC Bayesian information criteria
CC-QoL Chronic cough quality of life
CEA Cost effectiveness analysis
CF Cystic fibrosis
CI Confidence interval
CSLD Chronic suppurative lung disease
COBS Cost of Bronchiectasis
COI Cost of illness
CRD Chronic respiratory disease
CRF Case report form
CTG Close the Gap
DPMQ Dispense price for maximum quantity
DRG Diagnostic related group
ED Emergency department
EDC Emergency Department Cough
ENT Ear, nose and throat
GP General practitioner
GPC General patient charge
HRCT High-resolution computed tomography
HREC Human Research Ethics Committee
IHPA Independent Hospital Pricing Authority

xviii Burden of respiratory illnesses with cough in children from an economic and quality of life perspective, and the cost-effectiveness of early intervention
ICER Incremental cost effectiveness ratio
ILI Influenza-like-illness
ITT Intention-to-treat
IQR Interquartile range
LRTI Lower respiratory tract infection
LTFU Lost to follow up
MAR Missing at random
MBS Medicare Benefits Scheme/Schedule
MCAR Missing completely at random
MI Multiple imputation
MID Minimally importance difference
MNAR Missing not at random
NA Not applicable
NEP National efficient price
NICU Neonatal intensive care unit
NPA Nasopharyngeal aspirate
NWAU National Weighted Activity Unit
NZD New Zealand dollar
OR Odds ratio
OTC Over the counter
PAC-QoL Parent-proxy Acute Cough Specific Quality of Life
PBB Protracted bacterial bronchitis
PBS Pharmaceutical Benefits Scheme/Schedule
PC-QoL Parent-proxy Chronic Cough Specific Quality of Life
PP Per-protocol
QALY Quality-adjusted life years
QCH Queensland Children’s Hospital
QoL Quality of life
RAD Reactive airways disease
RBA Reserve Bank of Australia
RCH Royal Children’s Hospital

Burden of respiratory illnesses with cough in children from an economic and quality of life perspective, and the cost-effectiveness of early intervention
xix
RCT Randomised controlled trial
RICCi Researching Intervention for Chronic Cough in Kids
RSV Respiratory syncytial virus
SD Standard deviation
TLSIM Tooth and Lung Sickness in Murri Kids
UK United Kingdom
URG Urgency related group
URTI Upper respiratory tract infection
US United States
VCD Verbal category descriptive

xx Burden of respiratory illnesses with cough in children from an economic and quality of life perspective, and the cost-effectiveness of early intervention
List of Publications
Published papers included in this thesis
1. Lovie-Toon YG, Chang AB, Newcombe PA, Vagenas D, Anderson-James S,
Drescher BJ, Otim ME, O’Grady KF. Longitudinal study of quality of life among
children with acute respiratory infection and cough. Quality of Life Research.
2018; 27(4):891-903.
2. Lovie-Toon YG, McPhail SM, Au-Yeung YT, Hall KK, Chang AB, Vagenas D, Otim
ME, O'Grady KF. The cost of acute respiratory infections with cough among urban
Aboriginal and Torres Strait Islander children. Frontiers in Pediatrics. 2018;6.
3. Lovie-Toon YG, Grimwood K, Byrnes CA, Goyal V, Busch G, Masters IB, Marchant
JM, Buntain H, O’Grady KF, Chang AB. Health-resource use and quality of life in
children with bronchiectasis: a multi-center pilot cohort study. BMC Health
Services Research. 2019; 19(1):1-9.
Submitted manuscripts included in this thesis
1. Lovie-Toon YG, McPhail SM, Vagenas D, Au-Yeung YT, Chang AB, Drescher BJ,
Phillips N, Acworth J, Otim ME, O’Grady KF. Longitudinal study of the cost of
acute respiratory infection with cough among Australian children presenting to
an emergency department. Submitted to Journal of Paediatrics and Child Health
in July 2019.
Manuscripts included in this thesis which are in late draft stage
1. Lovie-Toon YG, McPhail SM, Chang AB, Vagenas D, Otim M, O’Grady KF. Cost-
effectiveness of a cough management algorithm at the transitional stage from
acute to chronic cough in Australian children aged <15 years: a randomised
controlled trial.

Burden of respiratory illnesses with cough in children from an economic and quality of life perspective, and the cost-effectiveness of early intervention
xxi
Other publications produced during candidature
1. Lovie-Toon YG, Hall KK, Chang AB, Anderson J, O’Grady KF. Immunisation
timeliness in a cohort of urban Aboriginal and Torres Strait Islander children.
BMC Public Health. 2016; 16(1):1159.
2. Au-Yeung YT, Chang AB, Grimwood K, Lovie-Toon YG, Kaus M, Rablin S, Arnold
D, Roberts J, Anderson J, Toombs M, O’Grady KF. Risk factors for chronic
cough in children: a cohort study. Submitted to Archives of Disease in
Childhood in July 2019.
3. O’Grady KF, Grimwood K, Torzillo PJ, Rablin S, Lovie-Toon YG, Kaus M, Arnold
D, Roberts J, Buntain H, Adsett D, King A, Scott M, Anderson J, Toombs M,
Chang AB. Effectiveness of a chronic cough management algorithm at the
transitional stage from acute to chronic cough in children: a multi-centre
randomised controlled trial. Lancet Child & Adolescent Health. 2019. In press.

xxii Burden of respiratory illnesses with cough in children from an economic and quality of life perspective, and the cost-effectiveness of early intervention
List of Presentations
1. Lovie-Toon YG, Chang AB, Newcombe PA, O’Grady KF. Quality of life of
parents of Australian children presenting to a paediatric emergency
department with an acute respiratory illness and cough. [Oral] IHBI Inspires
Student Conference, Queensland University of Technology, November 2016,
Gold Coast, Australia.
2. Lovie-Toon YG, Chang AB, Newcombe PA, Vagenas D, Anderson-James S,
O’Grady KF. Parent-proxy quality of life of children with acute respiratory
infection and cough upon presentation to an emergency department and over
the following four weeks. [E-poster] 35th Annual Meeting for the European
Society of Paediatric Infectious Diseases, May 2017, Madrid, Spain.
3. Lovie-Toon YG, Chang AB, Newcombe PA, Vagenas D, Anderson-James S,
Drescher B, Otim ME, O’Grady KF. Parent-proxy quality of life of children with
acute respiratory infection and cough upon presentation to an emergency
department and over the following four weeks. [Oral] Annual Scientific
Research Symposium, Children’s Health Queensland, November 2017,
Brisbane, Australia.
4. Lovie-Toon YG, Chang AB, Newcombe PA, O’Grady KF. The cost of acute
respiratory infections with cough among Aboriginal and Torres Strait Islander
children. [Poster] Centre for Children’s Health Research HDR Symposium,
June 2018, Brisbane, Australia.
5. Lovie-Toon YG, Chang AB, Newcombe PA, O’Grady KF. The cost of acute
respiratory infections with cough among Aboriginal and Torres Strait Islander
children. [Poster] IHBI Inspires Student Conference, Queensland University of
Technology, August 2018, Brisbane, Australia.
QUT Verified Signature

xxiv Burden of respiratory illnesses with cough in children from an economic and quality of life perspective, and the cost-effectiveness of early intervention
Acknowledgements
First and foremost, I would like to acknowledge my primary supervisor KA who took
me on as a quiet, naïve, undergraduate summer research student, not knowing she
would be stuck with me for another 5 years. While I may have become considerably
less quiet (and slightly more cynical) over the years, the trust, respect, patience and
support you have given me as a student has shaped me into the passionate, confident
and independent (perhaps too much sometimes) researcher I am now. I am in awe
of your dedication, not only to conducting high-quality research to improve the lives
of children and their families, but also to your research team. We are all so lucky to
have you as our leader.
To my associate supervisors Anne Chang, Steven McPhail, Dimitrios Vagenas and
Michael Otim– without your expertise in your respective areas I would still be very
lost and confused. I have appreciated all the times you have shared your knowledge
and insight with me, as well as your reassurance in the times I felt completely out of
my depth.
To the previous and current research students and staff who were involved in the
recruitment and collection of all the data I have used for this thesis - I am
exceptionally thankful for all your hard work.
To the RiOAR team, the CAARG team & my other CCHR buddies (including the fish)
who came and went throughout my PhD - I learnt something from all of you that
helped me on this journey. Thank you for the coffees, the food, the pep talks, the
food, the jokes, the food, the love and the food. Thank you for all the times you
indulged my rants, tolerated my pedantic-ness, lent a sympathetic ear and offered
me your wisdom. Thank you especially to Kerry (ginger biscuit & finger lime queen),
Jack (co-founder of CCHR run club), Michelle (data cleaning partner-in-crime and the
Burden of respiratory illnesses with cough in children from an economic and quality of life perspective, and the cost-effectiveness of early intervention
xxv
left to my right), Kaley (fellow competitive nerd & public health poster child), Tamara
(my PhD idol and confidant), Crystal (an absolute blessing in every way) and, last but
certainly not least, Nic (opportune bearer of chocolate, fudge, hugs and impromptu
motivational speeches; the MVP of my PhD). Together, you kept me alive and sane,
and I love you all more than I hate data cleaning (i.e. lots and lots and lots and lots
and lots).
To all my friends who ended up as part of a journey they didn’t sign up for: whose
birthdays I forgot, social gatherings I skipped, texts I didn’t reply to and conversations
I dominated with incessant mumblings about the cost of medications, missing data
and questions about the duration of their cough. You were all so patient and
supportive and I am blessed to have your friendship in my life. An extra special thanks
to my phenomenal girl squad (Ashlee & Ermina) who believed in me on the days I did
not.
To my wonderful, loving family who never once (at least not to my face) questioned
why I was doing a PhD. To Gill for modelling the benefit and value of hard work and
the joy that can be found in striving for perfection. To Paul for always listening openly,
never giving me an easy answer to a difficult question and for trusting me to work
things out myself. To Joseph for being the dork who never fails to make me laugh and
for always challenging me to be better than I am, but still loving me when I fall short.
To Ailsa, for all the good times we’ve had together that have helped me to
momentarily switch off from the PhD (especially the trips to Lick! ice-cream shop). I
promise this is the end of studying...at least for the time being.
Over the duration of my PhD I was very fortunate to have been supported by a
Supervisor Scholarship in 2016-2017, an Australian Government Research Training
Program Scholarship in 2017-2019 and a Centre for Research Excellence in
Respiratory Health of Aboriginal and Torres Strait Islander Children Top-Up
Scholarship in 2017-2018.

xxvi Burden of respiratory illnesses with cough in children from an economic and quality of life perspective, and the cost-effectiveness of early intervention
Funding
Funding for the Cost of Bronchiectasis study was provided by the Australian National
Health and Medical Research Council (NHMRC; project grant number 1019834), the
NHMRC Centre for Research Excellence in Lung Health of Aboriginal and Torres Strait
Islander Children (1040830), Cure Kids, Auckland, New Zealand (3702764/3539) and
Financial Markets Foundation for Children. Funding for the Tooth and Lung Sickness
in Murri Kids study was provided by a Queensland Children’s Medical Research
Institute/Queensland Children’s Health Foundation Project Grant, a University of
Queensland Foundation Research Excellence Award, a Queensland Government
Smart Futures Fellowship (51008), a QUT Indigenous Health start-up research grant
and scholarship top up support from the NHMRC Centre for Research Excellence in
Lung Health of Aboriginal and Torres Strait Islander Children (1040830). Funding for
the Emergency Department Cough study was provided by a Queensland Children’s
Medical Research Institute/Queensland Children’s Health Foundation Program
Grant. Funding for the Researching Interventions in Chronic Cough in Kids study was
provided by a NHMRC Project Grant (GNT1080298) and through the NHMRC Centre
for Research Excellence in Lung Health of Aboriginal and Torres Strait Islander
Children (1040830).

Chapter 1: Introduction 1
Introduction
This chapter outlines the background to this thesis (section 1.1), the research aims,
questions and objectives (section 1.2) and the significance of the research (section
1.3). Definitions of commonly used terms throughout this thesis are provided (section
1.4). The chapter concludes by outlining the remaining chapters of the thesis (section
1.5) and details my specific contributions to each study presented in the thesis.
1.1 BACKGROUND
Respiratory illnesses and cough are significant contributors to childhood morbidity1
and utilisation of healthcare services within Australia,2,3 however existing research
largely focuses on these illnesses from a clinical and epidemiological perspective.
There is a need to quantify the burden of these illnesses on children, families, and
health services from additional perspectives. Quality of life (QoL) is increasingly
recognised as an important patient-relevant outcome of healthcare and health
interventions, and therefore research in this area is highly valuable.4 Quantifying the
economic burden of illnesses and evaluating interventions from an economic
perspective is also required to ensure efficient and ethical allocation of limited
resources.5 It is important that the burden of respiratory illnesses and cough from an
economic and QoL perspective is understood by researchers, health professionals
and decision-makers. Research in these areas is particularly important for Indigenous
Australian children living in urban and regional areas. Similar to Indigenous Australian
children living in remote areas, Indigenous Australian children living in urban and
regional areas experience a disproportionately greater burden of respiratory illnesses
compared to non-Indigenous Australian children,6 yet are often overlooked in
Indigenous health research.7 Globally, it has been identified that there is a paucity of
health research from economic and QoL perspectives among Indigenous
populations.8,9 Addressing these research gaps will make a novel contribution to the
existing field of research into respiratory illnesses and cough in Australian children
through the provision of new knowledge and understanding. Reducing the burden,

2 Chapter 1: Introduction
and improving the outcomes, of respiratory illnesses during childhood have the
potential to positively impact on respiratory health outcomes throughout the whole
life of the child.
1.2 RESEARCH AIMS, QUESTIONS AND OBJECTIVES
1.2.1 Research aims
The aims of this thesis were to obtain findings to inform (a) public health strategies
to reduce the burden of respiratory illnesses and cough on children, their families,
and health services, and (b) clinical practice with respect to the management of
respiratory illnesses and cough among Indigenous and non-Indigenous Australian
children.
This has been achieved through the analysis of data collected from four research
studies on children with varying types and severities of respiratory illnesses with
cough, presenting to a range of healthcare services. These data were used to describe
and estimate the resource use, cost of illness, and impact on QoL of acute and chronic
respiratory illnesses with cough among Indigenous and non-Indigenous Australian
children, and to evaluate the cost-effectiveness of early intervention among children
with chronic cough.
1.2.2 Research questions
1. Among children aged <18 years with non-cystic fibrosis (CF) bronchiectasis,
attending tertiary paediatric respiratory clinics in Australia and New Zealand, over a
12 month period:
a) what is the frequency and types of health-related resource use, and;
b) what is the child and parent’s QoL, and do they correlate?

Chapter 1: Introduction 3
2. Among Indigenous and non-Indigenous Australian children aged <15 years
presenting to primary healthcare clinics and/or emergency departments (EDs) with
acute respiratory infection with cough (ARIwC):
a) what is the economic burden to caretakers, the public healthcare system
and third parties, and;
b) is the economic burden greater among episodes in which cough persists
for four consecutive weeks (chronic cough), compared to episodes in which
cough resolves within four consecutive weeks (acute or sub-acute cough),
and;
c) what child, family and illness-related characteristics are associated with a
greater economic burden of illness and;
d) what child, family and illness-related characteristics are associated with
cough-specific QoL?
3. Among Indigenous and non-Indigenous Australian children aged <15 years
presenting to primary healthcare clinics and/or EDs who develop chronic cough
following an episode of ARIwC, is early intervention using a cough management
algorithm cost-effective at achieving cough resolution from the perspective of the
public healthcare system and caretakers?
1.2.3 Objectives, presented by study
Study 1: Cost of Bronchiectasis
Chapter 4
1. To estimate healthcare resource use over a 12-month period for children aged
<18 years with bronchiectasis receiving ongoing care in paediatric respiratory
medical centres
2. To measure and correlate the health-related QoL of parents/carers and
children with bronchiectasis
4 Chapter 1: Introduction
Study 2: Tooth and Lung Sickness in Murri Kids
Chapter 5
1. To estimate the total cost of ARIwC per episode, per child-month of
observation, and per child-year.
2. To examine the distribution of total episode costs incurred between
caretakers, the public healthcare system and employers.
3. To examine the influence of cough duration and season of illness onset on
cost per episode.
4. To examine the association between baseline child/family characteristics and
cost per month of observation.
Study 3: Emergency Department Cough
Chapter 6
1. To estimate the total cost of ARIwC per episode.
2. To examine the distribution of total episode costs incurred between
caretakers, the public healthcare system, and third parties (employers and
private health insurance).
3. To examine the association between child, family and illness-related
characteristics and total cost per episode.
Chapter 7
4. To determine cough-specific QoL at the time of presentation to an ED for
ARIwC, and throughout the transitional period to chronic cough.
5. To examine the association between child, family and illness-related
characteristics and cough-specific QoL at the time of presentation to an ED
for ARIwC, and throughout the transitional period to chronic cough.

Chapter 1: Introduction 5
Study 4: Researching Intervention in Chronic Cough in Kids
Chapter 8
1. To determine the cost-effectiveness of an early intervention using a cough
management algorithm, compared to standard care, at achieving cough
resolution among children with chronic cough post-ARIwC from the
perspective of caretakers and the public healthcare system.
1.3 SIGNIFICANCE OF THE RESEARCH
This research will include the first Australian studies to prospectively examine
resource use associated with paediatric bronchiectasis, describe changes in QoL over
the duration of an episode of ARIwC among children, and estimate the cost of ARIwC
among Indigenous Australian children. It will also evaluate the cost-effectiveness of
early intervention with a cough management algorithm among children with chronic
cough for the first time.
The findings of this thesis can be used to inform evidence-based clinical guidelines
and policy decisions on the prevention and management of paediatric respiratory
illnesses with cough among Australian Indigenous and non-Indigenous children. The
findings will add to the body of knowledge on, and understanding of, the risk factors
for high costs, poor QoL and the cost-effectiveness of early intervention among
children with chronic cough. The incorporation of such information into future
research and practice is likely to result in improved health outcomes, more efficient
allocation of health services and resources, and increased responsiveness to the
needs and experiences of children and families.
1.4 DEFINITION OF TERMS
• Acute respiratory infection: an infectious illness caused by a variety of
bacteria and/or viruses which affects the upper and/or lower airways.

6 Chapter 1: Introduction
• Acute respiratory infection with cough: any ARI as described above that has
cough as a symptom.
• Acute cough: for children, an acute cough is a cough with a duration of <2
weeks.
• Sub-acute cough: for children, a sub-acute cough is a cough with a duration
of 2-4 weeks.
• Chronic cough: for children, a chronic cough is a cough with a duration of >4
weeks.
• Bronchiectasis: a chronic respiratory disease characterised by persistent wet
or productive cough, recurrent exacerbations and abnormal dilatation of
bronchial airways which is confirmed on chest high-resolution computed
tomography.
• Health-related QoL: a patient-centred subjective measure of the impact of an
illness, symptom or health condition on wellbeing.
• Cost of illness, caretaker perspective: the costs incurred by the individuals,
often parents and other family members, who care for the child in a non-
professional capacity as a result of an illness.
• Cost of illness, public healthcare system perspective: the costs incurred by the
government as a result of the public healthcare services and programs such
as Medicare, provided to or used by the child as a result of an illness.
• Cost of illness, third party perspective: the costs incurred by other parties as
a result of the child’s illness, outside of the two perspectives listed above. In
this thesis, this included employers and private health insurance companies
where applicable.
• Indigenous Australian: a person of Aboriginal and/or Torres Strait Islander
descent who identifies as Aboriginal and/or Torres Strait Islander and is
accepted as such by the community in which he or she lives.
Chapter 1: Introduction 7
1.5 THESIS OUTLINE
This thesis is made up of nine chapters, five of which are/will be publications (3
currently published, 1 submitted July 2019 and 1 nearing submission). Figure 1.1
outlines the different topics of research, research studies and publications included
in this thesis and their corresponding chapters.

8 Chapter 1: Introduction
Figure 1.1. Diagram of topics of research, research studies and publications included in this thesis and their corresponding chapters.

Chapter 1: Introduction 9
Chapter 2 contains a review of the existing literature on each of the topics relevant
to this thesis, including resource use, cost of illness, and QoL with respect to ARIs,
bronchiectasis and cough among Australian children. It also includes a summary of
existing research on an early intervention for chronic cough among children. The
chapter highlights gaps in knowledge and understanding of these topics. This chapter
is my own work, with minor editing by my supervisors.
Chapter 3 describes the study design of each of the four research studies included in
this thesis, including study population, setting, data collection procedures and ethical
considerations. It also describes the methods of measuring key study outcomes
(cough resolution and severity, QoL and cost) and methods of data analysis that were
consistently used across each of the studies. This chapter is designed to supplement
and provide context to the methods sections provided within each of the publications
(Chapters 4-8). This chapter is my own work, with minor editing by my supervisors.
Chapter 4 is the first publication and describes the results of the analysis of resource
use and QoL data from the Cost of Bronchiectasis (COBS) study. Chapter 4 addresses
research questions 1a and 1b. For this chapter I was responsible for data cleaning. I
conducted all analyses and produced the first and final versions of the manuscript.
Assistance with interpretation of findings and editing of the manuscript was provided
by my supervisors and other co-authors. Detailed contributions for each author are
provided in Chapter 4.
Chapter 5 is the second publication and describes the results of the analysis of the
resource use data from the Tooth and Lung Sickness in Murri Kids (TLSIM) study to
obtain an estimate of cost of illness. In combination with Chapter 6, Chapter 5
addresses research questions 2a, 2b and 2c. For this chapter I assisted with data
collection and data entry. I was responsible for data cleaning. I sourced all unit costs
required for data analysis. I conducted all analyses and produced the first and final
versions of the manuscript. Guidance with methods of data analysis, assistance with
interpretation of findings and editing of the manuscript was provided by my
10 Chapter 1: Introduction
supervisors and other co-authors. Detailed contributions for each author are
provided in Chapter 5.
Chapter 6 is the third publication and describes the results of the analysis of the
resource use data from the Emergency Department Cough (EDC) study to obtain an
estimate of cost of illness. In combination with Chapter 5, Chapter 6 addresses
research questions 2a, 2b and 2c. For this chapter I was responsible for data cleaning.
I sourced all unit costs required for data analysis. I conducted all analyses and
produced the first and final versions of the manuscript. Guidance with methods of
data analysis, assistance with interpretation of findings and editing of the manuscript
was provided by my supervisors and other co-authors. Detailed contributions for
each author are provided in Chapter 6.
Chapter 7 is the fourth publication and describes the results of the analysis of the QoL
data from the Emergency Department Cough (EDC) study. Chapter 7 addresses
research question 2d. For this chapter I was responsible for data cleaning. I conducted
all analyses and produced the first and final versions of the manuscript. Guidance
with methods of data analysis, assistance with interpretation of findings and editing
of the manuscript was provided by my supervisors and other co-authors. Detailed
contributions for each author are provided in Chapter 7.
Chapter 8 is the draft version of the fifth publication and describes the results of the
cost-effectiveness analysis of the cost and cough outcome data from the Researching
Intervention in Chronic Cough in Kids (RICCi) study. Chapter 8 addresses research
question 3a. For this chapter, I assisted with participant recruitment, questionnaire
design, data collection and data entry. I was responsible for data cleaning. I sourced
all unit costs required for data analysis. I conducted all analyses and produced the
first and final versions of the manuscript. Guidance with methods of data analysis,
assistance with interpretation of findings and editing of the manuscript was provided
by my supervisors and other co-authors. Detailed contributions for each author are
provided in Chapter 8.

Chapter 1: Introduction 11
Chapter 9 summarises the study findings with respect to the thesis aims and research
questions. The overall strengths and limitations of the research are discussed.
Conclusions and recommendations for clinical and public health practice and future
research have been proposed based on the findings of this thesis. This chapter is my
own work, edited by my supervisors.

12 Chapter 1: Introduction

Chapter 2: Literature Review 13
Literature Review
This chapter provides a detailed review of the existing literature relating to the key
topics covered in this thesis, and highlights gaps in knowledge and understanding of
these topics. The literature review begins with an explanation of the significance of
respiratory illnesses and cough among children. The prevalence and incidence of
acute respiratory infections (ARIs) and bronchiectasis will be described and the
substantial burden these illnesses place on families and health services will be
highlighted. The existing research and the current gaps in research with regards to
the impact of ARIs and bronchiectasis on quality of life (QoL) and economic burden
will then be discussed. The literature review will finish by discussing the potential for
early intervention to resolve cough among children with chronic cough.
The review is predominantly focused on research conducted within Australia given
the direct relevance of that research to the aims and research questions of this thesis.
Contextual characteristics of Australia make it challenging to apply and compare
international research to Australian populations and settings. Some of these
characteristics include demographic and cultural characteristics such as the focus on
Indigenous Australian children, and the structure and financing of the healthcare
system. International studies have been included when insufficient research on
Australian populations was available, or when the inclusion of international studies
was particularly relevant and/or meaningful, such as when examining or comparing
to Indigenous populations from other countries.
2.1 RESPIRATORY ILLNESSES AMONG CHILDREN
Respiratory illnesses contribute significantly to global morbidity, mortality and
burden of disease. Respiratory illnesses can be categorised into acute (where ARIs
are the most common) and chronic. The prevalence, incidence and severity of
respiratory illnesses vary between different illnesses and different populations. While
paediatric morbidity and mortality due to respiratory illnesses are highest in low to
14 Chapter 2: Literature Review
middle income countries,10-12 the burden of respiratory illnesses among children
living in high income countries remains substantial. The Australian Institute of Health
and Welfare (AIHW) reported that in 2011, respiratory disease contributed 12-17%
of the total burden of disease (measured using disability-adjusted life years) among
children aged 1-15 years.1 The proportion of the burden of disease due to respiratory
illnesses among this age group was greater than in any other age group. Within
Australia, disparities in respiratory health exist between Indigenous and non-
Indigenous Australians.13 Indigenous Australian children experience a higher burden
of disease due to respiratory illnesses and this is evident in hospitalisation rates and
mortality rates.13 Respiratory illnesses manifest themselves through the presence of
symptoms, of which cough is predominant and significant from the perspective of
children, families, clinicians and health services. The following section discusses this
in more detail.
2.1.1 Cough and its significance in respiratory illnesses
While different respiratory illnesses have distinct physiological and clinical
characteristics, the symptom of cough is a consistent feature of many ARIs and
chronic respiratory diseases (CRDs) experienced during childhood.14 Sarna et al.15
reported that among their cohort of healthy Australian children followed from birth
until 2 years of age, dry cough and wet cough were the second and third most
frequently reported symptom within all ARI episodes reported throughout the study.
Similarly, Kusel et al.16 reported that among a cohort study of Australian children aged
0-1 years with a high risk of atopy (risk determined prenatally through parent medical
history) cough was the second most frequently experienced symptom of an ARI, after
runny/blocked nose, and was reported in 77% of all ARI episodes. Similar findings
have been reported in international studies.17,18 These studies focus primarily on mild
episodes of ARI managed at home or in primary care, however the frequency of cough
among children requiring hospitalisation for a respiratory illnesses is also high, if not
higher. McCallum et al.19 reported that among 232 Indigenous Australian infants
hospitalised with bronchiolitis at the Royal Darwin Hospital, 98% had a parent-
Chapter 2: Literature Review 15
reported cough leading up to the hospital admission. This was the most frequently
reported symptom, alongside breathing difficulties.
Recurrent episodes of ARIs that involve cough are more likely to result in permanent
lung damage and contribute to the development and progression of chronic
respiratory illnesses such as bronchiectasis.20 The presence of a wet cough is more
likely to indicate the involvement of the lower airways, and may also indicate the
presence of an undiagnosed underlying chronic respiratory disease, such as
protracted bacterial bronchitis (PBB), chronic suppurative lung disease (CSLD) or
bronchiectasis.21-25 In a study of Indigenous Australian children aged 0 – 8 years with
non-cystic fibrosis (CF) bronchiectasis or CSLD, recruited from specialist clinics,
approximately 60% had a current cough at the time of enrolment, 72% had
experienced any type of cough in the past 12 months and 53% had experienced a
productive cough in the past 12 months.22 A greater proportion of children had
experienced a cough in the past 12 months than other respiratory symptoms such as
wheezing and dyspnoea (difficult or laboured breathing). Within a diagnosed CRD,
the presence of cough, particularly when persistent and/or wet and productive, may
indicate an exacerbation of illness or worsening of an existing condition.26
In addition to the high incidence of cough among children, the symptom of cough
often persists longer than other symptoms associated with an ARI such as runny nose
and fever.15,27,28 Among children, clinical guidelines classify a cough persisting for four
or more weeks as chronic.29,30 A cough that lasts between two and four weeks is
classified as sub-acute cough and a cough lasting for less than two weeks is classified
as acute cough. Chronic cough is considered an problematic outcome following an
ARI.31 A systematic review of studies of healthy children presenting to primary care
or an ED with an ARI found that 50% of children experienced cough resolution within
10 days and 90% within 25 days.32 This suggests up to 10% of children developed
chronic cough post-ARI; however this may be an underestimate as many of the
studies in the review measured cough duration from the time of presentation to
primary care/ED. If the onset of cough began prior to presentation to primary
care/ED, the proportion of children who developed chronic cough may have been
greater. In a cross-sectional analysis of urban Australian children aged 5-14 years,

16 Chapter 2: Literature Review
22% of parents reported that in the preceding 12 months their child had experienced
a cough lasting at least two weeks.33 Of these, 60% (approximately 13% of the total
study sample) reported that their child had experienced a cough lasting three weeks
or more. However, this was a retrospective study and therefore this estimate may be
biased by parents’ ability to recall the exact duration of their child’s cough.
Two recent studies of Australian children have used prospective study designs to
assess cough duration and to explore factors associated with the development of
chronic cough. The first study was conducted between December 2011 and August
2014 among children presenting to a paediatric ED with ARIwC.34 Approximately one-
fifth (22%) of children enrolled reported having experienced an episode of chronic
cough prior to the current episode of ARIwC. Irrespective of cough duration at
enrolment, the proportion of children who had persistent cough two weeks and four
weeks following enrolment were 39% and 20% respectively. Among the children who
developed chronic cough, 35% had wet cough, 26% had dry cough, 16% had a variable
(i.e. both wet and dry) cough and 23% had an unknown cough type. While the
majority of the cohort had a cough duration of less than one week at the time of
enrolment, approximately 3% of the total cohort reported a cough duration of greater
than four weeks both prior and post enrolment, over eight weeks total. Within this
cohort a cough duration of ≥14 days prior to presentation and a nose swab positive
for M. catarrhalis were the two factors associated with an increased risk of
developing chronic cough.35 Children presenting to ED during the spring season and
having received oxygen therapy during the ED presentation were associated with a
decreased risk of developing chronic cough.
The second study was conducted among a cohort of predominantly Indigenous
Australian children (90%) aged 0 – 5 years.36 At the time of enrolment, 24% of the
180 Indigenous Australian children enrolled in the study reported having previously
experienced ≥1 episode of chronic cough.37 All children enrolled in the study
(Indigenous and non-Indigenous, n=200) were followed-up over a 12-month period
to determine the incidence of ARIwC. Of all episodes reported during the study
period, approximately one-quarter (26%) resulted in chronic cough. Children aged

Chapter 2: Literature Review 17
<12 months, children attending childcare, children with a history of eczema and
children who had experienced previous episodes of chronic cough had significantly
higher risk of developing chronic cough post-ARIwC. Children with a non-Indigenous
father and an Indigenous mother were also identified has having an increased risk of
developing chronic cough post-ARIwC. This combination of parental Indigenous
status was more frequent among single-parent households compared to dual-parent
households, and consequently the authors of this study hypothesised that this
association was likely confounded.37
Among these cohorts, cough duration appears to be longer than what has previously
been reported among children.32 It is unclear to what extent this is a result of the
prospective study design, enabling cough duration to be determined during the
illness rather than post-illness, and to what extent this is a result of the study
population and/or setting. Indigenous Australian children and children presenting to
EDs may represent groups of children with more severe ARIs and poorer outcomes
than in previous studies. With respect to predictors of chronic cough, longer cough
duration prior to presentation (reported by O’Grady et al.35) and childcare
attendance (reported by Hall et al.36) have also been identified as being associated
with increased cough duration following presentation to primary care with acute
cough among children in the United Kingdom (UK).28
Finally, cough is often the prime focus of treatment and management by health
professionals. The characteristics of a cough, including type, duration, severity and
whether the cough is specific (i.e. indicative of a particular condition), assist clinicians
with determining the aetiology of the respiratory illness and reaching a diagnosis. The
clinical importance of cough is made apparent through the development of guidelines
to ascertain the aetiology of cough30,38,39 and algorithms to determine appropriate
treatment and management.40 It is also evident in the development of both objective
and subjective tools to measure the frequency, severity and impact of cough.41-45
18 Chapter 2: Literature Review
2.1.2 Importance of cough for children and families
Focusing on cough reflects the way in which children and families experience
respiratory illnesses. While in clinical practice and public health research it is
important to distinguish between specific respiratory illnesses and pathogens,
families, on the other hand, seek healthcare and express concerns in relation to
symptoms. Qualitative research from the UK conducted among parents of children
aged 5 months - 17 years who had recently consulted a primary care practice for a
respiratory infection with cough identified a number of concerns parents held with
regards to cough.46 Parents reported being concerned about the severity and
duration of cough and being concerned when they perceived their child experienced
more cough illnesses relative to siblings or other children. Parents also reported being
uncertain about their ability to manage and treat the cough illness at home and their
ability to distinguish between a ‘normal’ cough and a more serious cough. These
uncertainties were identified as factors that led to a parent’s decision to seek
healthcare. Furthermore, a number of parents reported feeling frustrated with the
outcome of seeking healthcare; describing feeling like their concerns weren’t been
taken seriously and being told repeatedly that it was ‘only a cough’.46
These findings have been echoed in recent research conducted among Aboriginal
community members regarding healthcare seeking for children with chronic wet
cough.47 Interviews with parents, carers and other community members highlighted
that the occurrence of paediatric chronic wet cough was often normalised, and that
the normalisation of cough had been reinforced through interactions with healthcare
professionals. There were multiple accounts of parents and carers seeking healthcare
for a child’s cough illness and being told that the cough was due to a virus, would go
away and/or there was little that could be done to resolve the cough. Among
Indigenous Australian children with bronchiectasis recruited into an observational or
interventional study, information regarding the impact of cough on the child’s life
was collected at the time of enrolment.22 While only 5% of children reported that
their cough had disrupted school in the past 12 months, 17% reported that their
cough had disrupted sports and 50% reported that their cough had disrupted their
sleep.

Chapter 2: Literature Review 19
2.1.3 Acute respiratory infections
ARIs include a range of infectious illnesses that affect the upper and lower respiratory
tract. Common ARIs affecting the upper respiratory tract include: rhinitis, sinusitis,
acute pharyngitis, epiglottitis, and laryngitis. Common ARIs affecting the lower
respiratory tract include: bronchitis, croup, whooping cough, bronchiolitis, and
pneumonia.48 A variety of bacteria and viruses cause ARIs and these vary between
seasons and years, resulting in annual and seasonal fluctuation of the frequency and
severity of ARIs.
Deaths due to ARIs in Australian children are uncommon49 with 3% of deaths in 2017
among Australian children aged <5 years being as result of pneumonia.50
Nevertheless, the epidemiological burden of ARIs among Australian children is
evident through prevalence and incidence rates of ARIs within the community51 as
well as through rates of healthcare attendance, including hospital admissions.52
While all children are at risk of experiencing ARIs during their childhood, a number of
socio-demographic, cultural, medical, family and household factors are associated
with increased risk of experiencing an ARI and/or severe ARI (i.e. requiring
hospitalisation).15,16,36,53-58 The effects of these factors may differ considerably
between population groups, and interactions between risk factors adds further
complexity. A comprehensive description of all of these factors is beyond the scope
of this literature review, however some key findings on risk factors from Australian
studies will be discussed.
A study undertaken in 2008-2009 among Australians of all ages, reported that the 4-
week period prevalence of ARIs was 46% among 0-4 year olds, decreasing to 41%
among 5-9 year olds and 36% among 10-19 year olds.51 Various factors contribute to
the disproportionately high number of ARIs in children compared to adults, including
biological, immunological and socio-environmental reasons. Indigenous Australian
respondents in this study reported a higher overall period prevalence of 39%,
compared to 25% among non-Indigenous Australians. This study also reported
prevalence was highest during winter months (34%), compared to autumn (25%),
spring (25%) and summer (14%) months. The results by Indigenous status and season

20 Chapter 2: Literature Review
were not further segregated by age, so it is unclear whether the higher overall
prevalence during winter months and in Indigenous Australians was found among all
age groups.
Data from the Australian National Notifiable Diseases Surveillance System indicate
that in 2018, children aged 0 – 4 years had the second highest notification rates for
laboratory confirmed influenza.59 Notification rates for pertussis were highest among
5-9 year olds, followed by 10-14 year olds and then followed by 0-4 year olds.59
Similarly, rates of respiratory syncytial virus (RSV) infection, a common cause of
bronchiolitis, are highest among young children.60 These findings show that in
addition to children being disproportionately affected by ARIs relative to adults,
young children are also disproportionately affected by ARIs, relative to older children.
Thus the predominant focus of paediatric respiratory research is on children aged ≤6
years.
The following paragraphs discuss community cohort studies on ARI among
Indigenous and non-Indigenous Australian children. Community-based studies are
studies in which the study population is drawn from the general community with the
intention of the sample being representative of the broader population. With respect
to research on ARIs in children, studies most commonly recruit healthy children
through childcare centres, schools and primary healthcare services. These studies
enable researchers to examine the prevalence and incidence of ARIs, as well as
identify risk factors associated with experiencing ARIs. Hospitalisation rates for ARIs,
and risk factors for hospitalisation, will be discussed later within the context of
healthcare resource use attributable to ARIs.
Community-based studies that have sought to estimate the number of ARI episodes
experienced by Australian children and identify associated risk factors are largely
restricted to children aged <5 years, and are consistent in their findings. Leder et al.,55
followed families with children living in Melbourne over a 15-month period. They
reported the annual rate of respiratory episodes per person was 3.8 per child among
children aged 0-1 years, decreasing to 3.3, 2.8 and 2.2 among children aged 2-3 years,

Chapter 2: Literature Review 21
4-5 years and 6-10 years respectively. Kusel et al.16 reported similar findings among
infants from Perth who were at high risk of atopic disease (asthma, eczema and hay
fever). Almost all children (94%) in this study experienced an ARI during their first
year of life and the median number of episodes experienced was four.16 Of all ARIs
reported during the 12-month period, 33% were reported in May, June and July,
compared to 18% in December, January and February. In a subsequent study of this
same cohort Kusel et al.,53 reported that the mean number of episodes experienced
decreased from four per year to two per year, between the ages of 0-2 years to 4-5
years. Two other factors were identified as being associated with experiencing more
ARIs: being male and exposure to other children through siblings or childcare
attendance.53
A Brisbane-based birth cohort study reported a mean of 0.56 episodes of ARI (95% CI
0.54, 0.59) per child-month among children aged 0-2 years.15 The incidence rate ratio
of ARIs among children aged 0-2 years was 1.9 per child-month (95% CI 1.6, 2.2) in
winter, 1.6 (95% CI 1.4, 1.8) in autumn and 1.3 (95% CI 1.1, 1.5) in spring, all relative
to summer. Children attending formal and/or informal childcare had an incidence
rate ratio of 1.9 per child-month (95% CI 1.6, 2.3) relative to children not attending
childcare. Finally, Lambert et al.54 examined risk factors for influenza-like-illness (ILI)
among children aged 1-5 years during the 2001 influenza season in Melbourne. The
findings were consistent with the previous studies discussed: rates of ILI episodes per
child-month decreased with increasing age; were higher among children attending
childcare, preschool or school compared to children attending none; and were higher
in males compared to females.54 Two factors that had not been identified in previous
studies included income and private health insurance; children from families with
private health insurance and higher income reported higher rates per child-month
than children from low income families and without private health insurance.54 It is
important to note that these findings were identified solely through univariate
analyses and therefore may not reflect independent associations. Additionally, none
reached statistical significance (defined as p<0.05).
While the five community-based studies described above15,16,53-55 were not exclusive
of Indigenous Australian children (i.e. Indigenous status was not a criteria for study

22 Chapter 2: Literature Review
inclusion/exclusion), only one study15 reported the proportion of study participants
who identified as Indigenous Australian. Sarna et al.15 reported that 2/154 (1%)
identified as Aboriginal and that this proportion was representative of the Brisbane
population. None of the studies compared rates of ARI between Indigenous and non-
Indigenous Australian children.
Only one study could be identified that has examined the community incidence of
ARIs among a predominantly Indigenous Australian cohort (90% of total cohort).36
This study focused on children aged <6 years living in urban South-East Queensland.
Unlike the previous community-based studies described,15,53-55 this study focused
specifically on ARIs with cough as a symptom. This study examined prevalence,
incidence and risk factors for ARIwC from a number of perspectives.36 Firstly, among
the Indigenous Australian children the prevalence of ARIwC at the time of enrolment,
and associated factors were examined. One-third of the cohort (60/180, 33%) had an
ARIwC at the time of enrolment. In multivariable analyses, low birthweight, a history
of eczema and having a family member from the Stolen Generation or not knowing if
you had a family member from the Stolen Generation, were significantly associated
with increased risk of having an ARIwC at enrolment.37 The Stolen Generation refers
to Indigenous Australian people who, as children, experienced separation from their
families and communities by compulsion, duress or undue influence as part of
Government laws, policies and practices at the time.61 Secondly, the incidence
density of ARIwC during the 12-month study period was estimated. Incidence density
is a more precise measure of risk, compared to the more commonly reported
measure of cumulative incidence, as it takes into account the periods in which
someone is at risk or not at risk of illness.62 Overall the incidence density of ARIwC for
the cohort was 24.9 per 100 child-months. The incidence density of ARIwC was also
calculated by age, sex and Indigenous status. Incidence density decreased as child
age increased36 which is consistent with other studies.53-55 In contrast, the incidence
density was higher among females (27.0 per 100 child-months; 95% CI 23.2, 31.3)
than males (23.1 per 100 child-months; 95% CI 19.9, 26.6) which contradicts previous
Australian research.53 The incidence density of ARIs was lower among the Indigenous
Australian children (23.7 per 100 child-months; 95% CI 21.2, 26.5), relative to the non-
Chapter 2: Literature Review 23
Indigenous children (34.4 per 100 child-months; 95% CI 25.7, 45.3). However, the
authors note that of the 20 non-Indigenous children enrolled in the study, three
children in particular may have skewed the incidence estimates due to experiencing
multiple, prolonged respiratory illnesses during the study. One of these participants
was subsequently diagnosed with bronchiectasis. Finally, the study examined risk
factors for recurrent ARIs using multivariable analyses. A history of eczema and
having an Indigenous mother but non-Indigenous father were associated with an
increased risk of recurrent ARIs (defined as ≥ 4 episodes of ARIwC during a 12-month
period), whereas the presence of mould in the house, and casual or part-time
employment or unemployment, were associated with decreased risk of recurrent
ARIs.
Overall, the incidence of ARIs in Australia is high, with almost all children experiencing
at least one ARI during childhood. Experiencing recurrent episodes throughout
childhood is also common. Australian research suggests that on average healthy
children experience between 2-5 episodes of ARI per year. Younger age, winter
months and childcare attendance have consistently been reported to be associated
with increased incidence of ARIs.
2.1.4 Bronchiectasis
Bronchiectasis is a CRD where there is abnormal dilation of the airways leading to an
impaired ability to clear mucus from the airways.63 This impairment increases the risk
of experiencing respiratory tract infections which further contribute to airway
damage, thereby increasing future risk of respiratory tract infections. Bronchiectasis
is considered a severe disease and is associated with premature mortality.64 Chronic
wet cough is the most frequent symptom of bronchiectasis and recurrent acute
respiratory exacerbations can be frequent.22,65-67 Bronchiectasis is considered to be
on the end stage of a spectrum of respiratory illnesses associated with chronic wet
cough.24 This spectrum starts with protracted bacterial bronchitis, progresses to CSLD
and ends with confirmed bronchiectasis.24 Confirmed bronchiectasis refers to the
requirement for clinical symptoms of bronchiectasis to be confirmed by chest high-
resolution computed tomography (HRCT) before a diagnosis of bronchiectasis can be

24 Chapter 2: Literature Review
given.68 As such, the diagnosis of bronchiectasis is dependent on case ascertainment
and may go undiagnosed if a clinician is unaware and does not undertake HRCT. If the
clinical symptoms of bronchiectasis are present, but have not been confirmed
through a chest HRCT, or a chest HRCT does not show evidence of bronchiectasis, a
diagnosis of CSLD is given.
The causes of bronchiectasis among children are not well understood. Cystic fibrosis
is a common cause of bronchiectasis in Caucasian populations, but non-CF related
bronchiectasis is more common than CF related bronchiectasis at the global level.69
There is emerging evidence that recurrent ARIs, in particular lower respiratory tract
infections (LRTIs), may play a role in the development and progression of
bronchiectasis.70 Indigenous Australian children who experience higher rates and
severity of LRTIs, also experience a substantially greater burden of bronchiectasis,
relative to non-Indigenous Australian children.71 For these reasons (the
predominance of cough as a symptom, the role of ARIs in the casual pathway and the
disproportionate burden among Indigenous Australian children), bronchiectasis was
chosen as the CRD of focus within this thesis.
The epidemiological burden of bronchiectasis in Australia is not well-researched.
There have been no population-based studies examining the prevalence or incidence
of bronchiectasis among Australian children. Consequently, current knowledge on
the frequency of bronchiectasis among Australian children relies on data obtained
from hospitalised cohorts; two of these studies were conducted in the Northern
Territory71,72 and one in Queensland.73 Among Indigenous Australian infants in the
Northern Territory born between 1999 and 2004 and hospitalised during the first 12
months of life, the incidence of bronchiectasis was 1.18 per 1000 child-years (95% CI
0.60, 2.16).72 Chang et al.71 identified children aged ≤15 years with CSLD through both
retrospective and prospective review of medical charts at the Alice Springs Hospital
in Central Australia. The prevalence of CSLD was estimated to be 4.9 per 1000 among
all children and the prevalence among Aboriginal children was estimated to be 14.7
per 1000.71 Janu et al.73 examined hospitalisations among children at Mt Isa Base
hospital (Queensland) between 2007 and 2011. All children that were hospitalised

Chapter 2: Literature Review 25
for bronchiectasis during the study period were identified as Indigenous Australian.
The annual average hospitalisation rate for bronchiectasis was 4.1 per 1000 (95% CI
1.0, 10.1) among children aged <2 years.
Internationally, the prevalence of bronchiectasis has been estimated among cohorts
of children from Alaska,66 Canada,65 New Zealand74 and Spain.75 Estimates from New
Zealand, Canada and Alaska are most relevant given the similar disparities in health
between Indigenous and non-Indigenous peoples within these countries and
therefore these studies will be briefly discussed. A study of children with confirmed
bronchiectasis presenting to a tertiary children’s hospital in Auckland, New Zealand
estimated a prevalence of 0.17 per 1000 among all children aged ≤15 years.74 The
prevalence was estimated to be higher among Pacific Island children (0.53 per 1000
children) and Maori children (0.24 per 1000 children). In Canada, the prevalence of
bronchiectasis among Inuit children in Eastern Ontario was estimated through
assessment of health records at the major paediatric tertiary referral hospital in the
region between 1998 and 2011.65 Among this cohort, prevalence was conservatively
estimated at 2 per 1000 children. Finally, in a study of Alaskan Native children living
in a remote area, the prevalence of bronchiectasis among children born between
1990 and 1999 was estimated to be 13.4 per 1000.66
All of the Australian and international studies described above have been single-
centre studies which have relied on medical records or databases within tertiary
healthcare facilities to estimate prevalence and/or incidence. Consequently, the
reliability and generalisability of these studies are limited. This is likely to explain why
estimates of prevalence varied between studies conducted in different countries, as
well as between studies conducted in the same countries. Nevertheless, the research
suggests that Indigenous children experience a higher burden of bronchiectasis than
non-Indigenous children, regardless of their country.
2.2 RESOURCE USE ASSOCIATED WITH RESPIRATORY ILLNESSES
Given the demonstrated prevalence and incidence of respiratory illnesses among
Australian children, it is not surprising that the impact of respiratory illnesses is

26 Chapter 2: Literature Review
experienced across all levels of healthcare, as well as by families and other caretakers.
The following section describes the use of primary healthcare services, rates of ED
presentations and hospitalisations, and medication consumption associated with
ARIs, cough and bronchiectasis. Time off work for parents/other caretakers and time
off school/childcare among children as a result of ARIs, cough and bronchiectasis are
also discussed. Research on resource use associated with respiratory illnesses use can
be examined from two perspectives; firstly, the quantity of all health-related
resource use which is attributable to respiratory illnesses and secondly, the
frequency and quantity of resource use within an individual episode of a respiratory
illness. Data on the former are usually collected from population level sources such
as national databases, or from medical records. The reliability of these data depends
on the ability of health professionals and health services to accurately code and
report information such as reasons for presentation or admission and diagnoses.
Data on the latter are usually collected from individual level sources, such as
parent/guardian completed questionnaires. The reliability of these data are therefore
dependent on the ability of research participants to accurately recall and report these
elements of resource use. Where research was available, resource use from both
perspectives have been discussed in the following sections.
2.2.1 Primary healthcare services
Primary healthcare services in the Australian context include healthcare provided in
a home or community setting; it excludes healthcare provided in a hospital setting.76
Primary healthcare in Australia is usually the first point of contact with the healthcare
system and acts as a ‘gatekeeper’ to other healthcare services, including specialist
care. While primary healthcare services are most frequently provided by a general
practitioner (GP), other healthcare professionals such as nurses, Aboriginal health
workers and pharmacists may be involved in providing primary healthcare. Primary
healthcare in Australia is subsidised through a universal insurance scheme called
Medicare.

Chapter 2: Literature Review 27
Acute respiratory infections
Between 1971 and 2001, ARIs were consistently the most frequently managed
paediatric illnesses by GPs in Australia.2 In 2001, upper respiratory tract infections
(URTIs), tonsillitis, bronchitis and bronchiolitis accounted for 22% of all problems
managed by GPs for children aged <15 years.2 More recent data collected between
2007 and 2012 among children aged <5 years reported that respiratory infections
were responsible for 30% of all GP encounters.77 URTIs were the most commonly
managed respiratory illness with a rate of 18.6 encounters per 100 (95% CI 8.1, 19.2),
followed by bronchitis (4.2 encounters per 100; 95% CI 3.9, 4.4), tonsillitis (2.7
encounters per 100; 95% CI 2.5, 2.9) and pneumonia (0.6 encounters per 100; 95% CI
0.5, 0.7). Consultation rates for URTIs, bronchitis, tonsillitis and pneumonia were all
higher during winter than during summer.77 When examining healthcare seeking
rates within ARI episodes, Australian community-based studies have found that
among children aged ≤5 years, a GP is consulted in 40-60% of ARI episodes.15,53,78
Similar findings were reported in a prospective cohort study of urban, predominantly
(90%) Indigenous Australian children aged <5 years, in which 48% of episodes of ARI
with cough involved a GP attendance.36 GP attendance has been reported to
decrease among older children, with approximately one quarter of children aged >5
years presenting to a GP for respiratory symptoms.78 GP attendance has also been
reported to differ by type of ARI, with 44% of URTI episodes among children aged <2
years resulting in a GP visit compared to 58% of LRTI episodes.15
The majority of studies that have examined the frequency of primary healthcare visits
among Indigenous Australian children have been conducted in rural and remote
communities of Australia.79-81 These settings differ considerably geographically and
demographically from urban and regional settings of Australia, and face their own
unique health and epidemiological challenges. Therefore, healthcare use among
Indigenous Australian children in these studies may not be representative of
healthcare use among Indigenous Australian children elsewhere. Nevertheless,
results from these studies will be presented given a paucity of data from other
settings.

28 Chapter 2: Literature Review
Two studies of children living in remote Aboriginal communities in the Northern
Territory retrospectively examined clinic records to identify the frequency of, and
reason for, presentation.79,80 Kearns et al.80 reported that during the first year of life,
307/320 (96%) children presented at least once for an URTI and 239/320 (75%)
presented at least once for a LRTI. The median number of presentations for URTIs
was 6 (IQR 3-10) and for LRTIs was 3 (IQR 2-5).80 Among a subset of participants from
this study cohort, Clucas et al.79 examined clinic records for children during the first
five years of life. Over the study period from January 2002 until September 2005,
172/174 children (99%) presented at least once for an URTI and 139/174 children
(80%) presented at least once for a LRTI. Children in this cohort had a median of 16
visits to the clinic per child per year, with 32% of all presentations due to URTIs and
11% due to LRTIs. Among a study of 231 Indigenous Australian children aged <6 years
from four remote communities in Western Australia,81 the proportion of children
who presented to the community health clinic at least once for a respiratory infection
was lower than reported by Clucas et al.79 and Kearns et al.,80 but nevertheless
remained high. Among the Western Australian cohort, 75% of children presented at
least once for an URTI, whereas 51% presented at least once for a LRTI.
The sole urban Australian study that could be identified,82 reported that among a
cohort of urban Indigenous Australian children in Queensland, presentation rates to
primary healthcare for ARIs were 22.8 per 100 child-months (2.74 per child-year) for
children aged <5 years. It was not possible to provide comparable rates per 100 child-
years between the three studies above given limitations in the published data and
differing case-definitions.
Cough
In 2015-2016, cough was the fourth most common reason to present to a GP across
Australia, representing 4% of all encounters, and a rate of 6.2 per 100 encounters
(95% CI 5.8, 6.6).83 The top three most common reasons were all related to requests
for a particular process of care (i.e. consultations for prescription, check-ups and test
results). There are little data on the use of primary healthcare services specifically

Chapter 2: Literature Review 29
among children with cough. A Brisbane study of 190 children newly referred to a
tertiary paediatric hospital for chronic cough reported that in the 12 months prior to
the study, 80% had ≥5 and 53% had >10 visits to a GP for their cough illness.84 In
another Brisbane study of children presenting to an ED of a tertiary paediatric
hospital with ARIwC, 56% had presented to another healthcare provider for their
cough prior to the ED presentation.85 These studies suggest that for both acute and
chronic cough, regardless of the cause of cough, use of primary healthcare services is
common.
Bronchiectasis
According to a report by the AIHW published in 2010, population level information
on resource use associated with bronchiectasis within Australia is limited.63 The
report states that in 2006-07 bronchiectasis accounted for approximately 5 per
10,000 encounters with GP’s within Australia. These data are not segregated by age
or Indigenous status. Updated reports of these data have not been published and
there have been no other studies examining the use of primary healthcare services
for bronchiectasis among Australian children, or children elsewhere.
2.2.2 Emergency department presentations and hospitalisations
Acute respiratory infections
Within community-based studies, rates of ED presentations and hospitalisations for
ARIs are considerably lower than rates of attending primary healthcare services.
Sarna et al.,15 in their cohort study of children aged 0-2 years from Brisbane, reported
that 5% of all ARI episodes included an ED presentation and <1% of episodes resulted
in a hospitalisation. When looking at only those episodes that were identified as being
LRTI (28% of all ARI episodes in the cohort), the proportion of episodes presenting to
ED and the proportion being hospitalised was higher (11% and 2% respectively).
These findings are very similar to Kusel et al.’s53 study of children aged 0-5 years
identified prenatally as being at high risk of atopy. In their study, 1% of all ARI
episodes and 2% of LRTI episodes resulted in hospitalisation. The proportion of
episodes involving a presentation to an ED was higher among Hall et al.’s36 cohort of

30 Chapter 2: Literature Review
urban, predominantly Indigenous Australian children aged 0-5 years, with 16% of
episodes of ARI with cough involving an ED presentation. The findings are supported
by research conducted among Aboriginal and non-Aboriginal children aged 0-9 years,
born in metropolitan Western Australia between 1996 and 2005.86 Among non-
Aboriginal children in the cohort who presented to ED with a respiratory illness, 75%
presented once and 25% presented multiple times. This was compared to Aboriginal
children in the study cohort of whom 63% presented once and 37% presented
multiple times.86 It is unclear whether the higher use of EDs within these cohorts of
Indigenous Australian children is due to a higher actual or perceived severity of illness
within the cohort, physical or financial accessibility to services, or other factors.
Despite low rates of ED presentations within ARI episodes, when examining
diagnoses assigned by medical professionals at time of discharge from an ED, ARIs
are consistently among the most frequent diagnosis. A study of 11 paediatric EDs
across Australia and New Zealand reported that in 2004, URTIs, acute croup and acute
bronchiolitis were the third, fifth and seventh most frequent diagnosis given to
paediatric ED patients (0-18 years) respectively.3 Combined, these illnesses
comprised 9% of all diagnoses among children aged 0-18 years. When examining the
most frequent diagnoses by age, the burden of respiratory infections was
considerably greater among younger children. Bronchiolitis and URTI made up 21%
of diagnoses among infants (<1 year), and croup and URTI made up 11% of diagnoses
among children aged 1-4 years.3 For children in the 5-9, 10-14 and 15-18 year age
groups, asthma was consistently in the top five most frequent diagnoses.3 It is
plausible that many of these were a result of asthma exacerbations prompted by a
viral respiratory infection.87 Seasonal trends in ARI incidence and severity are also
reflected in ED presentations. A study conducted between 1993 and 2004 in the
Australian Capital Territory examined incident rate ratios (IRRs) of ED presentations
and admissions by season (using summer as the reference group) for a range of
respiratory conditions among children aged <5 years.88 For bronchiolitis and ‘other
respiratory conditions’ (including influenza, pneumonia, URTIs and allergic rhinitis),
the IRRs for ED presentations were highest in winter. For croup, the IRRs for ED
presentations were highest in autumn.

Chapter 2: Literature Review 31
With respect to hospitalisations, the Australian Bureau of Statistics reported that in
2004-2005, 25% of hospitalisations among children 1-14 years were due to
respiratory diseases.89 However, it is unclear what proportion of these were due to
ARIs and what proportion were due to CRDs. The AIHW reported that in 2006-2007,
hospitalisations where influenza or pneumonia was the primary diagnosis were
approximately 500 per 100,000 among all Australian children aged <5 years.63 In
addition to higher rates of presentation to EDs, hospitalisation rates also appear to
be higher among Indigenous Australian children than non-Indigenous Australian
children. Acworth et al.3 noted that in their study of 11 paediatric EDs across Australia
and New Zealand, Aboriginal children (in Australia) and Maori/Pacific children (in
New Zealand) were more likely to be admitted to hospital following ED presentation
than their non-Indigenous counterparts. Moore et al.,90 examined differences in
hospitalisation rates exclusively due to LRTIs (including bronchiolitis, pneumonia,
bronchitis, influenza and whooping cough) in Western Australia between 1995 and
2005. Among children aged 0-9 years, hospitalisation rates were 93.0 per 1000
person-years for Aboriginal children, compared to 16.1 per 100 person-years for non-
Aboriginal children. In 2005, after that study was conducted, widespread
implementation of the pneumococcal conjugate vaccine began across Australia
which has since been associated with declines in hospitalisations due to
pneumonia.91 Despite this, hospitalisation rates for pneumonia, as well as other
LRTIs, remain significantly higher among Indigenous Australian children. Janu et al.73
reviewed hospitalisations at Mt Isa Base hospital (north-west Queensland) from
2007-2011 among children aged <15 years. The average annual hospitalisation rate
for pneumonia was 13.7 (95% CI 9.1, 19.3) per 1000 children among Indigenous
Australian children, compared to 2.3 (95% CI 1.0, 4.5) per 1000 among non-
Indigenous Australian children. For bronchiolitis, Indigenous Australian children
experienced a rate of 71.3 (95% CI 44.3, 106.0) per 1000, compared to 14.7 (95% CI
6.0, 27.6) per 1000 among non-Indigenous Australian children. The most recent
nationwide data on paediatric respiratory hospitalisations reported that from July
2011-June 2013 among children aged <4 years, hospitalisation rates for diseases of
the respiratory system were 79 per 1000 separations for Indigenous Australian
children and 46 per 1000 separations for non-Indigenous Australian children.92 In
32 Chapter 2: Literature Review
addition to higher hospitalisation rates, some research has suggested that Indigenous
Australian children also have higher resource use needs during hospitalisation
compared to non-Indigenous Australian children. Bailey et al.93 reported that
Indigenous Australian children aged ≤2 years admitted to the Royal Darwin Hospital
for bronchiolitis between April 2005 and December 2006 had longer lengths of stay,
were more likely to require oxygen and were more likely to require antibiotics.
Cough
Few studies have examined ED presentations or hospitalisations by presenting
complaints or symptoms. Those that have done so are international studies. For
example, a survey conducted in the United States (US) from 2003-2004 at “hospital
emergency and outpatient departments of non-federal, short-stay, and general
hospitals” collected patient-reported reasons for ED visits.94 Results from this study
indicated that the presentation rate for cough as the primary reason was 49 per 1000
persons among children aged <15 years, which was higher than any other age group.
Among children aged <15 years, cough was the second most frequent reason for ED
presentation, after fever. No published studies on rates of presentations to EDs, or
hospitalisations, for cough among Australian children could be identified.
Bronchiectasis
Data on hospitalisations as a result of bronchiectasis are limited in the Australian
context. The AIHW reports that the hospitalisation rate for bronchiectasis was 18.5
per 100,000 separations in 2006-07.63 In an analysis of bronchiectasis hospitalisation
data in Queensland for the period 2005 – 2009, the average annual age standardised
hospitalisation rates among children aged <15 years ranged from 29.4 to 56.4 per
100,000 for Indigenous Australian children compared to 14.9 to 36.5 per 100,000 for
non-Indigenous Australian children.95 However Indigenous status was missing in over
600 hospitalisations. It was also identified that coding errors were occurring with
respect to chronic obstructive pulmonary disease being applied as a discharge
diagnosis to children despite it not being a paediatric disease. Despite these
limitations, similar findings have been reported among children in New Zealand;

Chapter 2: Literature Review 33
hospital admission rates for bronchiectasis between 2008/09 and 2012/13 were
higher for Maori and Pacific children, compared to children of European or other
ethnicities.96 Overall, admission rates for bronchiectasis were estimated to be 50 per
100,000 among children aged <15 years.96 Finally, a study of Australian and Alaskan
children aged 6 months - 8 years with bronchiectasis reported on characteristics of
acute respiratory exacerbations (AREs).67 Among this cohort a median of 2 AREs were
experienced per child over a 3-year period and 15% of AREs resulted in
hospitalisation.
2.2.3 Medication use
Acute respiratory infections
A variety of over-the-counter medications are frequently used during ARI episodes,
including analgesics/antipyretics (e.g. paracetamol and ibuprofen), decongestants
(e.g. nasal sprays) and antitussives (e.g. cough mixtures).54 Australian community-
based studies suggest analgesics/ antipyretics are used in up to 60% of episodes53,97
and that decongestants or antitussives are used in 50-60% of episodes.53 These
studies were conducted prior to 2012, before the Australian Therapeutic Goods
Administration advised that over-the-counter cough medicines should not be given
to children aged <6 years. Consequently, current rates of over-the-counter cough and
cold medications may have decreased. A more recent study of children presenting to
the ED of a tertiary paediatric hospital in Perth (Western Australia) with influenza-
like-illness, reported that analgesics/antipyretics were used in over 80% of episodes
and decongestants/antitussives in 12-20% of episodes.98
Prescription medications, including antibiotics, bronchodilators and inhaled or oral
steroids, are also common. Antibiotics are reported to be consumed in 20-42% of all
ARI episodes among Australian children.15,36,53,97,98 Biezen et al.,77 examined a
random sample of GP visits across Australia among children aged <5 years presenting
for respiratory infections and as expected antibiotic prescription rates differed
between respiratory illnesses. Antibiotic prescriptions varied considerably from 89
per 100 encounters for tonsillitis, 66 per 100 encounters for pneumonia, 55 per 100

34 Chapter 2: Literature Review
encounters for bronchitis and 20 per 100 encounters for URTIs. Fewer studies have
reported rates of prescription medications other than antibiotics. Biezen et al.,77 in
the same study as described above, reported that prescriptions for non-antibiotics
varied from 6 per 100 encounters to 22 per 100 encounters, depending on the type
of respiratory illness. Hall et al.,36 reported that among their urban community-based
cohort of predominantly Indigenous Australian children aged <6 years,
bronchodilators were prescribed in 7% of episodes of ARI with cough, oral steroids
were prescribed in 5% and inhaled corticosteroids were prescribed in 3%.
Cough
Anderson-James et al.85 examined medication use among children presenting to an
ED of a tertiary paediatric hospital with acute cough and who subsequently received
a diagnosis of bronchiolitis, croup, ‘wheeze/reactive airways disease’ or non-specific
ARI. Excluding use of simple analgesics and antipyretics, 53% of the cohort reported
taking some type of medication in the 7 days prior to presentation. Approximately
24% of the cohort had used bronchodilators, 23% had used oral corticosteroids and
15% had taken antibiotics. Use of medications differed by diagnosis: oral
corticosteroids were highest among children diagnosed with croup, use of
bronchodilators was highest among children diagnosed with wheeze/reactive
airways disease and use of antibiotics was highest among children diagnosed with
non-specific ARI. Thomson et al.99 reported on medication use among a group of 49
children newly referred to a tertiary paediatric respiratory clinic in Brisbane in 1998
for chronic cough. The median duration of cough at time of referral was 18 months.
Prior to referral, 60% had been prescribed bronchodilators, for a mean duration of
11.25 months. Additionally, 49% had been prescribed inhaled corticosteroids, 31%
prescribed oral steroids and 20% prescribed antibiotics.
Bronchiectasis
One study has reported on medication use among Indigenous children aged <10 years
with non-CF bronchiectasis or CSLD from Australia, New Zealand and Alaska.22 At the
time of enrolment into the study, information was collected through parent-report

Chapter 2: Literature Review 35
on whether the child was currently taking regular medications. Among the
Indigenous Australian children enrolled in the study the proportion of children taking
antibiotics, bronchodilators and corticosteroids (oral or inhaled) was 47%, 6% and 4%
respectively. The proportion of children taking each type of medication varied
significantly between the three countries for unknown reasons.
2.2.4 Time off work, school and childcare
The impact and burden of respiratory illnesses is not restricted to the healthcare
sector. In addition to the care provided by health professionals when children are
sick, parents and other caretakers including grandparents, siblings, and family
friends, spent time caring for children.55,78 The time spent caring for a child with a
respiratory illness applies both to the time spent by parents and other caretakers to
care for a child at home, as well as the time spent seeking healthcare for the child. As
a result, respiratory illnesses among children are often associated with time off work
for parents and other caretakers in full-time employment, and/or time off usual non-
work activities for parents and other caretakers not in full-time employment such as
‘stay-at-home’ parents, parents who are studying, parents in part-time or casual
employment, and parents on paternity/maternity leave. Data collected through the
Australian Population Census reported that in 2011, 65% of mothers and 90% of
fathers with children aged <18 years were employed.100 Among Australian couples
with children aged <18 years, 21% of couples had both parents working full-time, 34%
had one parent working full-time and one parent working part-time, and 28% had
one parent working full-time and one parent not employed.
Respiratory illnesses may also interfere with school or childcare attendance.101 Data
collected from The Longitudinal Study of Australian Children reported that in 2011,
16% of Australian children aged 0-1 years were in some form of formal early
childhood education or care (includes long day care and preschool).102 This increased
to 58% among children aged 2-3 years and 93% among children aged 4-5 years who
were not yet attending school.

36 Chapter 2: Literature Review
Comparable national data specifically for Indigenous Australian children and families
are difficult to obtain. However, nationally there is a higher overall level of
unemployment among Indigenous Australian adults aged ≥15 years, compared to
non-Indigenous Australians (18 vs 7% in 2016).103,104 Among Australian children aged
4-5 years, attendance at a preschool program in 2015 was 80% among Indigenous
Australian children, compared to 93% among non-Indigenous children.13
Acute respiratory infections
Illness or injury has been reported to be the most common reason children are absent
from childcare. Of all illnesses and injuries, ARIs, in particular URTIs, are the most
common.105 Leder et al.55 reported that in a study of families in Melbourne with at
least 4 family members (including 2 children aged 1-15 years), 23% of reported
respiratory episodes were associated with time off school or work. While it is
presumed that any time off school was a result of a respiratory episode of a child, it
is unclear whether the time off work reported in this study was a result of a
respiratory episode of a child or parent. Among a cohort of healthy children aged 1-
6 years from Melbourne, Lambert et al.54 collected data on resource use associated
with episodes of influenza-like-illness (ILI) that occurred during the influenza season
in 2001. Among the ILI episodes in which resource use data were available, 62%
reported a parent or other caregiver spending additional time caring for their child
due to the illness. Similar findings are reported by Willis et al.98 among children aged
<5 years presenting to ED for ILI: at least 60% of children had missed some school or
day care and at least 50% of parents had missed some work due to the child’s illness.
While the above studies highlight the frequency of missing work, school and
childcare, the extent of the impact of ARIs is not accurately portrayed without data
on the quantity of work, school and childcare missed per episode of illness. There are
a limited number of studies quantifying the amount of time off work, school and
childcare among Australian families as a result of ARIs in children, and those studies
that do are primarily focused on mild ARIs. Lambert et al.54 reported the mean
additional time parents spent caring for their child per episode of ILI was 1.9 hours
Chapter 2: Literature Review 37
away from work and 9.7 hours away from usual activities. Furthermore, a mean of
0.9 hours per episode was spent seeking healthcare. This study was conducted
among children aged 1-6 years in Melbourne during the 2001 influenza season.
Similar studies among similar cohorts have reported similar findings.106,107 Among
these studies, female adults reported spending more time caring for the child or
seeking healthcare for the child, than male adults. More time was spent away from
usual non-work activities compared to time away from work, and more time was
spent caring for the child than spent seeking healthcare. Evidently the amount and
distribution of time spent caring by mothers and fathers, whether this time is to seek
healthcare or care for the child, and whether the time is off work or off usual activities
is highly dependent on the severity of ARI and the employment status of parents,
amongst other factors. For example, Yin et al.97 reported that the majority of children
in their cohort (73%) had both parents employed and consequently the time spent
away from work due to the child’s ILI episode was greater than the time spent away
from non-work activities (13 hrs vs 3 hrs). None of these studies described
above54,97,106,107 reported the amount of time children were absent from school.
Australian studies reporting the amount of time from work or non-work activities, or
away from school or childcare, among cohorts of children hospitalised for ARIs could
not be found.
Cough
No published studies on time off work, school or childcare directly attributable to
cough among Australian children could be identified.
Bronchiectasis
One study of children with bronchiectasis from Alaska, Australia and New Zealand
reported the proportion of children who had experienced a cough that ‘disrupted
school’ in the past 12 months prior to study enrolment.22 Among the 97 Australian
children enrolled in the study, the proportion was 5%. However, it should be noted
that children in this study were aged between 6 months and 9 years, meaning many
would not yet be attending school. It is possible that exclusively among school-

38 Chapter 2: Literature Review
attending children, this proportion may be higher. No other studies on the quantity
or frequency of time off work, school or childcare directly attributable to
bronchiectasis among Australian children could be identified.
2.2.5 Summary
Resource use due to ARIs among Australian children is reasonably well-researched
and demonstrates the considerable burden these illnesses place on health services
and families. However, important gaps remain with respect to Indigenous children.
There is some research on resource use associated with cough in children, however
there is a notable lack of research on resource use associated with bronchiectasis
among children. This thesis addresses these gaps in Chapter 4, specifically by
describing use of healthcare services and medications, and time off work and school
among children with bronchiectasis.
2.3 IMPACT OF RESPIRATORY ILLNESSES ON QUALITY OF LIFE
From the current research on resource use associated with respiratory illnesses in
children, there is little doubt that ARIs, cough and bronchiectasis contribute
considerably to the burden of childhood illnesses on health services. It is therefore to
be expected that ARIs, cough and bronchiectasis may also be associated with
impaired QoL among children and families. Existing research on these topics and
limitations of the research will be described in the following sections.
2.3.1 Quality of life and its measurement
QoL in the context of health and healthcare is a concept that can be defined as the
“aspects of self-perceived well-being that are related to or affected by the presence
of disease or treatment”.108 It is a patient-centred, subjective measure of the impact
of an illness designed to complement objective measures of the impact of illness.
Understanding and evaluating QoL is important in both clinical and research settings.
Within research, the measurement of QoL is important for the evaluation of
strategies on prevention, management and treatment of diseases.

Chapter 2: Literature Review 39
QoL is typically measured using a questionnaire in which participants or patients self-
rate on a scale the impact of an illness or condition. In paediatrics, a level of
complexity is added as young children may be limited in their cognitive ability to
comprehend and express themselves adequately, making it difficult to obtain
accurate and reliable measurements of QoL. Hence, it is standard practice for parents
to be proxy assessors of their young child’s medical condition.109,110 However, parents
are themselves implicated in their child’s illness and therefore capturing their own
QoL, as well as their perceptions of their child’s QoL, remains important.
The impact of an illness or condition on QoL is usually assessed over a number of
domains (including physical, emotional, social, functional, cognition, mood,
communication) to achieve a final overall score.111-113 QoL questionnaires can be
generic (i.e. for use in any population and any illness/condition) or can be specific to
a particular population, condition and/or symptom. While use of generic QoL tools
enable comparisons of QoL across populations and across conditions, their sensitivity
to the unique characteristics of a specific population, condition or symptom may be
limited.114 In a review of 43 randomised controlled trials assessing QoL using a variety
of generic and specific tools,114 the authors concluded that specific tools were more
responsive to capturing change in QoL than generic tools.
Historically, there has been a focus on the development and use of non-generic QoL
questionnaires for chronic illnesses within paediatrics. A systematic review published
in 2013 aimed to identify all condition-specific QoL questionnaires designed to be
completed by caregivers of children with a paediatric condition that had been
published in English in a peer-reviewed journal between January 1990 and June
2011.115 The authors identified 25 condition-specific questionnaires, covering 16
different illnesses. Only 2 questionnaires were focused on acute illnesses; the
remaining 23 focused on a variety of chronic illnesses. This trend is also seen within
paediatric respiratory illnesses. Numerous condition-specific tools are available for
the assessment of QoL for children with CRDs, such as asthma and CF.116 Fewer
condition-specific tools are available for the assessment of QoL among children with

40 Chapter 2: Literature Review
ARIs. Some condition-specific tools that exist for ARIs include the “PAR-ENT-QoL” tool
for recurrent ear, nose and throat (ENT) infections and the “Care-ILI-QoL” for
influenza-like-illnesses.117,118
In addition to condition-specific questionnaires, over the past decade a number of
studies have been conducted with the aim of developing and validating cough-
specific QoL questionnaires for the purpose of assessing the QoL impact of this
symptom within, and across, respiratory illnesses with cough as a symptom. The
‘Parent-proxy Children’s Acute Cough-specific QoL’ questionnaire (PAC-QOL)
measures the impact of acute cough on the QoL from the parental perspective.43 The
‘Parent Cough-specific QoL’ questionnaire (PC-QOL) measures the impact of chronic
cough on QoL from the parental perspective.45,119 The ‘Chronic Cough-specific QoL’
questionnaires (CC-QoL) measures the impact of chronic cough on QoL from the
child’s perspective.120 As discussed previously, cough as a symptom is important from
both the perspective of families and clinicians. Cough-specific QoL questionnaires are
more relevant from this perspective as they present the possibility of ensuring that
the questionnaire captures the unique impact of cough on QoL, while still enabling
comparisons of QoL between different respiratory illnesses.
2.3.2 Quality of life in relation to acute respiratory infections
A limited number of studies examining the impact of ARIs on QoL have been
conducted in Australia, so results from international studies will also be discussed in
this section. Studies assessing the impact of ARIs on QoL typically compare the QoL
of parents of children with a particular ARI to the QoL of parents of healthy children.
Jiang et al.,121 examined the impact of recurrent respiratory tract infections on
Chinese children aged 2-7 years using a generic paediatric QoL tool. Shoham et al.27
examined the impact of pneumonia on Israeli children aged <3 years using a QoL tool
designed for ENT infections. Chow et al.122 examined the impact of ILI on Australian
children aged 6 months – 3 years using both a generic QoL tool and the same ENT-
specific QoL tool as Shoham et al.27 All three studies reported that QoL was
significantly impaired for parents whose child was ill, compared to parents of children
who were healthy. In a second study by Chow et al.118 QoL was examined 2 weeks

Chapter 2: Literature Review 41
following the onset of an ILI episode, and again after the child had recovered among
a cohort of Australian children aged 6-48 months. QoL was assessed using a specific
ILI QoL tool and was found to be significantly lower during the ILI episode than after
recovery. A number of these studies also explored factors associated with poorer QoL
scores within the cohorts of children with ARIs. These included: high severity of illness
or symptoms27,118,122 higher number of doctor visits118 and a greater time spent caring
for the child.118,122 It is important to note that the studies described here were all
limited to children aged <6 years.27,118,121,122 It is unclear whether the findings from
these studies are valid for parents of older children with ARIs.
2.3.3 Quality of life in relation to bronchiectasis
Few studies have been conducted on the QoL among Australian children, or parents
of children, with non-CF bronchiectasis. Two Turkish case-control studies comparing
children with non-CF bronchiectasis (cases) with healthy children (controls) reported
that poor sleep quality was significantly more common among cases than controls123
and that physical health QoL scores (measured using a generic paediatric QoL tool)
were significantly lower among cases than controls.124 Among the second study,124
parent-reported QoL scores (also measured using a generic QoL score) were lower
for both physical health and psychosocial well-being among cases compared to
controls. Another Turkish study of children aged 9-18 years with non-CF
bronchiectasis examined risk factors for poor QoL using both a generic QoL tool as
well as a respiratory-specific QoL tool.125 Associations were identified between a
number of characteristics and QoL scores from the ‘symptoms’ subscale of the
respiratory-specific QoL tool. Higher frequency of antibiotic use, lower pulmonary
function and fewer years since regular medical follow-up began were all associated
with poorer QoL. This study examined risk factors for poor QoL during a stable period
of illness and it is unknown whether similar associations are seen between these
factors and QoL during an exacerbation state.
The only Australian study to have examined QoL of children with bronchiectasis
compared QoL using a generic parent mental health tool (Depression Anxiety Stress
Scale [DASS-21]) and the cough-specific PC-QoL tool during a stable state and during

42 Chapter 2: Literature Review
a pulmonary exacerbation state.126 Parental QoL and mental health was significantly
impaired during their child’s exacerbation of non-CF bronchiectasis. There were no
differences in PC-QoL or DASS-21 scores between bronchiectasis exacerbations that
required hospitalisation and those that did not.
2.3.4 Quality of life in relation to cough
In the studies which have developed, validated, and subsequently used the parent-
proxy acute and chronic cough-specific QoL questionnaires, children whose cough
had resolved at the follow up timepoint had statistically significantly higher QoL
scores than children who were still coughing.43,84 This finding was similar to that in a
chronic cough study measuring QoL from the child’s perspective, highlighting the
importance of cough resolution for QoL.120
The influence of a limited selection of other factors on QoL has been assessed for
children with chronic cough.84,127 Both Marchant et al.84 and Chang et al.127 reported
that there were no significant associations between PC-QoL scores and the primary
aetiology of cough, nor between PC-QoL scores and the child’s age. Marchant et al.84
reported that higher cough severity at enrolment and a greater number of doctor
visits in the past 12 months were associated with poorer PC-QoL scores. Chang et
al.,127 in their multi-centre study, reported statistically significant differences in PC-
QoL scores at enrolment between children from each of the different recruitment
sites. Children from Darwin and the rural/remote recruitment sites had the highest
median PC-QoL scores; children in Sydney and Canberra had the lowest median PC-
QoL scores. The reasons behind this finding are unclear but may be related to
differences in access to, and quality of, healthcare services or differences in the
perceived severity of chronic cough between different geographical locations. Finally,
Chang et al.127 compared PC-QoL scores at enrolment between Indigenous and non-
Indigenous Australian children in the study and found no significant differences.
However, it should be noted that the PC-QoL tool has not been validated for use in
Indigenous Australian populations. Cultural differences in perceptions of health and
well-being may influence the degree of appropriateness of the use of this tool in
research with Indigenous Australian populations.9
Chapter 2: Literature Review 43
In these studies of QoL among children with acute and chronic cough there are wide
variations in the duration of cough at the time of study enrolment. In paediatrics, an
acute cough is any cough duration of <2 weeks, whereas a chronic cough is a cough
duration of ≥4 weeks. In the acute cough study mentioned above, the median
duration of cough prior to enrolment was 3 days.43 In contrast, in the chronic cough
studies discussed above the median duration of cough prior to enrolment was 16
weeks in one study127 and not provided in the other studies.44,84,119 Overall QoL scores
and rankings of individual items in the study of acute cough43 compared to one of the
studies on chronic cough44 suggest that the QoL of parents of children with chronic
cough is different to the QoL of parents of children with acute cough. However, as
there are no studies focusing on cough-specific QoL at the transitional period from
acute to chronic cough, it is difficult to know when these changes may occur.
2.3.5 Summary
It is apparent that experiencing respiratory illnesses and cough are associated with
impaired QoL for both parents and children. Despite the development and use of QoL
questionnaires specific to cough and various respiratory infections in paediatric
research, there remain significant gaps in the current literature. No studies on the
impact of ARIs, acute and chronic cough, and bronchiectasis on QoL have assessed
QoL at more than two distinct timepoints, so our understanding of the changes in
QoL over the course of a respiratory illness is limited. Additionally, there is a lack of
evidence on changes in QoL over the duration of a respiratory illness and as cough
duration progress from acute to cough. Finally, there has been limited research on
what factors may influence QoL during a respiratory illness with cough. This thesis
addresses these gaps in Chapter 4 by describing QoL over time among children with
bronchiectasis and in Chapter 7 by describing changes in, and evaluating predictors
of, QoL over the duration of an episode of ARIwC among children.

44 Chapter 2: Literature Review
2.4 ECONOMIC BURDEN OF RESPIRATORY ILLNESSES IN CHILDREN
While it is clear that ARIs impose a significant burden on families and health services
in terms of the time and resources used to treat and manage the illness, it is less clear
what the burden of ARIs is economically. There are limited Australian studies
estimating the costs of ARIs and cough in monetary terms. The following section
describes current research on the cost of illness for both ARIs and cough. Comparing
cost of illness studies between countries can be complicated given differences in the
structure, organisation and financing of healthcare systems, as well as differences in
currencies. As such, this section will focus exclusively on the cost of ARIs reported in
Australian studies.
2.4.1 Cost of acute respiratory infections
The literature on the cost of ARIs among Australian children is heterogeneous with
respect to study design, setting, population and analysis, which limits the extent to
which trends can be seen and conclusions can be drawn. Some Australian studies
have estimated the costs of specific ARIs or pathogens (e.g. influenza, pneumonia or
RSV); others include costs from only one perspective (e.g. only costs incurred by the
healthcare sector) or include costs from only one timepoint during the illness episode
(e.g. during hospitalisation).60,128,129 For example, Newall et al.128 estimated costs of
influenza and ILI from the perspective of the healthcare sector and included only
hospitalisations and GP encounters. Total costs to the Australian healthcare system
were estimated to be approximately $115 million during a typical influenza season.
Approximately 5% of these costs were incurred by children aged <15 years. Similar
methods have been used to estimate the direct healthcare costs associated with RSV
and RSV hospitalisations among children aged <5 years in Australia.60,129 Such studies
are limited in their representativeness of the broader spectrum of ARIs and are likely
to underestimate actual costs by only focusing on some elements of illness-related
resource use. Furthermore, studies examining cost of illness at the population level,
rather than the individual or episodic level, are limited in their ability to identify
predictors of high costs. Cost of illness studies which examine and compare the
distribution and determinants of costs within a population enable the identification

Chapter 2: Literature Review 45
of potential areas of intervention which may assist in reducing the economic burden
of disease.
There are three Australian studies that have comprehensively and longitudinally
estimated the average cost of an ARI episode among children from multiple cost
perspectives (family, healthcare sectors, third parties).97,106,107 While none of the
studies focused on a specific type of ARI, all three studies used case definitions largely
designed to capture episodes of viral respiratory illnesses, in particular influenza and
ILI. The first study, conducted among children aged 1-6 years in Melbourne in 2001,
estimated the cost per episode to be $AU241 (95% CI 191, 291).106 The second study,
conducted among children aged <5 years in Melbourne in 2003-2004, estimated the
cost per episode to be $AU309 (95% CI 263, 354).107 The third study, conducted
among children aged ≥6months – 3 years in Sydney in 2010, estimated the cost per
episode to be $AU626 (95% CI 484, 768).97
The first two studies presented costs by cost perspective and found that the majority
of the total episode cost was met by the patient and their family (ranging from 79-
87%), while only 5-6% of costs were met by the healthcare sector.106,107 These studies
also compared mean costs per episode of ARI by sex of the child, by household
income and by severity of illness (defined as with or without fever and/or otitis
media).106,107 Female children had higher mean costs than male children; $341 per
episode (95% CI 265, 418) vs $274 (95% CI 228, 319).107 While mean costs differed
between household income brackets, there were no consistent trends in either of the
studies, and the income bracket with the highest and lowest costs differed between
the two studies.106,107 The mean cost of an ARI without fever or otitis media ($180;
95% CI 131, 230) was lower than the mean cost of an ARI episode with fever ($406;
95% CI 318, 494) or with otitis media ($362; 95% CI 203, 520). Additionally, the mean
cost of an ARI episode with both fever and otitis media was greater than the mean
cost of an episode in which only one of those symptoms were present.107
The third study presented costs by source of cost and found that the majority of costs
(65%) were a result of parent/guardian time off work, with only 16% of costs being
due to use of healthcare services.97 This study reported that having both parents in
46 Chapter 2: Literature Review
paid employment and having a longer duration of illness were both significantly
associated with higher costs per episode.97 Two other factors (being non-Caucasian
and living in a detached house) were identified as being associated with a higher
number of healthcare visits but interestingly these factors were not associated with
cost. Further Australian research is needed to comprehensively examine what
demographic, family, environmental, medical and illness-related factors are
associated with the cost of ARIs among children.
The three studies discussed above97,106,107 were all conducted through urban
mainstream primary healthcare services and/or childcare centres, and hence
disproportionally included young children and infants, and those from high
socioeconomic backgrounds. As such these studies were not inclusive of Indigenous
Australian children, particularly those attending Indigenous-specific services, nor are
they inclusive of children from low socioeconomic areas or children living in regional
areas. The AIHW reported that in 2010-2011, total expenditure on hospitalisations
for ARIs among Indigenous Australians was $104.8 million, equating to $184.1 per
person nationally.130 This was 3.1 times the expenditure for non-Indigenous
Australians. This difference in per-person expenditure may reflect differences in
disease prevalence and severity, as well as differences in service usage or treatment
pathways. It is not clear what proportion of this expenditure is on children and
adolescents. These estimates underestimate the true economic burden of ARIs
among Indigenous Australians given the exclusion of the indirect costs associated
with the hospitalisation, as well as the ARI expenditure that occurs at the family and
community level. Despite the high burden respiratory illnesses place on Indigenous
Australians, no studies have examined the cost of ARIs among children in, exclusively
or predominantly, Indigenous Australian populations or settings.
2.4.2 Costs of acute cough and chronic cough
There are no Australian studies that have specifically examined the cost of cough
among children and as such the two international studies that have been published
on this topic will be discussed. The following studies aimed to estimate the cost of

Chapter 2: Literature Review 47
acute cough; there are no published studies that have specifically examined the cost
of chronic cough among children.
Hollinghurst et al.,131 estimated the cost of illness in a UK cohort of children aged 3-
59 months presenting to a GP for the first time with acute cough. Costs incurred
between the first GP visit and until cough resolution or four weeks post enrolment
(which ever came first) were included in the total cost of illness. The mean cost per
episode to the family was £14.8 (95% CI 4.9, 24.7) (£14.8 is equivalent to $AU36.2
using the exchange rate on 29th April 2005 – the end of the study period). The mean
cost per episode per child to the National Health Service was £27.4 (95% CI 4.4, 30.5)
(£27.4 is equivalent to $AU67.2 using the same exchange rate as above). These
estimates of the cost of acute cough to the family and the healthcare system are
substantially lower than the costs of ARI estimated in the three Australian studies
described above. These differences may reflect differences in Australian and UK
health systems, as well as differences in the types of illness included in the studies
and levels of illness severity.
Dal Negro et al.132 sought to estimate the cost of acute cough among Italian children.
A cross-sectional telephone survey was conducted in 2017 among a random sample
of Italian families with children from the general population. A questionnaire was
administered to all respondents to collect information regarding the usual
characteristics (frequency, duration and cough type) of a cough episode among their
child, and usual resource use associated with the cough. The total cost per year due
to episodes of acute cough was estimated to be €1204 (SD ±87.78) from the
perspective of the family (equivalent to approximately $AU1752 using the average
exchange rate of €0.6873 = $AU1 for the financial year ending 30 June 2016) and €14
(SD±0.48) from the perspective of the national health system ($AU20). The total cost
per episode incurred by families was estimated to be €350 ($AU509). While the study
states that the cost of cough was estimated from the perspective of families and the
national health system, only costs associated with medications and time off work due
to the child missing school or childcare were included. Use of healthcare services was
not reported and did not appear to be included in the total cost per episode or total
annual cost.

48 Chapter 2: Literature Review
2.4.3 Summary
The studies described in this section on the estimates of the cost of ARIs and cough
provide a starting point for which to quantify the economic burden of ARIs and cough.
However, current research is limited in its applicability to all Australian children and
in the lack of information on the costs of chronic cough. Furthermore, a more
comprehensive examination of predictors of the cost within an episode of ARIs and
cough is required. This thesis addresses these gaps in Chapters 5 and 6, specifically
by estimating the cost of ARI and acute and chronic cough among Australian children
aged <15 years presenting to various healthcare settings, with a focus on Indigenous
Australian children.
2.5 SCOPE FOR INTERVENTION
2.5.1 The link between acute respiratory infections, cough and bronchiectasis
The association between respiratory health during infancy and early childhood, and
respiratory health in later childhood is an area of interest. In addition to the short-
term morbidity caused by ARIs at the time of infection, the occurrence and
reoccurrence of ARIs during childhood is associated with negative long-term
respiratory health outcomes, such as increased hospitalisations, poorer lung function
and exacerbations and progression of chronic respiratory diseases such as asthma
and bronchiectasis.133-136 Australian research has shown that experiencing a
hospitalisation for an ARI during infancy (<12 months of age) is strongly associated
with experiencing a hospitalisation for a respiratory illness after 3 years of age.136 This
association remains significant and strong even after adjusting for key risk factors
such as sex, gestational age, birthweight, Australian Indigenous status, mode of
delivery, season of birth, maternal smoking, and other maternal characteristics.
Similar findings have been reported in international studies.137
While the natural history of bronchiectasis is complex given different aetiologies,
early life origins are being increasingly recognised as important.138 Some evidence
Chapter 2: Literature Review 49
exists which suggests that experiencing severe and/or repeated ARIs in childhood, in
particular ALRIs such as bronchiolitis, may be associated with the development of
bronchiectasis later in childhood or in adulthood.138,139 Among a cohort of Indigenous
children aged 6 months to 9 years with either CSLD or bronchiectasis from Alaska,
Australia and New Zealand, the proportion who had experienced a prior
hospitalisation due to a LRTI was 87%, 95% and 93% respectively.22 The proportions
reported among this cohort were substantially higher compared with their respective
Indigenous populations, which was also substantially higher compared with their
respective national populations. Similar findings have been reported among Inuit
children with bronchiectasis in Canada.65
Among Indigenous Australian infants born in the Northern Territory between 1999
and 2004 who were hospitalised within the first year of life with a LRTI, bronchiolitis
was the most common diagnosis (approximately 55% of all LRTIs).72 Subsequent
research among Indigenous Australian infants who were hospitalised for bronchiolitis
and had no prior diagnosis of chronic lung disease found an association between
persistent cough at 3 weeks post-hospitalisation and diagnosis with bronchiectasis in
the 24 months post-hospitalisation.19 Infants who had persistent cough following
hospitalisation for bronchiolitis had significantly higher odds (Odds Ratio [OR] 3.0;
95% CI 1.1, 7.0; p=0.03) of being diagnosed with CT-confirmed bronchiectasis than
infants who did not have persistent cough. The experience of chronic cough post-
hospitalisation for a LRTI has been reported to be relatively common. Among children
hospitalised for a severe LRTI in Auckland between August and December 2007,
Trenholme et al.140 reviewed clinical outcomes approximately 1-year post-
hospitalisation. Among the 81 children reviewed, 31% reported having experienced
a chronic moist cough (defined as daily for 3 consecutive months or daily for 1 month
on 3 separate occasions). Half of the cohort also had abnormal chest radiographs 1-
year post hospitalisation. Associations between hospitalisation for pneumonia and
subsequent diagnosis with bronchiectasis have been found. In a case-control study
among Indigenous Australian children aged 0-17 years in Central Australia,141 the
odds of developing bronchiectasis were significantly greater (OR 15.2; 95% CI 4.4,
52.7) among children who had a prior hospitalisation due to pneumonia. Children
who had repeated hospitalisations due to pneumonia had even greater odds of

50 Chapter 2: Literature Review
developing bronchiectasis. Overall, these findings are consistent with the fact that
both CRDs and ARIs are experienced at a greater frequency and higher severity
among Indigenous Australian children, relative to non-Indigenous children.
A number of studies have examined the presence of undiagnosed chronic lung
conditions among otherwise healthy children who have developed chronic cough
post-ARIwC. As part of an Australian cohort study of children aged ≤15 years who
presented to a paediatric ED with cough, children who developed chronic cough post-
enrolment were reviewed by a paediatric pulmonologist within 2 weeks of
developing chronic cough.35 Of the 117 children reviewed, a new chronic underlying
lung disease was found in 36 children (31%), of which 4 children were diagnosed with
bronchiectasis. Similarly, among Indigenous Australian children who, during the
study period, developed chronic cough and were reviewed by a paediatric respiratory
specialist (n=26), approximately half of the children were identified as having an
underlying chronic respiratory illness which had not yet been diagnosed.36 However,
there are limitations to these studies. It is unknown what proportion of children who
were identified as having a chronic lung condition in these studies had experienced
previous episodes of chronic cough, what proportion had previously sought
healthcare for chronic cough and what proportion had undergone investigations.
Nevertheless, these findings highlight the significance of cough, in particular chronic
cough post-ARIwC, as both a potential contributor to the development of a CRD, as
well as a potential indicator of the presence of a CRD. This link highlights a potential
avenue for prevention and intervention.
2.5.2 Interventions to improve the management of chronic cough reduce the
burden of cough and development of chronic respiratory disease
Regardless of the uncertainty around the association between ARIs, chronic cough
and chronic lung conditions, it is arguable that primary and secondary prevention of
ARIs and cough, especially chronic cough, is important from the perspective of both
families and health services, for clinical and economic reasons. Prevention, early
detection and effective management of ARIs and cough during childhood could

Chapter 2: Literature Review 51
directly improve the short- and long-term respiratory health outcomes of Australian
children, thereby improving other related health and social outcomes. A number of
public health measures exist for the purpose of primary prevention of ARIs such as
maternal and childhood immunisation,142 hygiene practices143 and improving living
conditions/the living environment (e.g. overcrowding and exposure to tobacco
smoke). There is, however, a limit to primary prevention measures and to an extent,
ARIs are a normal childhood experience.144 Consequently, there is, and will be an
ongoing need for secondary prevention measures. Secondary prevention measures
are measures that limit the progression and/or impact of an illness in order to prevent
further negative health outcomes. Secondary prevention measures are needed to
minimise the clinical and economic burden of respiratory illnesses and, in particular,
the burden of chronic cough.
2.5.3 Timely and effective management of chronic cough through a standardised
management algorithm
Specific guidelines for the management of cough in children currently exist in a
number of countries, including Australia,30 Belgium,145 the UK,38 and the US.39 In
addition to clinical guidelines, cough management algorithms (or pathways) have
also been developed for the purpose of diagnosing and treating the cause of chronic
cough in children.146,147 The algorithms consist of a series of steps for clinicians to
follow with respect to clinical observations and investigations to undertake, followed
by recommended courses of action.
A recent systematic review of the use of management pathways or algorithms in
children aged ≤14 years with chronic cough concluded that there was “high quality
evidence that….the use of cough management protocols improves clinical
outcomes”.40 The review found no evidence for the need to alter the algorithm based
on cough duration or severity, however, it recommended that different algorithms
be used depending on cough characteristics, notably whether the cough is specific or
non-specific. Of the nine studies included in the review, four followed an algorithm
published by Chang et al.148 which is based on the US paediatric clinical guidelines for
chronic cough developed by the American College of Chest Physicians (ACCP).39 The

52 Chapter 2: Literature Review
strongest evidence in the review was for the use of this algorithm. Two of these
studies were conducted in Australia127,149 and two were conducted in Turkey.150,151
Since the date the literature searches for this systematic review were completed, a
fifth study (also conducted in Turkey) using the ACCP algorithm has been
published.152
These five studies reported that the use of the ACCP guidelines for the management
and treatment of paediatric chronic cough was feasible in a clinical setting.21,127,149-152
All of these studies consisted of cohorts of children presenting to tertiary respiratory
health services (either hospitalised or seen through outpatient departments). Four of
the five studies reported on the average cough duration at enrolment. The mean
cough duration at enrolment was reported by Gedik et al.152 and Asilsoy151 as being
2.76 months (SD±2.69) and 4.18 months (SD±4.94) respectively. The other two
studies reported median cough durations of 4 months (IQR=2-8 months),127 4 months
(IQR = 4-7 months) (early review group)149 and 5 months (IQR = 2.5-10.5 months)
(delayed review group).149 To date, there are no studies that have examined the use
of a paediatric cough algorithm specifically at the onset of chronic cough.
Only two studies reported on the effectiveness of the use of the algorithm to achieve
desired outcomes such as cough resolution or improved quality of life. Asilsoy et al.151
reported that cough resolution was achieved for 95% (102/108) of patients. A
limitation of this study was that no information was provided on the average duration
of time between initial review using the algorithm and cough resolution. The only
randomised controlled trial (RCT) included in the systematic review was a multi-
centre RCT conducted by Chang et al.,149 comparing early (within 3 weeks of study
enrolment) and delayed (within 6-8 weeks of study enrolment) management
according to the cough algorithm reported that a final diagnosis was achieved for
almost all children (252/253) regardless of what group they had been allocated to.
However, of the 132 who had early management, 76 (58%) achieved cough resolution
by 6 weeks following enrolment, compared to 39/121 (32%) of children who had
delayed management. This suggests that early intervention leads to improved clinical
outcomes in a timelier manner than standard care. This RCT also examined changes
Chapter 2: Literature Review 53
in QoL between the early review and delayed review group.149 PC-QoL scores
increased (i.e. improved) between baseline and follow-up at 6 weeks for both the
groups. The mean improvement in PC-QoL score was significantly higher (0.6 points)
in the early arm group compared to the delayed group, however whether this
difference is also clinically significant is unclear.
Two studies have reported on the discordance between the diagnoses given prior to
and following comprehensive assessment and investigation analogous to the
assessment and investigations undertaken as part of the paediatric cough algorithm.
Marchant et al.,21 reported that 50% of children presenting with chronic cough had a
diagnosis of asthma at the time of referral to the hospital paediatric respiratory
practice. Almost all children had been referred by a paediatrician or GP. Following
review by a paediatric respiratory specialist, less than 9% had a diagnosis of asthma.21
Similar findings have been reported by Thomson et al.99 in a cohort of 49 children
referred to a tertiary paediatric respiratory clinic over a 12-month period. The
majority had a referral diagnosis of asthma and had been treated with asthma
medications for between 2 months and 12 years, despite no parents reporting any
improvement in their child’s symptoms. After undergoing review, no child had a final
diagnosis of asthma.
These findings suggest that standardised pathways of assessment, investigations and
medication trials, followed by a review of outcomes, are effective at ensuring an
accurate diagnosis is obtained, appropriate treatment or therapy is commenced and
ideal clinical outcomes such as cough resolution are achieved. It is plausible that
timely and effective management of cough could also reduce future healthcare and
medication utilisation, leading to reduced economic burden on families and health
services. While no studies have explored this, a US study examined the impact of a
management guideline for infants presenting to an ED with bronchiolitis on the direct
costs associated with the ED presentation.153 After implementation of the guideline,
the mean cost reduced by $197 per patient. The study reported no increases in
admission rates, return ED visits or mortality rate post-implementation, suggesting it
is feasible to implement guidelines that minimise costs without compromising on
health outcomes.

54 Chapter 2: Literature Review
2.5.4 Summary
There are currently no published studies evaluating the effectiveness of a cough
management algorithm at the transitional stage from acute to chronic cough among
children from an economic perspective. Quantifying the cost-effectiveness of a
standardised management pathway at the onset, or shortly after, of chronic cough is
important in an everlasting situation of finite resources and funding. In order to
ensure that positive health outcomes are maximised for Australian children, while
the economic burden on families and health services is minimised, both the clinical
and cost-effectiveness of healthcare must be considered. This thesis addresses this
gap in Chapter 8 by evaluating the cost-effectiveness of early use of a cough
management algorithm among Australian children aged <15 years who developed
chronic cough post-ARIwC, with a focus on Indigenous Australian children.
2.6 CONCLUSION
ARIs, cough and bronchiectasis contribute considerably to the burden of childhood
illnesses on Australian families and health services. Furthermore, it is evident that
this burden is disproportionately experienced among Indigenous Australian children.
Despite the clear epidemiological and clinical burden of respiratory illnesses on
children, there are considerable gaps in our understanding of the burden of
respiratory illness from resource use, economic and QoL perspectives. By far, the
majority of research on children with bronchiectasis is among hospitalised cohorts or
children regularly attending specialist respiratory clinics in outpatient settings.
Among these cohorts, the predominant focus of current research is on describing
clinical characteristics of disease or demographic characteristics of the populations.
Worldwide, there have been no longitudinal, prospective cohort studies
comprehensively examining bronchiectasis-related resource use among children.
Indeed, research into the burden of bronchiectasis from the perspective of health
service utilisation and health economics has been identified as a priority.154,155
Chapter 2: Literature Review 55
There are also limited quantifiable data on the burden of ARIs and cough on families
and the healthcare system from an economic perspective. Furthermore, existing
research among these areas is limited in its applicability to all Australian children,
particularly in its applicability to children who experience the greatest burden of
illness: Indigenous Australian children. Finally, no studies have sought to evaluate the
cost-effectiveness of a cough management intervention to reduce the burden of
cough illnesses. Given the high resource use associated with ARI and cough and the
importance of efficient allocation of limited health and economic resources, it is
critical that evidence on the topics is established. Quality of life is increasingly being
recognised as an important patient-relevant outcome of healthcare and health
interventions and therefore research in this area is highly valuable.
Addressing these research gaps will make a novel contribution through the provision
of new knowledge and understanding to the existing field of research on ARIs and
cough in children. This knowledge is important to reduce the burden of ARIs and
improve the health of Australian children. Furthermore, reducing the ARI and cough
burden during childhood has the potential to impact on respiratory health
throughout the whole lifetime. This research will substantially contribute to ensuring
that the true burden of ARI’s and acute and chronic cough on individuals, their
families and Australian society is quantified and understood by researchers, health
professionals and other decision-makers. The findings of this thesis have the
potential to inform evidence-based clinical guidelines and policy decisions on the
prevention and management of paediatric ARIs and chronic cough. Improved
guidelines that incorporate evidence on the cost-effectiveness of interventions are
likely to result in improved health outcomes, efficient allocation of health services
and resources, and increased responsiveness to the needs and experiences of
children and families. The outcomes of this research will be particularly important for
Indigenous Australians who experience a greater burden of disease as a result of
acute and chronic respiratory illnesses.

56 Chapter 2: Literature Review
Chapter 3: Research Methods 57
Research Methods
3.1 INTRODUCTION
This chapter describes the four studies included in this thesis and their respective
methods of data collection and analysis. Study names and their abbreviations are as
follows:
1. Cost of Bronchiectasis Study = COBS
2. Tooth and Lung Sickness in Murri Kids = TLSIM
3. Emergency Department Cough = EDC
4. Researching Intervention in Chronic Cough in Kids = RICCi
Section 3.2 provides an overview of the study design, setting, participants and data
collection procedures and ethical considerations across the four studies. Section 3.3
describes some of these methods in more detail for each specific study. As the tools
used to measure and evaluate cough outcomes, quality of life and costs are similar
between the four studies, these are collectively described in Section 3.4. Similarly,
some methods of data cleaning and analysis were consistently employed across
multiple studies and these are described in Section 3.5.
As can be seen in Table 3.1 below, all studies began participant recruitment and data
collection prior to commencement of this PhD. As such, I had minimal involvement
with the design of each study, including the design of recruitment processes and
questionnaires for data collection. One study (EDC) also completed both participant
recruitment and data collection prior to PhD commencement. Two studies (TLSIM
and COBS) had completed participant recruitment prior to PhD commencement,
however data collection was still ongoing. I was involved in participant recruitment
for the RICCi study and in data collection for both the TLSIM and RICCi studies.
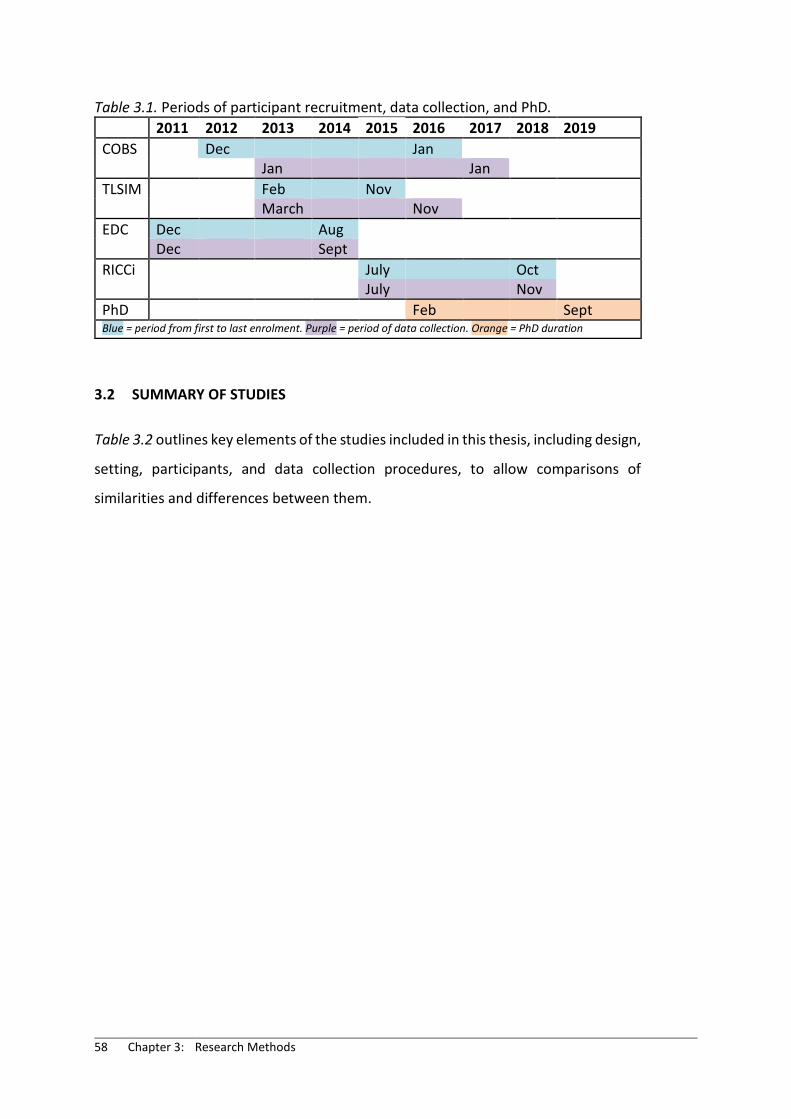
58 Chapter 3: Research Methods
Table 3.1. Periods of participant recruitment, data collection, and PhD. 2011 2012 2013 2014 2015 2016 2017 2018 2019 COBS Dec Jan
Jan Jan TLSIM Feb Nov
March Nov EDC Dec Aug
Dec Sept RICCi July Oct
July Nov PhD Feb Sept Blue = period from first to last enrolment. Purple = period of data collection. Orange = PhD duration
3.2 SUMMARY OF STUDIES
Table 3.2 outlines key elements of the studies included in this thesis, including design,
setting, participants, and data collection procedures, to allow comparisons of
similarities and differences between them.
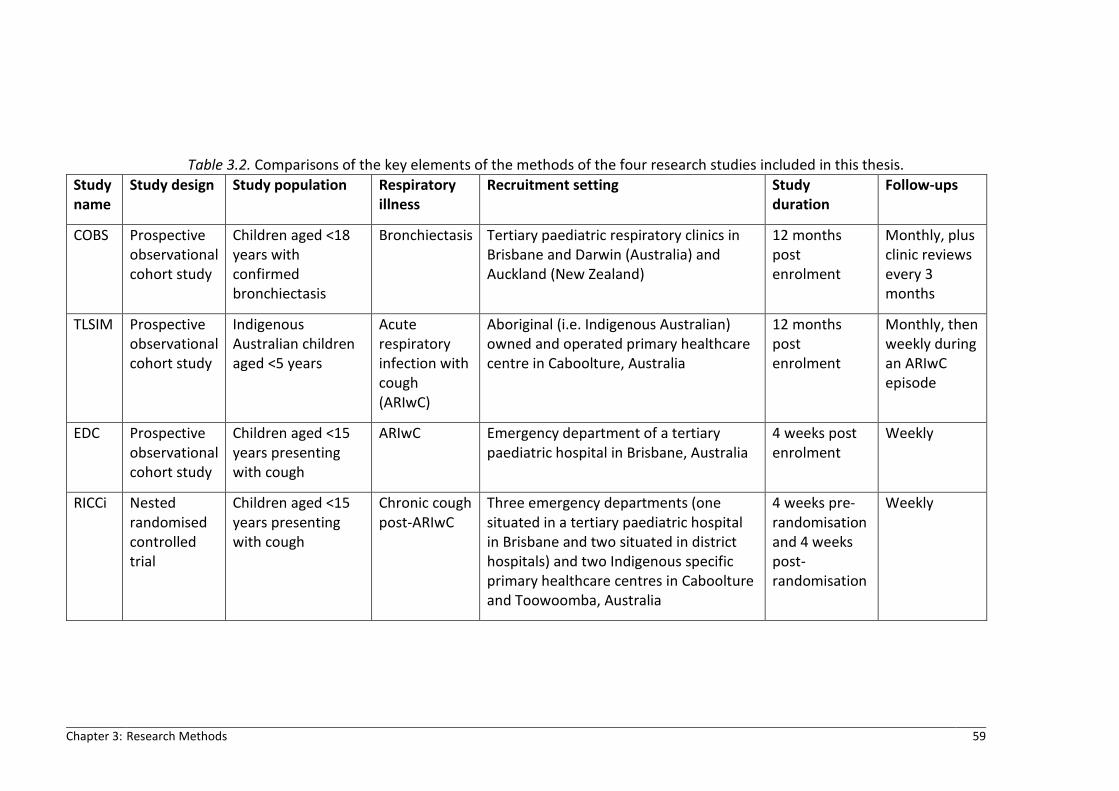
Chapter 3: Research Methods 59
Table 3.2. Comparisons of the key elements of the methods of the four research studies included in this thesis. Study name
Study design Study population Respiratory illness
Recruitment setting Study duration
Follow-ups
COBS Prospective observational cohort study
Children aged <18 years with confirmed bronchiectasis
Bronchiectasis Tertiary paediatric respiratory clinics in Brisbane and Darwin (Australia) and Auckland (New Zealand)
12 months post enrolment
Monthly, plus clinic reviews every 3 months
TLSIM Prospective observational cohort study
Indigenous Australian children aged <5 years
Acute respiratory infection with cough (ARIwC)
Aboriginal (i.e. Indigenous Australian) owned and operated primary healthcare centre in Caboolture, Australia
12 months post enrolment
Monthly, then weekly during an ARIwC episode
EDC Prospective observational cohort study
Children aged <15 years presenting with cough
ARIwC Emergency department of a tertiary paediatric hospital in Brisbane, Australia
4 weeks post enrolment
Weekly
RICCi Nested randomised controlled trial
Children aged <15 years presenting with cough
Chronic cough post-ARIwC
Three emergency departments (one situated in a tertiary paediatric hospital in Brisbane and two situated in district hospitals) and two Indigenous specific primary healthcare centres in Caboolture and Toowoomba, Australia
4 weeks pre-randomisation and 4 weeks post- randomisation
Weekly

60 Chapter 3: Research Methods
3.2.1 Setting and participants
The settings in which the four research studies were conducted, and their respective
study populations, are varied with respect to geographical location, healthcare
setting and demographic characteristics. These variations are an accurate reflection
of the diversity of contexts within Australia and highlight the complexities of
conducting research on Australian children as a homogenous group. The
characteristics of the settings and populations used within this thesis are important
to understand as they provide context for interpreting study findings.
Of the four study cohorts included in this thesis, three (TLSIM, EDC and RICCi) focused
on children living in South East Queensland, including Brisbane, Caboolture and
Toowoomba. The fourth study (COBS) was conducted among children living in, or
near, two major Australian cities (Brisbane and Darwin) and one New Zealand major
city (Auckland). Hence the populations included in the research are predominantly
urban and regional populations. This is reflective of the broader Australian
population, in which the majority live in ‘Major cities’ (70%), followed by ‘Inner
regional’ areas (18%).156 For COBS, TLSIM and RICCI, there was a higher proportion of
Indigenous Australian children in the study cohorts than the respective proportion of
Indigenous Australian children in the broader population. This is both a reflection of
the geographical locations in which these studies took place, as well as the centres
and facilities in which participants were recruited from. Table 3.3 describes selected
demographic characteristics of the locations in which most studies were conducted.
Specific recruitment settings and participant details, including inclusion and exclusion
criteria, are described in more detail in Section 3.3.

Chapter 3: Research Methods 61
Table 3.3. Selected demographic characteristics of locations in which studies were conducted, and comparative characteristics of Australia.
Greater Brisbane157 includes Caboolture, see Figure 3.1
Toowoomba158 Darwin159 Australia160
Total population (n) 2,270,800 149,512 136,828 23,401,892 Proportion of total population who identify as Indigenous Australian (%)
2.38 3.87 8.74 2.77
Proportion of total non-Indigenous Australian population aged 0-14 years (%)
19.32 19.65 19.27 18.35
Proportion of total Indigenous Australian population aged 0-14 years (%)
34.71 40.15 31.62 33.95
3.2.2 Data collection and management
A summary of procedures for data collection for each study are described in Table
3.4. Information regarding what types of data were collected at each timepoint and
which data were used for this thesis are described by study in Section 3.3. Of note is
that for TLSIM, EDC and RICCI, weekly cough data and chronic cough assessments
Figure 3.1. Map of Australia and map of Greater Brisbane area and Toowoomba.

62 Chapter 3: Research Methods
were exactly the same between the three studies; the majority of cost data collected
in each study were also the same. In each study, all data that were collected over the
phone or face-to-face were recorded on paper-based case report forms (CRFs) by
research staff. Data that were collected via email or Survey Monkey were printed by
research staff. Each participant’s CRFs and printed surveys were kept in a folder
labelled with the study name and the participant’s unique study identification
number. Each participant’s folder was stored in locked filing cabinets in the Centre
for Children’s Health Research. Data from the COBS study were entered into SPSS
Version 25 (IBM Corp, Armonk, New York) by research staff. Data collected through
the TLSIM, EDC and RICCi study were entered by research staff into study-specific
databases created using Filemaker Pro Version 14 (Filemaker Inc, Santa Clara,
California). Filemaker Pro databases were password protected.

Chapter 3: Research Methods 63
Table 3.4. Data collection procedures across each study included in this thesis. Study name
Frequency of follow-ups following enrolment
Methods of contact Contact window
Number of contact attempts permitted per follow-up
Number of consecutive unsuccessful follow-ups before considered ‘lost to follow-up’ (LTFU)
COBS Monthly, and at clinic visits once every 3 months.
• Phone • Online (via email) In-person, if both research staff and study participant were present at recruitment site on due date of follow-up
Monthly follow-ups: due date +/- 7 days Clinic visits: due date +/- 14 days
Three No standard criteria were applied to determine whether participants were LTFU or not. Data were collected when a parent/carer responded and this included retrospective recall if several monthly contacts in a row had been missed.
TLSIM Monthly, then weekly during a current episode of ARIwC
• Phone In-person, if both research staff and study participant were present at recruitment site on due date of follow-up
Due date +/- 3 days
Three Two
EDC Weekly • Phone • Online (via email and Survey
Monkey)
Due date +/- 3 days
Three Two
RICCi Weekly • Phone • Online (via email and Survey
Monkey) • In-person, if both research
staff and study participant were present at recruitment site on due date of follow-up
Due date +/- 3 days
Three Two

64 Chapter 3: Research Methods
3.2.3 Ethical considerations
All studies were considered to be projects with low or negligible risk. All studies received
approval from the appropriate human research ethics committees prior to commencing
participant recruitment and data collection. Specific details of ethics approvals granted for
the conduct of each study are provided in the Result chapters (Chapters 4-8). Additionally,
the TLSIM and RICCi studies were registered with the Australian New Zealand Clinical Trials
Registry prior to commencing participant recruitment and data collection. For the two
Indigenous focused studies (TLSIM and RICCi), an Indigenous Research Reference Group
oversaw and guided all research conducted with the Indigenous Australian health services
and communities involved in the studies. The group was comprised of senior Indigenous
academics, clinicians, community members, Elders and Traditional Owners, and encompassed
both the northern and southern regions of Brisbane.
For each study, written informed consent was obtained from a parent/guardian following
provision and explanation of a plain language statement that detailed the purpose of the
study, the study procedures, requirements from parents/guardians, risks and benefits of
participation and contact information. Parents/guardians were informed of their right to
withdraw at any timepoint without consequence. Written assent was also obtained from
children aged ≥12 years prior to enrolment.
3.3 STUDY-SPECIFIC METHODS
3.3.1 Cost of Bronchiectasis study
Study design
The Cost of Bronchiectasis study (COBS) was a prospective observational cohort study of
children with non-cystic fibrosis (CF) bronchiectasis who were receiving ongoing specialist
care through a respiratory clinic at one of three tertiary hospitals in Australia or New Zealand.
Participants were recruited opportunistically at one of their regular clinic visits by a research
nurse. Children were eligible for participation in the COBS study if they were aged <18 years
at the time of enrolment and had been diagnosed with bronchiectasis by high-resolution
computed tomography within the 5 years prior to enrolment, or had been regularly followed

Chapter 3: Research Methods 65
by a respiratory physician for bronchiectasis management if diagnosed more than 5 years
prior to enrolment. Children were ineligible to participate if they had been diagnosed with CF,
had an active oncology condition, or were already enrolled in any interventional research
study.
Participants were surveyed monthly for 12 months following enrolment. Participants were
also surveyed at clinic visits that were scheduled once every 3 months (i.e. a total of 5 clinics
visits including clinic visit at enrolment).
Setting and participants
The COBS study was conducted through three respiratory clinics in the following tertiary
hospitals: the Royal Children’s Hospital in Brisbane, Australia; the Royal Darwin Hospital in
Darwin, Australia; and Starship Child Health Hospital in Auckland, New Zealand. During the
years in which the COBS study was conducted, the Royal Children’s Hospital was the major
specialist paediatric public hospital in Queensland and has now been replaced by the
Queensland Children’s Hospital. The Royal Darwin Hospital is the only tertiary public hospital
in the Northern Territory and predominantly services the “Top End” region which extends
south to Katherine and East and West to the Queensland and Western Australian borders.
General paediatric services were available and visiting specialist respiratory paediatricians
provided regular clinics. Starship in Auckland is New Zealand’s largest tertiary paediatric
hospital, servicing the population of New Zealand and several South Pacific countries. Not all
children accessing the respiratory clinics lived in the major cities in which the hospitals were
located; some children were referred to the respiratory clinics from regional areas.
Data collection
At enrolment, information relating to demographics, family structure, medical history, clinical
measurements and symptoms, and bronchiectasis characteristics were collected. At each
monthly follow-up, data were collected regarding any use (yes/no) of healthcare services and
medications in the past month, as well as any time off school for the child and any time off
work for parents/guardians. The quantity of usage for healthcare services and medications

66 Chapter 3: Research Methods
(i.e. number of healthcare visits and number of mediation types/courses) was not collected.
The quantity of time off school and work was collected in days. If the parent/guardian
reported that the child had experienced an exacerbation in the past month, additional
information regarding resource use as a result of the exacerbation was collected. Once again,
quantities of resource use were not collected. At clinic visits, information regarding use of
healthcare services during the visit, as well as any travel or time off work for
parents/guardians to attend the visit was collected. In addition, at each clinic visit a
parent/guardian, and if applicable the child, completed a questionnaire on cough severity and
cough-specific quality of life. The tools used to assess these are described in more detail in
section 3.4.1 and section 3.4.2. While clinic visits were recommended and scheduled every
three months as part of standard care, parents could choose not to attend and hence data
were not systematically collected on all children every three months. For the purposes of this
thesis, data collected at baseline, at monthly follow-ups and at clinic visits were used in the
analyses.
3.3.2 Tooth and Lung Sickness in Murri Kids study
Study design
The Tooth and Lung Sickness in Murri Kids (TLSIM) study was a prospective observational
cohort study of Australian children aged <5 years who were registered with an urban,
Indigenous focussed, primary healthcare centre in South-East Queensland. The published
study protocol can be found in Appendix A.161 Children were recruited upon presentation to
the centre for any reason. Children were eligible for enrolment into the TLSIM study if they
were aged <5 years at time of enrolment and were a registered client with the participating
healthcare centre. Children were ineligible for enrolment if the parent/guardian was
intending to move away from the area during the 12-month study period.
The study’s primary aim was to comprehensively understand the epidemiology, aetiology,
social and economic impacts and outcomes of ARI and dental disease in a predominantly
urban Indigenous paediatric population presenting to a primary care facility. Some non-
Indigenous Australian children (n=20) were also enrolled. Participants were surveyed monthly

Chapter 3: Research Methods 67
for 12 months following enrolment. Children who were identified at any timepoint during the
12 months as having a current cough were subsequently surveyed weekly for 4 weeks.
Children with persistent cough at Week 4 of the weekly follow-ups were reviewed by a
paediatrician with expertise in respiratory medicine at a respiratory clinic at a tertiary
paediatric hospital (referred to henceforth as specialist reviews). While the TLSIM study
enrolled a small number of non-Indigenous children, data from those participants were not
included as the objective of the analyses for the TLSIM study in this thesis was to determine
the cost of ARIwC in Indigenous Australian children.
Setting and participants
The TLSIM study recruited participants primarily from an Aboriginal owned and operated
comprehensive primary healthcare service in Caboolture. Some participants were also
recruited from local playgroups. While the healthcare service was not exclusive of non-
Indigenous Australian clients, approximately 70% of people attending the healthcare service
identified as Indigenous Australian. Consequently the overall enrolled cohort of the TLSIM
study was predominantly Indigenous Australian children (90%) and non-Indigenous children
were excluded from my analyses.
Data collection
At enrolment, comprehensive information regarding demographics, socio-economics, family
and household situation, child and family medical history, risk factors for ARIs, and parent
cough knowledge and beliefs were collected. For the Indigenous Australian children enrolled
in the study, information on a number of cultural characteristics was also collected. Monthly
follow-ups collected information on the health of the child and family, and health-related
resource use for any reason, in the past month. Weekly follow-ups conducted during an
episode of ARIwC collected information on cough characteristics and ARIwC-related resource
use in the past week. Additional information on the methods used to assess cough and to
evaluate costs using data on resource use are provided in section 3.4. At specialist reviews,
information on resource use since last contact, quality of life and clinical information about
the child’s cough illness, including a diagnosis by the specialist, were collected. For the

68 Chapter 3: Research Methods
purposes of this thesis, only the data collected at baseline and through the weekly follow-ups
conducted during an ARIwC were used in the analyses.
3.3.3 Emergency Department Cough study
Study design
The Emergency Department Cough (EDC) study was a prospective observational cohort study
of Australian children aged <15 years who presented to a tertiary paediatric emergency
department (ED) with parent/guardian-reported cough. The published study protocol can be
found in Appendix B.162 Children were ineligible for inclusion if they had a history of chronic
lung disease (excluding asthma), an immunosuppressive condition, had used
immunomodulating drugs (excluding inhaled and oral steroids) in the 30 days prior to
presentation, or had insufficient English to fulfil study requirements. The study’s primary aim
was to comprehensively describe the natural history, epidemiology, aetiology, outcomes and
burden of cough during and after an ARI. Research staff recruited participants from the ED
from Monday-Saturday, between 6am and 9pm. If applicable, participants were also recruited
from hospital wards within 24 hours of their ED presentation. Participants were surveyed
weekly for 4 weeks following enrolment. Children with persistent cough at Week 4 were
reviewed by a paediatric respiratory physician within 2 weeks.
Settings and participants
The EDC study recruited participants from the ED of the Royal Children’s Hospital (RCH) in
Brisbane (now the Queensland Children’s Hospital). During the years in which the EDC study
was being conducted, the Royal Children’s Hospital was the major specialist paediatric public
hospital in Queensland with an average of 29,000 ED presentations per year.162
Data collection
At enrolment, comprehensive information regarding demographics, socio-economics, family
and household situation, child and family medical history, risk factors for ARIs, parent cough
knowledge and beliefs, current illness and cough characteristics, and any resource use since

Chapter 3: Research Methods 69
illness onset were collected. Quality of life was also assessed at enrolment. At each weekly
follow-up, information on cough characteristics and resource use in the past week were
collected and quality of life was assessed. Additional information on the methods used to
assess cough and quality of life and to evaluate costs using data on resource use are provided
in section 3.4. At specialist reviews, information on resource use since last contact, quality of
life and clinical information about the child’s cough illness, including a diagnosis by the
specialist, were collected.
For the purposes of this thesis, only data collected at baseline and at weekly follow-ups were
used in the analyses. The collection of economic and quality of life data during weekly follow-
ups did not begin until 18 months into the recruitment period so this thesis includes only the
subset of study participants from whom these data were collected.
3.3.4 Researching Intervention in Chronic Cough in Kids (RICCi) study
Study design
The Researching Intervention in Chronic Cough in Kids (RICCi) was a multi-centre nested
randomised controlled trial within a prospective cohort of children aged <15 years who
presented to one of six healthcare centres in South-East Queensland with parent/guardian-
reported cough. The published study protocol can be found in Appendix C.163 The study’s
primary aim was to determine whether an active intervention initiated at the development
of chronic cough following an ARI improved clinical outcomes compared to standard care.
Children were recruited upon presentation to one of the healthcare centres and were eligible
for enrolment if they were aged <15 years and had a possible respiratory illnesses with
parent-reported cough as a symptom. Children could present to the healthcare centre for any
reason (i.e. appointment for their respiratory/cough illness, appointment for another reason,
or accompanying another person), but were required to see a doctor for their cough as part
of the presentation. Children were ineligible for inclusion if they had a known history of
chronic lung disease (excluding asthma), a known immunosuppressive condition, had used
immunomodulating drugs (excluding oral prednisolone for an ARI or inhaled steroids) in the
30 days prior to presentation, had current or planned participation in another intervention
70 Chapter 3: Research Methods
study, or had a severe ARI requiring hospitalisation. Children recruited from the three
participating EDs were ineligible for enrolment if it was known at the time of screening that
they were going to be admitted as an inpatient or admitted to the short stay unit (extended
observation ward associated with the ED) or were classified as triage category 1-3. This
criterion was applied in order to reflect children who could otherwise have presented to
primary care.
Parents/guardians were surveyed weekly for 4 weeks following enrolment. Children with
persistent cough at Week 4 were randomised to either the intervention or usual care group
as per the published protocol (Appendix C)163 and only these children are included in the cost-
effectiveness analysis. The intervention consisted of a review by a respiratory physician
according to the paediatric cough management algorithm developed by Chang et al.148 The
usual care group received no intervention and parents/guardians were advised to continue
caring for the child and seeking healthcare as per usual. Irrespective of whether the child was
randomised or not, all parents/guardians were subsequently surveyed weekly for another 4
weeks following the randomised timepoint (total of 8 weeks follow-up). Children in the usual
care group whose cough persisted at Week 8 were offered a review by a respiratory physician
according to the same paediatric chronic cough algorithm.148 This was for duty of care
purposes, rather than for research purposes.
Setting and participants
The RICCi study was conducted through three primary healthcare clinics in Caboolture,
Toowoomba and Warwick, and through the EDs of Caboolture Hospital, Toowoomba Hospital
and the Queensland Children’s Hospital (QCH) in Brisbane. The primary healthcare clinics in
Toowoomba and Warwick are Aboriginal and Torres Strait Islander Community Controlled
Health Care Organisations. At the time of recruitment, the primary healthcare clinic in
Caboolture was an Aboriginal owned and operated service. QCH is the major specialist
paediatric public hospital in Queensland. Caboolture Hospital is a medium sized metropolitan
public hospital and Toowoomba Hospital is a large regional public hospital.164 Caboolture and
Toowoomba Hospitals cater to both children and adults and were chosen for the study based
on their proximity to the Indigenous-focussed primary health centres in which recruitment

Chapter 3: Research Methods 71
also took place. Over the financial years 2016-2017 and 2017-2018 during which the RICCi
study was recruiting, there were approximately 136,000 presentations to the QCH ED,
approximately 99,500 presentations to the Toowoomba ED, and approximately 102,000
presentations to the Caboolture ED.164
Data collection
At enrolment, comprehensive information regarding demographics, socio-economics, family
and household situation, child and family medical history, risk factors for ARIs, parent cough
knowledge and beliefs, current illness and cough characteristics, and any resource use since
illness onset were collected. Quality of life was also assessed at enrolment. For the Indigenous
Australian children enrolled in the study, information on a number of cultural characteristics
were collected at enrolment. At each weekly, follow-up information on cough characteristics
and ARIwC-related resource use in the past week were collected. Information about quality
of life was assessed in the weekly follow-ups from Week 4 onwards for participants who were
randomised. Additional information on the methods used to assess cough and to evaluate
costs using data on resource use are provided in section 3.4. For the purpose of this thesis,
only data collected from participants at baseline and at Weeks 4-8 (post-randomisation) were
used in the analyses.

72 Chapter 3: Research Methods
3.4 COMMON METHODS ACROSS ALL STUDIES
3.4.1 Measurement and evaluation of cough outcomes
Despite differences in study design, study duration, study populations, recruitment settings
and follow-up procedures, there are a number of commonalities in the types of data collected
and methods of data analysis applied in each of the four studies. In each of the four studies,
cough characteristics and outcomes (cough severity, cough duration and resolution and
cough-specific QoL) were measured and assessed using the same tools and definitions. The
methods of measuring and assessing cough severity, cough duration and resolution, and
cough-specific quality of life, across the four studies are discussed in more detail below.
Cough severity
Cough severity was assessed repeatedly throughout each of the four studies. Cough severity
was assessed using a verbal category descriptive (VCD) tool.41 The VCD tool is a validated
cough severity scoring system for day-time and night-time cough. It ranges from 0 to 5, with
0 representing the lowest severity and 5 representing the highest severity. Each number is
allocated a description (see Table 3.5 below) and the parent/guardian and/or child selects a
score based on the description.
Table 3.5. Verbal category descriptive scores used to measure cough severity. Day-time cough score (today) Night-time cough score (last night) 0 = No cough during the day 0 = No cough at night 1 = Cough for one-two short periods only 1a = Cough on waking only (cough did not
wake child up) 1b = Cough on going to sleep only
2 = Cough for more than two short periods 2 = Awoken once or awoken early due to coughing
3 = Frequent coughing but does NOT interfere with school or other daytime activities
3 = Frequent waking due to cough(s)
4 = Frequent coughing which DOES interfere with school or other daytime activities
4 = Frequent cough most of the night
5 = Cannot perform most usual daytime activity due to severe coughing
5 = Distressing cough
Chapter 3: Research Methods 73
In COBS, the VCD tool was used at each clinic review to assess for day-time cough only. It was
completed by a parent/guardian and by children aged ≥7 years who were willing and able to
provide a response. In TLSIM, EDC and RICCi, the VCD tool was completed by a
parent/guardian at each weekly follow-up throughout the study for both day-time and night-
time cough.
Cough resolution and duration
Resolution of cough was a primary outcome in the TLSIM, EDC and RICCi studies. Resolution
of cough was determined through weekly contact with parents/guardians, by asking the
following question: Has your child stopped coughing for ≥3 full days and nights in the past
week? This time-period for a break in cough was based on the known frequency of new
infections during or shortly after ARIs, particularly viral illnesses, in children.165 Options for
parents/guardians to respond were: “Yes”, “No” or “Unknown”. The response was entered as
“Missing” if no contact was made with a parent/guardian at that timepoint. The first instance
of a parent/guardian response of “Yes” to this question was considered confirmation that the
current cough illness has resolved, regardless of the response to this question in subsequent
follow-ups.
For the TLSIM and EDC studies, responses to this question over the follow-up period were
used to determine cough duration at the end of a follow-up period. The number of weeks
between the identification of the cough illness (for EDC this was at enrolment, for TLSIM this
was during monthly follow-ups or through parent contact) and the first timepoint at which
the cough was reported to have resolved was used to determine cough duration. As per
recommendations from the Thoracic Society of Australia and New Zealand for the
classification of cough duration in children,29 a cough duration of less than two weeks was
classified as acute cough. A cough duration between two and four weeks, inclusive, was
classified as sub-acute cough and a cough duration of more than four weeks was classified as
chronic cough. Table 3.6 contains examples of parent/guardian responses to the cough-stop
question over a follow-up period and how these responses were interpreted to determine
cough resolution and classify cough duration at the end of the follow-up period for the TLSIM
and EDC studies.

74 Chapter 3: Research Methods
Table 3.6. Example parent/guardian responses to weekly follow-up question “Has your child stopped coughing for ≥3 full days and nights in the past week?”, and corresponding
classification of cough resolution and duration. Week 1 Week 2 Week 3 Week 4 Cough resolution Cough duration
No No No No No Chronic cough
No Yes No Yes Yes Acute cough
Yes Yes No No Yes Acute cough
No No Yes Yes Yes Sub-acute cough
No No Yes Missing Yes Sub-acute cough
No Missing Missing No Unknown Unknown
For the RICCi study, the same method of determining cough resolution was applied to
determine cough resolution by Week 4, and thus whether a participant was eligible for
randomisation. Cough resolution by Week 8 among randomised participants was determined
using a combination of two measures: (1) whether at any follow-up after randomisation it
was reported that the child had stopped coughing, or (2) whether there had been a ≥75%
decrease in mean cough severity between Week 4 and Week 8. Day and night cough severity
at Week 4 and Week 8 was measured using the VCD tool. A mean cough severity score was
obtained for the two timepoints by summing the day-time cough score and the night-time
cough score, and dividing by two. Table 3.7 shows examples of potential parent/guardian
responses to the VCD question at Week 4 and then subsequently at Week 8, and how these
responses were interpreted to determine whether there had been a ≥75% decrease in mean
cough severity by Week 8.

Chapter 3: Research Methods 75
Table 3.7. Examples of cough severity scores reported at weekly follow-ups using the VCD tool, and corresponding classification of a ≥75% reduction in score over time.
Week 4 – Day score
Week 4 – Night score
Week 4 – Mean score
Week 8 – Day score
Week 8 – Night score
Week 8 – Mean score
≥75% reduction in score
2 5 3.5 1 1 1 No 1 2 1.5 2 1 1.5 No
3 1 2 5 4 4.5 No 4 4 4 0 1 0.5 Yes 1 4 2.5 0 0 0 Yes 5 5 5 2 0 1 Yes Missing Missing Missing 3 2 2.5 Unknown 4 2 3 Missing Missing Missing Unknown
These two measures of cough (stop in cough and ≥75% reduction in VCD score) were
combined to determine cough resolution by Week 8 (Table 3.8). All participants who reported
a stop in cough between Week 4 and Week 8 were considered to have experienced cough
resolution by Week 8. Participants who reported no stop in cough between Week 4 and Week
8, but who reported a ≥75% reduction in mean cough severity were also considered to have
experienced cough resolution by Week 8. Participants for whom it was unknown whether
there was a stop in cough between Week 4 and Week 8, but who experienced a ≥75%
reduction in mean cough severity between Week 4 and Week 8, were also considered to have
experienced a cough resolution by Week 8.
Table 3.8. Use of two measures of cough to determine cough resolution post-randomisation in the RICCi study.
Stop in cough Yes No Unknown
≥75% reduction in cough
Yes Cough resolution Cough resolution Cough resolution
No Cough resolution No resolution Unknown
Unknown Cough resolution No resolution Unknown

76 Chapter 3: Research Methods
3.4.2 Measurement and evaluation of cough-specific quality of life
Three validated cough-specific QoL tools exist for use in paediatric respiratory research. These
are: the ‘Parent-proxy children’s Acute Cough-specific Quality of Life’ (PAC-QoL)
questionnaire,43 the ‘Parent Cough-specific Quality of Life’ (PC-QoL) questionnaire,44,45,119,166
and the ‘Chronic Cough-specific Quality of Life’ (CC-QoL) questionnaire.120
Parent-proxy children’s Acute Cough-specific Quality of Life
The PAC-QoL questionnaire is designed to assess the impact of acute cough on QoL. The PAC-
QoL questionnaire pertains to QoL in the 24 hours prior to questionnaire completion. The
PAC-QoL is a parent-proxy measure, and therefore the questionnaire is completed by a
parent/guardian but the questions are designed to capture both the quality of life of the child
and the parents/guardians. The PAC-QoL is a 16-item questionnaire.43
Parent Cough-specific Quality of Life
The PC-QoL questionnaire is designed to assess the impact of chronic cough on QoL. The PC-
QoL pertains to QoL during the 1 week prior to questionnaire completion. The PC-QoL is a
parent-proxy measure, and therefore the questionnaire is completed by a parent/guardian
but the questions are designed to capture both the quality of life of the child and the
parents/guardians. There are two versions; a 27-item questionnaire (PC-QoL-27)44,119 and an
8-item questionnaire (PC-QoL-8).45
Chronic Cough-specific Quality of Life
The CC-QoL questionnaire is also designed to assess the impact of chronic cough on QoL,
however it is designed to be completed by the child and therefore questions relate solely to
the child. The CC-QoL pertains to QoL during the 1 week prior to questionnaire completion.
The CC-QoL has been validated for use among children aged ≥7 years.120 The CC-QoL is a 16-
item questionnaire.

Chapter 3: Research Methods 77
Use of health-related quality of life questionnaires across the studies
In COBS, the PC-QoL-27 and the CC-QoL questionnaires were administered at each clinic
review (conducted once every 3 months). If the parent/child did not attend the clinic review,
the questionnaires were able to be completed over the phone or via email for that timepoint
if the parent/child responded to contact attempts. In EDC, the PAC-QoL questionnaire was
administered at baseline and at each weekly follow-up (at Weeks 1, 2, 3 and 4). In RICCi, the
PAC-QoL questionnaire was administered to all participants at baseline and the PC-QoL-8 was
administered to randomised participants from Week 4 onwards. However, none of these
RICCi data were included in any analyses in this thesis. No measurement of child, parent or
parent-proxy cough-specific QoL was undertaken in the TLSIM study given the lack of a
validated measure for Indigenous children.
For all three cough-specific QoL questionnaires, responses to each question were recorded
on a 7-point Likert type scale where 1 represents the highest level of burden/concern and 7
represents the lowest level of burden/concern. These responses were then summed and the
total score was divided by the number of items on the respective questionnaire to obtain a
mean QoL score for each participant.
3.4.3 Measurement and evaluation of costs
Established methods of costing illness were applied to estimate the cost of ARIwC within the
TLSIM, EDC and RICCi studies. As explained by Drummond et al.167 there are a number of steps
involved in evaluating costs including: (i) determining the perspective of analysis, (ii)
identifying the items of resource use, (iii) measuring the quantities of resource use, and (iv)
valuing the resource use through the assignment of unit costs. The application of each of
these steps to the studies in this thesis are described in more detail below.
Perspective of analysis
In the TLSIM and EDC cost of illness studies, costs were evaluated from the perspectives of (a)
caretakers, (b) the public healthcare system and (c) third parties. In the RICCi cost-
effectiveness analysis study, costs were evaluated from the perspective of (a) caretakers and

78 Chapter 3: Research Methods
(b) the public healthcare system. The perspective of caretakers includes costs incurred by the
people who informally care for the child when they are sick and who may incur costs as a
result of the child’s illness. This may include biological family, non-biological family and/or
friends. This perspective is equivalent to what is often referred to in paediatric cost of illness
studies as the perspective of the family. The perspective of the public healthcare system
includes costs incurred at a federal and state government level through Medicare. Medicare
is the universal public health insurance scheme that operates in Australia. Medicare provides
partially or completely subsidised access to public hospital services, some primary and
secondary healthcare services, some pathology services, and some pharmaceuticals. The
perspective of third parties refers to other groups who incur costs as a result of the illness
who are not caretakers, nor the public healthcare system. For the studies included in this
thesis, where relevant, this included employers and private health insurers.
Identification of items of resource use
As the primary aims of the TLSIM, EDC and RICCi studies were related to clinical outcomes,
the identification of items of resource use was integrated within the questionnaires and
timepoints used to collect the clinical data. Data on resource use were parent/guardian-
reported and collected weekly using a CRF. The decision of which items of resource use to
collect data on was based on clinical expertise regarding usual resource use for paediatric
ARIs as well as based on previous Australian studies examining the costs of respiratory
infections among children.97,106,107 Table 3.9 contains a list of items of resource use that were
included in the CRFs for each study, as well as the costs perspective/s which apply to each
item.

Chapter 3: Research Methods 79
Table 3.9. Items of resource use and their respective cost perspective. Item Caretakers Public
healthcare system
Employers Private health
insurance Use of healthcare services
General practitioner visits Emergency department presentations
Hospitalisations Any other healthcare visits, including specialist visits
Any diagnostic tests or procedures
Medications Over-the-counter medications
Government subsidised prescription medications
Time spent seeking healthcare for child’s illness Time off work with no pay lost (i.e. paid leave)
Time off work with pay lost (i.e. unpaid leave)
Time off usual non-work activities
Additional time spent caring for child due to cough illness Time off work with no pay lost (i.e. paid leave)
Time off work with pay lost (i.e. unpaid leave)
Time off non-work activities Missed activities in which fees were already paid
Missed childcare Missed activities for child Missed activities for parent/guardian or other carers
Travel Ambulance trips§
§Information regarding use of ambulance was only collected in the EDC study

80 Chapter 3: Research Methods
In addition, in each study, at each timepoint in which resource use data were collected, the
final question asked parents/guardians whether they had “incurred any other costs because
of your child’s cough illness, not already covered”. This was intended to ensure that the cost
of an item of resource use was not excluded as a result of there not being a specific question
for that item within the CRF. These miscellaneous items of resource use were examined solely
from the perspective of caretakers.
Measurement of quantities of resource use
For most items of resource use within these three studies, data on the quantities of use were
collected through the questionnaires administered to parents/guardians at each relevant
timepoint; see Table 3.10 for items and quantities collected. For some items of resource use
no measurement of the quantity was undertaken as the costs incurred by caretakers were
sourced directly from the parent/guardian completing the questionnaire.
Table 3.10. Items of resource use and quantities collected. Item of resource use Information on quantity of resource
use collected at each weekly timepoint
General practitioner visits Number of visits Emergency department presentations Number of presentations Hospitalisations Number of admissions and length of
stay Other healthcare visits, including specialist visits
Number of visits
Diagnostic tests or procedures Number of tests/procedures conducted Medications Per medication, number of doses given
per day and number of days given for Time spent seeking healthcare
Time off work with pay lost Time off work with no pay lost Time off non-work activities
Time spent caring for child Time off work with pay lost Time off work with no pay lost Time off non-work activities
Hours and minutes for each category and sub-category
Missed activities Quantity not collected Missed childcare Number of days collected in EDC study
only Miscellaneous items Quantity not collected

Chapter 3: Research Methods 81
A number of challenges were encountered during the process of measuring the quantities of
resource use reported by parents/guardians throughout each of the studies involving costing
of illness. Key challenges included quantities that were missing/unknown or quantities
entered as free text rather than numeric values. Methods for dealing with these challenges
are described below.
In some circumstances a parent/guardian reported having used or consumed an item of
resource use but the quantity was missing or unknown. In most of these circumstances, the
minimum quantity was assumed in order to avoid over-estimating the cost of illness. For
general practitioner visits, other healthcare visits and tests/procedures it was assumed that
one visit occurred or one test was performed. For medications it was assumed that the
medication was given for one day and/or one dose was given per day. Missing quantities for
ED presentations and hospitalisations were rare and where possible, the quantity of ED
presentations or hospitalisations was validated with medical records on hospital databases.
If this was not possible, one presentation/admission was assumed and in the case of an
admission, a length of stay of one day was assumed.
When quantities for time off work or non-work activities as a result of seeking healthcare
were missing, a standard quantity of time was assumed based on the types of healthcare
sought. The quantity of time assumed was equal to the mean quantity of time spent seeking
that type of healthcare by other participants within the study. Whether this time was
allocated to time off work or time off non-work activities depended on the employment status
of the carer. If quantities for time off work or non-work activities as a result of extra time
spent caring for the child were missing, the quantities were left as missing. There was no
reliable way to estimate the quantity and the ‘assume minimum quantity’ approach was not
applicable in this situation.
It was not uncommon across all three costing studies that the value of the quantity was
reported and/or entered as free text, rather than a numeric value. This mostly frequently
occurred for quantities of medication (duration and dosage) and quantities of time spent
seeking healthcare or caring for the child. Data which were reported and/or entered as free
text were converted to numeric data prior to analysis.

82 Chapter 3: Research Methods
Valuation of items of resource use through the assignment of unit costs
The valuation of items of resource use through the assignment of unit costs is the step in
which data on resource use are converted into monetary values which can then be used to
generate estimates of cost of illness. In health economics, it is considered that the true cost
or value of a particular item of resource use is its opportunity cost. The opportunity cost refers
to “the value of the forgone opportunity to use in a different way those resources that are
used or lost due to illness”.168 However, it is acknowledged that on a practical level, estimating
the opportunity cost for many items of resource use can be challenging. Market prices are
therefore considered to be a suitable alternative.167 Market prices were sourced from the
relevant cost perspective/s for the majority of items of resource use reported in each study.
The costs of missed childcare and other activities were the only items of resource use that
were not assigned a unit cost using market prices, as parents/guardians in each study directly
reported these costs. Market prices were obtained from publicly accessible sources in
Australian Dollars ($AU). The same sources of unit costs were used across all studies to ensure
consistency. Where possible, the unit costs selected were for the year 2017. If market prices
were not available in this year, market prices from earlier calendar or financial years were
selected and inflation rates from the Reserve Bank of Australia were used to adjust prices.169
The inflation rate used to adjust prices to 2017 prices, from the base years of 2013, 2014,
2015 and 2016 were 7.4%, 4.8%, 3.3% and 1.9% respectively. When adjusting prices from the
base year of 2018 to 2017 prices, a deflation rate of 1.9% was used.
Key sources of unit costs included the Medicare Benefits Schedule, Australian Medical
Association, Pharmaceutical Benefits Schedule, and the Independent Hospital Pricing
Authority. Some contextual information on these key sources is provided below. Other
sources are described on a case-by-case basis in subsequent sections.
Medicare Benefits Schedule
The Medicare Benefits Schedule (MBS) is a list of primary and secondary healthcare and
pathology services which are subsidised by the Australian Federal Government under
Medicare. The MBS is updated on a monthly basis and for each service the following
information is provided (see Figure 3.2 for an example):

Chapter 3: Research Methods 83
a) A unique item number (yellow box in Figure 3.2)
b) A detailed description of the service including any clinical and/or administrative
criteria for the use of the service (red box in Figure 3.2)
c) A Schedule fee (green box in Figure 3.2)
d) The Medicare benefit (i.e. rebate) rate and the equivalent amount provided (purple
box in Figure 3.2)
As stated in the MBS the Schedule fee is the value for the service determined by the
Australian government “as being reasonable on average for that service having regard to
usual and reasonable variations in the time involved in performing the service on different
occasions and to reasonable ranges of complexity and technical difficulty encountered”.170
However, the Schedule fee is not always equivalent to the subsidy provided to patients
through Medicare. The benefit for services listed on the MBS may be 75%, 85% or 100% of
the Schedule fee, depending on the conditions in which the service is received. Subsidies for
services provided by a GP generally receive a benefit of 100% of the Schedule fee, whereas
services provided by other health professionals (i.e. non-GP services) receive a benefit of
85% of the Schedule fee if the service is provided outside of a hospital.
When a patient receives a service listed on the MBS, the medical practitioner may choose to
accept the Medicare benefit as the full payment for the service or they may charge the patient
additional costs, above the value of the Medicare benefit. The former circumstance is referred
to as bulk-billing. Bulk-billing means that the patient incurs no out-of-pocket costs for
receiving the service. When a service is not bulk-billed, the value of the additional costs
charged to that patient is at the discretion of the medical practitioner. Bulk-billing only affects
Figure 3.2. Example of an item listed in Medicare Benefits Schedule.

84 Chapter 3: Research Methods
the cost incurred by the patient; regardless of whether a service is bulk-billed or not, the cost
of the service incurred by the public healthcare system remains the same. In Australia bulk-
billing is common, particularly for paediatric services; in 2016-2017 86% of GP attendances,
88% of pathology services and 77% of diagnostic imaging services were bulk-billed.171
Australian Medical Association List of Medical Services and Fees
The Australian Medical Association (AMA) is the peak representative body for medical
students and practitioners in Australia. On an annual basis, the AMA publishes a List of
Medical Services and Fees. This list contains all services listed on the MBS and provides a
suggested fee for medical practitioners to charge for a non-bulk-billed service, which the AMA
has deemed to be a fair and reasonable amount.
Pharmaceutical Benefits Schedule
The Pharmaceutical Benefits Schedule (PBS) is a list of all pharmaceuticals which are
subsidised by the Australian Federal Government under Medicare’s Pharmaceutical Benefits
Scheme. The PBS is updated on a monthly basis and for each pharmaceutical the following
information is provided (see Figure 3.3 for an example):
a) A unique item number (yellow box in Figure 3.3)
b) The name, form, strength and pack size of the pharmaceutical (red box in Figure 3.3)
c) The DPMQ which stands for the “dispensed price for maximum quantity” (green box
in Figure 3.3)
d) The General Patient Charge (GPC) (purple box in Figure 3.3)
Figure 3.3. Example of medication listed in Pharmaceutical Benefits Schedule.

Chapter 3: Research Methods 85
The DPMQ (green box in Figure 3.3) is the actual or true cost of the medicine. The GPC is the
co-payment required from anyone who is considered a ‘general patient’. General patients are
anyone who does not have one of the following: a Pensioner Concession Card, an Australian
Seniors Health Card, a Health Care Card or a Department of Veterans' Affairs Gold, Orange,
or White Card. A patient with one of the aforementioned cards is considered a concessional
patient. Additionally, the Australian Government introduced a “Closing the Gap (CTG) PBS Co-
payment programme” in 2010 which entitles Indigenous Australian people who are registered
for the programme, and who would usually be considered general patients, to receive
medications for the same price as concessional patients.
Under the PBS, there is an upper limit to the GPC required from general patients. In 2017 this
was $38.80, meaning no general patient paid more the $38.80 for a single prescription. For
concessional patients, the upper limit of the GPC is lower. In 2017, the GPC for a concessional
patient was $6.30. When the DPMQ is greater than the GPC, the Australian government pays
the difference in costs between the GPC and the DPMQ. When the DPMQ is less than the GPC,
the Australian government makes no contribution to the cost of the medicine.
Consequently, using the example in Figure 3.3, a general patient would pay $21.68 for the
medicine and the Australian Government would make no contribution to the cost of the
medicine. A concessional patient would pay $6.30 for the medicine and the Australian
Government would contribute $9.26 (DMPQ $15.56 - $6.30).
Independent Hospital Pricing Authority
The Independent Hospital Pricing Authority (IHPA) is a national, independent government
agency which is responsible for determining two key measures used for the funding of public
hospital services.172 The first measure is the National Efficient Price (NEP) which is an estimate
of “level of funding which would meet the average cost of providing acute care (admitted,
emergency and outpatient) services in public hospitals across Australia”.173 The second
measure is the National Weighted Activity Unit (NWAU) which is a weight applied to the NEP
to determine the value of a specific acute care service.173

86 Chapter 3: Research Methods
For both ED services and admitted services (i.e. inpatient hospitalisations) the value of the
NWAU is dictated by ‘clinical complexity’. The criteria for determining clinical complexity of
ED services includes: age, Indigenous status, and the Urgency Related Group (URG). The URG
is a classification system used to group ED presentations on the basis of triage category,
admission status and diagnosis. The criteria for determining clinical complexity of admitted
services includes: age, Indigenous status, hospital characteristics including state/territory and
regionality, length of stay, funding source of the admission and the Diagnostic Related Group
(DRG). The DRG is a classification system used to group admitted services on the basis of
diagnosis.
Both the NEP and the NWAU are calculated on an annual basis. IHPA provides NWAU
calculators174 that can be used to estimate the cost of an ED presentation or a hospitalisation
based on the criteria described above.
General practitioner visits
A unit cost for a visit to a GP was obtained from both the perspective of caretakers and the
public healthcare system. Regardless of whether a visit was bulk-billed or not, the cost of a
GP visit incurred by the public healthcare system remained the same. The unit cost for a GP
visit from the perspective of the public healthcare system was obtained from the MBS and
was equal to 100% of the Schedule fee.
When a parent/guardian reported that a GP visit was not bulk-billed, costs were assigned to
the caretaker sector. Data on the amount of money paid out-of-pocket by caretakers for a
non-bulk-billed GP visit were not collected directly from participants. Therefore, the unit cost
for a non-bulk-billed GP visit from the perspective of caretakers was assumed to be the
difference between the fee listed in the AMA List of Services and Fees and 100% of the
Schedule fee listed in the MBS.
We assumed that all GP visits reported across all studies were a “Level B” consultation. A
“Level B” consultation as stated in the MBS is “a consultation lasting less than 20 minutes for
cases that are not obvious or straightforward in relation to one or more health related
issues”.170 This decision was based off a paper published in the journal Australian Family

Chapter 3: Research Methods 87
Physician which reported that the majority of GP consultations (86%) are designated as Level
B consultations.175 Unless specified by the parent/guardian, it was assumed that all GP visits
occurred at a consulting room and therefore the unit cost used was for a Level B consultation
for a “professional attendance by a general practitioner at consulting rooms”.170,176 If the
parent/guardian specified that the GP visit was an after-hours or home doctor service, the
unit cost used was for a Level B consultation for a “professional attendance by a general
practitioner other than attendance at consulting rooms, a hospital or a residential aged care
facility”.170,176
Specialist visits
A unit cost for a visit to a specialist was obtained from both the perspective of caretakers and
the public healthcare system. The unit cost of a specialist visit from the perspective of the
public healthcare system was obtained from the MBS and was equal to 85% of the Schedule
fee.
When a parent/guardian reported that the specialist visit was not bulk-billed, costs were
assigned to the caretaker sector. Data on the amount of money paid out-of-pocket by
caretakers for a non-bulk-billed specialist visit were not collected directly from participants.
Therefore, the unit cost for a specialist visit from the perspective of caretakers was assumed
to be the difference between the fee listed in the AMA List of Services and Fees and 85% of
the Schedule fee listed in the MBS.
The service selected from the MBS and the AMA List of Services and Fees for a specialist visit
was a “Professional attendance at consulting rooms or hospital, by a consultant physician in
the practice of his or her specialty (other than psychiatry) following referral of the patient to
him or her by a referring practitioner-initial attendance in a single course of treatment”.170,176
Naturopath consultation
One participant in one of the studies reported seeking healthcare from a naturopath for their
child’s illness. Naturopathy services are not covered by Medicare and therefore the unit cost
for a visit to a naturopath was obtained from the perspective of caretakers. Data on the

88 Chapter 3: Research Methods
amount of money paid out-of-pocket by caretakers in the case of a visit to a naturopath were
not collected directly from the participant. Therefore, the unit cost was based off research
published in the journal Complementary Therapies in Medicine177 which surveyed
complementary and alternative medicine practitioners (n=795) in Australia. The study
reported that the average fee per consultation was $AU45.00. Direct communication with the
authors confirmed that the year these costs applied to was 2003. After adjusting for inflation
to 2017 prices, the unit cost per naturopath visit was determined to be $63.37.
Physiotherapist consultation
One participant in one of the studies reported seeking healthcare from a physiotherapist for
their child’s illness. Physiotherapy services are not routinely covered by Medicare and
therefore the unit cost for a visit to a physiotherapist was obtained from the perspective of
caretakers. Data on the amount of money paid out-of-pocket by caretakers in the case of a
visit to a physiotherapist were not collected directly from the participant. Therefore, the unit
cost was based off research published in the journal BMC Health Services Research178 which
estimated unit costs of allied health and community services in Australia. The study reported
that the mean cost per private consultation was $AU63.97 in 2011 prices. After adjusting for
inflation to 2017 prices, the unit cost per physiotherapist visit was determined to be $71.65.
13 HEALTH
Some participants reported calling “13 HEALTH” to seek advice for their child’s cough illness.
“13 HEALTH” is a phone service available in Queensland which provides health-related advice
from a registered nurse. It is a service provided at no cost to consumers, so the unit cost for
a call to 13 HEALTH was obtained from the perspective of the public healthcare system.
According to a media statement in 2006 regarding a trial of the “13 HEALTH” service, the
average length of a call to “13 HEALTH” was estimated at 11 minutes.179 The hourly wage of
a registered nurse in Queensland (assumed Grade 6, Band 2, pay point 1 based on expert
advice) as of April 2017180 was multiplied by 11/60 to obtain an average cost per call.

Chapter 3: Research Methods 89
Diagnostic tests and procedures
A unit cost for a test or procedure was obtained from both the perspective of caretakers and
the public healthcare system. Only tests conducted outside of a hospital or emergency
department were assigned a unit cost. Tests conducted as part of an ED presentation or
hospitalisation were included in the unit cost of the presentation/admission. The unit cost for
a test or procedure from the perspective of the public healthcare system was obtained from
the MBS and was equal to 85% of the Schedule fee.
When a parent/guardian reported that a test or procedure was not bulk-billed, costs were
assigned to the caretaker sector. Data on the amount of money paid out-of-pocket by
caretakers in the case of a non-bulk-billed test or procedure were not collected directly from
participants. Therefore, the unit cost for a test or procedure from the perspective of
caretakers was assumed to be the difference between the fee listed in the AMA List of Services
and Fees and 85% of the Schedule fee listed in the MBS.170,176
Clinical guidance was sought to select the most appropriate test from the MBS and AMA List
of Services and Fees based on what the parent/guardian reported as the test name. This was
particularly important when the test name provided by a parent/guardian was not specific
enough to be certain about what test had been conducted, e.g. parent-report of a “blood
test” could mean a number of different tests. In these cases, clinical guidance was sought to
determine what test would have been most likely conducted in the context of an ARIwC. In
the case of the RICCi study, the parent/guardian-reported name of a test which was
conducted as part of a specialist review for a child randomised to the intervention group was
able to be confirmed with tests results collected as part of the clinical information for the
specialist review.
Emergency department presentations and hospitalisations
A unit cost for an ED presentation was obtained from the perspective of the public healthcare
system as all ED presentations reported by study participants were to public hospitals. Unit
costs for ED presentations were obtained using the IHPA NWAU Emergency Department

90 Chapter 3: Research Methods
Services 2017-2018 Calculator.174 Information based on the study participant’s age,
Indigenous status and URG were inputted into the calculator. The URGs used were:
• URG039 - Non-Admitted Triage 1 - All Major Diagnostic Block groups
• URG095 - Non-Admitted Triage 2 - Respiratory system illness
• URG055 - Non-Admitted Triage 3 - Respiratory system illness
• URG108 - Non-Admitted Triage 4 - Respiratory system illness
• URG115 - Non-Admitted Triage 5 - Illness of the eyes, ear, nose and throat
Triage category was collected from the medical records of study participants and this was
used to select the relevant URG. Where this information was unavailable, the mean cost of
the five URGs listed above was used, or the most frequently occurring triage category among
the study cohort was used, depending on the study.
A unit cost for a hospitalisation was obtained from both the perspective of the public
healthcare system and, where applicable private health insurers (i.e. if participant was
admitted to a private hospital or admitted to a public hospital as a private patient). Unit costs
for hospitalisations were obtained using the IHPA NWAU Acute Admitted Services 2017-2018
Calculator.174 Information based on the study participant’s Indigenous status, total length of
stay of admission, length of stay in the intensive care unit (if applicable), the DRG and whether
the participant was admitted as a private patient, were inputted into the calculator. The DRG
selected was based on the hospital discharge diagnosis. Clinical guidance was sought to do
this. Table 3.11 shows the hospital discharge diagnoses of study participants and the
corresponding DRG selected. If the diagnosis was unknown the DRG ‘E67B’ was used.
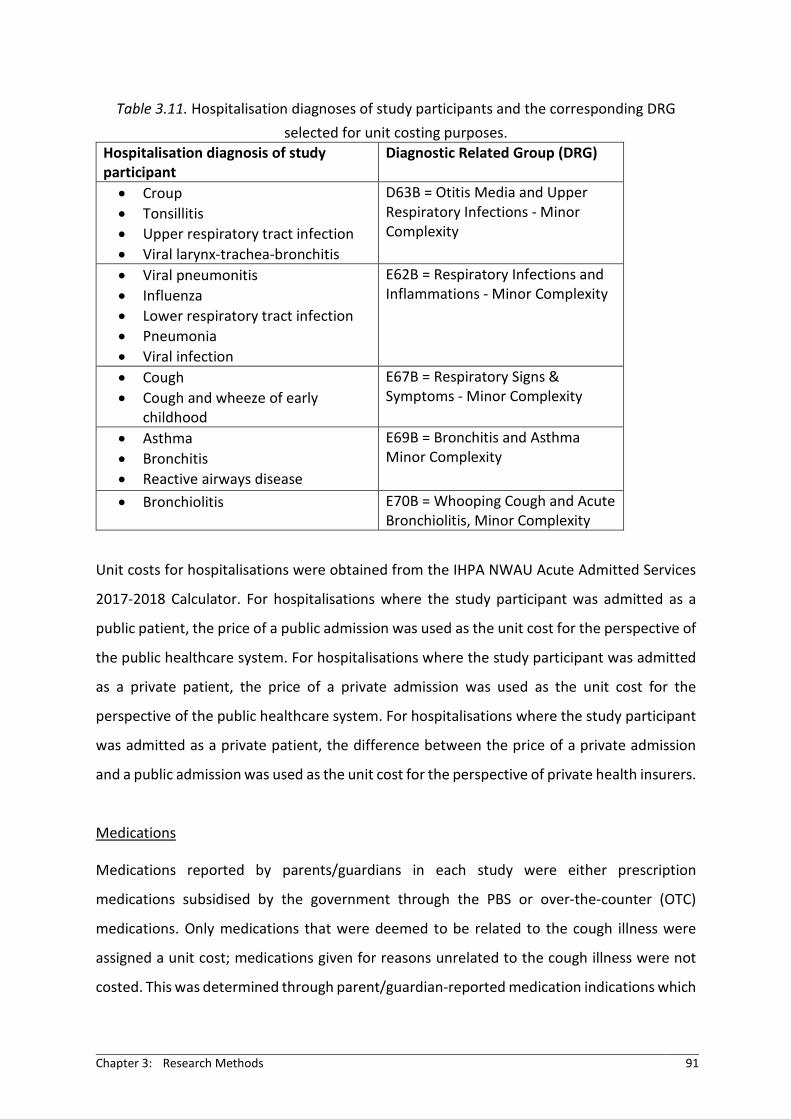
Chapter 3: Research Methods 91
Table 3.11. Hospitalisation diagnoses of study participants and the corresponding DRG selected for unit costing purposes.
Hospitalisation diagnosis of study participant
Diagnostic Related Group (DRG)
• Croup • Tonsillitis • Upper respiratory tract infection • Viral larynx-trachea-bronchitis
D63B = Otitis Media and Upper Respiratory Infections - Minor Complexity
• Viral pneumonitis • Influenza • Lower respiratory tract infection • Pneumonia • Viral infection
E62B = Respiratory Infections and Inflammations - Minor Complexity
• Cough • Cough and wheeze of early
childhood
E67B = Respiratory Signs & Symptoms - Minor Complexity
• Asthma • Bronchitis • Reactive airways disease
E69B = Bronchitis and Asthma Minor Complexity
• Bronchiolitis E70B = Whooping Cough and Acute Bronchiolitis, Minor Complexity
Unit costs for hospitalisations were obtained from the IHPA NWAU Acute Admitted Services
2017-2018 Calculator. For hospitalisations where the study participant was admitted as a
public patient, the price of a public admission was used as the unit cost for the perspective of
the public healthcare system. For hospitalisations where the study participant was admitted
as a private patient, the price of a private admission was used as the unit cost for the
perspective of the public healthcare system. For hospitalisations where the study participant
was admitted as a private patient, the difference between the price of a private admission
and a public admission was used as the unit cost for the perspective of private health insurers.
Medications
Medications reported by parents/guardians in each study were either prescription
medications subsidised by the government through the PBS or over-the-counter (OTC)
medications. Only medications that were deemed to be related to the cough illness were
assigned a unit cost; medications given for reasons unrelated to the cough illness were not
costed. This was determined through parent/guardian-reported medication indications which

92 Chapter 3: Research Methods
were collected for each medication. Clinical guidance was sought to determine which
indications were related to the cough-illness and which were not.
Examples of parent-reported medication indications that were deemed unrelated to the
cough illness were:
• Descriptions of other illnesses or injuries, e.g. otitis media, conjunctivitis, allergies,
colic, reflux, hay fever, school sores, bumped head, teething, anaphylaxis, rash,
infected tooth abscess, anaemia;
• Descriptions of procedures, e.g. vaccination, tonsillectomy, circumcision; and
• Miscellaneous, e.g. immunity, teething, vomiting, sad/miserable, unable to sleep, pain
in an unrelated area (e.g. abdomen, legs, head).
For medication indications which were ambiguous (e.g. requested by doctor, prescribed,
unwell, unknown) the medication type/name was used to determine whether the medication
was likely to be related to the cough illness or not.
For prescription medications, a unit cost per dose of medication was calculated from both the
perspective of caretakers and the public healthcare system using medication costs reported
in the PBS. The value of the unit cost depended on whether the study participant was
considered a general patient or a concessional patient (including concessional patients under
the CTG Co-payment programme). Concessional status was obtained from study participants
at enrolment as part of the baseline questionnaire. Regardless of the brand name reported
by the parent/guardian for a particular medication, the unit cost per dose was calculated
using the cost of the generic brand of that medication.
For OTC medications a unit cost per dose of medication was obtained from the perspective
of caretakers medication prices reported on the website of Chemist Warehouse Australia in
June-September 2017. Regardless of the study participant’s concessional status, the unit cost
per dose was the same. When different brand names were reported by parents/guardians for
the same type of medication, the most commonly reported brand was selected and the unit
cost per dose for that brand was calculated and applied to all reports of the same type of
medication.

Chapter 3: Research Methods 93
For each medication, the unit cost per dose was calculated using the following steps:
1) Calculate the average quantity per dose – this was based on the recommended dosage
for the mean age and/or weight of the study cohort. The recommended dosage by age
and/or weight was obtained from the MIMS Online database, which is a leading
independent Australian database of medicine information.
2) Calculate the number of doses per standard package of medicine – this was calculated
by dividing the total quantity (in millimetres, tablets, inhalations etc.) in a standard
package of medicine by the average quantity of medicine per dose.
3) Calculate the cost per dose – this was calculated by dividing the cost per standard
package of medicine by the number of doses per standard package of medicine.
To calculate the cost per medication per week, the unit cost per dose of medication was
multiplied by the number of doses given per day, which was then multiplied by the number
of days given in the past week.
Time off work and non-work activities
Unit costs for caretaker’s time off work and non-work activities were obtained from both the
perspective of caretakers and employers. Time off work applies to time off paid employment.
Time off non-work activities applies to time off activities such as study, leisure, sleep and usual
household responsibilities. While there is no explicit market price for time off non-work
activities, there is evidently a value of this time and therefore a cost to the caretakers when
this time is lost. Consequently, the same unit costs were applied to time off work and time off
non-work activities to ensure all time spent seeking healthcare for the child or caring for the
child while they were sick was valued equally. This method is consistent with previous
studies.54,97,106
When a parent/guardian reported that a caretaker had time off work with no pay lost (e.g.
paid leave was taken), the costs were assigned to the perspective of the employer. When a
parent/guardian reported that a caretaker had time off work with pay lost (e.g. unpaid leave
was taken), costs were assigned to the perspective of caretakers. When a parent/guardian

94 Chapter 3: Research Methods
reported that a caretaker had time off non-work activities, costs were assigned to the
perspective of caretakers.
As no data were collected directly from study participants on caretaker’s hourly income from
employment, an hourly income was estimated using data published by the Australian Bureau
of Statistics (ABS).181 ABS estimates of full-time adult average weekly ordinary time earnings
from November 2017 were divided by 38 (the maximum hours per week according to
Australian Fair Work Ombudsman182) to obtain a mean income per hour.
Missed childcare and missed activities
No unit costs needed to be obtained for these items as the value of any money lost due to
missed childcare or activities from the perspective of caretakers were directly reported by
parents/guardians.
Ambulance
A unit cost for an ambulance visit was obtained from the perspective of the public healthcare
system, as ambulance trips in Queensland incur no out-of-pocket costs for consumers. As the
Queensland Government does not publicly publish the cost of an ambulance trip, a unit cost
was estimated from data reported by the Australian Prudential Regulation Authority in their
report on Private Health Insurance Membership and Benefits during the quarter from April-
June 2017.183 This report presents statistics on the total amount of fees charged to people
with private health insurance as a result of ambulance trips, as well as the total number of
‘services’ (i.e. ambulance trips). An average cost per trip was calculated by dividing the total
fees charged by the total number of trips.
Miscellaneous items
No unit costs needed to be obtained for these items as their costs from the perspective of
caretakers were directly reported by parents/guardians. The most frequently reported
miscellaneous items were related to transport (e.g. petrol, taxi fares, parking fees) and
medical equipment (e.g. spacer, nebuliser, humidifier).

Chapter 3: Research Methods 95
3.5 DATA CLEANING AND ANALYSIS
This section covers some key aspects of data cleaning and analysis which are consistent across
all studies included in this thesis. These aspects are covered in detail here and are only
discussed briefly in Chapters 4-8 in order to avoid repetition. Study-specific methods of
analysis are described in Chapters 4-8 within each manuscript.
3.5.1 Data cleaning
Data cleaning describes the process by which a thorough examination of a dataset is
undertaken for the purpose of identifying and correcting missing and/or erroneous data.
Missing data can occur as a result of the failure to obtain the information from a study
participant or the failure to enter the data into the database. Similarly, an error may be made
when collecting the data or when entering the data electronically. An error may be accidental,
i.e. a ‘typo’, or may be a result of the study participant or research staff misunderstanding the
question.
The extent to which data cleaning is required post-data collection can be minimised
considerably in a number of ways during the data collection process. These include the use of
well-designed and piloted questionnaires, the use of well-trained research staff and the use
of sophisticated purpose-built databases which can be designed to pick up on missing and/or
erroneous data as they are entered. However, regardless of these processes, in studies where
research is being collected from humans and by humans, the complete elimination of missing
and/or erroneous data is impossible. Consequently, data cleaning is an essential step in the
research process between data collection and data analysis and was undertaken for each
study presented in this thesis.
Data cleaning included two key steps – (1) identifying missing and/or erroneous data and (2)
where possible, correcting missing and/or erroneous data.
1) The identification of missing and/or erroneous data was conducted primarily through Stata
MP Version 13 and Stata MP Version 15 (StataCorp, College Station, Texas). For each study,

96 Chapter 3: Research Methods
all variables that were required for the analyses were imported into Stata. Variables were
then checked one by one to identify missing and/or erroneous data. Missing data were
easily identified, as either the value of a variable was blank or the cell contained the
numeric value “99” (values used across all studies to represent missing) or the cell
contained the text value “Missing”. Erroneous data were more difficult to identify as it was
highly dependent on what variable was being examined. For example a value of “3” for a
variable about “the number of people living in a household” is reasonable, but the same
value of “3” for a variable about “the gestational age of the child in weeks” would suggest
that an error had been made during data collection or data entry. To identify potential
errors in the data, searches were made for extreme or invalid values within each variable
and for inconsistent or contradictory values between related variables. Extreme values
were values that fell outside the range that would be expected for that particular variable,
but were not implausible. For example the value of “12” for a question asking about “the
number of times a child had been to the ED for their cough in the past week” is not
implausible, but is unlikely. Invalid values were values that for whatever reason it was
certain the value was implausible. For example, the value of “10th November 2021” for
“the child’s date of birth” is not valid. Inconsistent or contradictory values may on their
own appear to be correct and reasonable, but when taken into account with values of
other variables, suggest an error has been made. For example, the response of “Yes” for a
question such as “has the child seen a GP for their cough in the past week?” is not missing,
extreme or invalid, and nor is the response of “No” for a question such as “has anyone
(parent, friend, sibling, other) spent time seeking healthcare for the child in the past
week?”. However, when taking both variables into account, it would suggest that an error
has been made for one of the variables.
2) Once participants and variables with potentially missing, extreme, invalid or
inconsistent/contradictory values were identified, efforts were made where possible to
confirm, and if required correct, these data. For each participant with potential missing
and/or erroneous data identified, hard-copy paper CRFs were retrieved and the data
recorded on these were compared to the data entered into the electronic database
(Filemaker Pro Version 14 [Filemaker Inc, Santa Clara, CA] or SPSS Version 25 [IBM Corp,
Chapter 3: Research Methods 97
Armonk, New York]). Evidently, missing data in the context of an unsuccessful follow-up
were not able to be amended through data cleaning. Where a response to a question had
been incorrectly entered (i.e. response in database differed from the response in the CRF)
or not entered at all, the response in the database was changed to match the response in
CRF. Where a response to a question had been correctly entered (i.e. response in database
matched the response in the CRF), the action taken depended on whether the response in
the CRF was valid, and consistent with responses to other questions. If the response in the
CRF was valid and consistent with responses to other questions, no changes were made to
either the CRF or the database. If the response in the CRF was not valid or was
contradictory to other responses, a decision was made with a study investigator on how
to proceed. Decisions were made about how to ‘correct’ data on an issue-by-issue basis,
but the same decision was applied to the same issue across all participants.
The correct procedure for making changes to CRFs was to put a clear, straight line through
the original response, write your initials and the date next to the change and, where
deemed necessary, include a brief explanation of the change and why it was required. For
changes made to responses in the database for the EDC and RICCi studies, a change log
was instigated to automatically track every change made to any variable. The change log
recorded the study participant identification number, the date and time of the change, the
variable name, the value of the initial entry, the value of the new entry, and the name of
the research staff who made the change. The creation of a change log was a result of the
lessons learned from the experience of data cleaning the first study (TLSIM), consequently
the TLSIM study did not have a change log. For the COBS study, it was not possible to
implement a change log given the data were entered into SPSS Version 25 (IBM Corp,
Armonk, New York) which does not allow for this. However, for both TLSIM and COBS a
copy of the original database and a database with changes made has been retained.
3.5.2 Descriptive analyses of characteristics of study population
For the TLSIM, RICCi and EDC studies, screening characteristics were described for all children
screened for enrolment, as well as those who were subsequently enrolled and those who

98 Chapter 3: Research Methods
were not enrolled. As all screening characteristics were categorical variables, they were
described using counts and proportions. Reasons for non-enrolment were also described
using counts and proportions. For all studies screening characteristics included: age of child
(in years as an integer) and sex of the child (male/female). Additional screening characteristics
included: recruitment site (for RICCi), triage category (for EDC studies) and season of
enrolment (for EDC studies and RICCi). Logistic regression analyses (both univariate and
multiple) were used to identify statistically significant differences in characteristics between
children enrolled and children not enrolled for each study.
For each study, a descriptive analysis of selected baseline characteristics was completed for
all enrolled children eligible for inclusion in my analyses. Counts and proportions were used
to describe categorical variables. Means and standard deviations (SD) or medians and
interquartile ranges (IQR) were used to describe continuous variables, depending on the
distribution of data.
Within the TLSIM, RICCi and EDC studies, comparisons of baseline characteristics were made
between sub-groups of participants. For the EDC QoL study, baseline characteristics were
compared between participants who completed the study and participants who were
withdrawn or lost-to-follow-up during the follow-up period. For the TLSIM study, baseline
characteristics were compared between participants who reported ≥1 ARIwC episode during
the study period and participants who reported no ARIwC episodes during the study period.
For both the TLSIM and EDC cost of illness studies, baseline characteristics were compared
between participants who completed all weekly follow-ups (and hence had complete data on
ARIwC-related resource use) and participants who had completed some or none of the weekly
follow-ups. For RICCi, baseline characteristics were compared between participants
randomised to the intervention and participants randomised to the usual care group. In all
comparisons of baseline characteristics between two groups, univariate or multiple logistic
regression analyses were used to identify statistically significant differences.
COBS was structured in such a way that, for many participants, baseline data were drawn
from research studies that participants had previously been enrolled in. As such, data that
Chapter 3: Research Methods 99
were no longer reliable due to the time-variant nature of the question were excluded from
analyses. Only those data which were deemed to still be valid, due to their invariance over
time, were included in the analysis; primarily those focusing on demographic and
bronchiectasis-related characteristics.
3.5.3 Statistical methods for dealing with missing data
Missing data are an ongoing and persistent occurrence in research, particularly research that
is highly dependent on repeated involvement from parents/guardians and families.
Throughout the four studies included in this thesis, the majority of data were collected
through direct contact with parents/guardians of children. Consequently, completeness of
data is dependent on the ability of the researcher to successfully make contact with a
parent/guardian within the specified time period. This is further dependent on the
researcher’s ability to remember to attempt contact within the specified time period and on
the parent’s/guardian’s ability to respond to the contact within the specified time period. On
the side of the researcher(s), this process is aided by user-friendly, accessible and ‘live’
systems of tracking when contact is due to be attempted and when contact has been
unsuccessful/successful. On the side of parent/guardians, this process is complicated by
parent/guardian comprehension of level of involvement, parent/guardian interest and
engagement in the study, competing responsibilities and demands on families, social and
child welfare circumstances and issues such as changing contact details. Methods of contact
that minimise the burden of both parents and researchers are ideal, but can be difficult when
they conflict (i.e. low burden on parents but high burden on researcher, and vice versa).
Research conducted with our team on a subset of participants in the RICCI study resulted in
the following key findings: (i) multiple contact attempts increased the chance of obtaining
complete data for a particular timepoint (of all successful contacts, 41% required 2 or 3
attempts) and (ii) each additional contact attempt resulted in approximately half as many
successful contacts as the previous attempt.184
In addition to the extent and pattern of missing data within a study, the mechanism behind
the missing data is important and can dictate the methods chosen to handle the missing
data.185 Mechanisms of missing data can be classified into three categories: missing
100 Chapter 3: Research Methods
completely at random (MCAR), missing at random (MAR), and missing not at random (MNAR).
MCAR refers to when the likelihood of a datum being missing is completely independent of
the values of any of the data, whether that be the data that are missing or any other data
present in the dataset. In these circumstances, there are no systematic differences in the
characteristics of those participants who have missing data and those who do not.185
Additionally, no values of the missing variable are more likely to be missing than others. When
data are MCAR, the occurrence of missing data is unlikely to bias analyses and results and
therefore complete case analysis – i.e. only analysing those participants with complete data
– may be a reasonable solution.185
MNAR refers to when the likelihood of a datum being missing is related to its own value, but
not necessarily related to the values of any other variables in the dataset.185 In this
circumstance some values of the missing variable are more likely to be missing than others.
Complete case analysis is likely to result in biased results when data are MNAR; sensitivity
analyses can be undertaken to explore the effect of these biases.186
MAR refers to when the likelihood of a datum being missing is related to the values of other
data in the dataset which are present. In this circumstance, there are systematic differences
in the characteristics of those participants who have missing data and those who do not.185
However, like MCAR, for data that are MAR, no values of the missing variable are more likely
to be missing than others. Complete case analysis is likely to result in biased results when data
are MAR as participants with missing data may be systematically different to participants
without missing data. Multiple imputation is a statistical tool that can be used to reduce the
bias which is associated with data that are MAR.186,187
Multiple imputation is a multiple-step process which first involves creating multiple copies of
the original dataset.186-188 In each new dataset, values are imputed in the place of the missing
values. Imputed values are estimated using an imputation model which may contain a
combination of variables that are associated with the occurrence of missing data as well as
variables associated with the value of the missing variables being imputed. This model
generates plausible values for each case of missing data, and randomly selects a value for
each new dataset. Multiple datasets are generated in order to introduce variability and

Chapter 3: Research Methods 101
account for uncertainty around the missing values. The main analysis for the study is then run
on each of the imputed datasets. Between each dataset there will be variations in the
estimates produced from the analysis due to the variability of the imputed values. As such,
statistical methods are employed to determine an average estimate across all imputed
datasets. The standard errors associated with these estimates take into account both the
variability within each dataset and across the datasets. Multiple imputation was used to
account for missing cost data in both the TLSIM and EDC cost of illness studies. Study-specific
details on the multiple imputation model and methods used are provided in their respective
chapters (Chapter 5 and Chapter 6).
3.6 SUMMARY
This chapter summarised the methods that have been used and applied within each of the
four studies included in this thesis, with the objective of answering the research questions of
this thesis as accurately as possible. Despite differences in designs, settings and populations,
there are a number of commonalities between the four studies, particularly with respect to
the measurement of cough outcomes and the valuation of costs. Methodological approaches
to statistical analysis and economic evaluation have been informed by established methods
described in the current scientific literature and applied within the contexts and parameters
of the studies and their design. Where possible, similar methodological approaches were
taken across all four studies in order to maximise comparability of findings. The
methodological limitations of each study were not discussed in this chapter, as they are
addressed in each of the Result chapters (Chapters 4-8) and in the Discussion (Chapter 9).

102 Chapter 4: Health-resource use and quality of life in children with bronchiectasis: a multi-centre pilot cohort study
Health-resource use and quality of life in children with bronchiectasis: a multi-centre pilot cohort study
This chapter reports on the analysis of data collected on health resource use, cough
characteristics and quality of life among children enrolled in the Cost of Bronchiectasis
study.
It comprises the following publication: Lovie-Toon YG, Grimwood K, Byrnes CA, Goyal V,
Busch G, Masters IB, Marchant JM, Buntain H, O’Grady KF, Chang AB. Health-resource use
and quality of life in children with bronchiectasis: a multi-center pilot cohort study. BMC
Health Services Research. 2019; 19(1):1-9. doi: 10.1186/s12913-019-4414-5.
This chapter addresses research question 1a and 1b: Among children aged <18 years with
non-cystic fibrosis (CF) bronchiectasis, attending tertiary paediatric respiratory clinics in
Australia and New Zealand, over a 12 month period: what is the frequency and types of
health-related resource use; and what is the child and parent’s quality of life, and do they
correlate?


QUT Verified Signature
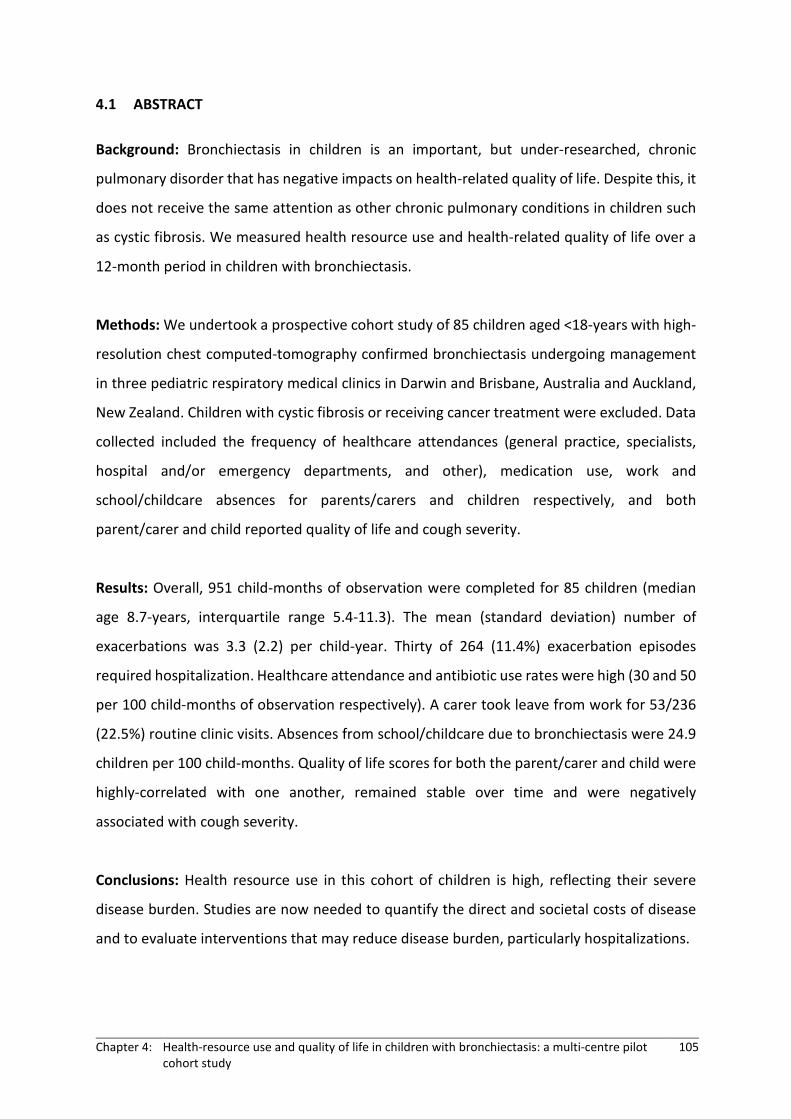
Chapter 4: Health-resource use and quality of life in children with bronchiectasis: a multi-centre pilot cohort study
105
4.1 ABSTRACT
Background: Bronchiectasis in children is an important, but under-researched, chronic
pulmonary disorder that has negative impacts on health-related quality of life. Despite this, it
does not receive the same attention as other chronic pulmonary conditions in children such
as cystic fibrosis. We measured health resource use and health-related quality of life over a
12-month period in children with bronchiectasis.
Methods: We undertook a prospective cohort study of 85 children aged <18-years with high-
resolution chest computed-tomography confirmed bronchiectasis undergoing management
in three pediatric respiratory medical clinics in Darwin and Brisbane, Australia and Auckland,
New Zealand. Children with cystic fibrosis or receiving cancer treatment were excluded. Data
collected included the frequency of healthcare attendances (general practice, specialists,
hospital and/or emergency departments, and other), medication use, work and
school/childcare absences for parents/carers and children respectively, and both
parent/carer and child reported quality of life and cough severity.
Results: Overall, 951 child-months of observation were completed for 85 children (median
age 8.7-years, interquartile range 5.4-11.3). The mean (standard deviation) number of
exacerbations was 3.3 (2.2) per child-year. Thirty of 264 (11.4%) exacerbation episodes
required hospitalization. Healthcare attendance and antibiotic use rates were high (30 and 50
per 100 child-months of observation respectively). A carer took leave from work for 53/236
(22.5%) routine clinic visits. Absences from school/childcare due to bronchiectasis were 24.9
children per 100 child-months. Quality of life scores for both the parent/carer and child were
highly-correlated with one another, remained stable over time and were negatively
associated with cough severity.
Conclusions: Health resource use in this cohort of children is high, reflecting their severe
disease burden. Studies are now needed to quantify the direct and societal costs of disease
and to evaluate interventions that may reduce disease burden, particularly hospitalizations.

106 Chapter 4: Health-resource use and quality of life in children with bronchiectasis: a multi-centre pilot cohort study
4.2 INTRODUCTION
Bronchiectasis is a chronic pulmonary disorder characterized by persistent wet or productive
cough, recurrent exacerbations and abnormal dilatation of bronchial airways.155 The
prevalence in children is highest in low-income countries and Indigenous populations69,189 and
the adverse impact on the child and carer’s quality of life (QoL) is increasingly recognised.190
Illnesses that consume extensive health resources attract the attention of policy makers and
funders.191 Consequently, the European Multicentre Bronchiectasis Audit and Research
Collaboration has recently identified healthcare utilisation as a research priority.192 However,
in children with bronchiectasis few studies describe its impact upon individuals and
healthcare services. The limited published data from Australia and New Zealand are derived
from hospital cohort studies96,126 or clinical trials,193 which cannot be generalized to out-
patient or community settings. While in New Zealand the estimated cost of pediatric
bronchiectasis hospitalizations was NZD 0.95 million in the 2012/13 financial year,96 there are
no similar published Australian data on healthcare service utilization or costs related to
bronchiectasis.
Thus, with the aim of informing government healthcare services and future research, our
primary objective was to estimate healthcare resource use over a 12-month period for
children aged <18-years with bronchiectasis receiving ongoing care in pediatric respiratory
medical centers. Our secondary objective was to measure and correlate the health-related
QoL of parents/carers and children with bronchiectasis.
4.3 METHODS
4.3.1 Study design
Eligible children with bronchiectasis were recruited from respiratory clinics in two Australian
(Brisbane and Darwin) and one New Zealand (Auckland) public hospitals between December
2012 and January 2016 and followed for 12-months. Inclusion criteria were aged <18-years,

Chapter 4: Health-resource use and quality of life in children with bronchiectasis: a multi-centre pilot cohort study
107
chest computed-tomography confirmed bronchiectasis and cared for by a respiratory
physician. Children with cystic fibrosis, enrolled in another study or receiving treatment for
cancer were excluded. Research nurses approached potential participants during routine
respiratory clinic appointments to obtain consent to participate.
4.3.2 Data collection
Demographic and bronchiectasis-related characteristics were collected upon enrolment.
Research nurses conducted monthly reviews by phone, email or in person, where they
recorded types of healthcare sought and school/childcare/work absences due to
bronchiectasis, as well as any medications taken and exacerbations in the previous month. An
exacerbation was defined as the child being unwell for ≥3-days with at least one of the
following symptoms: an increased cough, change in cough quality, or increased sputum
volume or purulence.26 This definition has been used in randomized controlled trials in
pediatric bronchiectasis.193,194 All exacerbations were reported by parent/carers who had
been instructed by research staff on the symptoms constituting the study definition of an
exacerbation. When an exacerbation was reported, additional information on resource use
for the exacerbation was collected from the parent/carer. All resource utilisation collected
through monthly reviews were parent-reported and not confirmed by other sources (e.g.
medical records). Face-to-face-clinical visits were scheduled quarterly in accordance with
routine clinical practice at the participating hospitals.
Parent/carer-reported and/or child-reported QoL and cough severity were assessed using
validated tools at baseline and at months 3, 6, 9 and 12. These data were collected either
face-to-face at clinic visits, or through telephone interviews. Parent/carers completed the
Parent Cough-specific QoL questionnaire (PC-QoL)119 and children aged >7-years completed
the Child Cough-specific QoL questionnaire (CC-QoL).120 In both tools, the QoL scores range
from 1 (low QoL) to 7 (high QoL). Cough severity was measured using a cough score (0=no
cough to 5=severe cough and cannot perform usual activities).41

108 Chapter 4: Health-resource use and quality of life in children with bronchiectasis: a multi-centre pilot cohort study
4.3.3 Sample size
As this was a pilot study, a specific sample size was not calculated. The target enrolment was
100 children, to achieve a complete dataset on 80 children.
4.3.4 Data analysis
Baseline demographic and bronchiectasis-related characteristics were analyzed descriptively
and expressed as counts and proportions, means (standard deviation [SD]) or medians (inter-
quartile range [IQR]). Resource use was summarized as the number and proportion of
children reporting each type of resource use in the past month, during exacerbations, and at
routine clinic visits. Rates of resource use over the 12-months were calculated as the number
of children using a particular resource per 100 child-months of observation. Exacerbation-
related resource use was summarized for all exacerbations and by season of exacerbation
onset. Season of exacerbation onset was categorized as spring (September–November),
summer (December–February), autumn (March–May), and winter (June–August) using date
of exacerbation onset. Parent/carer and child-reported QoL was summarized by each clinical
visit. The Pearson or Spearman correlation coefficients were used to analyze relationships
between parent- and child-reported QoL, parent- and child-reported cough severity, and
parent- and child-reported QoL against parent- and child-reported cough severity.
4.4 RESULTS
4.4.1 Participant baseline characteristics
The target of 100 enrolled children was reached. The data for 15 were considered too
unreliable for meaningful analysis, due to reporting errors or situations where study
procedures had not been followed. These participants were subsequently excluded.
The 85 children (42 female, 34 Indigenous Australian/New Zealand subjects) were recruited
from the Queensland Children’s Hospital (n=47), Auckland Starship Children’s Hospital (n=26)
and Royal Darwin Hospital (n=12). The median age at enrolment was 8.7 (IQR 5.4–11.3) years
and their median age at diagnosis of bronchiectasis was 3.6 (IQR 2.1–6.5) years. The median

Chapter 4: Health-resource use and quality of life in children with bronchiectasis: a multi-centre pilot cohort study
109
time since diagnosis was 2.9 (IQR 1.7–6.1) years with a mean of 2.6 (SD 1.1) lobes affected.
The primary etiology was post-infectious (n=51), followed by idiopathic (n=14), aspiration
(n=7) and other (n=13).
4.4.2 Monthly reviews
Overall, 951 monthly follow-up reviews were completed over the study period. Completions
declined over the 12-months (Table 4.1). There was a greater proportion of children aged <5
years, with a low birthweight (<2500 grams) and who were born pre-term (gestational age
<37-weeks) among participants who completed all 12-monthly follow-ups, compared to
participants who did not (Appendix D, Table D3). On average, within the cohort 30
children/100-months of observation attended a general practitioner (GP), emergency
department (ED) or pediatric specialist physician for their bronchiectasis, while the
corresponding rate for other health reasons was 17 children/100-months. The number of
attendances per child per month was not collected. More children presented to a specialist
for their management than GPs, and EDs were used infrequently. In any given month, over
half of the children were taking some form of medication. Medication use was not specified
for bronchiectasis only, and the number of courses used per month was not collected.
In any given month, approximately one-quarter of children within the cohort missed some
period of school or childcare due to their bronchiectasis; fewer parents/carers missed work.
The median number of days missed per child-month ranged from 2.5 (IQR 1.0–4.0) to 4.0 (IQR
2.0–7.0).
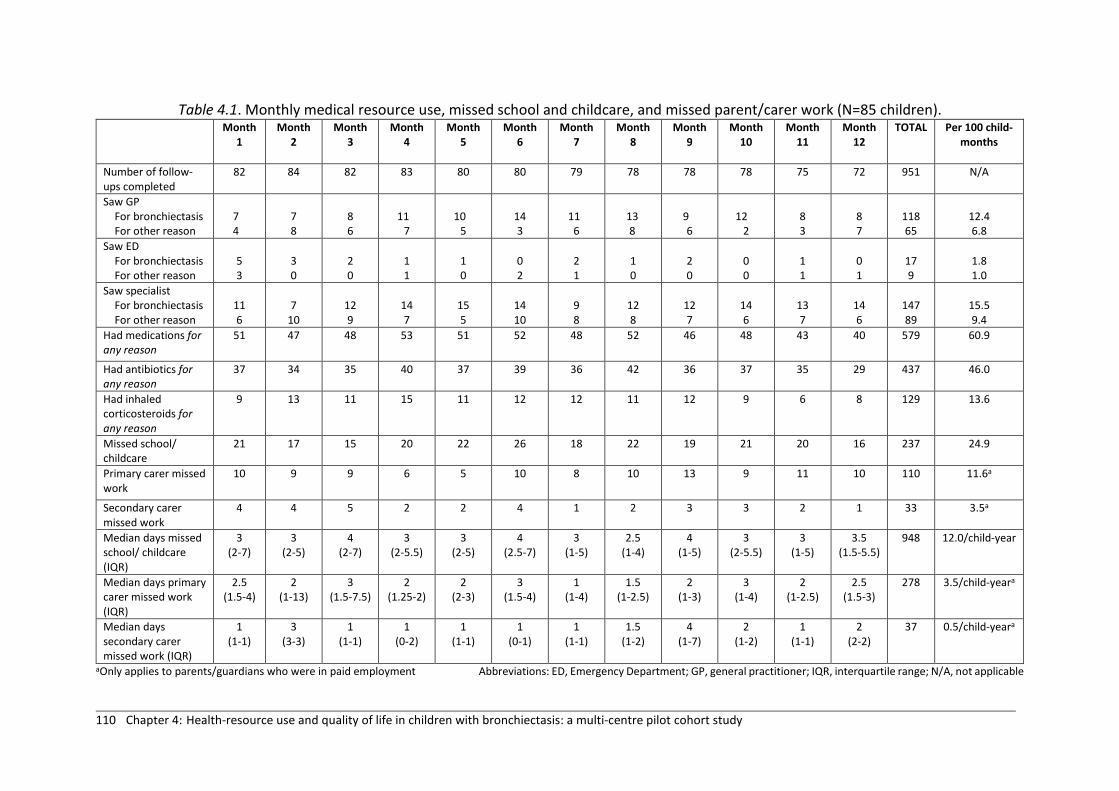
110 Chapter 4: Health-resource use and quality of life in children with bronchiectasis: a multi-centre pilot cohort study
Table 4.1. Monthly medical resource use, missed school and childcare, and missed parent/carer work (N=85 children).
aOnly applies to parents/guardians who were in paid employment Abbreviations: ED, Emergency Department; GP, general practitioner; IQR, interquartile range; N/A, not applicable
Month 1
Month 2
Month 3
Month 4
Month 5
Month 6
Month 7
Month 8
Month 9
Month 10
Month 11
Month 12
TOTAL
Per 100 child-months
Number of follow-ups completed
82 84 82 83 80 80 79 78 78 78 75 72 951 N/A
Saw GP For bronchiectasis For other reason
7 4
7 8
8 6
11
7
10
5
14 3
11
6
13 8
9 6
12
2
8 3
8 7
118 65
12.4 6.8
Saw ED For bronchiectasis For other reason
5 3
3 0
2 0
1 1
1 0
0 2
2 1
1 0
2 0
0 0
1 1
0 1
17 9
1.8 1.0
Saw specialist For bronchiectasis For other reason
11 6
7
10
12 9
14 7
15 5
14 10
9 8
12 8
12 7
14 6
13 7
14 6
147 89
15.5 9.4
Had medications for any reason
51 47 48 53 51 52 48 52 46 48 43 40 579 60.9
Had antibiotics for any reason
37 34 35 40 37 39 36 42 36 37 35 29 437 46.0
Had inhaled corticosteroids for any reason
9 13 11 15 11 12 12 11 12 9 6 8 129 13.6
Missed school/ childcare
21 17 15 20 22 26 18 22 19 21 20 16 237 24.9
Primary carer missed work
10 9 9 6 5 10 8 10 13 9 11 10 110 11.6a
Secondary carer missed work
4 4 5 2 2 4 1 2 3 3 2 1 33 3.5a
Median days missed school/ childcare (IQR)
3 (2-7)
3 (2-5)
4 (2-7)
3 (2-5.5)
3 (2-5)
4 (2.5-7)
3 (1-5)
2.5 (1-4)
4 (1-5)
3 (2-5.5)
3 (1-5)
3.5 (1.5-5.5)
948 12.0/child-year
Median days primary carer missed work (IQR)
2.5 (1.5-4)
2 (1-13)
3 (1.5-7.5)
2 (1.25-2)
2 (2-3)
3 (1.5-4)
1 (1-4)
1.5 (1-2.5)
2 (1-3)
3 (1-4)
2 (1-2.5)
2.5 (1.5-3)
278 3.5/child-yeara
Median days secondary carer missed work (IQR)
1 (1-1)
3 (3-3)
1 (1-1)
1 (0-2)
1 (1-1)
1 (0-1)
1 (1-1)
1.5 (1-2)
4 (1-7)
2 (1-2)
1 (1-1)
2 (2-2)
37 0.5/child-yeara

Chapter 4: Health-resource use and quality of life in children with bronchiectasis: a multi-centre pilot cohort study
111
4.4.3 Exacerbations
Overall, 276 bronchiectasis exacerbations were reported (mean 3.3 [SD 2.2] per child-year).
Twelve episodes had missing data for resource use associated with the exacerbation, leaving
264 for analysis (Table 4.2). Of these, 59 (22%) began in spring, 54 (20%) in summer, 62 (23%)
in autumn, and 82 (31%) began in winter, while for 7 (3%) onset season was unknown. Overall
when looking solely at exacerbations, GPs were the most frequently used healthcare
resource. Thirty episodes resulted in hospitalization; 20/264 (7.6%) were treated exclusively
in hospital (mean stay 6.7 [SD 4.8] days), while 10/264 (3.8%) had “hospital-in-the-home”
following their inpatient stay (mean length of care 9.0 [SD 2.4] days). Parents reported they
had antibiotics at home (or a prescription to fill) in approximately one-third of exacerbations.
A bronchoscopy was performed on one occasion. The frequency of resource use varied by
season, however variations were inconsistent between different types of healthcare resource
use. Frequency of use was highest during spring for GPs and specialists, highest during
summer for hospitalizations, and highest during winter for antibiotic consumption.

112 Chapter 4: Health-resource use and quality of life in children with bronchiectasis: a multi-centre pilot cohort study
Table 4.2. Exacerbation-related resource use, total and by seasona.
All, n=264 Spring, n=59 Summer, n=54 Autumn, n=62 Winter, n=82 n (%) n (%) n (%) n (%) n (%) General practitioner visit 123 (46.6) 30 (50.9) 26 (48.2) 28 (45.2) 35 (42.7) Had a prescription at home to fill/had antibiotics at home 77 (29.2) 15 (25.4) 16 (29.6) 16 (25.8) 28 (34.2) Specialist visit 69 (26.1) 20 (33.9) 12 (22.2) 15 (24.2) 22 (26.8) Physiotherapy 41 (15.5) 7 (11.9) 9 (16.7) 10 (16.1) 13 (15.9) Telephone advice from respiratory clinic nurse 32 (12.1) 4 (6.8) 3 (5.6) 12 (19.4) 12 (14.6) Pathology
Haematology (full blood count) Biochemistry Sputum culture Antibiotic blood levels Throat swab for virus nucleic acid amplification testing Nasopharyngeal aspirate for virus nucleic acid amplification testing Bronchoalveolar lavage Immunology (radioallergoabsorbent test) Missing
30 (11.4) 15 10
9 4 3 1 1 1 4
4 (6.8) 4 4 1 0 0 0 0 0 0
9 (16.7) 4 3 3 3 1 0 0 0 0
9 (14.5) 5 3 4 1 2 0 0 1 0
8 (9.8) 2 0 1 0 0 1 1 0 4
In-patient hospital admission Had ‘hospital in the home’ following inpatient admission
30 (11.4) 10
4 (6.8) 0
8 (14.8) 4
9 (14.5) 3
8 (9.8) 2
Emergency department presentation 25 (9.5) 3 (5.1) 5 (9.3) 6 (9.7) 9 (11.0) Medical imaging
Chest radiograph Chest computed tomography scan Other Missing
21 (8.0) 14
2 7 2
2 (3.4) 1 0 1 0
5 (9.3) 4 1 1 0
5 (8.1) 3 0 2 0
9 (11.0) 6 1 3 1
Respiratory function testing (spirometry) 16 (6.1) 4 (6.8) 3 (5.6) 4 (6.5) 5 (6.1) Saw other services (during hospitalisation)
Social worker Dietician Occupational therapist Cardiologist
12 (4.6) 4 3 1 1
3 (5.1) 1 1 0 0
1 (1.9) 1 0 0 0
3 (4.8) 2 1 0 0
5 (6.1) 0 1 1 1

Chapter 4: Health-resource use and quality of life in children with bronchiectasis: a multi-centre pilot cohort study 113
Surgical Consult liaison Dentist Missing
1 1 1 1
1 1 0 0
0 0 0 0
0 0 0 0
0 0 1 1
Over the counter treatments 8 (2.9) 1 (1.7) 2 (3.7) 4 (6.5) 1 (1.2) Consultation with community health nurse / respiratory clinic nurse
7 (2.7) 1 (1.7) 1 (1.9) 3 (3.2) 3 (3.7)
Hospital school (during hospitalisation) 7 (2.7) 2 (3.4) 0 (0.0) 3 (4.8) 2 (2.4) Other procedures
Bronchoscopy Scheduled intravenous line maintenance
2 (0.8) 1 1
0 (0.0) 0 0
1 (1.9) 1 0
0 (0.0) 0 0
1 (1.2) 0 3
Telephone advice from other doctor/specialist 2 (0.8) 1 (1.7) 0 (0.0) 0 (0.0) 1 (1.2) Alternative therapies
Glutathione nebulised medication Acupuncture Chinese medicine
2 (0.8) 1 1 1
1 (1.7) 1 0 0
0 (0.0) 0 0 0
0 (0.0) 0 0 0
1 (1.2) 0 1 1
Telephone advice from general nurse 1 (0.4) 0 (0.0) 0 (0.0) 1 (1.6) 0 (0.0) aThere were 7 exacerbations with unknown start dates, and therefore onset season could not be determined.
114 Chapter 4: Health-resource use and quality of life in children with bronchiectasis: a multi-centre pilot cohort study
4.4.4 Clinic visits
Most children (77/85) completed a clinic visit at baseline. Approximately half of the cohort
completed clinic visits and the corresponding questionnaire at the four subsequent time-
points (Table 4.3). Consultant respiratory physicians were the most common clinicians
present at the review (192/236; 81.4%), while respiratory function testing (154/236; 65.3%)
and physiotherapy (85/236; 36.0%) were the most frequently used additional clinical services.
Parents/carers took leave from work to attend the appointment in 53/236 (22.5%) clinic visits.

Chapter 4: Health-resource use and quality of life in children with bronchiectasis: a multi-centre pilot cohort study 115
Table 4.3. Resource use at quarterly clinic visits. Baseline
N=77 Month 3
N=40 Month 6
N=48 Month 9
N=36 Month 12
N=35 Total
N=236 Visit details
Consultant Respiratory Physician 58 31 40 30 33 192 (81.4) Respiratory Fellow (advanced trainee) 17 7 5 3 1 33 (14.0) Nurse 2 2 3 3 1 11 (4.7)
Additional clinical services utilised Respiratory Function testing 51 25 26 26 26 154 (65.3) Physiotherapy 27 17 16 14 11 85 (36.0) Other allied health 7 5 4 3 0 19 (8.1) Respiratory nurse consultant 22 14 12 7 7 62 (26.3) Pharmacy - Prescription filled 23 14 12 11 7 67 (28.4) Pathology 11 7 8 4 5 35 (14.8) Medical Imaging 3 2 1 3 2 11 (4.7) Box study or exercise challenge 0 1 0 2 1 4 (1.7) Other consults 3 7 3 3 2 18 (7.6)
Healthcare carda Yes 60 30 37 25 29 181 (76.7) No 15 9 10 9 6 49 (20.8) Missing 2 1 1 2 0 6 (2.5)
Private health insurance Yes 23 13 15 15 9 75 (31.8) No 50 26 31 18 26 151 (64.0) Missing 4 1 2 3 0 10 (4.2)
Primary carer required to take leave to attend clinic appointment
Sick/care's leave taken 10 2 5 6 3 26 (11.0) No leave required 27 14 21 11 15 88 (37.3) Unpaid leave taken 7 0 2 4 2 15 (6.4)

116 Chapter 4: Health-resource use and quality of life in children with bronchiectasis: a multi-centre pilot cohort study
Not in paid employment 25 11 12 5 8 61 (25.9) Did not attend 3 0 1 3 2 9 (3.8) Other 4 4 3 3 3 17 (7.2) Missing 1 9 4 4 2 20 (8.5)
Secondary carer required to take leave to attend clinic appointment
Sick/care's leave taken 3 1 2 2 2 10 (4.2) No leave required 7 2 1 3 2 15 (6.4) Unpaid leave taken 1 1 0 0 0 2 (0.9) Not in paid employment 1 1 0 2 0 4 (1.7) Did not attend 41 15 16 13 16 101 (42.8) Other 1 1 0 1 0 3 (1.3) Missing/NA 23 19 29 15 15 101 (42.8)
Additional carer required to take leave to attend clinic appointment
No leave required 1 0 0 0 0 1 (0.4) Not in paid employment 1 0 0 0 0 1 (0.4) Did not attend 5 2 3 0 0 10 (4.2) Missing/NA 70 38 45 36 35 224 (94.9)
aA healthcare card is a government-issued card, which provides the cardholder with access to additional subsidies for medicines and/or healthcare services within the public healthcare system. Healthcare cards are issued to individuals who meet certain social and/or economic criteria.

Chapter 4: Health-resource use and quality of life in children with bronchiectasis: a multi-centre pilot cohort study
117
4.4.5 Quality-of-life and cough severity
Similar to clinic visits, QoL and cough severity questionnaire completions were high
at baseline, but decreased at subsequent time-points (Table 4.4). Whether the child
was experiencing an exacerbation at the time the QoL and cough severity
questionnaires were completed was not recorded. Median parent/carer and child
QoL scores were consistent across all time-points (Table 4.4). Parent/carer scores
ranged from 5.9 (IQR 4.3–6.8) to 6.5 (IQR 5.4–6.9) and child scores ranged from 6.1
(IQR 4.5–6.7) to 6.8 (IQR 5.0–7.0). Median parent/carer and child-reported cough
severity scores ranged from 1.0 (IQR 0.0-2.0) to 2.0 (IQR 0.0-2.0) and from 1.0 (IQR
0.0-2.0) to 2.0 (IQR 0.5-2.5), respectively (Appendix D, Table D1).
Table 4.4. Parent and child-reported cough quality-of-life (QoL) at time of clinic visits.
Parent Cough-QoL (N=85)
Child Cough-QoL
Number completed
Median (IQR)
Number of eligible children (aged >7-years)
Number completed
Median (IQR)
Baseline 72 6.0 (4.7-6.9)
49 35 6.5 (4.9-7.0)
Month 3 41 6.5 (5.4-6.9)
51 20 6.1 (4.5-6.7)
Month 6 55 5.9 (4.3-6.8)
54 25 6.4 (4.3-7.0)
Month 9 46 5.9 (4.9-7.0)
57 19 6.6 (3.3-6.9)
Month 12 47 5.9 (4.7-7.0)
57 26 6.8 (5.0-7.0)
Abbreviations: IQR, interquartile range
Whilst small numbers of participants completed both PC-QoL and CC-QoL
questionnaires at each time-point (Appendix D, Table D2), there were high and
significant positive correlations between parent/carer and child QoL scores at each
time-point (p-values <0.002). There were also high positive correlations between
parent-reported and child-reported cough severity scores. High negative
correlations were observed between child-reported cough severity and QoL scores
118 Chapter 4: Health-resource use and quality of life in children with bronchiectasis: a multi-centre pilot cohort study
at each time-point and between parent/carer-reported cough severity and QoL
scores.
4.5 DISCUSSION
Here, we described the annual health resource use and parent/carer and child QoL
scores in children with bronchiectasis managed at two Australian and one New
Zealand hospitals. In this cohort, children averaged three exacerbations per annum.
In any given month, approximately one-third of the cohort presented for medical
care, half used antibiotics and one-quarter had absences from school or childcare.
Parents/carers sought medical care from a specialist more frequently than GPs or
EDs, except during exacerbations. While exacerbations were more frequent in winter,
seasonal frequency of exacerbation-related resource use varied between types of
resource use. Eleven-percent of exacerbations resulted in hospitalization, and in one-
third this included subsequent “hospital-in-the-home” care. Although over time QoL
scores for both parents/carers and children were high and stable, better QoL was
significantly associated with low cough severity.
There are limited published Australian or New Zealand data on health-related
resource use in children or adults with bronchiectasis with which to compare our
findings. Redding et al.67 reported that among Indigenous Australian and Alaskan
children aged <8-years, 15% of exacerbations resulted in hospitalization, which is
similar to the findings of this study.67 In the general Australian child population GP
attendance was 3.8 visits/year per child between 2012–2015,195 with acute
respiratory illness (ARI) the most common reason for presentation. In a cohort of
urban Indigenous children aged <5-years, health service utilisation for ARI was 3.6
visits per child-year82 with an annual mean cost in 2017 Australian dollars of $991
(95% confidence interval 514, 1468) per child.196 Thus children with bronchiectasis
are seeking healthcare as frequently as young children with common ARIs and, given
the predominance of specialist reviews and hospitalizations, the annual cost of
bronchiectasis in children is likely to be substantially higher.

Chapter 4: Health-resource use and quality of life in children with bronchiectasis: a multi-centre pilot cohort study
119
Antibiotic use is high in this cohort, although some may be associated with long-term
maintenance courses, such as with azithromycin, rather than additional prescriptions
for new exacerbations each month. Nevertheless, the prescription rate of 46.0 per
100 child-months (or 552 per 100 child-years) in this cohort is much higher than the
antibiotic prescription rate of 41.4 per 100 child-years that was reported for all
Australian children aged 0–12 years in 2013.197 Of all Australian children dispensed
antibiotics for systemic use in 2013, 53% received one systemic antibiotic course, 22%
received two, 11% had three and the remainder received four or more. In New
Zealand, during 2010-2014, the mean number of antibiotic courses dispensed to
children aged <6-years approximated 190 per 100 child-years, with dispensing rates
29-35% higher among Maori/Pacific Islanders compared to New Zealand European
children.198 The higher frequency of antibiotic use among exacerbations during
winter that was identified in this study is consistent with overall trends of antibiotics
prescribing to Australian children in primary care settings.199
In any given month, one-quarter of the children in the cohort missed school or
childcare due to their bronchiectasis. In a recent study of Alaskan Native children
aged 7–17 years with bronchiectasis, 15/34 missed school in the previous 12-months
because of respiratory illnesses.66 A systematic review of social and economic
consequences of childhood asthma200 reported children with asthma were absent
from school for 2.1–14.8 days per year. This compares with an average 12-days per
child-year in our study. Chronic school absenteeism is associated with suboptimal
school achievement,201 which can lead to long-term social and economic
disadvantage. Children with chronic illness often demonstrate worse school
outcomes than their peers without chronic illness.202 Furthermore, parents/carers
frequently take time from work to care for their child, resulting in lost productivity
and income.
The overall high QoL and low cough scores we observed are not surprising given that
they were obtained during routine clinical visits, as found in another Brisbane study
reporting similar QoL scores for children in a stable state.126 Our finding that both PC-

120 Chapter 4: Health-resource use and quality of life in children with bronchiectasis: a multi-centre pilot cohort study
QoL and CC-QoL scores were negatively associated with cough severity is consistent
with PC-QoL significantly declining during exacerbations.126
This study has several limitations. As all symptom and resource use data were parent-
reported and data were collected on a monthly basis, there is a potential for
parent/guardian misclassification and recall bias respectively. Future studies could
reduce the risk of recall bias, and improve the accuracy of findings, by using medical
records to confirm parent-reported data and/or having more frequent follow-up.
With respect to the representativeness of the study sample; the differences in
baseline characteristics between those participants who completed all monthly
follow-ups, and those who did not, suggest that younger children and children with
poor birth outcomes were over-represented among the data obtained. Redding et
al.67 reported that among Indigenous children with bronchiectasis, younger children
(aged <3-years) were more likely to be hospitalized than older children. Poor birth
outcomes are recognized risk factors for respiratory disease57 and it is plausible that
poor birth outcomes may be associated with higher resource use as a result of earlier
and more severe respiratory disease.
The study was conducted in three centers where quarterly clinical reviews are
standard care and where the relationship between clinicians and their patients is such
that families have ongoing access to advice and support when needed. Hence our
findings may apply only to centers with similar practices. Furthermore, whilst the
clinical characteristics of our children are similar to other bronchiectasis studies
conducted in the same study centres,193 the study findings may not be generalisable
to children with bronchiectasis elsewhere70,203 given reported differences in clinical
presentations and underlying etiology. Nevertheless, as shown in Table 4.3, the
attendance at scheduled visits following enrolment was only about 50% for reasons
that are uncertain. It may reflect visits that were scheduled when the child was well
and the parent/carer did not consider attendance necessary and/or the competing
demands of families with respect to work and school, a concern reported by New
Zealand mothers of children with bronchiectasis.204 The small number of
parents/carers and children who completed QoL and cough severity questionnaires
Chapter 4: Health-resource use and quality of life in children with bronchiectasis: a multi-centre pilot cohort study
121
is likely to have biased our findings, particularly as most questionnaires were
completed at clinic visits. It is plausible that the QoL of parents/carers and children
who regularly attend scheduled visits and receive ongoing specialist care may be
better than those who do not.68 Alternatively, those not attending may have milder
disease. Finally, the tool used to measure cough severity has been reported to have
some limitations with respect to its correlation with cough frequency. However there
are few other validated tools for assessing cough severity in children205 and this tool
has been used repeatedly in other paediatric respiratory studies, enabling
comparisons to be made between studies.34,206,207
4.6 CONCLUSION
To our knowledge, this study is the first to provide disease burden estimates by
measuring healthcare resource use for managing pediatric bronchiectasis. It suggests
resource use is substantial. Further research is needed to more precisely estimate the
cost of disease to families, the healthcare sector and third parties in a broader
population of children with bronchiectasis. Such data are critical for informing policy
and designing and evaluating interventions to reduce the burden of disease.

122 Chapter 4: Health-resource use and quality of life in children with bronchiectasis: a multi-centre pilot cohort study

Chapter 5: The cost of acute respiratory infections with cough among urban Aboriginal and Torres Strait Islander children
123
The cost of acute respiratory infections with cough among urban Aboriginal and Torres Strait Islander children
This chapter reports on the analysis of data collected on resource use to determine
cost of ARIwC among Indigenous Australian children enrolled in the Tooth and Lung
Sickness in Murri Kids study.
It comprises the following published paper: Lovie-Toon YG, McPhail SM, Au-Yeung
YT, Hall KK, Chang AB, Vagenas D, Otim ME, O'Grady KF. The cost of acute respiratory
infections with cough among urban Aboriginal and Torres Strait Islander children.
Frontiers in Pediatrics. 2018;6. doi: 10.3389/fped.2018.00379
In combination with chapter 6, this chapter addresses research question 2a, 2b and
2c: Among Indigenous and non-Indigenous Australian children aged <15 years
presenting to primary healthcare clinics and/or emergency departments (EDs) with
acute respiratory infection with cough (ARIwC): what is the economic burden to
caretakers, the public healthcare system and third parties; is the economic burden
greater among episodes in which cough persists for four consecutive weeks (chronic
cough) compared to episodes in which cough resolves within four consecutive weeks
(acute or sub-acute cough); and what child, family and illness-related characteristics
are associated with a greater economic burden of illness?


QUT Verified Signature

126 Chapter 5: The cost of acute respiratory infections with cough among urban Aboriginal and Torres Strait Islander children
5.1 ABSTRACT
Introduction: Acute respiratory infections with cough (ARIwC) contribute
considerably to childhood morbidity, yet few studies have examined the cost of these
illnesses among Australian children. Moreover, of the few studies that have, none are
inclusive of Indigenous Australian- children, despite this population experiencing a
greater burden of respiratory illnesses. This study aimed to determine the costs of
ARIwC among urban Aboriginal and/or Torres Strait Islander children from the
perspective of caretakers, the public healthcare system and employers.
Methods: This cost of illness study used data collected from Aboriginal and/or Torres
Strait Islander children aged <5 years enrolled in a 12 month prospective cohort study
conducted through an urban primary healthcare clinic in Queensland, Australia.
Illness-related resource use was collected for each episode of ARIwC reported, and
costed at market rates. Linear regression was used to (a) examine cost per episode
by season of illness onset and cough duration and b) examine cost per month of
observation by baseline child and family characteristics.
Results: During the study period, a total of 264 episodes of ARIwC were reported
among 138 children. The total mean cost was estimated to be $AU252 per non-
hospitalized episode (95% CI 169, 334). Caretakers, the public healthcare system and
employers incurred 44, 39 and 17% of costs per episode, respectively. After
accounting for months of completed follow-ups, the total mean cost per child per
year was estimated to be $991 (95% CI 514, 1468). Winter episodes and episodes
resulting in chronic cough were associated with significantly higher costs per episode.
A prior history of wheezing, connections to traditional lands and parent/guardian
belief that antibiotics should be given until symptoms resolved were associated with
significantly higher cost per child month of observation.
Conclusion: The cost of ARIwC in this predominantly disadvantaged population is
substantial, particularly for caretakers and this needs to be considered in both clinical
management and public health initiatives. The importance of cultural factors on

Chapter 5: The cost of acute respiratory infections with cough among urban Aboriginal and Torres Strait Islander children
127
health and burden of illness should not be overlooked. Further research into the
prevention of chronic cough may play an important role in reducing the economic
burden of pediatric respiratory infections.

128 Chapter 5: The cost of acute respiratory infections with cough among urban Aboriginal and Torres Strait Islander children
5.2 INTRODUCTION
Acute respiratory infections (ARIs) are leading causes of childhood morbidity
worldwide.208 Australian children typically experience between 2 and 7 ARI episodes
annually,16,51,53,55 the majority of which are managed by families and primary
healthcare services.53,55 Cough, a common symptom of both acute and chronic
respiratory illnesses, consistently remains among the most frequent reasons parents
seek healthcare for their children.209 The symptom of cough often persists longer
than other symptoms associated with ARI such as runny nose and fever15,27,28 and
children with persistent cough report high use of healthcare services.84 ARIs with
cough (ARIwC) are of particular interest as they are more likely to reflect lower airway
involvement. This is especially true when the cough is wet and prolonged, which may
be associated with an increased risk of chronic lung illnesses in later ages.210
Despite the burden of childhood ARI to families and health services, there is a paucity
of Australian and international studies comprehensively examining the economic
burden of ARIs among non-hospitalized cohorts. Three Australian studies have sought
to estimate the cost of a non-hospitalized ARI episode among young children97,106,107;
two of these were conducted over 14 years ago.106,107 The first study estimated the
mean cost per episode to be $AU309 (2001-2002 financial year),106 the second to be
$AU241 (2003),107 and the third to be $AU626 (2010).97 While all three studies stated
they were conducted from a societal perspective, there are variations in what and
how items were costed. The common focus of these studies was on (a) episodes of
viral ARIs, particularly influenza and influenza-like-illness (ILI), through the use of
specific ILI case-definitions, and b) on children attending childcare centers and/or
urban mainstream child and maternal health services. Consequently, these studies
largely exclude bacterial respiratory infections, and disproportionately include non-
Indigenous Australian children from high socioeconomic backgrounds.
Among Aboriginal and/or Torres Strait Islander Australian children the burden of
respiratory illnesses is considerably greater compared to non-Indigenous Australian
children.211 ARIs are the main reason healthcare is sought for Aboriginal and/or

Chapter 5: The cost of acute respiratory infections with cough among urban Aboriginal and Torres Strait Islander children
129
Torres Strait Islander children aged ≤5 years in both urban82 and remote79
communities. Furthermore, parents and carers of Aboriginal and/or Torres Strait
Islander children with chronic respiratory illnesses report being worried and
concerned about preventing and managing their child’s illness given their lack of
economic resources.212 To date, no cohort studies have estimated the economic
burden of ARIs outside of the hospital setting among Aboriginal and/or Torres Strait
Islander children. National data has estimated that hospitalization expenditure for
ARIs in 2010-2011 was 3.1 times greater among all Aboriginal and/or Torres Strait
Islander Australians than non-Indigenous Australians ($AU184 vs. $AU59 per-
person).130 These values likely underestimate the economic burden, as costs to
caretakers and third parties were not included.130 Furthermore, these findings give
no indication of expenditure on ARIs outside of the hospital setting.
Thus, this study aimed to determine the costs of ARIwC among urban Aboriginal
and/or Torres Strait Islander children from the perspective of caretakers (Table 5.1),
the public healthcare system and employers. The objectives were to (a) estimate the
total cost of ARIwC per episode, per child-month of observation and per child-year
(b) examine the distribution of costs incurred between the three sectors, (c) examine
the influence of cough duration and season of illness onset on cost per episode and
(d) examine the association between baseline child/family characteristics and cost
per month of observation.
5.3 METHODS
A glossary including terms related to the cost perspective, Australian healthcare
system, and Aboriginal and/or Torres Strait Islander peoples and communities, is
provided in Table 5.1.
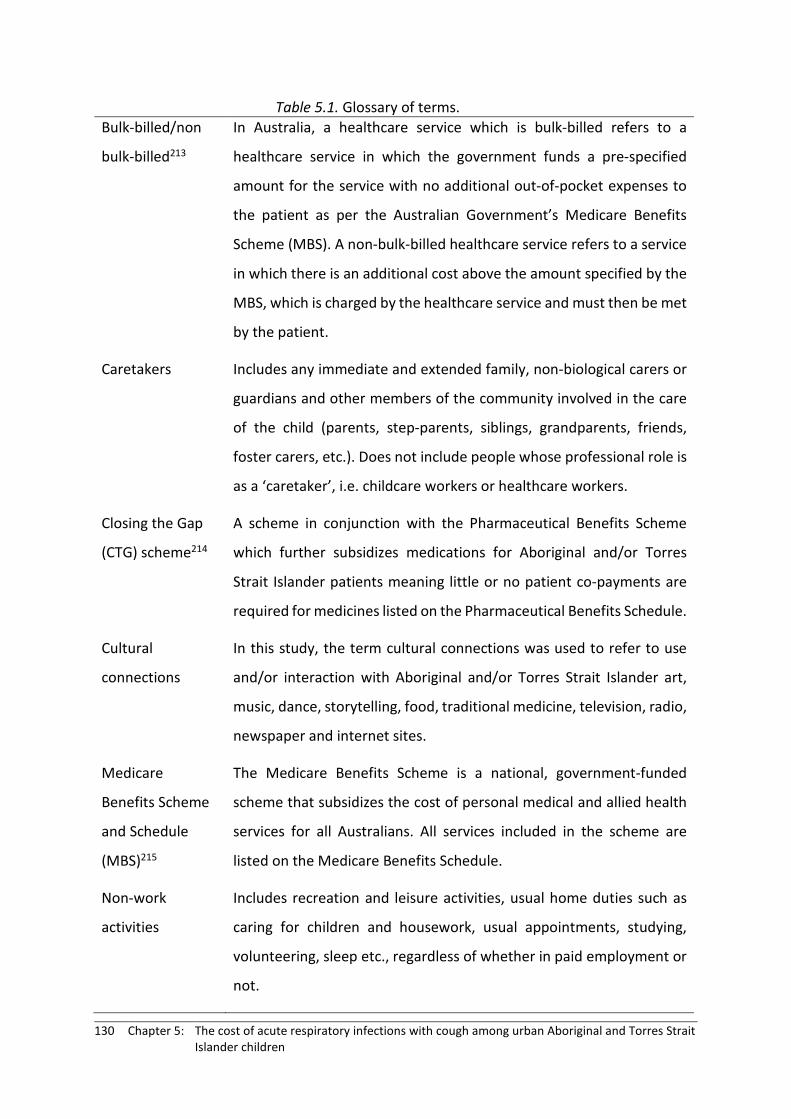
130 Chapter 5: The cost of acute respiratory infections with cough among urban Aboriginal and Torres Strait Islander children
Table 5.1. Glossary of terms. Bulk-billed/non
bulk-billed213
In Australia, a healthcare service which is bulk-billed refers to a
healthcare service in which the government funds a pre-specified
amount for the service with no additional out-of-pocket expenses to
the patient as per the Australian Government’s Medicare Benefits
Scheme (MBS). A non-bulk-billed healthcare service refers to a service
in which there is an additional cost above the amount specified by the
MBS, which is charged by the healthcare service and must then be met
by the patient.
Caretakers
Includes any immediate and extended family, non-biological carers or
guardians and other members of the community involved in the care
of the child (parents, step-parents, siblings, grandparents, friends,
foster carers, etc.). Does not include people whose professional role is
as a ‘caretaker’, i.e. childcare workers or healthcare workers.
Closing the Gap
(CTG) scheme214
A scheme in conjunction with the Pharmaceutical Benefits Scheme
which further subsidizes medications for Aboriginal and/or Torres
Strait Islander patients meaning little or no patient co-payments are
required for medicines listed on the Pharmaceutical Benefits Schedule.
Cultural
connections
In this study, the term cultural connections was used to refer to use
and/or interaction with Aboriginal and/or Torres Strait Islander art,
music, dance, storytelling, food, traditional medicine, television, radio,
newspaper and internet sites.
Medicare
Benefits Scheme
and Schedule
(MBS)215
The Medicare Benefits Scheme is a national, government-funded
scheme that subsidizes the cost of personal medical and allied health
services for all Australians. All services included in the scheme are
listed on the Medicare Benefits Schedule.
Non-work
activities
Includes recreation and leisure activities, usual home duties such as
caring for children and housework, usual appointments, studying,
volunteering, sleep etc., regardless of whether in paid employment or
not.

Chapter 5: The cost of acute respiratory infections with cough among urban Aboriginal and Torres Strait Islander children
131
Pharmaceutical
Benefits Scheme
and Schedule
(PBS)215
The Pharmaceutical Benefits Scheme is a national, government-funded
scheme that subsidizes the cost of a wide range of pharmaceutical
drugs for all Australians. All medicinal products included in the scheme,
and their uses, are listed on the Pharmaceutical Benefits Schedule.
Stolen
Generation61
The Stolen Generation refers to Aboriginal and/or Torres Strait
Islander people who, as children, experienced separation from their
families and communities by compulsion, duress or undue influence as
part of Government laws, policies and practices at the time.
5.3.1 Study design and population
A 12-month prospective observational cohort study was conducted through a
primary healthcare clinic in South-East Queensland, Australia. The protocol for the
overarching study has been published.161 Children attending the clinic for any reason
were eligible for enrolment if they were (i) aged ≤5 years, (ii) a registered patient with
the clinic, and (iii) planned to stay within the study area during the 12-month study
period. Written informed consent was obtained from a parent/guardian prior to
enrolment. Recruitment occurred between February 2013 and November 2015; data
collection concluded in November 2016. This present study includes data from all
Aboriginal and/or Torres Strait Islander children enrolled in the broader cohort who
were not diagnosed with any chronic respiratory disease (excluding asthma) by a
respiratory physician during the study period. In accordance with Australian national
standards, Australian Indigenous status is a self-identification measure determined
through self-report.216
The study was approved by the ethics committees of the Queensland Children’s
Health Services (HREC/12/QRCH/169), University of Queensland (2012001395) and
Queensland University of Technology (1300000741). The study was registered with
the Australia New Zealand Clinical Trials Registry (ACTRN12614001214628). Cultural
oversight was provided by an Indigenous Research Reference Group.

132 Chapter 5: The cost of acute respiratory infections with cough among urban Aboriginal and Torres Strait Islander children
5.3.2 Data collection
Figure 5.1 shows the study procedures and time-points of data collection. Baseline
questionnaires detailing demographics, household characteristics, child and family
health behaviors, and medical history, were completed at enrolment. Follow-up
questionnaires were administered on a monthly basis via phone, or in person if the
parent/guardian was attending the health clinic at a scheduled follow-up timepoint.
These questionnaires asked about the health of the child, and health-related
resource use for any reason (including visits to a general practice, emergency
department, dentist or other health professionals; hospitalizations; and medications
and immunizations), in the past month. When contact was unsuccessful for two
consecutive months, participants were considered lost to follow-up.
If, at any point throughout the study, the child had an ARIwC (defined as any acute
illness with cough), research staff completed an ‘illness report’. Illness reports
collected all resource use related to the ARIwC since illness onset. If, at the time of
illness notification the ARIwC episode had resolved (resolution defined as no cough
for at least 3 days and nights), monthly follow-ups continued as scheduled. If, at the
time of illness notification, the ARIwC episode was ongoing, weekly follow-ups
commenced for 4 weeks. Weekly follow-ups collected information on cough
characteristics, all resource use related to the ARIwC, and parents/guardians
concerns about money spent on the child’s ARIwC illness, in the past week. Concerns
about money spent on the child’s ARIwC illness was measured using a 7-point Likert
type scale ranging from “very, very worried/concerned” to “not worried/concerned”.
All the resource use data collected throughout the study were parent/guardian-
reported.

Chapter 5: The cost of acute respiratory infections with cough among urban Aboriginal and Torres Strait Islander children
133
Figure 5.1. TLSIM study procedure.
5.3.3 Costing
Illness-related costs were evaluated from the perspective of caretakers, the public
healthcare system, and employers. With the exception of childcare fees which were
directly reported by parents/guardians, a standard unit cost was obtained from
published external sources and applied to each item of resource use in Australian
Dollars at 2017 prices. Table 5.2 presents the items of resource use costed for each
sector, the unit cost for each item and the source of that cost information.

134 Chapter 5: The cost of acute respiratory infections with cough among urban Aboriginal and Torres Strait Islander children
Table 5.2. Unit costs in Australian dollars 2017. Item Unit cost Source SECTOR: CARETAKERS Non-bulk billed healthcare services‡
General practice (GP) visit After hours GP home visit Specialist visit
$41.95 $101.05 $201.70
Australian Medical Association176 Item no. AA020 Item no. AA140 Item no. AJ010
Medicare Benefits Schedule170 Item no. 23, page 141 Item no. 5023, page 212 Item no. 110, page 151
PBS medications Various depending on the medication
Schedule of Pharmaceutical Benefits217
Over-the-counter medications Various depending on the medication
Chemist Warehouse online Pharmacy218
Time off work with unpaid leave§
Males: $43.76/hour Females: $37.08/hour
Australian Bureau of Statistics181
Time off non-work activities§♯ All persons: $41.26/hour Australian Bureau of Statistics181 Childcare fees already paid N/A Self-reported by person completing questionnaire
SECTOR : PUBLIC HEALTHCARE SYSTEM General practice visit (bulk-billed or non-bulk billed)
$37.05 Medicare Benefits Schedule, item no. 23, page 141170
After hours home visit by general practitioner (bulk-billed or non-bulk billed)
$74.95 Medicare Benefits Schedule, item no. 5023, page 212170
Specialist visit (bulk billed or non-bulk billed)
$128.30 Medicare Benefits Schedule, item no. 110, page 151170
Non-admitted emergency department presentation, triage category unknown†
$489.90¥ National Hospital Cost Data Collection219
Public hospitalization, diagnosis of: Influenza/ viral infection/ LRTI Bronchitis
$4523.51¥ $2626.92¥
National Hospital Cost Data Collection220 DRG E62B DRG E69B

Chapter 5: The cost of acute respiratory infections with cough among urban Aboriginal and Torres Strait Islander children 135
Bronchiolitis $3860.32¥ DRG E70B Diagnostic tests
Chest x-ray Full blood count Radioallergosorbet test Standard biochemistry profile Sweat test Thyroid function test
$20.10 $14.45 $25.75 $15.05 $31.65 $29.60
Medicare Benefits Schedule170 Item no. 58505, page 889 Item no. 65070, page 1023 Item no. 71137, page 1058 Item no. 66512, page 1029 Item no. 12200, page 272 Item no. 66719, page 1037
PBS Medications Various depending on the medication
Schedule of Pharmaceutical Benefits217
SECTOR: THIRD PARTIES (EMPLOYERS) Time off work with paid leave§
Males: $43.76 / hour Females: $37.08 / hour
Australian Bureau of Statistics181
‡ For non-bulk billed healthcare services the cost to caretakers is equal to the AMA fee minus the MBS rebate. § Used ABS reported average weekly earnings, divided by 38 to obtain cost per hour. ♯ Data on this item of resource use not collected in the illness reports administered at time of illness notification. † Given the triage category of ED presentations was unknown amongst our cohort, the mean cost of an ED presentation was estimated by summing the cost of an ED presentation of triage category 2, 3, 4 and 5 (URG 55, 95, 108 and 115) and dividing by 4. ¥ Costs have been adjusted for inflation.

136 Chapter 5: The cost of acute respiratory infections with cough among urban Aboriginal and Torres Strait Islander children
For medications, a cost per dose for each type of medication was calculated and
applied to the number of doses received per episode. Unit costs for medications were
valued at concession prices given all children enrolled in the study were either on
welfare benefits (e.g. unemployment benefits) or participating in the Close the Gap
(CTG) scheme (Table 5.1). Healthcare visits were costed differently depending on
whether the parent/guardian reported that the healthcare visit was bulk-billed or not
(Table 5.1). Time off work and time off non-work activities were valued equally using
the opportunity costing method.221 Using this method, the cost of time forgone (from
both work and non-work activities) was estimated using average Australian hourly
earnings to represent the potential economic benefit the caregiver missed out on
when needing to care for the child, over other activities. All unit costs were either
sourced directly in 2017 prices, or were adjusted for inflation from the reported year
to 2017 prices using inflation rates reported by the Reserve Bank of Australia.169
When unit costs went over a financial year, e.g. 2014-2015, the later year was used
as the base year for adjustment. No discount rate was applied as costs were only
examined over a 12-month period.
5.3.4 Statistical analyses
Analyses were undertaken using Stata v15 (StataCorp, College Station, TX, USA).
Multiple logistic regression models were used to examine characteristics associated
with enrolment (compared to non-enrolment), reporting ≥1 ARIwC episode during
the study period (compared to reporting no ARIwC episodes) and completion of all
weekly follow-ups following illness notification (compared to some or no weekly
follow-ups completed).
Costs were calculated for each sector, at each timepoint, and then summed to obtain
a total cost per episode. The cost of episodes involving a hospitalization were
reported separately and then excluded from further analyses. The total cost per
episode was summarized using means and 95% confidence intervals (CIs), and
medians and interquartile ranges (IQR), for episodes with complete data on illness-
related resource use.

Chapter 5: The cost of acute respiratory infections with cough among urban Aboriginal and Torres Strait Islander children
137
To account for the episodes with incomplete data on illness-related resource use,
multiple imputation was used.187,222 Incomplete data were either a result of
parent/guardian non-response to weekly contact attempts, or missed contact
attempts by staff. The proportion of weekly follow-ups that were incomplete at each
weekly timepoint was ≤20%. Approximately 10% of episodes requiring weekly follow-
ups completed no follow-ups. Incomplete data were significantly more likely to occur
among episodes in children: (i) with no family history of lung disease, (ii) from families
who didn’t maintain cultural connections at home (Table 5.1), (iii) who had spent time
living in an Aboriginal/Torres Strait community outside Brisbane in the 12 months
prior to enrolment and (iv) exposed to household tobacco smoke (indoors, outdoors
and/or whilst in the car).
Sequential imputation using chained equations with linear regression was used to
impute values for costs at each timepoint (4 weekly timepoints), for each sector
(caretakers, public healthcare system, employers).223 Variables associated with cost
(ARIwC episode number during the study, season of onset, whether medications
were taken for their cough between illness onset and illness notification, whether the
child was attending childcare at time of enrolment) informed the multiple imputation
model. Twenty imputed datasets were generated. The values of the imputed
variables were estimated by pooling the results across each imputed dataset, as per
Rubin’s rules.224 For the imputed dataset, means and 95% CIs were used to
summarize costs by timepoint and sector, as well as the total cost per episode. The
proportion of costs incurred by each sector per episode was also calculated.
Simple linear regression was used to examine differences in the mean cost per
episode by season of illness onset, and by cough duration. Season of illness onset was
categorized as spring (September – November), summer (December – February),
autumn (March – May), winter (June-August) using date of illness onset. Cough
duration was categorized as acute cough (cough lasting <2 weeks), sub-acute (cough
lasting 2-4 weeks), chronic cough (cough lasting >4 weeks),29 or unknown if cough
duration was unable to be determined due to missing data.

138 Chapter 5: The cost of acute respiratory infections with cough among urban Aboriginal and Torres Strait Islander children
The total cost of each episode was summed to obtain a total cost per child during the
study period. For each child, the total cost reported during the study period was
divided by the number of months of follow-up completed, to obtain a cost per child-
month of observation. The cost per month of observation was then multiplied by 12
in order to estimate the annual cost of non-hospitalized ARIwC. Simple linear
regression was used to examine the association between cost per month of
observation and the baseline characteristics presented in Appendix E. Any
characteristics with a p-value of ≤0.1 were entered into a multiple linear regression
model. A backwards elimination approach was used to achieve the final model;
characteristics with a p-value of <0.05 were retained.
5.4 RESULTS
Details of the cohort included in our analyses are presented in Figure 5.2. A total of
200 children were enrolled into the overarching study. There were no significant
differences between those enrolled (n=200) and not enrolled (n=203), in respect to
sex (p = 0.51), however there were differences in age. A significantly greater
proportion of children aged ≤2 years were enrolled compared to not enrolled (p =
0.02). Children identified as non-Indigenous at baseline (n=21) and children who were
diagnosed with a chronic lung disease during the study period (n=1) were excluded
from the present study. The median age of the 178 remaining children eligible for
inclusion in the present study was 1.5 years (IQR 0.6-2.9); 49% were female, 33%
were attending childcare or preschool ≥1 day a week, 90% of primary carer’s were
receiving government welfare benefits, 5% had private health insurance that covered
the child, and 43% of fathers, and 14% of mothers, were employed (Appendix E). Of
these 178 children, 138 reported ≥1 ARIwC episode during the study period and 40
reported no ARIwC episodes. Children who reported ≥1 ARIwC episode had a median
of 10 (IQR 8-12) monthly follow-ups completed, compared to a median of 4 (IQR 1-
10) for children with no ARIwC episodes reported. In regression models that
accounted for months of follow-up, children who had wheezing in the 12 months
prior to enrolment were significantly more likely to report experiencing ≥1 ARIwC
during the study period (p = 0.02), as were children whose primary carer knew
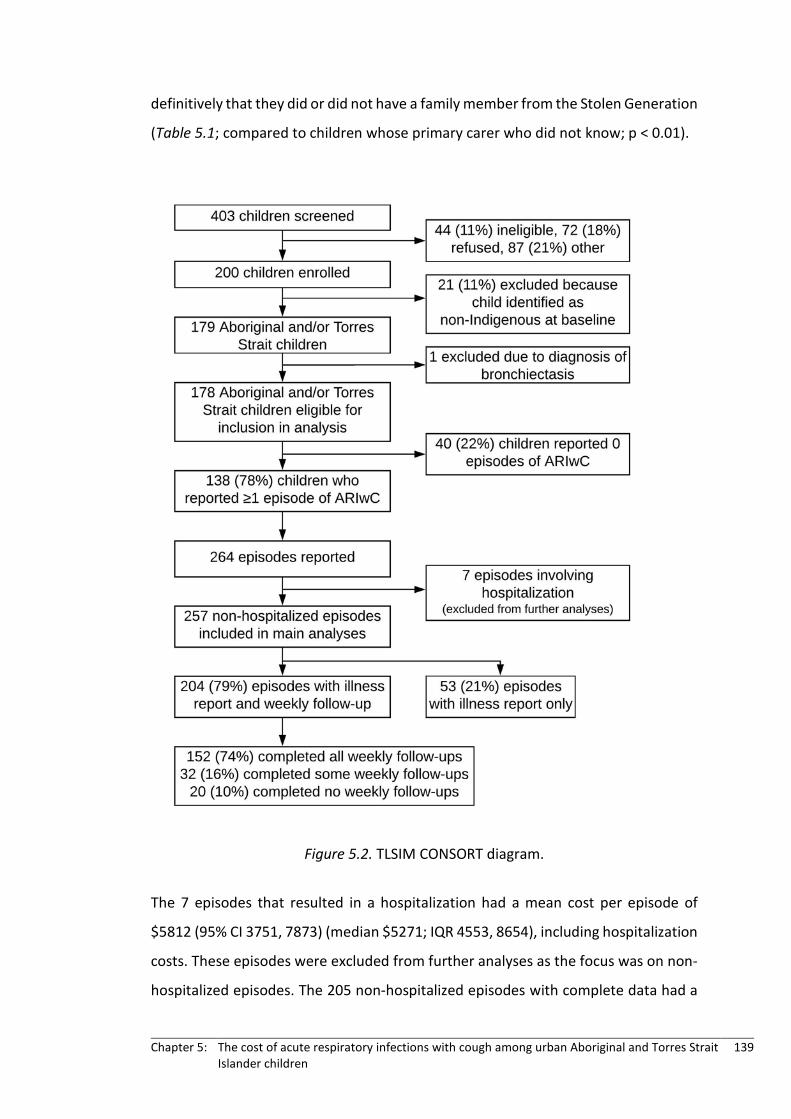
Chapter 5: The cost of acute respiratory infections with cough among urban Aboriginal and Torres Strait Islander children
139
definitively that they did or did not have a family member from the Stolen Generation
(Table 5.1; compared to children whose primary carer who did not know; p < 0.01).
Figure 5.2. TLSIM CONSORT diagram.
The 7 episodes that resulted in a hospitalization had a mean cost per episode of
$5812 (95% CI 3751, 7873) (median $5271; IQR 4553, 8654), including hospitalization
costs. These episodes were excluded from further analyses as the focus was on non-
hospitalized episodes. The 205 non-hospitalized episodes with complete data had a
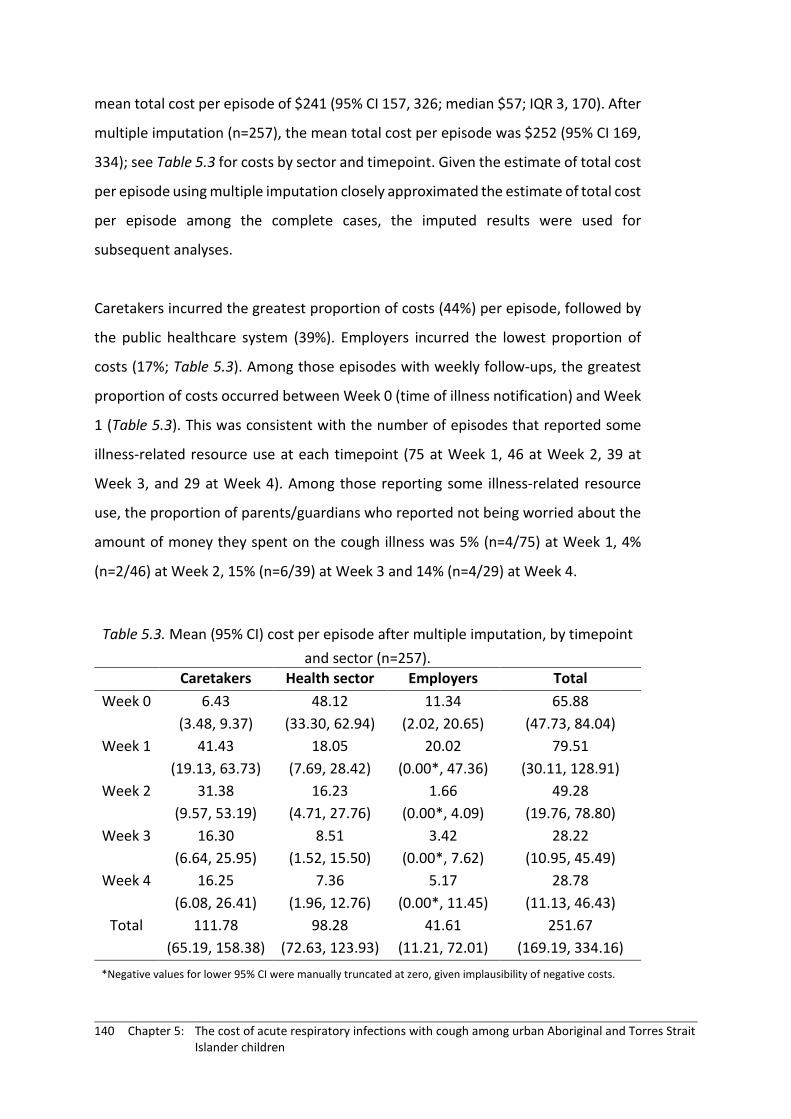
140 Chapter 5: The cost of acute respiratory infections with cough among urban Aboriginal and Torres Strait Islander children
mean total cost per episode of $241 (95% CI 157, 326; median $57; IQR 3, 170). After
multiple imputation (n=257), the mean total cost per episode was $252 (95% CI 169,
334); see Table 5.3 for costs by sector and timepoint. Given the estimate of total cost
per episode using multiple imputation closely approximated the estimate of total cost
per episode among the complete cases, the imputed results were used for
subsequent analyses.
Caretakers incurred the greatest proportion of costs (44%) per episode, followed by
the public healthcare system (39%). Employers incurred the lowest proportion of
costs (17%; Table 5.3). Among those episodes with weekly follow-ups, the greatest
proportion of costs occurred between Week 0 (time of illness notification) and Week
1 (Table 5.3). This was consistent with the number of episodes that reported some
illness-related resource use at each timepoint (75 at Week 1, 46 at Week 2, 39 at
Week 3, and 29 at Week 4). Among those reporting some illness-related resource
use, the proportion of parents/guardians who reported not being worried about the
amount of money they spent on the cough illness was 5% (n=4/75) at Week 1, 4%
(n=2/46) at Week 2, 15% (n=6/39) at Week 3 and 14% (n=4/29) at Week 4.
Table 5.3. Mean (95% CI) cost per episode after multiple imputation, by timepoint and sector (n=257).
Caretakers Health sector Employers Total Week 0 6.43
(3.48, 9.37) 48.12
(33.30, 62.94) 11.34
(2.02, 20.65) 65.88
(47.73, 84.04) Week 1 41.43
(19.13, 63.73) 18.05
(7.69, 28.42) 20.02
(0.00*, 47.36) 79.51
(30.11, 128.91) Week 2 31.38
(9.57, 53.19) 16.23
(4.71, 27.76) 1.66
(0.00*, 4.09) 49.28
(19.76, 78.80) Week 3 16.30
(6.64, 25.95) 8.51
(1.52, 15.50) 3.42
(0.00*, 7.62) 28.22
(10.95, 45.49) Week 4 16.25
(6.08, 26.41) 7.36
(1.96, 12.76) 5.17
(0.00*, 11.45) 28.78
(11.13, 46.43) Total 111.78
(65.19, 158.38) 98.28
(72.63, 123.93) 41.61
(11.21, 72.01) 251.67
(169.19, 334.16) *Negative values for lower 95% CI were manually truncated at zero, given implausibility of negative costs.

Chapter 5: The cost of acute respiratory infections with cough among urban Aboriginal and Torres Strait Islander children
141
There were 86 (33%) episodes in which illness onset was during winter, 77 during
autumn (30%), 54 (21%) during summer and 40 (16%) during spring. The total mean
cost of a winter episode was $455 (95% CI 248, 661); significantly greater than the
total mean cost of spring ($144; 95% CI 37, 251; p=0.01), summer ($96; 95% CI 20,
172; p<0.01), and autumn ($182; 95% CI 72, 291; p<0.01) episodes. There were 107
episodes (42%) classified as acute cough episodes, 66 (26%) as sub-acute and 44
(17%) as chronic. Among the remaining 40 episodes cough duration was unknown.
Chronic cough episodes had a total mean cost per episode of $585 (95% CI 301, 868),
which was significantly higher than acute cough episodes ($118; 95% CI 61, 175;
p<0.001) and sub-acute cough episodes ($230; 95% CI 84, 377; p<0.01). Figure 5.3
shows the cumulative cost of illness over the follow-up period among those episodes
requiring weekly follow-ups. Among this group, the cost of chronic cough episodes
was significantly higher than both acute cough (p < 0.01) and sub-acute cough (p <
0.05) episodes by Week 2 of the follow-up period.
Figure 5.3. Mean cumulative cost per episode of ARIwC from illness onset to four weeks post illness notification, by final cough duration (n=204).
The total mean cost per child during the study period, unadjusted for months of
observation, was $469 (95% CI 301, 636). The total cost per child-month of
observation due to non-hospitalized ARIwC was $83 (95% CI 43, 122). Three baseline

142 Chapter 5: The cost of acute respiratory infections with cough among urban Aboriginal and Torres Strait Islander children
characteristics were found to be independently and significantly associated with a
higher cost per child-month of observation: (1) having experienced wheezing in the
12 months prior to enrolment (coeff. $86; 95% CI 7, 165; p<0.05); (2) having
connections with traditional lands/homelands (coeff. $81; 95% CI 1, 160; p<0.05),
and; (3) having a parent/guardian who believed that antibiotics prescribed by a
doctor should be given until symptoms resolve (coeff. $145; 95% CI 11, 279; p<0.05).
The adjusted total annual cost was $991 (95% CI 514, 1468). The adjusted annual cost
was $425 (95% CI 154, 697) to caretakers, $426 (95% CI 191, 661) to the public
healthcare system and $140 (95% CI 0, 288) to employers.
5.5 DISCUSSION
This is the first study to have estimated the costs of non-hospitalized ARIwC episodes
among Aboriginal and/or Torres Strait Islander children. The total mean cost of ARIwC
was estimated to be $252 per episode, $83 per child month of observation, and $991
per child-year. Approximately half of the cost per episode was incurred by caretakers,
one third by the public healthcare system and one fifth by employers. Two episode-
related characteristics were associated with a higher cost per episode (season and
cough duration) and three child-related characteristics were associated with cost per
child month of observation (prior history of wheezing, connection to traditional lands
and parent/guardian understanding of recommended antibiotic duration).
As international studies are not comparable to the Australian context, these findings
have been interpreted in the context of other Australian studies. The total mean cost
per episode among this cohort was lower than that reported by Lambert et al. ($241
= ~$AU351 after adjusting to 2017 prices from 2001/2002),106 Lambert et al. ($309 =
~$AU435 after adjusting to 2017 prices from 2003)107 and Yin et al. ($AU626 =
~$AU724 after adjusting to 2017 prices from 2010).97 These three studies primarily
focused on ILI among children aged <6 years, and two focused exclusively on illnesses
during winter and spring.97,106 The cost differences between this study and those
above are likely due to these differences in study characteristics, as well as

Chapter 5: The cost of acute respiratory infections with cough among urban Aboriginal and Torres Strait Islander children
143
differences in the socio-economic characteristics of the participating families.
Lambert et al.107 found that children from families in the lowest household income
bracket (<$52,000 per year) reported the lowest costs per episode (~$166 less than
the cohort mean). Families with an annual household income of <$52,000 made up
24% of their study cohort, compared to 74% of children in this study; 75% of families
in Yin et al.’s cohort had an annual household income of $104,000 or more.
Parental employment status and childcare use also differed between our study and
Yin et al.’s.97 In the latter, 73% of children had both parents employed, and this
characteristic was significantly associated with higher costs per episode of ILI
(compared to one parent or no parents).97 Furthermore 89% of children in Yin et al.’s
cohort were attending childcare compared to 33% in this study. While childcare
attendance was not significantly associated with cost in Yin et al.,97 a study conducted
in the Netherlands of respiratory illnesses among children aged ≤2 years found the
cost per episode of ILI to be twice as much among children attending day care centers
than children not attending day care centers (mean cost of €196 compared to €95 in
year 2012, respectively).225 Neither of the Lambert et al. studies106,107 described
parental employment status or childcare use among their cohorts. However, their
cohorts were likely similar in these respects to Yin et al.’s cohort, given similarities in
household incomes and the use of childcare centers /playgroups as recruitment
settings.
Our cohort’s socio-economic characteristics also likely impacted the proportions of
costs incurred by each sector. The Lambert studies106,107 reported that 87 and 79% of
costs per episode of ILI were incurred by the patient and family respectively (44% in
our study) and 5 and 6% of total costs per episode were incurred by the healthcare
sector (39% in our study). This is attributable to the availability of Australian
government initiatives to assist Aboriginal and/or Torres Strait Islander families to
access, utilize and afford healthcare services and medications, such as bulk-billing and
the “Close the Gap” scheme (Table 5.1). The use of such initiatives amongst this
cohort thereby decreased the proportion of costs incurred by caretakers. However,
despite these initiatives, the economic burden on caretakers in this study was

144 Chapter 5: The cost of acute respiratory infections with cough among urban Aboriginal and Torres Strait Islander children
substantial relative to their capacity to pay. This was evident in that at any timepoint
during an ARIwC episode, no more than 20% of parent/guardians reported not being
worried about the amount of money spent on their child’s cough illness. Being
worried about the amount of money spent on a child’s ARIwC illness has been
reported to negatively impact quality of life.226 This stresses the importance of
recognizing the impact of monetary costs on families, as the emotional and social
stress of managing an illness in a child may be heightened by the economic burden.
Previous studies have identified an increased risk of young children experiencing an
ARI during winter months.15,53 This study found that the cost of an ARIwC episode
with onset in winter was significantly greater than an episode with onset in spring,
summer or autumn. Few other studies have estimated the costs of respiratory
infections across all seasons, and those that have107 have not compared costs
between seasons. Lambert et al.107 examined costs collected over a 12-month period
by virus type and found the cost of laboratory confirmed Influenza A (a winter illness
in southern Australia) to be higher than episodes with other respiratory viruses.
Approximately one in five ARIwC episodes resulted in chronic cough in this study,
similar to previous findings of children presenting to a tertiary paediatric ED with
ARIwC.34 The total mean cost of an episode resulting in chronic cough was 2.5 times
that of sub-acute cough episodes, and 5.0 times that of acute cough episodes. Few
published studies have examined the effect of cough duration on cost per episode.
Yin et al.97 reported greater costs were associated with a longer duration of ILI.
However, in the present study episodes that progressed to chronic cough incurred
the greatest proportion of costs early in the illness (i.e., during the acute phase). This
suggests that it is not the duration of the cough illness itself that is the main cause of
higher costs, but rather characteristics of the illness that from the onset affect both
the cost and the cough duration. Thus, early identification of children at risk of
developing chronic cough and early intervention to prevent the development of
chronic cough is important, as the cost savings are likely to be high.

Chapter 5: The cost of acute respiratory infections with cough among urban Aboriginal and Torres Strait Islander children
145
In addition to these two episode-specific characteristics, this study identified three
child/family characteristics associated with the cost per child-month of observation.
The finding of a prior history of wheeze being associated with higher costs is not
unexpected. Perception of a child’s vulnerability and susceptibility to severe illness,
as a consequence of previous illness, has been reported to be an important influence
on parent’s decision to seek healthcare.46 A history of wheezing may therefore
increase parent/guardian concern, thereby increasing the likelihood of seeking
healthcare, and consequently increasing cost of illness. A history of wheezing may
also increase the likelihood of the child experiencing wheezing during a current ARI
episode and requiring medical intervention. Kusel et al.53 reported that among
Australian children aged <5 years with an ARI, the proportion of episodes that
incurred a visit to the doctor and/or a hospitalization was greater among episodes
with wheeze, than without.
There is little quantitative research exploring the effect that historical and cultural
factors have on health and illness among Aboriginal and/or Torres Strait Islander
peoples. This present study found that being in family with connections to traditional
lands was associated with higher costs per month of observation. Previous research
among this same cohort found that having a family member from the Stolen
Generation (Table 5.1) was associated with having an ARIwC at the time of baseline
presentation to the recruitment clinic.37 Indeed these factors are closely related, with
67% of those responding ‘yes’ to connection to traditional lands, also responding ‘yes’
to having a family member from the Stolen Generation. The mechanisms by which
cultural and historical factors influence respiratory health and cost of respiratory
illness are not well understood, however their importance is apparent, and
consequently further research into this area should be prioritized.
The association between increased cost per month of observation and
parent/guardian belief that antibiotics should be given until there are no more
symptoms (opposed to until the course is finished) is important. Whether this
increase in cost is a result of ARIs not resolving and therefore requiring further
medical attention, or whether it reflects a broader issue of health literacy that is

146 Chapter 5: The cost of acute respiratory infections with cough among urban Aboriginal and Torres Strait Islander children
influencing the management, and therefore cost, of illness is unclear. However this
finding needs to be interpreted with caution as belief in the required duration of
antibiotics may not have been consistent with actual behavior and while the
association was significant the number of participants reporting that antibiotics
should be given until no more symptoms was small.
A key strength of this study is the almost 4-year period of recruitment and data
collection, enabling us to capture costs across all seasons and several years. As none
of the other Australian studies97,106,107 were >12 months duration, their reported
costs may reflect year-specific incidences, etiologies and severities of respiratory
infections. However, the generalizability of this study’s findings to all Aboriginal
and/or Torres Strait Islander children may be somewhat limited by this being a single
center study. Nevertheless, 62% of Aboriginal and/or Torres Strait Islander’s live in a
‘Major City’ or ‘Inner Regional’ area,227 similar to this community. Further, most
major Australian cities have similar healthcare service providers, and Medicare, PBS
and CTG are national schemes. The findings of this study may not be applicable to
remote communities, particularly given potential differences in delivery, access and
use of healthcare services as well as the availability of employment and formal
childcare services.
A limitation of our study is the missing data; however, multiple imputation was used
to account for this. There were some differences in the characteristics of children of
parents/guardians who reported ≥1 ARIwC episode during the study period and
children of parents/guardians who reported no episodes, particularly with respect to
prior respiratory history such as wheezing (Appendix E). In those children with no
ARIwC episodes reported, we are unable to determine whether this was correct or
whether it was a reporting bias due to poorer engagement in the study. The latter
seems most plausible given children who reported no ARIwC episodes had
significantly fewer months of observation than those with ≥1 episode. Another
limitation to our study is the 53 episodes which had illness reports but no weekly
follow-ups, due to study staff only being notified of the ARIwC illness after illness
resolution. The costing of these episodes may have underestimated the cost of illness

Chapter 5: The cost of acute respiratory infections with cough among urban Aboriginal and Torres Strait Islander children
147
given the exclusion of ‘time off non-work activities’ in the illness reports and the
potential for recall bias. However, these episodes were illnesses with a shorter
duration, may also have been less severe, and thus would have likely incurred lower
costs per episode regardless.
Our costing methods also had several limitations. Firstly, we did not include transport
costs to and from healthcare services, however anecdotally most of our study
population were accessing local health services, and/or utilizing public transport or
transport services provided by health clinics. Previous studies have reported that
transport costs made up < 1%106 of the total cost of illness, so it is unlikely that the
exclusion of transport costs would have made a meaningful difference to our findings.
Secondly, the unit costs used to estimate the cost of time off work were likely to have
been greater than what caretakers were actually being paid, given the low household
incomes of most families in this study.
In summary, the cost to caretakers and the public healthcare system to manage and
treat ARIwC among children in this population was substantial and was a source of
concern for caretakers. While total cost per episode was less than what has been
reported in other Australian studies, the proportion of costs incurred per episode by
the public healthcare system were greater. The importance of economic
considerations in the development and delivery of services, policies and programs to
improve the health of Aboriginal and/or Torres Strait Islander peoples has recently
been highlighted.5,8 Our study provides a baseline for which further economic studies
in this population can be developed and evaluated. Given differences in costs
between episodes occurring in different seasons and cough durations, future
research should take this into account, particularly when considering the cost-
effectiveness of interventions. While the proportion of parents/guardians who
believed that antibiotics should be given until there are no more symptoms was
small, when seeking healthcare parents/guardians may benefit from being reminded
of the importance of finishing the prescribed course of antibiotics. The significance of
historical and cultural factors on health and well-being cannot be overlooked and
148 Chapter 5: The cost of acute respiratory infections with cough among urban Aboriginal and Torres Strait Islander children
future health research among Aboriginal and/or Torres Strait Islander populations
should consider examining their influence further.

Chapter 6: Longitudinal study of the cost of acute respiratory infection with cough among Australian children presenting to an emergency department
149
Longitudinal study of the cost of acute respiratory infection with cough among Australian children presenting to an emergency department
This chapter reports on the analysis of data collected on resource use to determine
cost of ARIwC among children enrolled in the Emergency Department Cough study.
It comprises the following manuscript which is currently under review with
Emergency Medicine Australasia: Lovie-Toon YG, McPhail SM, Vagenas D, Au-Yeung
YT, Chang AB, Drescher BJ, Phillips N, Acworth J, Otim ME, O’Grady KF. Longitudinal
study of the cost of acute respiratory infection with cough among Australian children
presenting to an emergency department.
In combination with chapter 5, this chapter addresses research question 2a, 2b and
2c: Among Indigenous and non-Indigenous Australian children aged <15 years
presenting to primary healthcare clinics and/or emergency departments (EDs) with
acute respiratory infection with cough (ARIwC): what is the economic burden to
caretakers, the public healthcare system and third parties; is the economic burden
greater among episodes in which cough persists for four consecutive weeks (chronic
cough) compared to episodes in which cough resolves within four consecutive weeks
(acute or sub-acute cough); and what child, family and illness-related characteristics
are associated with a greater economic burden of illness?


QUT Verified Signature

152 Chapter 6: Longitudinal study of the cost of acute respiratory infection with cough among Australian children presenting to an emergency department
6.1 ABSTRACT
Aim: To determine the economic burden of acute respiratory illnesses with cough in
children presenting to an Australian paediatric emergency department (ED).
Methods: This was a prospective cohort study of children aged <15 years presenting
to the ED of the Royal Children’s Hospital, Brisbane, Australia with an acute
respiratory infection, with cough as a symptom (ARIwC). Data on resource use related
to the illness were collected from all children enrolled between July 2013 and August
2014. These data were used to estimate the cost of illness from the perspective of
caretakers, the public healthcare system and third parties. Variables associated with
cost of illness were examined using linear regression.
Results: Between July 2013 and August 2014, 292 children were enrolled. The mean
cost per episode in Australian dollars was $5274 (95% CI 4804, 5744). Caretakers
incurred the highest proportion of costs, followed by the public healthcare system.
Variables independently and significantly associated with cost per episode were (i)
cough duration pre-enrolment, (ii) illness duration pre-enrolment, (iii)
parent/guardian concerns about cost of illness at enrolment, (iv) discharge
destination post-ED, (v) season of ED presentation, and (vi) maternal education.
Conclusion: This study demonstrates the cost of managing ARIwC among children
presenting to a paediatric ED in Australia is substantial, particularly for caretakers.
The findings suggest that interventions which target autumn and winter respiratory
illnesses, prevent hospitalisations, and reduce cough duration are likely to be
successful at reducing disease burden from an economic perspective.

Chapter 6: Longitudinal study of the cost of acute respiratory infection with cough among Australian children presenting to an emergency department
153
6.2 INTRODUCTION
Acute respiratory infections (ARIs) and cough are frequent complaints in children.51
Indeed among children, cough is the most common symptom that results in medical
consultations.209 The majority of episodes are self-limiting and managed by families
and in primary care.53 While community-based studies report low rates of emergency
department (ED) presentation (and subsequent hospitalisation) among healthy
children experiencing ARIs,53,97 ARIs remain among the most frequent reason children
present to EDs.3
Studies estimating the economic burden of ARIs and cough largely focus on the costs
to families and health services among community-based cohorts,97,107,196 or costs
directly associated with hospitalisation for specific respiratory illnesses or
pathogens.129 While the former may accurately capture the societal burden of mild
ARIs, the latter only captures costs at one timepoint during a severe episode. There
are currently no Australian studies that comprehensively report the cost of ARIs over
the duration of illness among children presenting to EDs.
Thus, among children presenting to a tertiary paediatric ED, we aimed to estimate
the costs of ARI with cough (ARIwC) from the perspective of caretakers (Table 6.1),
the public healthcare system and third parties (employers and private health
insurance companies). The objectives were to estimate the: (i) total cost of ARIwC
per episode, (ii) cost distribution across the three sectors, and (iii) association
between cost and child, family and illness-related characteristics.

154 Chapter 6: Longitudinal study of the cost of acute respiratory infection with cough among Australian children presenting to an emergency department
Table 6.1. Glossary of terms. Caretakers
Includes any immediate and extended family, non-biological carers or
guardians and other members of the community involved in the care
of the child (parents, step-parents, siblings, grandparents, friends,
foster carers, etc.). Does not include people whose professional role is
as a ‘caretaker’, i.e. childcare workers or healthcare workers.
Non-work activities
Includes recreation and leisure activities, usual home duties such as
caring for children and housework, usual appointments, studying,
volunteering, sleep etc., regardless of whether in paid employment or
not.
6.3 METHODS
6.3.1 Study design and participants
A prospective cohort study was conducted among children presenting to a tertiary
paediatric ED in Brisbane, Australia between December 2011 and August 2014. The
present study included children enrolled from July 2013 onwards - the period in
which economic data were collected. The full protocol has been published.162
Children were eligible for inclusion if they were aged <15 years and had parent-
reported cough as a symptom. Children were ineligible if they had a chronic lung
disease (excluding asthma), immunosuppressive conditions, used
immunomodulating drugs during the 30 days prior to presentation, and/or had
insufficient English. Written informed consent was obtained from
parent(s)/guardian(s), and written assent was obtained from children aged ≥12 years.
The study was approved by the ethics committees of Children’s Health Queensland
(HREC/11/QRCH/83), The University of Queensland (2012000700) and the
Queensland University of Technology (1400000057).
6.3.2 Data collection
Data were collected using questionnaires administered in person at baseline (Week
0) and then weekly, via phone or email, for four weeks. If contact was unsuccessful

Chapter 6: Longitudinal study of the cost of acute respiratory infection with cough among Australian children presenting to an emergency department
155
for two consecutive weeks, children were considered lost-to-follow-up. Baseline
questionnaires collected data on the illness and ED presentation, child/family medical
history, child/household risk factors, socio-demographic characteristics, and ARIwC-
related resource use since illness onset. Weekly follow-ups collected data on cough
characteristics and ARIwC-related resource use in the past week. ARIwC-related
resource use included healthcare and medication use, diagnostic tests, time spent
seeking healthcare or caring for the child by parent/guardians or other carers, and
missed activities, including school and childcare. Data were entered into Filemaker
Pro Version 14 (Filemaker Inc, Santa Clara, CA).
With the exception of ED presentations and hospitalisations that were verified from
hospital administrative records, resource use was parent/guardian-reported.
Parent/guardian concern about the amount of money spent on the child’s illness was
measured at all timepoints using a 7-point Likert scale ranging from “very, very
worried/concerned” to “not worried/concerned”.
6.3.3 Costing
Costs were evaluated from the perspective of caretakers, the public healthcare
system, and third parties. With the exception of missed activities and childcare, and
miscellaneous costs, a unit cost was obtained from external sources and applied to
each item of resource use reported (Appendix F, Table F1). Where possible, unit costs
were sourced directly in Australian Dollars at 2017 prices; any unit costs from a
different year were adjusted to 2017 prices using inflation rates reported by the
Reserve Bank of Australia.169 No discount was applied as costs were examined over a
four-week period. Inpatient costs were included for those children hospitalised for
their cough illness during the study. Time off work and non-work activities (Table 6.1)
were valued equally using the opportunity costing method,221 whereby the cost of
time forgone was estimated using average Australian hourly earnings.

156 Chapter 6: Longitudinal study of the cost of acute respiratory infection with cough among Australian children presenting to an emergency department
6.3.4 Statistical analyses
Statistical analyses were conducted using Stata15 (StataCorp, College Station, TX,
USA). Variables associated with enrolment, and with incomplete data due to non-
response to follow-ups, were examined using logistic regression (Appendix F, Table
F2). For complete cases, frequency of resource use was described using counts and
proportions. Quantity of resource use was described using ranges, means and bias-
corrected 95% confidence intervals (CIs) (obtained through bootstrapping with 2000
replications). Costs were calculated by sector and timepoint, and aggregated to
obtain a total cost per episode. For the incomplete cases, multiple imputation186 was
used to impute values for costs by sector and timepoint. Non-response to follow-ups
was 37% at Week 1, 38% at Week 2, 43% at Week 3 and 46% at Week 4; 28% of
participants completed no follow-ups. Significant predictors of incomplete data
(Appendix F, Table F2) and significant predictors of costs post-enrolment among the
complete cases informed the multiple imputation model. Fifty imputed datasets were
generated through sequential imputation using chained equations with predictive
mean matching.228 Predictions were sampled from the five nearest neighbours. The
values of the imputed variables were estimated by pooling the results across each
imputed dataset, as per Rubin’s rules.224 For the imputed dataset, means and 95% CIs
were used to summarise cost by timepoint and sector, as well as the total cost.
After imputation, linear regression was used to identify variables associated with
total cost per episode. These included the variables presented in Table F2 (Appendix
F), as well as cough duration post-enrolment. Cough duration post-enrolment was
collected as a categorical variable using the following categories: acute (duration <2
weeks), sub-acute (duration 2-4 weeks), chronic (duration >4 weeks),29 or unknown
if duration was not determined. Univariate analyses were conducted for variable
selection, with the most promising predictors of cost (p<0.05 from univariate
analyses) carried forward to a multiple linear regression model.

Chapter 6: Longitudinal study of the cost of acute respiratory infection with cough among Australian children presenting to an emergency department
157
6.4 RESULTS
Between July 2013 and August 2014, 1149 children were screened. There were no
significant differences between those enrolled (n=292) and not enrolled (n=857) with
respect to sex (p=0.27), however children aged ≥1 year or assigned to a more urgent
triage category at presentation were more likely to be enrolled (both p<0.01). The
median age of enrolled children was 2.2 years (IQR 1.2-4.5 years), 37% were female
and 2% identified as Indigenous Australian. Median parent-reported duration of
illness pre-enrolment was 3 days (range 0-181). Primary discharge diagnoses
following ED presentation at enrolment were: asthma/reactive airways disease
(35%), upper respiratory tract infection/viral infection/other respiratory illness
(31%), bronchiolitis (11%), croup (11%), pneumonia (7%) and non-respiratory illness
(5%); 1% were missing. Approximately 16% of the cohort were hospitalised following
the ED presentation at enrolment; median length of stay of 2 days (range 0–5 days).
From the enrolment to Week 4, 87 (30%) episodes were classified as acute cough, 44
(15%) as sub-acute, 33 (11%) as chronic, and 128 (44%) as unknown duration.
Six participants reported dubiously high levels of resource use at Week 0; 6-18 times
greater than the rest of the cohort and after further examination were determined
to be a result of parent reporting errors. Throughout the paper we refer to the results
with the six participants excluded. Estimates of cost and the linear regression model
with the six participants included are presented in Tables F3 and F4 (Appendix F).
Among the complete cases (n=127), EDs were the healthcare services used by the
greatest proportion of participants, whereas general practitioner consultations were
used in the greatest quantity (Table 6.2). More than two-thirds of children used at
least one prescription medication, at least one over the counter medication and
missed at least one day of childcare or school. The most frequently reported time off
(98% of complete cases) was from non-work activities, as a result of caring for the
child. This time was also reported in the greatest quantity with a mean of
approximately 50 hours per child. At each timepoint, among participants reporting
some resource use, the proportion of parents/guardians who reported not being

158 Chapter 6: Longitudinal study of the cost of acute respiratory infection with cough among Australian children presenting to an emergency department
worried about the amount of money they spent on the cough illness was 63%
(n=180/286) at Week 0, 38% (n=66/175) at Week 1, 57% (n=40/70) at Week 2, 47%
(n=29/62) at Week 3 and 49% (n=27/55) at Week 4.
The complete cases had a mean total cost per episode of $5155 (95% CI 4456, 5855;
median $3925; IQR 2106, 6874). After multiple imputation (n=286), the mean total
cost per episode was $5274 (95% CI 4804, 5744) (Table 6.3). Caretakers incurred the
greatest proportion of costs (66%), followed by the public healthcare system (22%);
third parties incurred the lowest proportion of costs (11%). The greatest proportion
of costs were incurred pre- or at enrolment (54%) and in the week following
enrolment (36%). Only 10% of total episode costs were incurred after Week 1.

Chapter 6: Longitudinal study of the cost of acute respiratory infection with cough among Australian children presenting to an emergency department 159
Table 6.2. Summary of resource use related to the acute respiratory infection with cough episode among complete cases, n=127. Any use Number of times
n (%) Range Mean 95% CI
General practitioner consultation† 92 (72) 0 – 21 1.83 1.44, 2.40
Specialist consultation 7 (6) 0 – 2 0.09 0.02, 0.16
Use of other healthcare service‡ 3 (2) 0 – 1 0.02 0.01, 0.06
Emergency department presentation without admission 110 (87) 0 – 4 1.02 0.92, 1.13
Hospitalisation 34 (27) 0 – 3 0.35 0.24, 0.47
Diagnostic test/s conducted outside of an emergency
department/hospital
15 (12) 0 – 4 0.19 0.10, 0.32
Ambulance trip 15 (12) 0 – 3 0.14 0.07, 0.22
Any time spent Number of hours
n (%) Range Mean 95% CI
Time off work (paid leave) to seek healthcare§ 60 (47) 0 – 96 6.25 4.27, 8.88
Time off work (unpaid leave) to seek healthcare 36 (28) 0 – 89 3.62 2.18, 5.70
Time off non-work activities to seek healthcare 114 (90) 0 – 153 16.97 13.27, 21.54
Time off work (paid leave) to care for child 50 (39) 0 – 130 8.41 5.71, 12.13
Time off work (unpaid leave) to care for child 32 (25) 0 – 112 6.06 3.46, 9.59
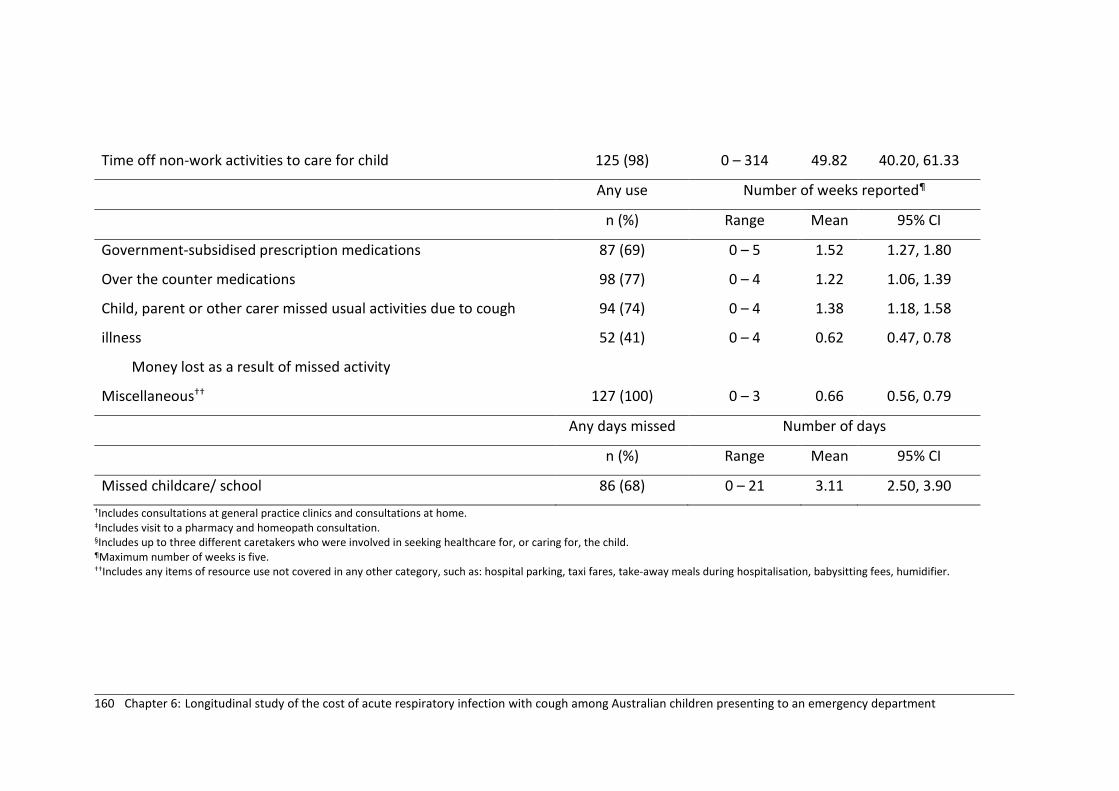
160 Chapter 6: Longitudinal study of the cost of acute respiratory infection with cough among Australian children presenting to an emergency department
Time off non-work activities to care for child 125 (98) 0 – 314 49.82 40.20, 61.33
Any use Number of weeks reported¶
n (%) Range Mean 95% CI
Government-subsidised prescription medications 87 (69) 0 – 5 1.52 1.27, 1.80
Over the counter medications 98 (77) 0 – 4 1.22 1.06, 1.39
Child, parent or other carer missed usual activities due to cough
illness
Money lost as a result of missed activity
94 (74)
52 (41)
0 – 4
0 – 4
1.38
0.62
1.18, 1.58
0.47, 0.78
Miscellaneous†† 127 (100) 0 – 3 0.66 0.56, 0.79
Any days missed Number of days
n (%) Range Mean 95% CI
Missed childcare/ school 86 (68) 0 – 21 3.11 2.50, 3.90 †Includes consultations at general practice clinics and consultations at home. ‡Includes visit to a pharmacy and homeopath consultation. §Includes up to three different caretakers who were involved in seeking healthcare for, or caring for, the child. ¶Maximum number of weeks is five.
††Includes any items of resource use not covered in any other category, such as: hospital parking, taxi fares, take-away meals during hospitalisation, babysitting fees, humidifier.

Chapter 6: Longitudinal study of the cost of acute respiratory infection with cough among Australian children presenting to an emergency department 161
Table 6.3. Mean cost per episode of acute respiratory infection with cough after multiple imputation, in 2017 Australian dollars, by timepoint, and sector, n=286†.
†Outliers have been excluded.
Caretakers Public healthcare system Third parties Total
Mean 95% CI Mean 95% CI Mean 95% CI Mean 95% CI
Week 0 1579.91 1316.94, 1842.88 1015.26 911.66, 1118.85 255.65 197.27, 314.03 2850.82 2541.66, 3159.97
Week 1 1531.85 1317.91, 1745.79 61.98 26.11, 97.85 310.17 215.66, 404.68 1904.00 1664.43, 2143.57
Week 2 142.32 89.57, 195.06 22.20 3.95, 40.45 10.24 2.40, 18.08 174.76 109.03, 240.49
Week 3 141.05 87.92, 194.19 72.73 19.32, 126.13 24.67 0.70, 48.64 238.45 149.10, 327.80
Week 4 92.22 49.04, 135.40 8.64 1.65, 15.63 4.77 0.18, 9.35 105.62 30.21, 151.04
Total 3487.35 3106.65, 3868.05 1180.80 1053.06, 1308.55 605.50 478.86, 732.13 5273.65 4803.51, 5743.78

162 Chapter 6: Longitudinal study of the cost of acute respiratory infection with cough among Australian children presenting to an emergency department
Eleven variables were associated with total cost per episode in univariate analyses
(Table 6.4); seven remained significant (p<0.05) in the multiple linear regression
model. The strongest associations were for hospital admission (coeff 4045; 95% CI
2872, 5218); parents being very, very worried about the cost of illness (coeff 4402;
95% CI 2333, 6471); cough duration pre-enrolment (14 -<28 days: coeff 1985; 95% CI
698, 3272; ≥28 days: coeff 2490; 95% CI 840, 4140); enrolment in autumn (coeff 1753;
95% CI 521, 2985) and having a mother with a tertiary education (coeff -1295; 95% CI
-2236, -354).
Table 6.4. Multiple linear regression model examining variables associated with total cost per episode of acute respiratory infection with cough, n=274†.
Variable Coefficient‡ 95% CI P value
Cough duration pre-enrolment (days)
0 to <14 Reference
14 to <28 1984.99 698.14, 3271.85 0.003
≥28 2489.96 839.72, 4140.20 0.003
Illness duration pre-enrolment (days) 34.04 8.21, 59.86 0.010
Cough duration post-enrolment (days)
0 to <14 Reference
14 to <28 343.16 -743.58, 1429.89 0.401
≥28 547.66 -735.70, 1831.02 0.534
Unknown 1024.91 121.59, 1928.22 0.026
Season of enrolment presentation to ED
Spring (Sept-Nov) Reference
Summer (Dec-Feb) 210.30 -1168.11, 1588.72 0.764
Autumn (Mar-May) 1752.97 521.26, 2984.68 0.006
Winter (June-Aug) 1432.91 265.35, 2600.47 0.016
Discharge destination post-ED presentation at enrolment
Discharged home Reference
Admitted to short-stay 127.03 -795.49, 1049.55 0.786
Admitted as inpatient 4045.14 2872.24, 5218.03 0.000

Chapter 6: Longitudinal study of the cost of acute respiratory infection with cough among Australian children presenting to an emergency department
163
Did not wait¶ 1167.70 -5198.86, 7534.25 0.718
Diagnosis assigned at ED discharge
Upper respiratory tract infection / viral
infection / other respiratory illnesses
Reference
Asthma/reactive airways disease -280.77 -1371.80, 810.25 0.612
Croup 203.76 -1084.30, 1491.83 0.755
Pneumonia 324.54 -1437.62, 2086.69 0.717
Bronchiolitis 1313.39 -25.27, 2652.04 0.054
Other non-respiratory illness 1691.04 -183.41, 3565.49 0.077
Parent/guardian level of concern about the amount of money lost due to child’s cough illness at enrolment
Not Reference
A little/Hardly 560.02 -400.79, 1520.83 0.252
Fairly/Somewhat 1519.91 309.84, 2729.98 0.014
Very, very/Very 4402.19 2333.24, 6471.13 0.000
Maternal educational attainment
High school Reference
Post school -809.24 -1850.85, 232.36 0.127
Tertiary -1294.82 -2235.57, -354.08 0.007
Total number of people living in the household
1-2 Reference
3-4 213.79 -661.90, 1089.47 0.631
5-6 -451.65 -1889.03, 985.73 0.536
6+ -1218.99 -3050.07, 612.09 0.191
Maternal age at enrolment (years) -9.55 -76.12, 57.03 0.778
Child age at enrolment (years) -62.28 -210.00, 85.43 0.407
Intercept 2858.39 211.49, 5505.29 0.034 †Outliers and participants with a missing response to variables in this model have been excluded.
‡Coefficient = unstandardized regression coefficient. ¶Interpret with caution, n=1.

164 Chapter 6: Longitudinal study of the cost of acute respiratory infection with cough among Australian children presenting to an emergency department
6.5 DISCUSSION
We estimated the cost of ARIwC among a cohort of Australian children presenting to
an ED to be $5274 per episode. Two-thirds of costs were incurred by caretakers,
mostly attributable to the substantial amount of time caretakers spent caring for the
child. The majority of costs were incurred in the acute phase of the illness.
Our findings highlight the substantial economic burden that ARIwC imposes on
society, in particular families. The mean cost per episode within our cohort is 7-20
times greater than mean episode costs reported in previous Australian studies among
children recruited from childcare centres and primary healthcare services, who
reported few tertiary healthcare service encounters.97,106,107,196 However, within two
of these studies, a small proportion of children were hospitalised and the mean cost
of those episodes are comparable to the mean cost of all episodes in our study
(Lambert et al107: $AU3409 (≈$AU4800 in 2017 prices) and Lovie-Toon et al196:
$AU5812). This is despite only one fifth of our cohort reporting a hospitalisation. We
did not identify any studies outside of Australia that were comparable to ours and
such comparisons are difficult given differences in healthcare systems.
Although hospitalisation incurs higher cost, it is not solely due to direct medical costs.
The time required by caretakers to seek this healthcare and to care for the child prior
to, during and following hospitalisation is important. In a study of resource use
among Australian children presenting to EDs with ILI,98 over half the cohort reported
taking time off work for their child’s illness; the study did not report on
parent/guardian time off non-work activities. Time off non-work activities made up
the majority of time spent seeking healthcare and caring for the child in our study.
A longer duration of illness and longer cough duration pre-enrolment were
independently associated with higher cost. In a community-based study of influenza-
like-illness among healthy Australian children aged 6-months to 3-years,97 longer
illnesses were found to be associated with higher costs. Similarly, in a community-
based study of ARIwC cost among Indigenous Australian children, chronic cough

Chapter 6: Longitudinal study of the cost of acute respiratory infection with cough among Australian children presenting to an emergency department
165
episodes had higher costs than sub-acute and acute cough.196 However, in our study
only an unknown cough duration post-enrolment was found to be a predictor of total
cost after controlling for illness and cough duration pre-enrolment. The differences
are likely explained by different cost distribution over illness duration. In the present
study, only a small proportion of costs were incurred post-Week 1, whereas costs
over time were more evenly distributed among the Indigenous Australian cohort.
Presenting to the ED in autumn and winter were also associated with higher cost per
episode. ARI incidence in Australia is known to be highest in winter51 as are ED
presentations and hospitalisations.88 The detection and co-detection of viruses and
bacteria associated with more severe ARI (e.g. bronchiolitis and pneumonia) are also
more common in these months.31
Higher levels of maternal education were associated with lower cost of illness. The
process by which this association occurs is unclear. Saunders et al.’s229 study of
parent’s healthcare-seeking decisions for their child’s ARI found that parents with
post-secondary education had increased odds of seeking healthcare. While seeking
healthcare increases costs, it may also result in faster illness resolution which we
found were associated with decreased costs.
Parental concerns about the amount of money spent on their child’s illness is the only
variable where the temporal relationship between outcome (cost of illness) and
exposure (financial concerns) is reversed. While cough and illness duration, season of
presentation, maternal education and hospitalisation are likely to be variables that
contributed to higher costs, higher costs likely led to a greater level of
parent/guardian concern. A study in this same cohort226 found that financial concerns
regarding the cost of illness predicted poorer cough-specific quality of life (QoL), both
at baseline and over the follow-up period.
A key strength of this study is the prospective design with frequent follow-ups to
collect data on resource use and cough characteristics, thereby minimising the risk of
recall bias. This study was inclusive of the broad spectrum of ARIs, and questionnaires

166 Chapter 6: Longitudinal study of the cost of acute respiratory infection with cough among Australian children presenting to an emergency department
were extensive in the collection of resource use. Furthermore, resource use
associated with the illness pre-enrolment was collected, in addition to resource use
for four weeks following enrolment.
Limitations include the extent of missing data in the follow-ups, the exclusion of
transport costs (apart from ambulance use for ED presentations) and the one-year
data collection period. The results of multiple imputation suggested the potential
impact of missing data was not large ($5156 for complete data, $5274 for imputed
data). Community-based studies have reported that transport costs make up a small
proportion of total costs106,131 so their exclusion is unlikely to be important. The one-
year data collection period may mean our cost estimates reflect year-specific
incidences, aetiologies and severities of ARI. For example, in the overall study that
encompassed a 142 week period,34 20.4% (95% CI 17.7, 23.1) of children developed
chronic cough compared to 11% in this study. This may mean costs are not directly
applicable to other years.
Among Australian children aged 0-9 years in 2017-2018, there were at least 132,000
ED presentations for upper ARI, croup/epiglottitis and bronchiolitis.230 Thus, our
finding of a cost per episode of $AU5274 for children presenting to an ED, combined
with the costs of community-managed ARIwC reported in other Australian studies,
suggests that the economic burden of ARIwC to Australian society as a whole is
substantial. Interventions that are successful in reducing hospitalisations and/or
reducing cough duration are likely to result in substantial savings to the economy and
improve the quality of life of children and their families.

Chapter 7: Longitudinal study of quality of life among children with acute respiratory infection and cough
167
Longitudinal study of quality of life among children with acute respiratory infection and cough
This chapter reports on the analysis of data collected on quality of life among children
enrolled in the Emergency Department Cough study.
It comprises the following published paper: Lovie-Toon YG, Chang AB, Newcombe PA,
Vagenas D, Anderson-James S, Drescher BJ, Otim ME, O’Grady KF. Longitudinal study
of quality of life among children with acute respiratory infection and cough. Quality
of Life Research. 2018; 27(4):891-903. doi: 10.1007/s11136-017-1779-y.
This chapter addresses research question 2d: Among Indigenous and non-Indigenous
Australian children aged <15 years presenting to primary healthcare clinics and/or
emergency departments (EDs) with acute respiratory infection with cough (ARIwC)
what child, family and illness-related characteristics are associated with cough-
specific QoL?

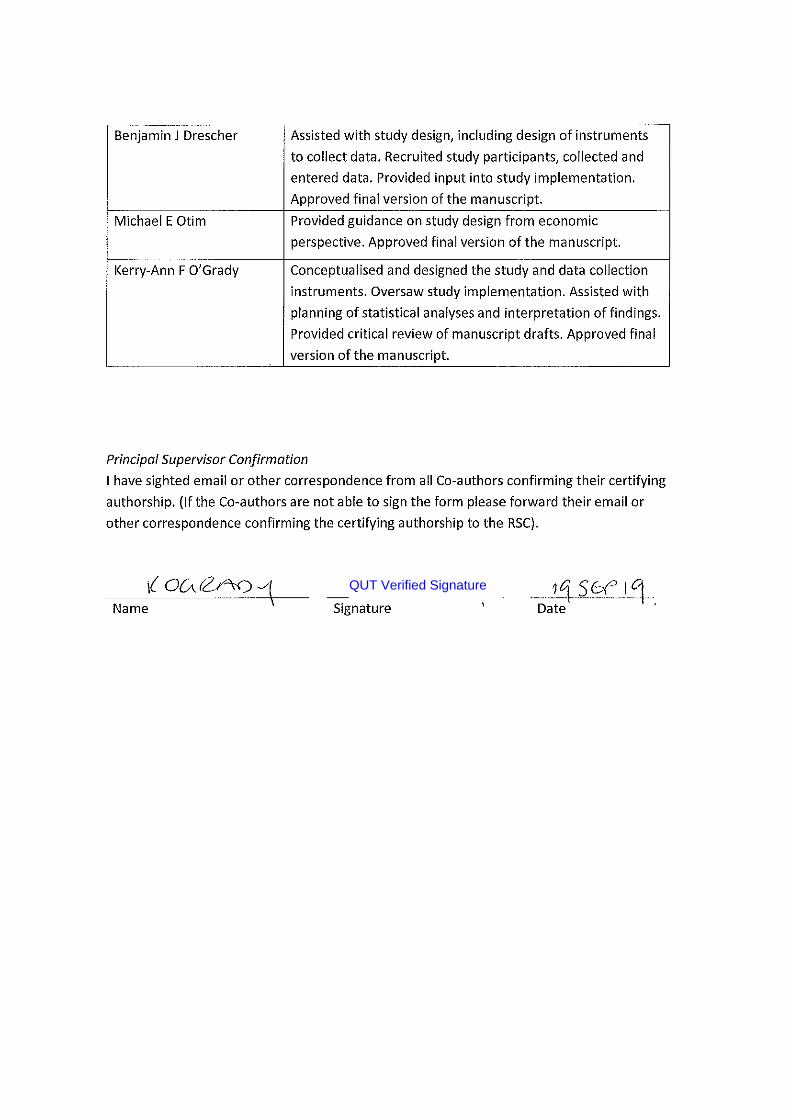
QUT Verified Signature
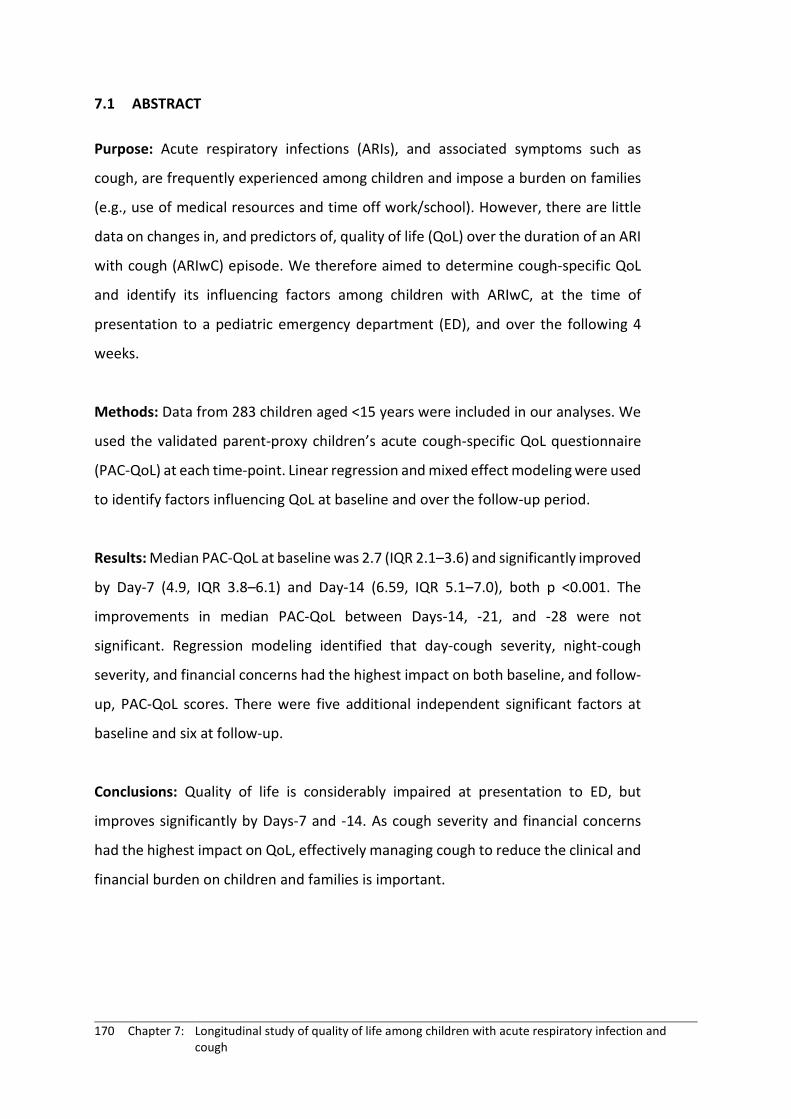
170 Chapter 7: Longitudinal study of quality of life among children with acute respiratory infection and cough
7.1 ABSTRACT
Purpose: Acute respiratory infections (ARIs), and associated symptoms such as
cough, are frequently experienced among children and impose a burden on families
(e.g., use of medical resources and time off work/school). However, there are little
data on changes in, and predictors of, quality of life (QoL) over the duration of an ARI
with cough (ARIwC) episode. We therefore aimed to determine cough-specific QoL
and identify its influencing factors among children with ARIwC, at the time of
presentation to a pediatric emergency department (ED), and over the following 4
weeks.
Methods: Data from 283 children aged <15 years were included in our analyses. We
used the validated parent-proxy children’s acute cough-specific QoL questionnaire
(PAC-QoL) at each time-point. Linear regression and mixed effect modeling were used
to identify factors influencing QoL at baseline and over the follow-up period.
Results: Median PAC-QoL at baseline was 2.7 (IQR 2.1–3.6) and significantly improved
by Day-7 (4.9, IQR 3.8–6.1) and Day-14 (6.59, IQR 5.1–7.0), both p <0.001. The
improvements in median PAC-QoL between Days-14, -21, and -28 were not
significant. Regression modeling identified that day-cough severity, night-cough
severity, and financial concerns had the highest impact on both baseline, and follow-
up, PAC-QoL scores. There were five additional independent significant factors at
baseline and six at follow-up.
Conclusions: Quality of life is considerably impaired at presentation to ED, but
improves significantly by Days-7 and -14. As cough severity and financial concerns
had the highest impact on QoL, effectively managing cough to reduce the clinical and
financial burden on children and families is important.

Chapter 7: Longitudinal study of quality of life among children with acute respiratory infection and cough
171
7.2 INTRODUCTION
The most common cause of acute cough in children relates to acute respiratory
illnesses (ARIs),29 which are the most frequent reason children present to emergency
departments (ED) in Australia and globally.86,231-234 The presence of cough within an
ARI is more likely to indicate lower airway involvement, and when prolonged is
related to poorer long-term respiratory outcomes.29,31 Cough imposes a considerable
burden on children and their families through frequent healthcare visits, use of
prescription and over-the-counter medications, and time off work and
school.84,131,209,235 Consequently, the health-related quality of life (HR-QoL) of
children and their carer(s) is impaired.84,236 In a study of children with chronic cough,
parent-proxy generic HR-QoL prior to management was similar to those of children
with substantial chronic illness (e.g. diabetes and obesity).127 Among these children
with chronic cough, their cough-specific QoL significantly improved when their cough
resolved, and the QoL scores of those later diagnosed with a serious underlying
respiratory disease were similar to those without.127 This suggests that the symptom
of cough was the major driving factor of their impaired cough-specific QoL, rather
than their clinical diagnosis.
Understanding and evaluating HR-QoL is important in both clinical and research
settings, for the evaluation of strategies to improve clinical outcomes, and thereby
overall health and wellbeing. However, there is a paucity of studies focusing on QoL
for acute illnesses, including cough dominant conditions.115 Furthermore, studies
using validated cough-specific QoL questionnaires for children with acute (<2 weeks
duration)43 and chronic (>4 weeks) cough84 have been limited to assessing change in
QoL between two time points only: between study enrolment and, either post-
intervention, or upon cough resolution. These studies reported that parents of
children whose cough had resolved at follow-up had significantly better QoL than
those whose children were still coughing.43,45,84 There are, however, no studies that
have repeatedly evaluated changes in cough-specific QoL over the transitional period
from acute to chronic cough, and it is unclear, when and the degree to which,
improvements in QoL occur in children with acute cough.

172 Chapter 7: Longitudinal study of quality of life among children with acute respiratory infection and cough
In addition to evaluating changes in QoL over the duration of an illness, it is important
to identify factors influencing QoL throughout an illness. A combination of generic
and condition-specific QoL questionnaires have been used to examine factors
influencing QoL during specific respiratory illnesses (pneumonia,27 influenza-like-
illness,122 recurrent respiratory tract infections121 and wheezing illness237). Factors
associated with poor parental QoL were as follows: high illness severity,27,122
presence of co-morbidities in the child,237 high number of doctor visits,122, 237 and time
spent caring for the child.118,122 Further, in children with an asthma exacerbation, one
study found caregiver functional status (an element of QoL) was significantly poorer
when their child required a visit to ED and/or were hospitalized.238 It is unclear,
however, whether these findings are valid for the whole spectrum of respiratory
illnesses with cough. To date, no studies have examined which child, family, or illness-
related factors may influence cough-specific QoL at the time of presentation to an
ED, and over the duration of the illness.
Thus, we aimed to inform clinical practice and future research by exploring cough-
specific QoL over the course of an ARI in children. Our primary objective was to
determine cough-specific QoL among children aged <15 years with an ARI with cough
(ARIwC), at the time of presentation to an ED, and throughout the transitional period
to chronic cough. Our secondary objective was to identify what factors influence
cough-specific QoL over this same time period.
7.3 METHODS
7.3.1 Study design and participants
This study is an analysis of baseline and follow-up QoL data collected through a
prospective cohort study of children presenting at a pediatric ED with ARIwC in
Brisbane, Australia between July 2013 and August 2014. The original protocol for the
study has been described elsewhere.162 Briefly, children aged <15 years presenting to
the ED with parent-reported cough were eligible to enroll. Children aged 16-18 years
old were not included as the participating ED required children in this age bracket to

Chapter 7: Longitudinal study of quality of life among children with acute respiratory infection and cough
173
present to an adult emergency department if they were not an existing patient.
Children were excluded if they had chronic lung disease (excluding asthma),
immunosuppressive conditions, used immunomodulating drugs during the 30 days
prior to presentation, and/or insufficient English to complete the study requirements.
Children were surveyed weekly for 4 weeks following enrolment. If contact was
unsuccessful for 2 consecutive weeks, children were considered lost-to-follow-up
(LTFU).
Written informed consent was obtained from all parent(s)/guardian(s) included in
the study, and written assent was obtained from children aged ≥12 years included in
the study. The study was approved by the ethics committees of the Queensland
Children’s Health Services (HREC/11/QRCH/83), The University of Queensland
(2012000700) and the Queensland University of Technology (1400000057).
7.3.2 Data collection and variables
Explanatory variables were collected at baseline and at the weekly follow-ups. The
characteristics presented in Table 7.1 were collected only at baseline through a
parent/guardian-completed questionnaire whilst in ED (questionnaire available with
published protocol (Appendix B162)). All data presented in Table 7.2 were collected at
baseline and in the weekly follow-up surveys, which were undertaken via phone,
email and through parent-completed cough diary cards. The outcome variable, QoL,
was assessed at baseline and weekly follow-ups using the validated ‘Parent-proxy
Children’s Acute Cough-specific Quality of Life’ questionnaire (PAC-QoL).43 PAC-QoL
is a 16-item questionnaire that uses a 7-point Likert type scale (1=highest level of
burden/concern, 7=lowest) to evaluate parent-proxy cough-specific QoL in the
previous 24 hours. The minimally importance difference (MID) for the PAC-QoL
questionnaire is estimated to be between 0.74 and 1.18.43
Children who had not stopped coughing for ≥3 consecutive days during the study
period21,149 were considered to have developed chronic cough at the 4-week time
point. If it was known that the cough had stopped prior to LTFU, they were considered

174 Chapter 7: Longitudinal study of quality of life among children with acute respiratory infection and cough
not to have chronic cough. Cough severity was parent-reported and determined using
a validated verbal category descriptive scale (Table 3.5).41 Cough severity was
recorded at baseline and weekly contacts.
7.3.3 Statistical analyses
Statistical analyses, including graphics, were conducted using Stata13 (StataCorp,
Texas, USA). Binary logistic regression was used to examine differences in the
characteristics of children who were enrolled and children who were not. Binary
logistic regression was also used to analyze differences in the characteristics of
children who completed the study and children who were LTFU/ withdrawn.
The outcome variable, PAC-QoL, was summarized for the whole cohort at each time
point (baseline, Days-7, -14, -21 and -28). Participants who had an incomplete PAC-
QoL questionnaire at a time point were considered as ‘missing’ QoL data for that time
point. Total individual PAC-QoL scores were calculated as per previous methods43 by
summing the responses for each of the 16 items. A mean individual PAC-QoL score
was then generated by dividing each individual’s total score by 16. Medians and inter-
quartile ranges (IQR) were used to describe PAC-QoL scores of the cohort as the data
had a non-normal distribution.
Demographic, household, medical history, ED presentation, and illness/burden-
related factors (Table 7.1, Table 7.2) were treated as explanatory variables. A linear
regression model was used to identify which explanatory variables were influencing
PAC-QoL scores at baseline. A linear mixed-effects model239 was used to investigate
which explanatory variables were influencing PAC-QoL scores over the 4 weeks
following enrolment. The explanatory variables were entered as fixed effects. The
unique identifier of each individual was used as a random intercept in order to test,
and account, for any correlation between measurements of the same individual.
Given there was only one random effect included in the mixed-effects model, an
identity covariance structure was used.240 Children with missing QoL data at all
timepoints were excluded from all of the above analyses. Children with missing QoL

Chapter 7: Longitudinal study of quality of life among children with acute respiratory infection and cough
175
data at baseline were excluded from the baseline linear regression analysis. Children
with at least 1 completed PAC-QoL questionnaire at any time point were included in
the mixed model analysis.
For both models described above, bivariate analyses were conducted to identify the
explanatory variables to be included in the final models. Variables with a p value of ≤
0.1 in the bivariate analyses were entered into multivariable models. A backwards
elimination approach was taken to obtain the final models; variables with a p value
of <0.05 in any levels of that variable were retained. Sex of the child was retained as
an explanatory variable in both models, as it is usually considered a risk factor in
pediatric respiratory health, and therefore considered important to account for
irrespective of statistical significance. Our methods of model selection are consistent
with those recommended by Zuur et al.241
For the baseline linear regression model, likelihood ratio tests and the adjusted R2
value were used to select the most parsimonious model. Sensitivity analyses were
conducted to identify participants with highly influential and/or abnormal data. For
the mixed-effects model, the model was tested with and without ‘time point’ as a
fixed effect, and also with and without ‘time point’ as a random effect. The most
parsimonious model was selected based on likelihood ratio tests and Bayesian
information criterion (BIC) values. Both of the final models were validated graphically
and analytically.
7.4 RESULTS
7.4.1 Participants
During the enrolment period, 1149 children were screened and 292 (25.4%) enrolled.
Amongst those children not enrolled (n=857), 31.2% were ineligible, 25.8% refused
consent, 42.0% were not enrolled for other reasons (e.g. rapid assessment and
discharge, child was too ill), and 1.0% unknown. There were no differences between
children enrolled and not enrolled with respect to gender (p=0.26) and season of

176 Chapter 7: Longitudinal study of quality of life among children with acute respiratory infection and cough
enrolment (p=0.15), however the groups differed according to age and triage
category. Those aged ≥12 months were more likely to be enrolled compared to those
<12 months. Those in triage category 5 (least serious classification) were less likely to
be enrolled relative to the other triage categories (p<0.01 for both variables). During
the study period, there were 101 (34.6%) children who withdrew or were LTFU.
Children from families with younger fathers and/or no private health insurance for
their child were significantly more likely to withdraw or be LTFU (p<0.01). Nine
children (3.1%) had no QoL data collected at any time point, leaving 283 (96.9%)
children who had at least one questionnaire completed, and were therefore eligible
for inclusion in baseline and/or follow-up analyses.
7.4.2 Descriptive data
The median age of the 283 included children was 2.3 years (IQR 1.2-4.6). At Day-28,
46 children (16.3%) reported having chronic cough, whereas 153 (54.1%) had stopped
coughing and 84 (29.7%) had an unknown cough status. Additional demographic,
household, medical history and ED presentation characteristics are presented in
Table 7.1. Overall, our study population is comparable to the broader Queensland
population in terms of education, employment and income.242-244 There was a greater
proportion of males and children with asthma in our study population,245,246 however
this is to be expected in a study on paediatric ARI. Illness- and burden-related
characteristics of the cohort at baseline and at each weekly follow-up are displayed
in Table 7.2.
Table 7.1. Time-invariant child characteristics of the study cohort, N=283. Demographic characteristics n (%) Indigenous status
Indigenous 7 (2.5) Non-Indigenous 276 (97.5) Missing 0 (0.0)
Gender Male 177 (62.5) Female 105 (37.1) Missing 1 (0.4)
Age of child at enrolment (in years) <1 55 (19.4)

Chapter 7: Longitudinal study of quality of life among children with acute respiratory infection and cough
177
1 to <2 76 (26.9) 2 to <5 85 (30.0) 5 to <10 49 (17.3) 10 to <15 17 (6.0) Missing 1 (0.4)
Age of mother at enrolment (in years) <25 27 (9.5) 25 to <30 55 (19.4) 30 to <35 82 (29.0) 35 to <40 75 (26.5) >40 43 (15.2) Missing 1 (0.4)
Age of father at enrolment (in years) <25 9 (3.2) 25 to <30 41 (14.4) 30 to <35 74 (26.2) 35 to <40 72 (25.4) >40 78 (27.6) Missing 9 (3.2)
Maternal educational attainment High school (or lower) 65 (22.9) Post school (Certificate or Diploma) 76 (26.9) Tertiary (Under- or post-graduate qualification) 139 (49.1) Missing 3 (1.1)
Paternal educational attainment High school (or lower) 59 (20.8) Post school (Certificate or Diploma) 76 (26.9) Tertiary (Under- or post-graduate qualification) 131 (46.3) Missing 17 (6.0)
Employment status of mother Employed full-time 85 (30.0) Employed part-time 88 (31.1) Employed casual 21 (7.4) Not employed 76 (26.9) Missing 13 (4.6)
Employment status of father Employed full -time 227 (80.2) Employed part-time 10 (3.5) Employed casual 14 (5.0) Not employed 10 (3.5) Missing 22 (7.8)
Total household income per annum ($AU) ≥200,00 31 (10.9) 156,000 to <200,000 44 (15.5) 104,000 to <156,000 65 (23.0) 78,000 to <104,000 44 (15.6) 52,000 to <78,000 37 (13.1) <52,000 34 (12.0) Missing 28 (9.9)
Family has private health insurance that covers the child No 102 (36.0)

178 Chapter 7: Longitudinal study of quality of life among children with acute respiratory infection and cough
Yes 178 (62.9) Missing 3 (1.1)
Family is on a pension No 212 (74.9) Yes 66 (23.3) Missing 5 (1.8)
HOUSEHOLD CHARACTERISTICS Number of children living in household
1 90 (31.8) 2 120 (42.4) ≥3 73 (25.8) Missing 0 (0.0)
Pets living in the household No 139 (49.1) Yes 144 (50.9) Missing 0 (0.0)
Household exposure to tobacco smoke No 228 (80.6) Yes 51 (18.0) Missing 4 (1.4)
FAMILY AND CHILD MEDICAL HISTORY Family history of lung disease
No 236 (83.4) Yes 43 (15.2) Missing 4 (1.4)
Child’s birthweight (grams) ≥2500 247 (87.3) <2500 24 (8.5) Missing 12 (4.2)
Child’s gestational age (weeks) ≥ 37 247 (87.3) <37 34 (12.0) Missing 2 (0.7)
Child previously diagnosed with a respiratory illness No 113 (39.9) Yes 170 (60.1) Missing 0 (0.0)
Child previously diagnosed with asthma No 222 (78.4) Yes 59 (20.9) Missing 2 (0.7)
Child previously hospitalized for a respiratory illness No 213 (75.3) Yes 70 (24.7) Missing 0 (0.0)
Child had wheeze in the past 12 months No 138 (48.8) Yes 142 (50.1) Missing 3 (1.1)
Number of times child has had cough lasting >4 weeks 0 217 (76.7)

Chapter 7: Longitudinal study of quality of life among children with acute respiratory infection and cough
179
1 40 (14.1) ≥2 21 (7.4) Missing 5 (1.8)
Child has other medical conditions No 216 (76.3) Yes 64 (22.6) Missing 3 (1.1)
ED PRESENTATION CHARACTERISTICS Season of presentation
Summer 41 (14.5) Autumn (Fall) 79 (27.9) Winter 120 (42.4) Spring 43 (15.2)
Duration of current cough (in days) <3 108 (38.1) 3 to <14 116 (41.0) 14 to <28 28 (9.9) >28 28 (9.9) Missing 3 (1.1)
Triage category 5 (least urgent) 2 (0.7) 4 73 (25.8) 3 104 (36.7) 2 99 (35.0) 1 (most urgent) 4 (1.4) Missing 1 (0.4)

180 Chapter 7: Longitudinal study of quality of life among children with acute respiratory infection and cough
Table 7.2. Time-variant child characteristics of the study cohort, N=283. Variable n (%) of whole cohort Baseline Day 7 Day 14 Day 21 Day 28 Day cough severity scorea
0 (least severe) 4 (1.4) 47 (16.6) 99 (35.0) 92 (32.5) 102 (36.1) 1 11 (3.9) 49 (17.3) 50 (17.6) 46 (16.2) 21 (7.4) 2 31 (11.0) 53 (18.7) 28 (9.9) 24 (8.5) 26 (9.2) 3 57 (20.1) 48 (16.9) 23 (8.1) 18 (6.4) 21 (7.4) 4 64 (22.6) 16 (5.7) 8 (2.8) 4 (1.4) 6 (2.1) 5 (most severe) 31 (11.0) 3 (1.1) 1 (0.4) 2 (0.7) 0 (0.0) Missing 85 (30.0) 67 (23.7) 74 (26.2) 97 (34.3) 107 (37.8)
Night cough severity scorea 0 (least severe) 11 (3.9) 66 (23.3) 116 (41.0) 104 (36.7) 106 (37.4) 1 22 (7.8) 60 (21.2) 31 (11.0) 32 (11.3) 26 (9.2) 1b 13 (4.6) 25 (8.8) 16 (5.6) 11 (3.9) 10 (3.5) 2 46 (16.2) 37 (13.1) 28 (9.9) 21 (7.4) 19 (6.7) 3 76 (26.8) 18 (6.3) 14 (4.9) 9 (3.2) 8 (2.8) 4 60 (21.2) 5 (1.8) 4 (1.4) 8 (2.8) 5 (1.8) 5 (most severe) 52 (18.4) 3 (1.1) 0 (0.0) 1 (0.4) 1 (0.4) Missing 3 (1.1) 69 (24.4) 74 (26.2) 97 (34.3) 108 (38.2)
Child seen a healthcare provider in past week Yes 192 (67.8) 53 (18.7) 25 (8.8) 33 (11.7) 11 (3.9) No 91 (32.2) 128 (45.2) 150 (53.0) 131 (46.3) 145 (51.2) Missing 0 (0.0) 102 (36.1) 108 (38.2) 119 (42.0) 127 (44.9)
Child missed usual activity Yes 77 (27.2) 69 (24.4) 21 (7.4) 6 (2.1) 10 (3.5) No 204 (72.1) 115 (40.6) 156 (55.1) 159 (56.2) 147 (52.0) Missing 2 (0.7) 99 (35.0) 106 (37.5) 118 (41.7) 126 (44.5)
Primary carer missed usual activity Yes 79 (27.9) 89 (31.5) 14 (4.9) 13 (4.6) 11 (3.9) No 203 (71.7) 94 (33.2) 161 (56.9) 150 (53.0) 146 (51.6) Missing 1 (0.4) 100 (35.3) 108 (38.2) 120 (42.4) 126 (44.5)
Parent/guardian worried about money Very, very/ very 14 (4.9) 18 (6.4) 4 (1.4) 9 (3.2) 1 (0.4) Fairly/somewhat 32 (11.3) 31 (10.9) 16 (5.7) 14 (4.9) 12 (4.3) A little/ hardly 58 (20.5) 63 (22.3) 26 (9.2) 20 (7.1) 25 (8.8) Not 179 (63.3) 71 (25.1) 128 (45.2) 122 (43.1) 115 (40.6) Missing 0 (0.0) 100 (35.3) 109 (38.5) 118 (41.7) 130 (45.9)
Child had medications in past week Yes 257 (90.8) 123 (43.5) 44 (15.6) 47 (16.6) 39 (13.8) No 26 (9.2) 53 (18.7) 124 (43.8) 113 (39.9) 114 (40.3) Missing 0 (0.0) 107 (37.8) 115 (40.6) 123 (43.5) 130 (45.9)
Child had tests/investigations in past week Yes 36 (12.7) 13 (4.6) 4 (1.4) 6 (2.1) 2 (0.7) No 243 (85.9) 168 (59.4) 171 (60.4) 158 (55.8) 149 (52.7) Missing 4 (1.4) 102 (36.0) 108 (38.2) 119 (42.1) 132 (46.6)
aRefer to Table 3.5 for descriptions of each category of the cough severity scores

Chapter 7: Longitudinal study of quality of life among children with acute respiratory infection and cough
181
7.4.3 Outcome data
Of the 283 children who completed at least 1 PAC-QoL questionnaire during the study
period, 268 (94.7%), 177 (62.5%), 169 (59.7%), 162 (57.2%) and 152 (53.7%) children
completed the PAC-QoL questionnaire, at baseline, Days-7,-14, -21 and -28,
respectively. The median PAC-QoL score of the cohort improved over the duration of
the illness (Figure 7.1), however only the changes from baseline to Day-7 and from
Days-7 to -14 were statistically significant (p<0.001).
Baseline: Min = 1.0, max= 6.5, med = 2.7, IQR = 2.1-3.6; Day-7: Min = 1.0, max= 7.0, med =
4.9, IQR = 3.8-6.1; Day-14: Min = 1.0, max= 7.0, med = 6.6, IQR = 5.1-7.0; Day-21: Min = 1.6,
max= 7.0, med = 6.8, IQR = 4.9-7.0; Day-28: Min = 1.1, max= 7.0, med = 7.0, IQR = 5.2-7.0
7.4.4 Baseline model of factors influencing QoL
The baseline model was determined using data from participants with complete
baseline PAC-QoL data (239/283, 84.0%). The final baseline model explained a
significant amount of variation (F (28, 210) =5.62, p<0.001) in baseline PAC-QoL
scores, with an adjusted R2 value of 35.2%. There were seven participants with
Figure 7.1. Box plots of PAC-QoL scores at baseline and weekly follow-ups, includes all children (n=283).

182 Chapter 7: Longitudinal study of quality of life among children with acute respiratory infection and cough
unusual data that were having a considerable influence on the results; we ran the
model excluding these children and those results are presented in the supplementary
material (Appendix G). Throughout the remainder of the paper, we refer to the model
with the seven participants included.
We found eight variables independently and significantly associated with PAC-QoL
scores at baseline (Table 7.3). These were as follows: child’s age, father’s age,
maternal educational attainment, having private health insurance, wheezing in the
past 12 months, day-cough severity, night-cough severity, and being worried about
the amount of money spent on the current cough illness (i.e. financial concerns).

Chapter 7: Longitudinal study of quality of life among children with acute respiratory infection and cough
183
Table 7.3. Baseline multiple linear regression model, N=239. Variable Coeffa (95% CI) p value Intercept 1.89 (1.11, 2.67) <0.001 Gender
Female Ref 0.236 Male 0.15 (-0.10, 0.42)
Age of child at enrolment (in years) <1 Ref 0.107 1 to <2 0.21 (-0.17, 0.59) 2 to <5 0.44 (0.05, 0.82) 5 to <10 0.50 (0.03, 0.98) 10 to <15 0.73 (0.03, 1.44)
Age of father at enrolment (in years) <25 Ref 0.175 25 to <30 -0.77 (-1.54, -0.01) 30 to <35 -0.79 (-1.52, -0.05) 35 to <40 -0.59 (-1.35, 0.17) >40 -0.51 (-1.27, 0.25)
Day cough severity scoreb 0 (least severe) Ref 0.007 1 1.42 (0.24, 2.62) 2 1.05 (-0.02, 2.12) 3 1.04 (-0.01, 2.10) 4 0.62 (-0.43, 1.67) 5 (most severe) 0.31 (-0.76, 1.39) N/A 0.87 (-0.17, 1.91)
Night cough severity scoreb <0.001 0 (least severe) Ref 1 -0.58 (-1.41, 0.25) 1b -0.73 (-1.65, 0.19) 2 -1.20 (-1.96, -0.43) 3 -1.49 (-2.24, -0.74) 4 -1.62 (-2.39, -0.86) 5 (most severe) -2.09 (-2.85 -1.32)
Maternal educational attainment High school (or lower) Ref 0.100 Post school (Certificate or Diploma) 0.41 (0.03, 0.79) Tertiary (Under- or post-graduate qualification) 0.31 (-0.06, 0.68)
Wheeze in the past 12 months No Ref 0.007 Yes -0.37 (-0.64, -0.10)
Private health insurance that covers the child No Ref 0.054 Yes 0.30 (-0.01, 0.61)
Parent/ guardian worried about money Not Ref 0.014 Hardly/ A little -0.38 (-0.71, -0.04) Somewhat / Fairly -0.57 (-1.00, -0.14) Very / Very, very -0.54 (-1.26, 0.17)
aCoeff unstandardized regression coefficients bSee Table 3.5 for cough severity descriptions
184 Chapter 7: Longitudinal study of quality of life among children with acute respiratory infection and cough
7.4.5 Follow-up model of factors influencing QoL
Given missing data at one or more of the follow-up points, the follow-up model used
data from 250/283 (88.3%) children and 742/1415 (52.4%) data collection
timepoints. Comparing the median PAC-QoL scores of those who completed the PAC-
QoL questionnaire at all five time-points with those who had not, we found no
significant differences in PAC-QoL scores between the groups. Additionally we ran
the final model, both including, and excluding (data not shown), those children who
had not completed all five PAC-QoL questionnaires; there were no meaningful
differences between the models. Therefore we retained all study participants who
had completed at least one PAC-QoL questionnaire in the final follow-up model. Of
the children that completed at least one QoL survey, 78 (43.6%) completed only one,
24 (13.4%) completed two, 26 (14.5%) completed three and 51 (28.5%) completed
four.
Nine factors were significantly associated with PAC-QoL scores over the four weeks
following enrolment (Table 7.4). Interestingly, three of these factors (day-cough
severity, night-cough severity and financial concerns) were also identified in the
baseline model. The other six significant independent factors were as follows: time
point, paternal educational attainment, number of children in the household and
whether in the past week, as a result of the cough illness: a) the child took any
medications, b) the child saw a health professional or c) the primary carer missed any
usual activities.

Chapter 7: Longitudinal study of quality of life among children with acute respiratory infection and cough
185
Table 7.4. Follow-up linear mixed model, N=250.
aCoeff unstandardized regression coefficients bSee Table 3.5 for cough severity descriptions
Variable Coeffa (95% CI) p value Intercept 5.83 (5.48, 6.18) <0.001 Gender
Female Ref 0.49 Male 0.07 (-0.13, 0.27)
Timepoint Baseline Ref <0.001 Day 7 0.67 (0.41, 0.93) Day 14 0.78 (0.51, 1.05) Day 21 0.81 (0.54, 1.08) Day 28 0.80 (0.52, 1.08)
Paternal educational attainment High school (or lower) Ref 0.01 Post school (Certificate or Diploma) 0.13 (-0.14, 0.40) Tertiary (Under- or post-graduate qualification) 0.35 (0.11, 0.59)
Number of children in the household 1 Ref <0.001 2 0.41 (0.18, 0.63) ≥3 0.38 (0.13, 0.63)
Day cough severity scoreb 0 (least severe) Ref <0.001 1 -0.42 (-0.65, -0.19) 2 -0.72 (-0.99, -0.44) 3 -1.08 (-1.38, -0.79) 4 -1.30 (-1.66, -0.94) 5 (most severe) -1.54 (-1.99, -1.09)
Night cough severity scoreb 0 (least severe) Ref <0.001 1 -0.39 (-0.63, -0.16) 1b -0.48 (-0.80, -0.15) 2 -0.96 (-1.24, -0.67) 3 -1.38 (-1.69, -1.07) 4 -1.52 (-1.90, -1.13) 5 (most severe) -1.90 (-2.35, -1.45)
Child had medications in past week No Ref 0.047 Yes -0.19 (-0.37, -0.002)
Child seen a healthcare provider in past week No Ref 0.008 Yes -0.25 (-0.44, -0.07)
Carer missed a usual activity in the past week No Ref <0.001 Yes -0.46 (-0.65, -0.27)
Parent/guardian worried about money Not Ref <0.001 Hardly/ a little -0.26 (-0.44, -0.07) Somewhat / fairly -0.52 (-0.76, -0.28) Very / very, very -1.15 (-1.54, -0.77)
186 Chapter 7: Longitudinal study of quality of life among children with acute respiratory infection and cough
7.5 DISCUSSION
To our knowledge, this is the first study to have evaluated cough-specific QoL
repeatedly over the transitional period of acute to chronic cough. Among a cohort of
children with ARIwC, we found that PAC-QoL scores were low at enrolment but
improved considerably over the follow-up period, significantly over the first 2 weeks.
The low QoL at enrolment is not surprising, given it was related to the 24 h prior to
presentation to an ED. The highest burden was in the first 14 days (significant
difference between baseline and Day-7, and Day-7 and Day-14 PAC-QoL scores) and
considerably less over the subsequent 2 weeks (no significant changes from Day-14
onwards). Given that 88/292 (30.1%) of children experienced a resolution of their
cough by Day-14, this result is also not surprising. However, as there are no studies
that have examined QoL among children with ARIs and/or cough at more than two
time points over the duration of the illness, it is difficult to confirm our findings.
Three independent factors (day-cough severity, night-cough severity, financial
concerns) were significantly associated with PAC-QoL scores in both the baseline and
follow-up regression models. There were five other factors unique to the baseline
model (Table 7.3) and six unique to the follow-up model (Table 7.4).
Of the three significant factors common to both the baseline and follow-up model,
two of these factors (day-cough severity and night-cough severity) are not surprising
as the QoL assessed was cough-specific. The third factor (financial concerns) is,
however, new. No previous pediatric respiratory studies have examined the effect of
financial concerns on QoL, but some studies have described the effect of income.
Among children aged <7 years with mild wheeze, QoL was poorer for families with a
higher level of social deprivation,247 however another study122 found that among
children with influenza, total household income had a weak and non-significant
correlation with QoL. Both of these studies were community-based and hence
different to our ED-based setting cohort.

Chapter 7: Longitudinal study of quality of life among children with acute respiratory infection and cough
187
Of the five other factors unique to the baseline model, many were not unexpected.
The positive association between educational attainment and QoL is similar to other
studies that have described the impact of education on physical and mental
health.248,249 The presence and severity of wheezing among children has previously
been reported to negatively impact sleep quality and be moderately correlated with
HR-QoL.250,251 The effect of private health insurance is likely to be related to financial
concerns and income as described above.
The influence of age on QoL during respiratory illnesses has been studied previously,
but results have been inconclusive. Some studies126,237 report results consistent with
our finding that older age of the child is associated with better QoL, while others84,122
report no effect of child’s age on QoL. With respect to parental age, a previous study
reported that among children with mild wheeze, younger mothers (≤30 years) had
poorer QoL, relative to older mothers (>30 years).247 In our study, being an older
father (≥25 years) was associated with poorer QoL, relative to younger fathers (<25
years). The reason for the difference in the importance of mother’s and father’s age
is unclear and warrants further investigation.
With respect to the follow-up model the effect of healthcare visits on QoL in pediatric
respiratory illnesses has been reported previously. However, many of these studies
have limited comparability to our study, given they examined the effect of healthcare
visits in the previous 6-12 months,84,236,237 as opposed to the previous week. One
study, however, found that in children presenting to ED252 with febrile illness, parent-
proxy QoL 7-10 days post-ED presentation was significantly poorer for children who
had experienced a ‘non-scheduled return to healthcare’ since presentation,
compared to children who had not. While we did not distinguish between scheduled
and non-scheduled, all healthcare visits included in our analyses related to the cough
illness.
Having taken medications and the primary carer having missed usual activities in the
past week were also associated with poorer QoL at follow-up. Few studies have
previously examined the effect of medication on QoL. Among children with wheezing

188 Chapter 7: Longitudinal study of quality of life among children with acute respiratory infection and cough
illness, use of inhaled corticosteroids in the past four weeks was associated with a
decrease in QoL, compared to no use, whereas use of bronchodilators had no effect
on QoL.237 As we did not conduct our analyses according to type of medication, we
cannot confirm these findings.
While a number of studies118,122 have previously reported that the amount of time a
parent/guardian spends caring for their sick child has a considerable influence on
QoL, this factor was not found to significantly influence QoL in our study. Instead, we
found that PAC-QoL scores were significantly influenced by whether the primary
carer had missed any usual activities. These two factors are likely to be very closely
related. However, the additional stress of having to cancel and/or reschedule a usual
activity, in addition to the possible emotional, social and financial impacts of missing
a usual activity, may explain why we found this factor to be significantly associated
with PAC-QoL scores.
There a number of possible reasons why the factors identified as being important in
the baseline model differ from those identified in the follow-up model. Firstly, there
is a distinct difference in settings - it is to be expected that the factors influencing QoL
leading up to and during an ED presentation (baseline timepoint) would differ from
the factors influencing QoL while children are being cared for at home or in the
community (follow-up timepoints). Secondly, on a clinical level in pediatrics, acute
cough (<2weeks duration) differs from subacute cough (2-4 weeks duration) and
chronic cough (>4weeks duration) and it is therefore not surprising that there are
differences in the factors influencing QoL as cough duration changes. Finally, there is
a considerable difference in the sample size used to determine the baseline model
versus the follow-up model, and therefore this may have affected the significance of
different factors and influenced their inclusion in the models.
While the variables included in our baseline and follow-up models were statistically
significant, it is less clear whether their effect on QoL is clinically significant. Given,
the MID for the PAC-QoL questionnaire is estimated to be between 0.74 and 1.18,43
it would appear that the improvements in QoL would be clinically significant between

Chapter 7: Longitudinal study of quality of life among children with acute respiratory infection and cough
189
baseline, Day-7 and Day-14, but not for between Day-14 and Day-21 and Day-28.
Additionally, the effects of cough severity, financial concerns and father’s age have
the potential to independently create clinically significant changes in QoL.
7.5.1 Strengths and limitations
A key strength of this study is the use of the PAC-QoL questionnaire. The PAC-QoL
questionnaire is a relatively short questionnaire (16 items) that is easy to administer
in a clinical setting with minimal burden on the study participants. While there is
inherent bias with parent-reporting of subjective measures such as QoL, this
questionnaire has been validated and is a cough-specific tool. Condition-specific tools
are considered more responsive that generic tools114 and this may have enabled us
to better capture the impact of acute cough on QoL and to enable changes in QoL to
be identified. Previous QoL research has largely been limited to specific respiratory
illnesses or pathogens. Our study is unique in that, with the exception of children with
known chronic lung disease and/or immunosuppressive therapy, it was inclusive of
children with cough, irrespective of diagnosis, facilitating evaluation of the wide
range of respiratory illnesses. Finally, the PAC-QoL questionnaire relates to QoL in the
24 hours prior to each weekly follow-up was assessed prospectively, thereby
reducing the risk of recall bias. However, QoL in the 24 hours prior to questionnaire
completion may not be representative of QoL throughout the previous week.
Between each weekly time point there may have been several increases or decreases
in PAC-QoL scores that we did not capture.
The key limitation of this study is the proportion of children who withdrew or were
LTFU. There was evidence of some attrition bias, with children with younger fathers
and children from families with no private health insurance more likely to withdraw
or be LTFU. As we found that these factors were associated with poorer QoL at
baseline, the exclusion of these participant’s follow-up data may have overestimated
PAC-QoL scores at these timepoints. While it could be argued that a loss of severe
cases during the follow-up period could explain why PAC-QoL increased by Day 14
and onwards, we believe this to be unlikely. We analyzed the association between

190 Chapter 7: Longitudinal study of quality of life among children with acute respiratory infection and cough
cough status at one timepoint and LTFU at the subsequent timepoint and found no
significant associations, i.e. children coughing at one timepoint were no more or less
likely to be LTFU at the next timepoint that children who had stopped coughing.
Furthermore, neither triage category, day-cough severity at baseline or night-cough
severity at baseline were associated with being LTFU.
Compared to all children presenting to EDs with ARIwC, our study cohort may be
over-representative of children with a higher severity of illness and of older children.
Children with less severe illnesses were likely to spend less time in the ED, therefore
the window for potential enrolment and data collection was smaller. While this raises
the possibility of having overestimated the impact of cough on QoL we believe this is
unlikely. We used triage category at baseline as a proxy for illness severity however
triage category is not necessarily indicative of cough severity. Chi-square analysis
found that while day-cough severity and triage category appeared to be significantly
associated (p=0.044), however night-cough severity and triage category were not
(p=0.492). Thus, while our data may be less applicable to young children with mild
cough illness, it is unlikely that we would have overestimated the impact of cough on
QoL.
Although our sample size was relatively large, the applicability of our data to children
with ARIwC from other settings (e.g. primary healthcare settings and rural/remote
areas) is also unknown, but should be explored.
Only 45% of the variance in baseline PAC-QoL scores was explained by the factors
included in our study, thus there are further explanatory factors that are influencing
PAC-QoL scores (e.g. personality traits that may affect parent’s coping skills).
Identification of these factors offers an avenue for future studies.
Finally, due to the possible unreliability of retrospective parent-reporting of cough
duration prior to ED presentation, we administered an acute cough questionnaire
(PAC-QoL) to all participants at baseline and at weekly follow-ups, despite some
parents (9.9%) reporting that their child had a cough for longer than 28 days at the

Chapter 7: Longitudinal study of quality of life among children with acute respiratory infection and cough
191
time of ED presentation. Among these participants, the use of a pediatric chronic
cough QoL tool may have been more appropriate.
7.6 SUMMARY
We found that among children with cough, QoL is impaired at the time of
presentation to ED and over the following weeks, particularly the first two weeks.
Cough severity and financial concerns had the greatest impact on parent-proxy
cough-specific QoL at presentation and during the 4-week follow-up. We also
identified a number of additional independent factors at baseline and follow-up. This
research is important, as understanding which factors influence cough-specific QoL
may indicate who requires additional support throughout their child’s illness, and
help to identify risk factors amenable to intervention. Our findings confirm the
importance of effectively managing cough, both during and post-ARI, to reduce the
clinical burden (cough severity) and the financial burden on children and families. The
effectiveness of future interventions to reduce the burden of acute cough need to be
assessed in terms of their impact on QoL.

192 Chapter 7: Longitudinal study of quality of life among children with acute respiratory infection and cough
Chapter 8: Cost-effectiveness of a chronic cough management algorithm at the transitional stage from acute to chronic cough in children: a multi-centre randomised controlled trial.
193
Cost-effectiveness of a chronic cough management algorithm at the transitional stage from acute to chronic cough in children: a multi-centre randomised controlled trial.
This chapter reports on the analysis of data collected on resource use and cough
outcome to determine the cost-effectiveness of a cough management algorithm. This
analysis was performed on children who were enrolled in the Researching
Intervention in Chronic Cough in Kids (RICCi) study and were subsequently
randomised. The original study aimed to randomise 214 children however due to
recruitment and funding issues, the study was stopped early, resulting in a total of
117 children randomised.
It comprises the following manuscript which is currently nearing submission: Lovie-
Toon YG, McPhail SM, Chang AB, Vagenas D, Otim M, O’Grady KF. Cost-effectiveness
of a cough management algorithm at the transitional stage from acute to chronic
cough in Australian children aged <15 years: a randomised controlled trial.
This chapter addresses research question 3: Among Indigenous and non-Indigenous
Australian children aged <15 years presenting to primary healthcare clinics and/or
EDs who develop chronic cough following an episode of ARIwC, is early intervention
using a cough management algorithm cost-effective at achieving cough resolution
from the perspective of the public healthcare system and caretakers?
194 Chapter 8: Cost-effectiveness of a chronic cough management algorithm at the transitional stage from acute to chronic cough in children: a multi-centre randomised controlled trial.
8.1 ABSTRACT
Aim: Chronic cough is a concerning health outcome from a clinical, economic and
quality of life perspective. Randomised controlled trials investigating interventions to
manage and resolve chronic cough among children are limited and have focused
primarily on clinical effectiveness. The aim of this study was to examine the cost-
effectiveness of early intervention, in comparison to usual care, using a cough
management algorithm to achieve cough resolution among Australian Indigenous
and non-Indigenous children aged <15 years who developed chronic cough post-ARI.
Method: This study was to conduct a trial-based economic evaluation (incremental
cost-effectiveness [ICER]) conducted from the perspective of the public healthcare
system and caretakers. The outcome of cough resolution and the costs associated
with the management of the cough illness were collected for 4 weeks post-
randomisation. ICERs and the probability of that the intervention was both less costly
and more effective were estimated by bootstrap resampling trial data. Sensitivity
analyses were conducted using a per-protocol approach to the analysis.
Results: In the intention-to-treat analysis (n=90), the ICER (cost per additional cough
resolution) was $704 and $-488 (cost saving) from the perspective of the public
healthcare system and caretakers, respectively. The probability that the intervention
was cheaper and more effective was 8% and 52% from the perspective of the public
healthcare system and caretakers, respectively. The estimates of ICERs increased
considerably in the per-protocol analysis (n=76) for both cost perspectives, and
consequently, the probability that the intervention was cheaper and more effective
decreased.
Conclusion: This economic evaluation found that the use of a cough management
algorithm at the transitional stage from acute to chronic cough was most likely to be
cheaper and more effective than usual care, from the perspective of caretakers.
Chapter 8: Cost-effectiveness of a chronic cough management algorithm at the transitional stage from acute to chronic cough in children: a multi-centre randomised controlled trial.
195
Further research is required to validate these findings in larger samples and different
settings and populations.

196 Chapter 8: Cost-effectiveness of a chronic cough management algorithm at the transitional stage from acute to chronic cough in children: a multi-centre randomised controlled trial.
8.2 INTRODUCTION
Acute respiratory infections (ARIs) are frequently experienced among Australian
children.51,53 The development of chronic cough (cough duration >4 weeks29)
following an ARI is estimated to occur in up to 25% of episodes.34,36 Chronic cough is
problematic from a clinical, economic and quality of life (QoL) perspective. Chronic
cough, particularly when the cough is wet, may be associated with the development,
progression, or represent an underlying presence, of a chronic respiratory disease.24
Furthermore, chronic cough is associated with substantial levels of healthcare
utilisation and decreased QoL.84 Prior work has also indicated that chronic cough
post-ARI has a high cost of illness in comparison to ARIs with shorter cough
duration.196
Despite the significance of chronic cough there are very few randomised controlled
trials (RCTs) investigating interventions to manage and resolve chronic cough among
children. One intervention that has been examined among Australian children is the
use of an evidence-based cough management algorithm.149 The algorithm guides
clinicians with respect to clinical observations, investigations, and courses of action
to undertake, in order to diagnose and treat the cough illness. The effectiveness of
this intervention at achieving cough resolution was supported by findings from a RCT
of 272 children referred to tertiary respiratory medicine centres across Australia with
chronic cough.149 The proportion of children with cough resolution at six weeks post-
randomisation was higher in the intervention group (absolute risk reduction 24.7%,
95% confidence interval [CI] 13, 35). The intervention group also had better QoL
scores than the usual care group (mean difference = 0.6; 95% CI 0.3, 1.0, QoL
measured on a 1-7 scale with 1 indicating poor QoL).149 Among the total study cohort,
the median cough duration at study enrolment was 16 weeks, meaning a
considerable proportion of children received the intervention several months after
they first developed chronic cough.
A recent RCT examined the effectiveness of this algorithm at achieving cough
resolution when implemented at the onset of chronic cough following an ARI (i.e. 4

Chapter 8: Cost-effectiveness of a chronic cough management algorithm at the transitional stage from acute to chronic cough in children: a multi-centre randomised controlled trial.
197
weeks post-enrolment) among a cohort of 115 Australian Indigenous and non-
Indigenous children.253 In this study, participants were recruited from primary
healthcare services and emergency departments (ED). Children randomised to the
intervention had an increased likelihood of cough resolution by 4-weeks post-
randomisation compared to children randomised to usual care (adjusted odds ratio
= 1.5; 95% CI 1.3, 1.6). While both these studies suggest that the use of this algorithm
among children with chronic cough is effective at achieving cough resolution,
whether its use among Australian children is cost-effective remains unknown.
Indeed, to date, there have been no trial-based cost-effectiveness studies involving
chronic cough in children.
The objective of the present study was to conduct a trial-based economic evaluation
to examine the cost-effectiveness of the cough management algorithm, in
comparison to usual care. The present study uses data collected alongside the most
recent trial253 of Australian Indigenous and non-Indigenous children who developed
chronic cough post-ARI.
8.3 METHODS
8.3.1 Study design
This study was a trial-based economic evaluation (incremental cost-effectiveness
analysis) conducted alongside a multi-centre RCT253 that was nested within a
prospective cohort study. The trial protocol has been published (Appendix C)163 and
the study was prospectively registered (Australia New Zealand Clinical Trials Registry
CTRN12615000132549). Methods and procedures underpinning this cost-
effectiveness study are summarised below.
8.3.2 Participants and setting
This study enrolled children aged <15 years who presented to one of six participating
healthcare services (three primary care clinics and three EDs) in South-East
Queensland with an ARI with cough (ARIwC) between July 2015 and October 2018.253
Further details regarding the inclusion and exclusion criteria were presented in

198 Chapter 8: Cost-effectiveness of a chronic cough management algorithm at the transitional stage from acute to chronic cough in children: a multi-centre randomised controlled trial.
Section 3.3.4 of this thesis. To determine whether children developed a chronic
cough, and were therefore eligible for the randomised trial, a parent/guardian of
each enrolled child was contacted weekly for the four weeks following presentation
to one of the participating healthcare services. Children who reported no break in
cough of ≥3 consecutive days and nights during this four week period were eligible
for randomisation to either the intervention group or the usual care group.
Institutional ethical approval was provided by Children’s Health Queensland
(HREC/15/QRCH/15) and the Queensland University of Technology (UREC
1500000132). Written informed consent was obtained from parent(s)/guardian(s),
and written assent was obtained from children aged ≥12 years.
8.3.3 Randomisation and masking
Randomisation was stratified by reason for presentation (ARIwC or another reason
with an ARIwC noted incidentally), study site and total cough duration at time of
randomisation (<6 weeks or ≥6 weeks). Research staff collecting data from
participants were not blinded to the allocation group of the participant given the
necessity of questions regarding resource use and follow-up related specialist
consultations for their child’s cough. Blinding to allocation group was not feasible for
participants, however purposeful deception regarding randomisation was approved
by the Human Research Ethics Committee in accordance with Australian Ethics in
Human Research guidelines. At enrolment, parents/guardians were informed that if
their child developed chronic cough during the study period, they would be offered
a review of their child’s cough by a paediatrician, at some point during the study.
Parents/guardians were not informed they would be randomised to this medical
review, nor the specifics of when or how that would happen.
8.3.4 Intervention and usual care
The trial intervention consisted of a consultation with a paediatrician who reviewed
the child’s cough illness according to an evidence-based cough management
algorithm for children with chronic cough.149 Clinical management provided to the
child by the paediatrician depended on the presence of specific or non-specific-cough

Chapter 8: Cost-effectiveness of a chronic cough management algorithm at the transitional stage from acute to chronic cough in children: a multi-centre randomised controlled trial.
199
pointers, as indicated by the algorithm, at the time of intervention (Appendix H,
Figure H1 and Figure H2). Parents/guardians of children allocated to the usual care
group were advised to continue to manage their child’s cough illness as per normal,
including seeking healthcare if and when they usually would.
8.3.5 Effectiveness outcome for economic evaluation
Cough resolution by 4-weeks post-randomisation was the outcome measure for this
economic evaluation. Cough resolution was categorised as yes, no or unknown, and
was determined through parent/guardian report at weekly contacts. Children who
experienced a break in cough of ≥3 consecutive days and nights at any point between
randomisation and 4-weeks post-randomisation were considered to have
experienced cough resolution. Additionally, children who experienced a ≥75%
decrease in the mean of day and night cough severity scores (assessed using a verbal
category descriptive scale41) between these same timepoints were also considered
to have experienced cough resolution.
8.3.6 Perspective and time horizon
Costs were evaluated from the perspective of both the public healthcare system and
caretakers, as well as a combined perspective that included both the public
healthcare system and caretakers. Caretakers in this study referred to anyone
involved in the care of the child (whether family or not), but not those whose
professional role was as a ‘caretaker’, i.e. childcare workers or healthcare workers.
These cost perspectives were chosen because previous studies of the cost of ARIs and
cough among Australian children have indicated these perspectives account for over
80% of total illness costs.54,106,196 The time horizon was 4-weeks post-randomisation
(8 weeks post-commencement of cough monitoring for eligibility). Duty of care
obligations required that the algorithm-based intervention also be offered to
participants allocated to the usual care group after this time period; hence, it was not
appropriate to compare costs and outcomes beyond this timeframe. Due to this short
time horizon, discounting of costs and outcomes was not undertaken.
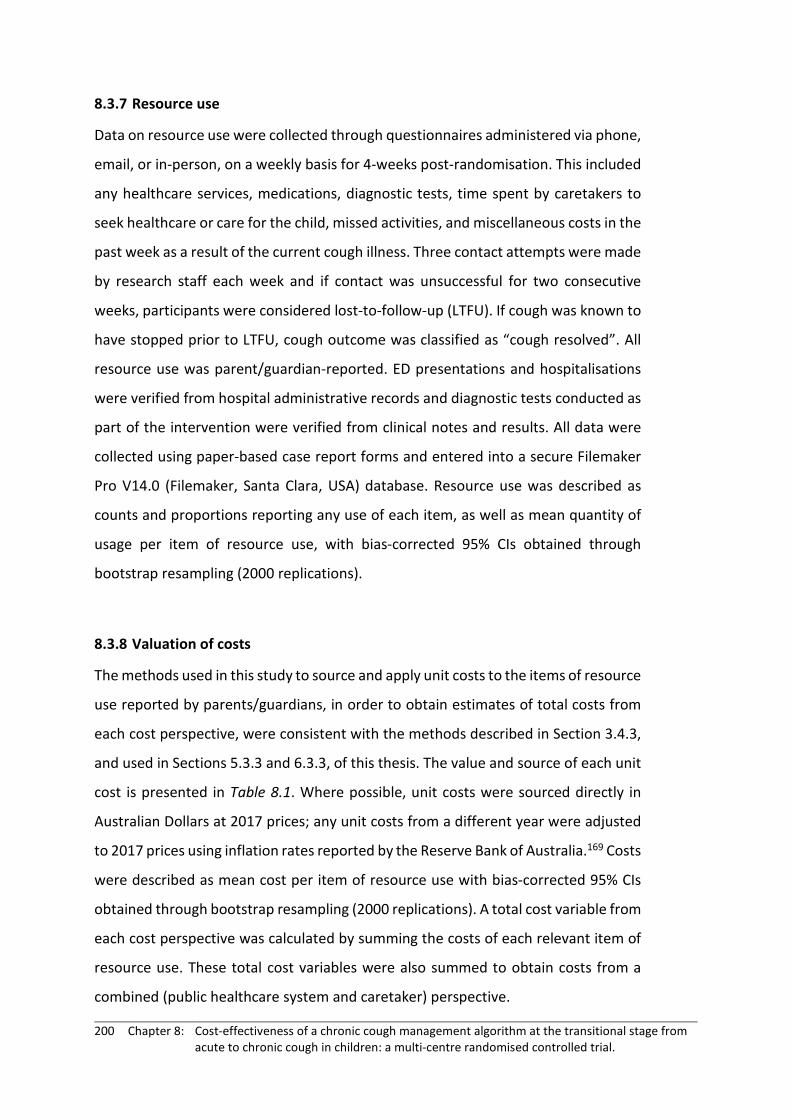
200 Chapter 8: Cost-effectiveness of a chronic cough management algorithm at the transitional stage from acute to chronic cough in children: a multi-centre randomised controlled trial.
8.3.7 Resource use
Data on resource use were collected through questionnaires administered via phone,
email, or in-person, on a weekly basis for 4-weeks post-randomisation. This included
any healthcare services, medications, diagnostic tests, time spent by caretakers to
seek healthcare or care for the child, missed activities, and miscellaneous costs in the
past week as a result of the current cough illness. Three contact attempts were made
by research staff each week and if contact was unsuccessful for two consecutive
weeks, participants were considered lost-to-follow-up (LTFU). If cough was known to
have stopped prior to LTFU, cough outcome was classified as “cough resolved”. All
resource use was parent/guardian-reported. ED presentations and hospitalisations
were verified from hospital administrative records and diagnostic tests conducted as
part of the intervention were verified from clinical notes and results. All data were
collected using paper-based case report forms and entered into a secure Filemaker
Pro V14.0 (Filemaker, Santa Clara, USA) database. Resource use was described as
counts and proportions reporting any use of each item, as well as mean quantity of
usage per item of resource use, with bias-corrected 95% CIs obtained through
bootstrap resampling (2000 replications).
8.3.8 Valuation of costs
The methods used in this study to source and apply unit costs to the items of resource
use reported by parents/guardians, in order to obtain estimates of total costs from
each cost perspective, were consistent with the methods described in Section 3.4.3,
and used in Sections 5.3.3 and 6.3.3, of this thesis. The value and source of each unit
cost is presented in Table 8.1. Where possible, unit costs were sourced directly in
Australian Dollars at 2017 prices; any unit costs from a different year were adjusted
to 2017 prices using inflation rates reported by the Reserve Bank of Australia.169 Costs
were described as mean cost per item of resource use with bias-corrected 95% CIs
obtained through bootstrap resampling (2000 replications). A total cost variable from
each cost perspective was calculated by summing the costs of each relevant item of
resource use. These total cost variables were also summed to obtain costs from a
combined (public healthcare system and caretaker) perspective.

Chapter 8: Cost-effectiveness of a chronic cough management algorithm at the transitional stage from acute to chronic cough in children: a multi-centre randomised controlled trial.
201
Table 8.1. Unit costs for each item of resource use reported by parents/guardians between randomisation and end of study period. Cost item Unit cost Source SECTOR: CARETAKERS Non bulk-billed healthcare attendances†
General practitioner Specialist consultation (including paediatrician) Physiotherapist‡
$41.95 $201.70 $71.65
Australian Medical Association176 Item no. AA020, page 28 Item no. AJ010, page 47
Farag et al., 2013
Medicare Benefits Schedule170 Item no. 23, page 141 Item no. 110, page 151
Diagnostic tests conducted outside of hospitalisation† Allergen specific IgE Culture and microscopy (from nasal swab or NPA) Iron studies Total IgE test Total immunoglobulin A, G and M
$48.20 $39.30 $63.30 $51.45 $59.65
Australian Medical Association176 Item no. PD065, page 408 Item no. PC010, page 402 Item no. PB165, page 394 Item no. PD055, page 408 Item no. PD045, page 408
Medicare Benefits Schedule170 Item no. 71079, page 1056 Item no. 69303, page 1045 Item no. 66596, page 1031 Item no. 71075, page 1055 Item no. 71071, page 1055
Government subsidised medications§ Varies depending on the medication
Schedule of Pharmaceutical Benefits217
Over-the-counter medications Varies depending on the medication
Chemist Warehouse online pharmacy218
Time off work with unpaid leave, all persons¶ $41.26/hour Australian Bureau of Statistics181 Time off non-work activities, all persons¶ $41.26/hour Australian Bureau of Statistics181 Childcare fees already paid N/A Self-reported by person completing questionnaire Child or parent/carer missed activities N/A Self-reported by person completing questionnaire Other miscellaneous costs (e.g. parking and medical supplies)
N/A Self-reported by person completing questionnaire
SECTOR: PUBLIC HEALTHCARE SYTEM Healthcare attendances
General practitioner After hours home visit by a general practitioner
$37.05 $74.95
Medicare Benefits Schedule171 Item no. 23, page 141 Item no. 5023, page 212

202 Chapter 8: Cost-effectiveness of a chronic cough management algorithm at the transitional stage from acute to chronic cough in children: a multi-centre randomised controlled trial.
Specialist consultation (including a paediatrician) Nurse practitioner
$128.30 $17.85
Item no. 110, page 151 Item no. 82205, page 1245
Non-admitted emergency department presentation Indigenous patient Non-Indigenous patient
$378.00 $363.00
Independent Hospital Pricing Authority254 Classification used:
Non-admitted, triage category 4, respiratory system illness (code: URG108) Hospitalisation♯
Varies depending on patient and hospital characteristics Range = $817-$1747
Independent Hospital Pricing Authority255 Classifications (based on hospitalisation discharge diagnosis) used:
Viral illness (code: T63B) Bronchitis and Asthma (code: E69B)
Diagnostic tests conducted outside of hospitalisation Medicare Benefits Schedule170 Allergen specific IgE $22.80 Item no. 71079, page 1056 Blood gases test $28.65 Item no. 66566, page 1030 Chest radiograph $20.10 Item no. 58505, page 889 Computed tomography, scan of chest $171.70 Item no. 56347, page 872 C-reactive protein test $8.25 Item no. 66500, page 1029 Culture and microscopy (from nasal swab or NPA) $18.70 Item no. 69303, page 1045 Full blood count $14.45 Item no. 65070, page 1023 Iron studies $27.70 Item no. 66596, page 1031 Microbial antibody testing – 1 type Microbial antibody testing – 2 types Microbial antibody testing – 3 types
$13.35 $24.65 $36.00
Item no. 69384, page 1049 Item no. 69387, page 1049 Item no. 69390, page 1049
PCR – 1 test PCR – 3 or more tests
$24.40 $36.60
Item no. 69494, page 1053 Item no. 69496, page 1053
Spirometry (lung function test) $52.50 Item no. 11512, page 265 Standard biochemistry profile/ UEC test $15.05 Item no. 66512, page 1029
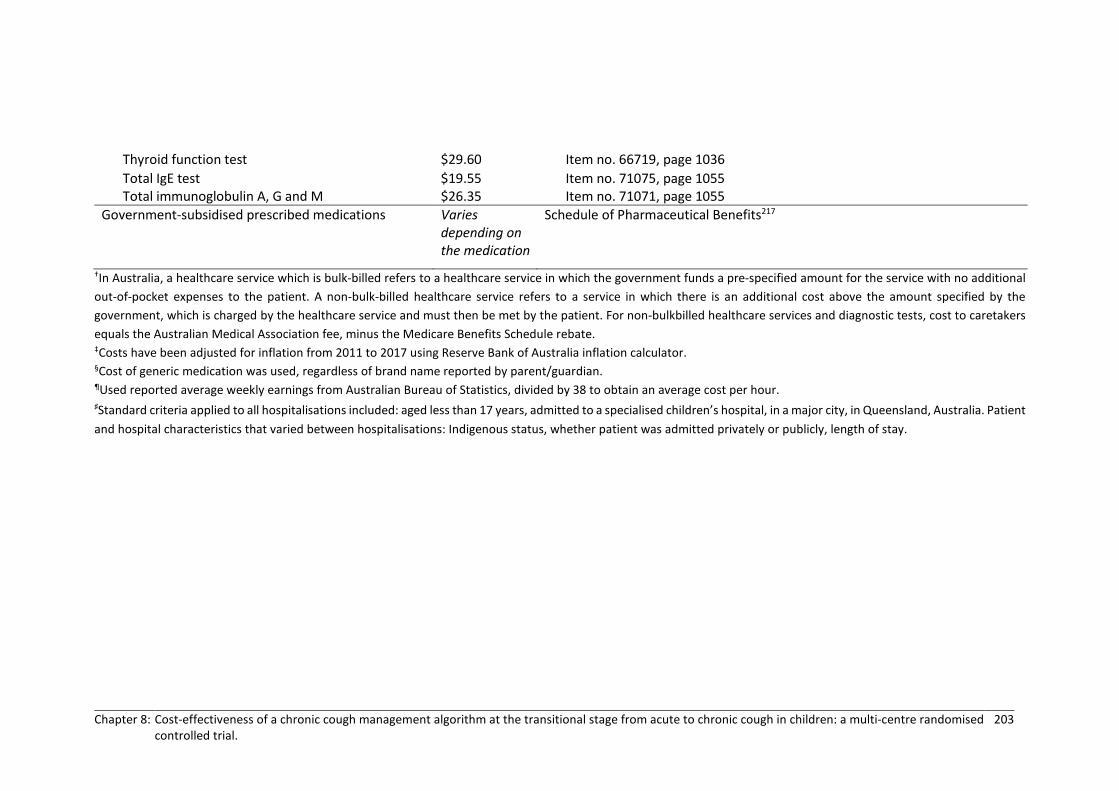
Chapter 8: Cost-effectiveness of a chronic cough management algorithm at the transitional stage from acute to chronic cough in children: a multi-centre randomised controlled trial.
203
Thyroid function test $29.60 Item no. 66719, page 1036 Total IgE test $19.55 Item no. 71075, page 1055 Total immunoglobulin A, G and M $26.35 Item no. 71071, page 1055
Government-subsidised prescribed medications Varies depending on the medication
Schedule of Pharmaceutical Benefits217
†In Australia, a healthcare service which is bulk-billed refers to a healthcare service in which the government funds a pre-specified amount for the service with no additional out-of-pocket expenses to the patient. A non-bulk-billed healthcare service refers to a service in which there is an additional cost above the amount specified by the government, which is charged by the healthcare service and must then be met by the patient. For non-bulkbilled healthcare services and diagnostic tests, cost to caretakers equals the Australian Medical Association fee, minus the Medicare Benefits Schedule rebate. ‡Costs have been adjusted for inflation from 2011 to 2017 using Reserve Bank of Australia inflation calculator. §Cost of generic medication was used, regardless of brand name reported by parent/guardian. ¶Used reported average weekly earnings from Australian Bureau of Statistics, divided by 38 to obtain an average cost per hour. ♯Standard criteria applied to all hospitalisations included: aged less than 17 years, admitted to a specialised children’s hospital, in a major city, in Queensland, Australia. Patient and hospital characteristics that varied between hospitalisations: Indigenous status, whether patient was admitted privately or publicly, length of stay.

204 Chapter 8: Cost-effectiveness of a chronic cough management algorithm at the transitional stage from acute to chronic cough in children: a multi-centre randomised controlled trial.
8.3.9 Incremental cost effectiveness using randomised controlled trial data
Incremental cost-effectiveness ratios (ICERs) were used to estimate the cost per
cough resolution as a result of the intervention compared to usual care using an
intention-to-treat (ITT) approach. This approach included all randomised participants
who at 4-weeks post-randomisation had not previously been excluded and who had
a known cough status (Appendix H, Figure H3). As per established methods for ITT
analysis, participants were analysed according to the allocation group they were
assigned to at the time of randomisation, irrespective of whether they had received
the intervention by 4-weeks post-randomisation or not.
The incremental cost effectiveness ratio (ICER) for the algorithm-based intervention
versus usual care is outlined below.
Linear regression models were used to estimate coefficients for the between-group
differences in both costs and cough resolution. Each model was adjusted for child age
at enrolment, the variables that randomisation was stratified by (enrolment site,
cough duration at time of randomisation), and the baseline characteristics that
differed between allocation groups at p<0.1 (having private health insurance,
presence of mould in the house, number of bedrooms in the household, admission
to neonatal intensive care unit [NICU]). Bootstrap resampling (2000 replications) was
used to calculate 95% CIs for the coefficients, as well as 95% confidence ellipses for
the ICER estimates. The ICER estimates and 95% confidence ellipses were plotted on
cost-effectiveness planes as a visual representation of the uncertainty in costs and
effect. The probability that the intervention was both less costly and more effective
(south-east quadrant on the cost-effectiveness plane and henceforth referred to as
‘dominant’) was estimated. These analyses were conducted, and are presented, from
the public healthcare system and caretaker perspectives, as well as their combined
ICER(CostAlgorithm) – (CostUsual Care)
(Cough resolutionAlgorithm ) – (Cough resolutionUsual Care)=

Chapter 8: Cost-effectiveness of a chronic cough management algorithm at the transitional stage from acute to chronic cough in children: a multi-centre randomised controlled trial.
205
cost perspective. All analyses were conducted using Stata Version 15 (StataCorp,
College Station, Texas).
8.3.10 Sensitivity analysis
A sensitivity analysis was also undertaken to examine the robustness of the findings
against the application of a per-protocol analytical approach rather than following
the (pre-specified) intention-to-treat principle. This meant that the analyses
described above were repeated after excluding participants allocated to the
intervention who did not receive the intervention, and participants allocated to usual
care who received specialist care for their cough illness within the 4 weeks after
randomisation, either from being hospitalised or seeking specialist care
independently of the trial intervention (Appendix H, Figure H3).
8.4 RESULTS
A total of 1018 children were screened for eligibility and 509 were monitored weekly
for 4 weeks for development of chronic cough. Of these, 117 were identified as
having developed chronic cough, rendering them eligible for randomisation and
inclusion in the trial. There were 59 participants allocated to the intervention group
and 58 to usual care. Two participants who were initially thought to be eligible and
randomised (to the intervention group), were subsequently identified as being
ineligible for trial (on the basis of not meeting the chronic cough criteria) and did not
contribute further to the trial on account of being in violation of the study protocol
for inclusion. Additionally, 12 participants allocated to the intervention and 13
participants allocated to usual care had unknown cough outcome at 4 weeks post-
randomisation due to loss to follow-up.
Among the 90 children remaining for whom cough outcome was known for the
intention-to-treat analysis, 56% were male, 32% were identified as Indigenous
Australian, 43% were enrolled from primary care (vs enrolled from an ED) and the
median age was 1.6 years (interquartile range [IQR] 1.0, 3.7). Additional

206 Chapter 8: Cost-effectiveness of a chronic cough management algorithm at the transitional stage from acute to chronic cough in children: a multi-centre randomised controlled trial.
characteristics are presented in Table 8.2. For the 37/45 children in the intention-to-
treat analysis who were allocated to and received the intervention, the median
number of days between randomisation and receipt of the intervention was 9 (IQR 7,
16).
Table 8.2. Selected baseline characteristics of participants included in the intention-to-treat cost-effectiveness analysis, presented by allocation group.
Characteristic All, n=90
Intervention, n=45
Usual care, n=45
Enrolment Site Emergency department 51 (56.67) 26 (57.78) 25 (55.56) Primary care 39 (43.33) 19 (42.22) 20 (44.44)
Reason for presentation to health service ARIwC 4 (4.44) 3 (6.67) 1 (2.22) Other reason with an ARIwC noted incidentally
86 (95.56) 42 (93.33) 44 (97.78)
Season at enrolment Spring 25 (27.78) 15 (33.33) 10 (22.22) Summer 7 (7.78) 3 (6.67) 4 (8.89) Autumn 18 (20.00) 10 (22.22) 8 (17.78) Winter 40 (44.44) 17 (37.78) 23 (51.11)
Child age at enrolment (years) <2 52 (57.78) 26 (57.78) 26 (57.78) 2 - <5 23 (25.56) 15 (33.33) 8 (17.78) >5 15 (16.67) 4 (8.89) 11 (24.44) Median (IQR) 2.34 (1.74 – 2.94) 1.97 (1.30 – 2.64) 2.71 (1.69 – 3.72)
Child’s sex Male 50 (55.56) 23 (51.11) 27 (60.00)
Child’s Indigenous status Indigenous 29 (32.22) 12 (26.67) 17 (37.78)
Cough severity according to day and night-time cough scores41¶ Day-time, mean (95% CI) 3.07 (2.86, 3.28) 3.2 (2.90, 3.49) 2.95 (2.64, 3.26) Night-time, mean (95% CI) 3.03 (2.77, 3.29) 3.08 (2.77, 3.40) 2.97 (2.55, 3.40) Cough duration at enrolment (days)
<7 37 (41.11) 16 (35.56) 21 (46.67) 7 - <14 17 (18.89) 10 (22.22) 7 (15.56) 14 - <28 10 (11.11) 4 (8.89) 6 (13.33) ≥28 26 (28.89) 15 (33.33) 11 (24.44)
Previous episode of cough lasting >4-weeks Yes 42 (46.67) 21 (46.67) 21 (46.67)
Hospitalised in the past 12-months with a respiratory illness Yes 22 (24.44) 11 (24.44) 11 (24.44)
Number of other children in the household 0 31 (34.44) 16 (35.56) 15 (33.33)

Chapter 8: Cost-effectiveness of a chronic cough management algorithm at the transitional stage from acute to chronic cough in children: a multi-centre randomised controlled trial.
207
1 - 2 47 (52.22) 22 (48.89) 25 (55.56) ≥3 12 (13.33) 7 (15.56) 5 (11.11) Number of bedrooms in the household
<2 2 (2.22) 0 (0.00) 2 (4.44) ≥2 88 (97.78) 45 (100.00) 43 (95.56) Median (IQR) 3.47 (3.27 – 3.68) 3.71 (3.45 – 3.96) 3.24 (2.92 – 3.55)
House mould/mildew in the household Yes 19 (21.11) 14 (31.11) 5 (11.11)
Birth weight (grams) <2500 11 (12.22) 5 (11.11) 6 (13.33)
Gestational age (weeks) <37 16 (17.78) 6 (13.33) 10 (22.22)
Admitted to neonatal intensive care unit Yes 26 (28.89) 10 (22.22) 16 (35.56)
Any tobacco smoke exposure (indoor and/or outdoor and/or car) Yes 28 (31.11) 14 (31.11) 14 (31.11)
Attends childcare Yes 54 (60.00) 29 (64.44) 25 (55.56) N/A† 15 (16.67) 3 (6.67) 12 (26.67)
Received seasonal influenza vaccine in the last 12-months Yes 16 (17.78) 11 (24.44) 5 (11.11) N/A‡ 4 (4.44) 3 (6.67) 1 (2.22)
Private insurance covering children Yes 33 (36.67) 22 (48.89) 11 (24.44)
Annual household Income ($AU) <$52000 23 (25.56) 6 (13.33) 17 (37.78) $52000 - <$78000 12 (13.33) 7 (15.56) 5 (11.11) $78000 - <$104000 14 (15.56) 10 (22.22) 4 (8.89) $104000 - <$156000 14 (15.56) 8 (17.78) 6 (13.33) ≥$156000 11 (12.22) 6 (13.33) 5 (11.11) Declined/Unknown 16 (17.8) 8 (17.78) 8(17.78)
Abbreviations: IQR, interquartile range; N/A, not applicable; CI, confidence interval ¶Cough score scale from 0 (no cough) to 5 (distressing cough, unable to perform usual duties) †NA = children too old for childcare ‡NA = infants not age eligible for influenza vaccine
8.4.1 Outcome
Among the participants included in the intention-to-treat analysis, 33 participants
(73%) in the intervention group reported cough resolution by 4 weeks post-
randomisation, compared to 23 (51%) in the usual care group. This equated to an
absolute risk difference of 22.2% (95% CI 2.7, 41.7) and a number needed-to-treat of
5 (95% CI 2.4, 36.7) favouring the algorithm-based intervention.

208 Chapter 8: Cost-effectiveness of a chronic cough management algorithm at the transitional stage from acute to chronic cough in children: a multi-centre randomised controlled trial.
8.4.2 Resource use and costs
A detailed breakdown of resource use by allocation group is provided in Appendix H,
Table H1. Itemised and total mean costs with bias-corrected 95% CIs are presented
in Table 8.3 by allocation group and by cost perspective for the 90 children included
in the intention-to-treat analysis. From the perspective of the public healthcare
system, mean costs were $179 (95% CI 139, 218) for the intervention group,
compared to $135 (95% CI 36, 234) for the usual care group. From the perspective of
caretakers, mean costs were $386 (95% CI 264, 552) for the intervention group,
compared to $444 (95% CI 199, 874) for the usual care group. When the two cost
perspectives were combined, the total mean cost was marginally higher for those
allocated to usual care ($580; 95% CI 272, 1100) compared to intervention ($565;
95% CI 414, 751). The proportion of participants with missing data was <10% in both
the intervention and usual care group, and therefore adjustments for missing data
(e.g. imputation) were not performed.

Chapter 8: Cost-effectiveness of a chronic cough management algorithm at the transitional stage from acute to chronic cough in children: a multi-centre randomised controlled trial.
209
Table 8.3. Mean itemised and total costs for 90 participants included in the intention-to-treat cost-effectiveness analysis, presented by allocation group and cost perspective.
Intervention, n=45 Usual care, n=45 Public healthcare
system Caretakers Public healthcare
system Caretakers
Mean 95% CI Mean 95% CI Mean 95% CI Mean 95% CI General practitioner consultation 16.47 8.05, 28.19 0.00 - 26.35 15.88, 37.89 1.86 0.00, 4.99 Specialist consultation 105.49 89.02, 118.24 0.00 - 8.55 0.00, 20.81 13.45 0.00, 31.64 Use of other healthcare services 0.40 0.00, 1.46 0.00 - 0.00 - 1.59 0.00, 6.51 Emergency department presentation without admission
24.53 0.00, 57.47 0.00 - 48.40 0, 118.19 0.00 -
Hospitalisations 0.00 - 0.00 - 38.82 0.00, 131.03 0.00 - Diagnostic tests outside hospitalisation
26.01 17.43, 37.22 4.75 0.00, 15.50 8.23 2.46, 19.17 2.21 0.00, 8.79
Medications 5.80 3.01, 9.18 19.18 14.13, 24.95 4.69 1.68, 9.76 8.29 4.64, 12.68 Missed childcare 0.00 - 28.51 11.23, 49.59 0.00 - 49.26 13.37, 101.85 Missed activities 0.00 - 4.52 1.42, 8.86 0.00 - 38.13 0.59, 124.94 Time spent seeking healthcare 0.00 - 141.97 101.55, 182.43 0.00 - 167.56 72.52, 314.39 Time spent caring for child 0.00 - 183.53 90.20, 331.40 0.00 - 159.77 50.18, 364.80 Miscellaneous 0.00 - 3.54 1.16, 6.85 0.00 - 2.32 0.00, 5.87 Total 178.70 139.14, 218.26 385.99 263.71, 551.89 135.04 35.70, 234.39 444.45 199.31, 874.38

210 Chapter 8: Cost-effectiveness of a chronic cough management algorithm at the transitional stage from acute to chronic cough in children: a multi-centre randomised controlled trial.
8.4.3 Incremental cost-effectiveness
After adjustments following the pre-specified trial protocol,253 from the perspective
of the public healthcare system the mean additional cost per participant as a result
of the intervention in comparison to usual care was $76 (95% CI -52, 163). From the
perspective of caretakers, the mean cost-saving per participant as a result of the
intervention in comparison to usual care was $53 (95% CI -251, 549). From the
combined cost perspective, the mean additional cost per participant as a result of the
intervention in comparison to usual care was $23 (95% CI -565, 395). Similarly, after
adjustments, the additional rate of cough resolution per participant as a result of the
intervention in comparison to usual care was 0.11 (95% CI -0.12, 0.34).
Point estimates of the ICERs from the ITT analysis indicate the cost per additional
cough resolution was $704 from the public healthcare system, $-488 (cost saving)
from the caretaker perspective and $216 when both perspectives were combined.
Visualisation of the uncertainty of ICER point estimates are presented on the cost-
effectiveness plane (Figure 8.1) for the algorithm-based intervention compared to
usual care from the perspective of the public healthcare system (Figure 8.1a),
caretaker (Figure 8.1b), and combined perspective (Figure 8.1c). In summary, the
probability that the algorithm-based intervention was both cheaper and more
effective was 8% for the public healthcare system perspective, 52% from the
caretaker perspective and 34% when both perspectives were combined.

Chapter 8: Cost-effectiveness of a chronic cough management algorithm at the transitional stage from acute to chronic cough in children: a multi-centre randomised controlled trial.
211
a)
b)
c)
-100
0-5
000
500
1000
Diff
eren
ce in
cos
t (AU
D)
-.4 -.2 0 .2 .4 .6Difference in proportion with cough resolution
-100
0-5
000
500
1000
Diff
eren
ce in
cos
t (AU
D)
-.4 -.2 0 .2 .4 .6Difference in proportion with cough resolution
-100
0-5
000
500
1000
Diff
eren
ce in
cos
t (AU
D)
-.4 -.2 0 .2 .4 .6Difference in proportion with cough resolution
Figure 8.1. Incremental cost effectiveness planes (and 95% confidence ellipses) using the intention-to-treat approach presented from (a) the public healthcare perspective, (b) the caretaker perspective, and (c) the combined perspective.

212 Chapter 8: Cost-effectiveness of a chronic cough management algorithm at the transitional stage from acute to chronic cough in children: a multi-centre randomised controlled trial.
8.4.4 Sensitivity analysis
There were 76 children included in the per-protocol analysis. Among 36 participants
who were allocated to and received the intervention, 26 (65%) reported cough
resolution by 4 weeks post-randomisation, compared to 22 (43%) of the 40
participants who were allocated to and received usual care. After adjustments, the
additional rate of cough resolution per participant as a result of the intervention in
comparison to usual care was 0.09 (95% CI -0.17, 0.33).
From the perspective of the public healthcare system, mean costs were $218 (95% CI
186, 268) for the intervention group, compared to $61 (95% CI 28, 121) for the usual
care group (Table 8.4). After adjustments, from the perspective of the public
healthcare system the mean additional cost per participant as a result of the
intervention in comparison to usual care was $164 (95% CI 94, 221). From the
perspective of caretakers, mean costs were $472 (95% CI 332, 648) for the
intervention group, compared to $303 (95% CI 99, 728) for the usual care group
(Table 8.4). After adjustments, from the perspective of caretakers, the mean
additional cost per participant as a result of the intervention in comparison to usual
care was $118 (95% CI -411, 400). From the combined cost perspective, the mean
additional cost per participant as a result of the intervention in comparison to usual
care was $282 (95% CI -310, 608). A detailed breakdown of resource use among
children included in the per-protocol analysis is provided in Appendix H, Table H2.
Point estimates of the ICERs from the per-protocol analysis indicate the cost per
additional cough resolution was $1835 from the public healthcare system, $1314
from the caretaker perspective and $3149 when both perspectives were combined.
Visualisation of the uncertainty of the ICER point estimates are presented on the cost-
effectiveness plane (Figure 8.2) for the algorithm-based intervention compared to
usual care from the perspective of the public healthcare system (Figure 8.2a),
caretaker (Figure 8.2b), and combined perspective (Figure 8.2c). In summary, the
probability that the algorithm-based intervention was both cheaper and more
effective was 0% from the public healthcare system perspective, 18% from the
caretaker perspective and 8% when both perspectives were combined.

Chapter 8: Cost-effectiveness of a chronic cough management algorithm at the transitional stage from acute to chronic cough in children: a multi-centre randomised controlled trial.
213
Table 8.4. Mean itemised and total costs for 76 participants included in the per-protocol cost-effectiveness analysis, presented by allocation group and cost perspective.
Intervention, n=36 Usual care, n=40 Public healthcare
System Caretakers Public healthcare
system Caretakers
Mean 95% CI Mean 95% CI Mean 95% CI Mean 95% CI General practitioner consultation 20.58 10.45, 34.31 0.00 - 23.16 13.23, 35.24 2.10 0.00, 5.52 Specialist consultation 128.30 128.30, 128.30 0.00 - 0.00 - 0.00 - Use of other healthcare services 0.50 0.00, 1.93 0.00 - 0.00 - 0.00 - Emergency department presentation without admission
30.67 0.00, 76.66 0.00 - 27.23 0.00, 80.67 0.00 -
Hospitalisations 0.00 - 0.00 - 0.00 - 0.00 - Diagnostic tests outside hospitalisation
30.55 19.99, 43.65 5.94 0.00, 18.36 7.50 1.02, 19.54 0.00 -
Medications 7.20 3.90, 11.86 23.92 18.16, 30.35 3.48 1.24, 6.91 5.15 2.73, 8.98 Missed childcare 0.00 - 34.16 13.58, 63.26 0.00 - 38.92 10.51, 87.57 Missed activities 0.00 - 5.65 1.80, 11.17 0.00 - 5.39 0.46, 18.14 Time spent seeking healthcare 0.00 - 168.29 128.85, 218.24 0.00 - 98.51 33.12, 237.25 Time spent caring for child 0.00 - 229.41 113.10, 389.75 0.00 - 151.89 35.53, 396.52 Miscellaneous 0.00 - 4.42 1.50, 8.34 0.00 - 1.11 0.00, 3.69 Total 217.80 186.21, 267.59 471.79 331.87, 647.48 61.36 27.78, 120.88 303.07 98.61, 727.80

214 Chapter 8: Cost-effectiveness of a chronic cough management algorithm at the transitional stage from acute to chronic cough in children: a multi-centre randomised controlled trial.
a)
b)
c)
-100
0-5
000
500
1000
Diff
eren
ce in
cos
t (AU
D)
-.4 -.2 0 .2 .4 .6Difference in proportion with cough resolution
-100
0-5
000
500
1000
Diff
eren
ce in
cos
t (AU
D)
-.4 -.2 0 .2 .4 .6Difference in proportion with cough resolution
-100
0-5
000
500
1000
Diff
eren
ce in
cos
t (AU
D)
-.4 -.2 0 .2 .4 .6Difference in proportion with cough resolution
Figure 8.2. Incremental cost effectiveness planes (and 95% confidence ellipses) using the per-protocol approach and presented from (a) the public healthcare perspective, (b) the caretaker perspective, and (c) the combined perspective.

Chapter 8: Cost-effectiveness of a chronic cough management algorithm at the transitional stage from acute to chronic cough in children: a multi-centre randomised controlled trial.
215
8.5 DISCUSSION
This trial-based economic evaluation evaluated the cost-effectiveness of using an
evidence-based cough management algorithm for cough resolution in the
transitional stage from acute to chronic cough. The study included 90 children who
developed chronic cough following presentation to a primary care clinic or an ED with
an ARIwC for whom cough outcomes were known at 4 weeks post-intervention-
randomisation. In the ITT analysis the intervention, relative to usual care, was
associated with higher costs from the perspective of the public healthcare system
and lower costs from the perspective of caretakers. The intervention was also
associated with a higher rate of cough resolution relative to usual care. The higher
costs reported by the intervention group from the public healthcare perspective were
largely attributable to the direct costs of the intervention including the specialist
consultation and diagnostic tests. However, the usual care group reported higher
costs from the public healthcare perspective as a result of use of other types of
healthcare, including GP consultations, ED presentations and hospitalisations. Given
the small sample size and wide CIs, firm conclusions cannot be drawn regarding
whether this was attributable to the use of the algorithm which may have reduced
the need for these healthcare services in the intervention group. The higher costs
reported by the usual care group from the caretaker perspective were largely
attributable to the costs associated with children missing childcare, and with the child
and their caretakers missing usual activities. Overall, the ITT found the probability
that the intervention dominated (both cheaper and more effective) was considerably
higher from the perspective of caretakers than from the perspective of the public
healthcare system.
It was interesting to note that the ITT analysis produced more favourable findings
than the per-protocol analyses, regardless of the perspective being considered. This
finding is promising given the ITT approach reflects what is likely to occur in practice.
The differences observed between the ITT and per-protocol analyses were
attributable to both an increase in the mean cost for the intervention group and a
decrease in the mean cost for the usual care group. The exclusion of children who

216 Chapter 8: Cost-effectiveness of a chronic cough management algorithm at the transitional stage from acute to chronic cough in children: a multi-centre randomised controlled trial.
presented to ED, were hospitalised or sought specialist care independently following
randomisation, contributed to the considerable decrease in costs from the public
healthcare perspective for the usual care group. This was combined with an increase
in costs for the intervention group in the per-protocol analysis following the exclusion
of children who were allocated to intervention yet didn’t receive it.
The proportion of children who were allocated to the intervention, yet didn’t receive
it, was higher among this study cohort compared to the first RCT conducted on this
algorithm. In the first RCT of this algorithm, Chang et al.149 reported that 7% (19/272)
of children allocated to the intervention did not attend the specialist consultation,
whereas in this study 18% (8/45) of those children allocated to the intervention did
not attend the specialist consultation. This difference may be associated with
differences in recruitment setting, participant characteristics or, perhaps most likely,
the earlier intervention timepoint as children in the first RCT had been coughing for
several months. Implementation of the intervention at a primary care level by a
family’s usual general practitioner may be more acceptable to parents.
This study is novel in the field thus limiting comparisons that can be made to prior
research. It is the first study to evaluate the cost-effectiveness of this cough
management algorithm developed by Chang and colleagues.39 Furthermore, there
have been no prior economic evaluations of other clinical algorithms, guidelines or
protocols for managing cough in children. Another challenge regarding the
interpretation of cost-effectiveness information is that no prior studies have
examined the willingness-to-pay threshold for interventions that lead to cough
resolution. Consequently there is not yet a consensus on what monetary value
caretakers and the public healthcare system consider to be ‘cost-effective’. There is
also a paucity of research examining the cost-consequences of chronic cough and/or
the benefits of cough resolution on both short- and long-term health resource usage
outcomes among children. The lack of research in each of these areas makes it
challenging to draw a clear conclusion about the cost-effectiveness of the
intervention and the extent to which resources should be allocated to this
intervention relative to others for promoting cough resolution in children.

Chapter 8: Cost-effectiveness of a chronic cough management algorithm at the transitional stage from acute to chronic cough in children: a multi-centre randomised controlled trial.
217
The point estimate of the ICER in the ITT analysis from the perspective of caretakers
would suggest that the intervention is potentially cost-saving for families and carers
of children with chronic cough. However, these cost-savings have occurred in the
context of both the specialist consultation and the diagnostic tests associated with
the intervention being funded through the provision of publicly funded healthcare in
the region where this study was conducted, and therefore incurring no out-of-pocket
costs for caretakers. Consequently interpretation of likely cost savings is dependent
on the public healthcare system incurring these costs and healthcare service
providers being willing-to-pay approximately $700 per cough resolution. Taking into
consideration the consequences of persistent cough, including the association
between persistent cough following a respiratory infection and the development of
bronchiectasis,19 as well as the negative impact on QoL,84 this cost may be acceptable.
Furthermore, it is highly plausible that the use of the cough management algorithm
to identify underlying chronic respiratory diseases, which would have likely otherwise
gone undiagnosed, will lead to more appropriate and timely management of future
episodes of ARIwC, as well as exacerbations of chronic respiratory diseases. Future
studies are required to confirm or refute this hypothesis, in particular the
management of cough using this algorithm in primary care to reduce the cost of
specialist expenses remains a priority for research.
A strength of the present study has been the inclusion of Indigenous Australian
children; one-third of the study cohort were identified as Indigenous Australians
which was consistent with the clinical case mix in the public healthcare service in
which this study was conducted. It is possible that the use of a cough management
algorithm shortly after the onset of chronic cough will have the greatest long-term
beneficial impacts among populations who are at greatest risk of developing, and
experiencing earlier mortality, from respiratory diseases such as bronchiectasis,
including Indigenous Australians.64 Unfortunately, the trial was not powered to
conduct sub-group analyses to examine this further in the present study, which may
be considered a limitation. The valuation of costs from the two perspectives was also
a strength and demonstrated considerable differences in the ICER estimates and

218 Chapter 8: Cost-effectiveness of a chronic cough management algorithm at the transitional stage from acute to chronic cough in children: a multi-centre randomised controlled trial.
probability of dominance between the two cost perspectives included in this study.
It is also noteworthy that the present cost-effectiveness analyses did not include
children who initially presented to paediatric respiratory services or primary care but
are lost to follow up with unknown cough outcomes. It has been previously reported
that children lost to follow-up with unknown cough outcome are less likely to have
had a history of admission to a neonatal intensive care unit, be aged <2 years and to
have private health insurance.253 The exclusion of these participants from the present
cost-effectiveness analyses may therefore impact the generalisability of the findings
to children with those characteristics. Finally, the short time horizon of 4-weeks post-
randomisation limited the ability to capture all cost-related consequences associated
with the intervention as well as capture the potential effects on long-term health
outcomes.
Future research should seek to examine the cost-effectiveness of the intervention
over a longer time period, as well as include additional outcome measures to
complement the outcome of cough resolution. Examining the cost-effectiveness over
a longer time period may enable the impact of the intervention on future health
outcomes to be assessed. These could include duration to the next episode of ARIwC,
the severity and duration of future episodes of ARIwC, and the costs associated with
future episodes of ARIwC. Additionally, an outcome measure such as quality-adjusted
life years (QALYs) would be beneficial to more holistically assess the impact of
interventions for informing resource allocation decisions. Furthermore, further
investigations to estimate willingness-to-pay thresholds for outcomes relevant to this
population will aid in future interpretation of ICER estimates regarding their cost-
effectiveness. Finally, opportunities to reduce the cost of the intervention,
particularly from the perspective of the public healthcare system, are worthy of
further consideration. A potential avenue for this is the administration of the cough
management algorithm in primary care settings by a general practitioner rather than
a specialist physician in a specialist paediatric centre. The present study has provided
useful new information regarding cost-effectiveness estimates of an algorithm-based
intervention upon which this future research can build.

Chapter 9: Discussion 219
Discussion
9.1 INTRODUCTION
It is well-documented that respiratory illnesses and cough are frequent causes of
childhood morbidity and healthcare utilisation among both Indigenous and non-
Indigenous Australian children (Chapter 2). Despite this, there are considerable gaps
in the understanding of the burden of acute and chronic respiratory illnesses, and
cough, from economic and quality of life perspectives, as well as a lack of evidence
for the effectiveness and cost-effectiveness of interventions to prevent and reduce
some of this burden (Chapters 1-2). The aim of this thesis was to address some of the
aforementioned gaps. To achieve this, three main research questions were
developed. Using methods of statistical analysis and economic evaluation (Chapter
3), these questions were answered by using data collected from four different
paediatric research studies.
This thesis has described resource use associated with the management of
bronchiectasis (Chapter 4), estimated the cost of illness of ARIwC (Chapters 5-6),
assessed quality of life over the duration of an episode of ARIwC (Chapter 7), and
evaluated the cost-effectiveness of early intervention using a cough management
algorithm among children with chronic cough post-ARI (Chapter 8). The findings of
this thesis are intended to inform (a) public health strategies to reduce the burden of
respiratory illnesses and cough on children, their families and health services, and (b)
clinical practice with respect to the management of respiratory illnesses and cough
among Indigenous and non-Indigenous Australian children.
The specific findings of each study included in this thesis, how the findings compare
to other published literature, and the specific strengths and limitations of each study
were discussed in detail in Chapters 4-8. Therefore, this chapter focuses on the key
findings of this thesis as they relate to each research question, the main implications

220 Chapter 9: Discussion
of these findings and opportunities for future research. The major strengths and
limitations of the research conducted within this thesis will also be discussed.
9.2 FINDINGS, IMPLICATIONS AND FUTURE RESEARCH
9.2.1 Research question 1a
Among children aged <18 years with non-cystic fibrosis (CF) bronchiectasis, attending
tertiary paediatric respiratory clinics in Australia and New Zealand, over a 12-month
period what is the frequency and types of health-related resource use? [Chapter 4 –
The COBS Study]
This study addressed the lack of research on resource use among children with
bronchiectasis by describing use of healthcare services and medications, and time off
work and school.256 Among a cohort of 85 children with bronchiectasis, the number
of children seeking healthcare for their bronchiectasis was higher than the number
of children seeking healthcare for other health reasons (30 vs 17 children per 100-
month of observation). On average, children missed 12 days of childcare or school
per child-year due to their bronchiectasis, whereas the child’s primary carer missed
3.5 days of paid employment per child-year. Despite sporadic attendance at
scheduled quarterly visits to their respective respiratory medicine clinics, families
were more frequently seeking healthcare for their child’s bronchiectasis from
specialists than from GPs. It is unclear whether frequent use of specialist healthcare
services is beneficial in the long-term from a clinical and/or economic perspective.
Due to the small sample size of the COBS study it was not feasible to compare
differences in the frequency of different types of resource use between children who
attended scheduled specialist visits, and those who did not.
Current guidelines for the management of bronchiectasis, which recommend regular
review by a respiratory physician, are largely informed by expert consensus rather
than by high-quality evidence, such as from RCTs.139,155,257 It is plausible that frequent
use of specialist healthcare services may be associated with better management of

Chapter 9: Discussion 221
bronchiectasis and could therefore result in decreased rates of hospitalisation and
use of medications. Yet, it is also plausible that by enhancing the ability of families
and primary healthcare services to manage bronchiectasis at a community-level, the
use of specialist services, and therefore the economic burden of illness, might be
reduced without compromising on clinical outcomes.
Other strategies to manage bronchiectasis include the use of antibiotics and other
medications, use of physiotherapy services and exercises, and timely receipt of
recommended vaccines.139,155,257 An examination of adherence to these strategies by
study participants was not within the scope of this thesis. The body of research into
the management of other chronic respiratory diseases such as asthma among
Australian children is fairly extensive. It includes research on adherence to clinical
guidelines,258,259 patient-perceived utility of written action management plans,260 and
management-related attitudes and behaviours of health professionals in community
settings (e.g. GP’s and pharmacists).261,262 Similar research for Australian children
with bronchiectasis is very limited.
When exclusively considering resource use associated with exacerbations, GPs were
the most frequently reported resource use (approximately 47% of exacerbations
resulted in a visit to a GP). Hospitalisations occurred in approximately 11% of
exacerbations. The proportion of exacerbations which resulted in antibiotic use was
29%. There were some seasonal variations in frequency of different types of resource
use for exacerbations, however overall no distinct trends were apparent. Some of
these results are similar to what has previously been reported regarding healthcare
and medication use among children aged <5 years experiencing ARIs. Kusel et al.53
reported that of all episodes of ARI reported among a cohort of Australian children
from birth until 5 years of age, 46% of episodes resulted in a visit to a GP and 23% of
episodes resulted in antibiotic use. In contrast, only 1% of ARI episodes resulted in
hospitalisation. This would suggest that from the perspective of primary healthcare
services, the burden of bronchiectasis exacerbations is similar to that of ARIs during
early childhood. However, the use of tertiary healthcare services is greater for
bronchiectasis exacerbations and therefore likely to be more costly than ARIs.

222 Chapter 9: Discussion
Given the limitations of the data collected through the COBS Study, namely the
exclusion of information regarding the quantity of resource use, it was not possible
to estimate the annual cost of bronchiectasis among children. However, given the
findings on levels of resource use, the costs of managing bronchiectasis are likely to
be substantial. A recent systematic review reported on studies estimating the
economic burden of non-CF bronchiectasis among adult populations,263 including
hospitalisation rates and annual healthcare costs. No Australian studies were
identified in the review, and no published Australian studies have estimated the
economic burden of bronchiectasis among children. The systematic review of the
economic burden of bronchiectasis among adults263 reported that a higher frequency
of exacerbations was associated with a higher frequency of hospitalisation, and that,
unsurprisingly, both of these factors were associated with higher annual costs.
Recently, the cost to the healthcare system for a paediatric hospitalisation for a
bronchiectasis exacerbation in Australia was estimated to be $AU30,182.264
Combining our findings of a hospitalisation occurring in 11% of exacerbations and
children experiencing a mean of 3.3 exacerbations per year, it can be estimated that
the average cost per child per year for an exacerbation is at least $AU10,956.
However, the total annual costs of managing bronchiectasis are likely to be much
higher than $11,000 per year per child once community management of disease is
considered.
Overall, there has been an increased global focus in recent years on understanding
the epidemiology and clinical characteristics of bronchiectasis among children and
adults, as well as a focus on establishing an evidence-base for the effective
prevention and management of bronchiectasis. Bronchiectasis is an endpoint of
many different respiratory illnesses and there is increasing evidence to suggest that
respiratory health in early childhood may play an important role in the development
and progression of bronchiectasis.22,65,70,265 Research has also highlighted that
Indigenous Australian children are disproportionately affected by bronchiectasis.71
This thesis adds to the body of knowledge on bronchiectasis in Australian children by
highlighting the high level of resource use among a cohort of children frequenting
tertiary healthcare services. However, the remaining gaps in data and evidence limit

Chapter 9: Discussion 223
the ability to define and achieve optimum clinical and public health practice. The
recent commencement of a national registry for Australian children and adults with
bronchiectasis, the Australian Bronchiectasis Registry (ABR), provides a promising
opportunity to obtain accurate and comprehensive information on a greater sample
of children with bronchiectasis than described in this thesis, as well as obtain
information longitudinally.266 This may enable comparisons of the frequency and
types of healthcare use by age, Indigenous status, and geographic location (e.g.
urban, regional, rural, remote), as well as assist in quantifying how access to services
impacts economic burden and health outcomes. Well-designed studies examining
the association between the management of bronchiectasis, associated resource use
and costs, and both short- and long-term respiratory health outcomes are essential
to guide future clinical and public health practice.
9.2.2 Research question 1b
Among children aged <18 years with non-CF bronchiectasis, attending tertiary
paediatric respiratory clinics in Australia and New Zealand, over a 12-month period
what is the child and parent’s quality of life (QoL), and do they correlate? [Chapter 4
– The COBS Study]
This study addressed the lack of research examining the impact of bronchiectasis on
children’s and parent’s quality of life repeatedly over an extended period of time.256
In a cohort of 85 children with bronchiectasis, median child and parent/guardian
cough-specific QoL scores were relatively high, were strongly correlated, and
remained consistent over the 12-month study period. The COBS study did not collect
data to determine whether children were in a stable or exacerbation state of
bronchiectasis at the time of completion of the QoL questionnaires, however mean
child and parent/guardian cough severity scores were relatively low at all timepoints.
Given the strong correlations between cough severity and cough-specific QoL (with
higher cough severity being strongly correlated with poorer QoL) identified within
this cohort, for both parent and child responses, it seems likely that the majority of
children were well at the time of completion of QoL questionnaires.
224 Chapter 9: Discussion
The COBS study cohort was such that this was a population with a confirmed
diagnosis of disease who were receiving regular follow-up in a specialist setting. It is
possible that, counter-intuitively, despite the clinical severity of bronchiectasis, it is a
disease which over the long-run has a minimal impact on cough-specific QoL when
well-managed. Given that the median time since diagnosis among this cohort was
almost 3 years, it is possible that both the child and parents have adjusted to the
presence and management of the illness and its symptoms such as cough. However,
it is also important to consider the appropriateness of the use of a cough-specific QoL
among children with bronchiectasis, and whether such a tool is able to accurately
capture the full impact of bronchiectasis on the QoL of children and families. Both
the PC-QoL and CC-QoL tools used in the COBS study were designed to assess the
impact of chronic cough on QoL in the past week. Furthermore, the PC-QoL and CC-
QoL tools were both developed and validated among cohorts of children newly
referred to specialist settings with chronic cough who had no prior diagnosis of
respiratory disease or other underlying diseases. Upon referral to a specialist, it is
plausible that most of those families were hopeful at the prospect of a diagnosis and
were anticipating imminent cough resolution. These populations differ considerably
from the children in the COBS study cohort who had been diagnosed with a chronic
respiratory condition for some time and who were facing a lifetime of managing their
condition.
A qualitative study of mothers of children with bronchiectasis in New Zealand
identified a number of concerns and challenges that are likely to be unique to
bronchiectasis and are likely to influence QoL.204 Some of these included:
communication and trust with healthcare providers, the impact of the illness on
parent’s ability to attend work and children’s ability to attend school, the financial
burden of the illness, the time and travel required to seek healthcare on a regular
basis, and the complexities of navigating the healthcare system. These findings
suggest that the impact of bronchiectasis on the QoL of children and families extends
well beyond the specific impact of cough.

Chapter 9: Discussion 225
A number of QoL tools have been validated for use among adults with bronchiectasis
including a bronchiectasis-specific QoL questionnaire (QoL-B),267,268 a cough-specific
QoL questionnaire269 and respiratory-specific QoL questionnaires.270,271 Similar
studies are required among paediatric populations. Until then, clinicians and
researchers may need to use their own judgment to determine whether exclusive use
of a cough-specific tool to assess QoL among children and parents of children with
bronchiectasis is appropriate in the context of the objectives, scope and feasibility of
their practice and research.
Finally, the relatively small sample size, combined with the limited collection of
demographic, household, and illness-related characteristics prohibited meaningful
exploration of factors influencing QoL among the COBS study cohort. Future research
would benefit from the collection of such data in order to establish factors associated
with QoL at a single point in time, as well as factors that influence changes in QoL
over time given the long-term nature of the illness.
9.2.3 Research question 2a
Among Indigenous and non-Indigenous Australian children aged <15 years presenting
to primary healthcare clinics and/or emergency departments (EDs) with acute
respiratory infection with cough (ARIwC), what is the economic burden to caretakers,
the public healthcare system and third parties? [Chapters 5 and 6 – the TLSIM Study
and the EDC Study]
These studies addressed the lack of research estimating the cost of ARIwC among
young Indigenous Australian children and Australian children presenting to ED’s.196
Among Indigenous Australian children aged <5 years in the TLSIM cohort study, the
mean cost of a non-hospitalised episode of ARIwC was estimated to be $252 (95% CI
169, 334). Approximately 44% of episode costs were incurred by caretakers, 39% by
the public healthcare system and 17% by employers. The total annual cost of ARIwC
episodes, after adjusting for months of observation, was estimated to be $991 (95%
CI 514, 1468). Among children aged <15 years presenting to an ED for their ARIwC in
226 Chapter 9: Discussion
the EDC cohort study, in which 16% were hospitalised following presentation, the
mean cost per episode of ARIwC was estimated to be $5274 (95% CI 4804, 5744).
Approximately 66% of episode costs were incurred by caretakers, 22% by the public
healthcare system and 11% by third parties.
In these two studies estimating the cost of an ARIwC episode, the distribution of costs
between the three cost perspectives (caretakers, public healthcare system and third
parties) differed. For both studies, the greatest proportion of costs were incurred by
caretakers. Most of these costs were a result of ‘time off non-work activities’ among
parents who were not engaged in paid employment at the time, as well as other
family members and friends who assisted with caring for the child while he/she was
ill. The proportion of costs incurred by caretakers was higher among the cohort of
children presenting to an ED for the ARIwC than the cohort of Indigenous Australian
children with community-managed ARIwC episodes. This is likely due to the greater
severity of illness among those presenting to ED, leading to hospital admissions which
impose a significant burden of time on parents and other carers. Overall, these
findings emphasise the importance of the contribution of unpaid care to the
Australian economy.
For both studies, the public healthcare system incurred the second greatest
proportion of costs, with the exact proportions once again differing between studies.
A greater proportion of costs were incurred by the public healthcare system among
the cohort of Indigenous Australian children with community-managed ARIwC
episodes. This is most likely explained by the high use of bulk-billing healthcare
services within this cohort and the array of financial support available to Indigenous
Australians such as subsidised medications through the CTG co-payment programme.
The lowest proportion of costs incurred for both studies were the costs to third
parties. For the TLSIM cohort, the cost to third parties only included costs to
employers given a very small proportion of the cohort had private health insurance,
and among those who did have private health insurance, none reported using it for

Chapter 9: Discussion 227
their child during an ARIwC episode. This is expected given these were not
hospitalised episodes and were mostly managed at a primary care level where private
insurance is generally superfluous given the existence of the Medicare Benefits
Scheme. For children in the EDC cohort, the cost to insurance companies became
relevant when children were hospitalised either to private hospitals or as private
patients in public hospitals.
Overall, the ‘per episode’ and annual economic burden of ARIs and cough among
Australian children appears to be substantial for both families and for the healthcare
system. Government subsidies for healthcare services and medications play an
important role in alleviating the economic burden of ARIs and cough on families,
particularly for socio-economically disadvantaged populations. While this is
important to reduce social and health inequalities, it is not an actual reduction in the
total economic burden of ARIs and cough, merely a shift from one sector to another.
Ultimately, a reduction in the total cost of illness is desired. Ongoing approaches to
reducing the economic burden of ARIs and cough during childhood need to be multi-
faceted and should include a range of strategies to (a) prevent the occurrence of ARIs
and cough, (b) reduce the use of resources that incur the greatest monetary costs
and (c) address other factors that are directly or indirectly associated with high costs
of illness.
Public health measures to prevent the occurrence of ARIs and associated symptoms
such as cough during childhood are well-researched and include maternal and child
vaccinations, improved hygiene practices and living conditions, and a range of other
health promotion strategies such as reducing exposure to tobacco smoke.90,272-275
In order to the reduce the use of resources that incur the greatest monetary costs,
the key drivers of total cost of illness first need to be identified, and secondly the
factors that are associated with these key cost drivers need to be examined. For
example, in both studies, time spent seeking healthcare and caring for the child
contributed considerably to the cost of illness from the caretaker perspective. From
the perspective of the public healthcare system, hospitalisation was an important

228 Chapter 9: Discussion
contributor to costs. Identifying what factors increase the likelihood of these types of
resource use, and developing strategies to target these, may enable the reduction of
total cost of illness.
Finally, addressing other factors that are directly or indirectly associated with high
costs of illness requires a comprehensive collection and examination of a range of
demographic, child, family, and illness-related characteristics which may influence
the cost of illness. Exploration of these factors allows the identification of who, what,
when and where to target interventions to most effectively reduce the economic
burden of ARIs and cough. This thesis has started this process for certain populations
and settings, and the findings will be discussed in subsequent sections.
9.2.4 Research question 2b
Among Indigenous and non-Indigenous Australian children aged <15 years presenting
to primary healthcare clinics and/or EDs with ARIwC, is the economic burden greater
among episodes in which cough persists for four consecutive weeks (chronic cough),
compared to episodes in which cough resolves within four consecutive weeks (acute
or sub-acute cough)? [Chapters 5 and 6 – the TLSIM Study and the EDC Study]
These studies addressed the lack of research on the impact of cough duration on the
cost of illness of ARIwC among young Indigenous Australian children and Australian
children presenting to EDs.196 In the study of non-hospitalised episodes of ARIwC
among Indigenous Australian children, episodes which resulted in chronic cough had
significantly higher costs per episode ($585; 95% CI 301, 868) compared to sub-acute
cough episodes ($230; 95% CI 84; 377, p<0.01) and acute cough episodes ($118; 95%
CI 61, 175; p<0.001). Overall, for all episodes the highest proportion of costs were
incurred in the week following illness notification, followed by the time between
illness onset and illness notification. The median duration of illness at illness
notification was 6 days (IQR 3 -14). Therefore, the majority of costs appear to have
been incurred during the acute phase of the ARIwC episode. The significantly higher
costs of episodes resulting in chronic cough first appeared two weeks post-illness

Chapter 9: Discussion 229
notification, prior to the development of chronic cough, and persisted at 3- and 4-
weeks post-illness notification. It is unclear what specific factors contributed to the
significantly higher costs of chronic cough episodes so early during the ARIwC
episode.
In the study of children presenting to an ED for their ARIwC, cough duration in the
four weeks following the ED presentation at study enrolment was not significantly
associated with total cost per episode of ARIwC. However, cough duration prior to ED
presentation was significantly associated with total cost per episode. At the time of
ED presentation, approximately 10% of participants reported having a sub-acute
cough and it was estimated that the total cost of illness for these participants was
greater by $1985 (95% CI 698, 3272), compared to children with acute cough at the
time of ED presentation. Similarly, at the time of ED presentation, approximately 10%
of participants reported having a chronic cough and it was estimated that the total
cost of illness for these participants was greater by $2490 (95% CI 840, 4140),
compared to children with acute cough at the time of ED presentation. Cough
duration prior to illness notification was not explored as a factor influencing cost of
illness in the TLSIM study and so it is unclear of its significance among non-
hospitalised episodes of ARIwC among Indigenous Australian children.
Overall, cough duration is evidently an important factor influencing the cost of illness
among both community-managed episodes of ARIwC and episodes of ARIwC
requiring presentation to ED and/or hospitalisation. Therefore, cough resolution is a
worthwhile objective, not only from a clinical perspective, but also from an economic
perspective. The effectiveness of interventions to reduce the economic burden of
chronic cough may rely on the ability to intervene during the acute phase of illness,
as a disproportionate amount of the economic burden appears to fall early within the
cough’s duration. However, classification of a cough as chronic, prior to it becoming
chronic, is difficult. Identification of factors associated with an increased risk of
developing chronic cough would be beneficial as a way of both preventing the
development of chronic cough and reducing economic burden. Currently, there are
few studies examining predictors of chronic cough and it is therefore an important
230 Chapter 9: Discussion
direction for future research. Future research could also explore the influence of
cough duration on economic burden over a longer time period, as neither of the
costing studies in this thesis examined cough duration or resource use beyond a 4-
week period post-illness notification/ post-study enrolment.
9.2.5 Research question 2c
Among Indigenous and non-Indigenous Australian children aged <15 years presenting
to primary healthcare clinics and/or EDs with ARIwC, what child, family and illness-
related characteristics are associated with a greater economic burden of illness?
[Chapters 5 and 6 – the TLSIM Study and the EDC Study]
These studies addressed the lack of research on characteristics associated with the
cost of illness of ARIwC among young Indigenous Australian children and Australian
children presenting to EDs.196 Among Indigenous Australian children, a history of
wheezing, connections with traditional lands/homelands and having a
parent/guardian who believed that “antibiotics prescribed by a doctor should be
given until symptoms resolve” were all significantly associated with a higher cost per
child-month of observation due to ARIwC. An important finding of this study was the
influence of cultural characteristics on cost of illness. Children from families who had
connections with traditional lands had significantly higher costs per month of
observation as a result of ARIwC episodes, compared to children from families who
did not report having connections with traditional lands. There is very limited
quantitative research within Australia on the influence of historical and cultural
factors on the health and wellbeing of Indigenous Australian peoples, particularly on
child health outcomes. The ABS has reported results from the 2008 National
Aboriginal and Torres Strait Islander Social Survey regarding the effect of being
removed from natural family on selected health outcomes. Among survey
respondents aged ≥15 years who reported removal from natural family, 83%
recognised homelands or traditional country and 71% identified with a clan, tribal or
language group. Survey respondents aged ≥15 years who had personally experienced
removal from their natural family were more likely to have a disability or chronic
Chapter 9: Discussion 231
health condition, more likely to be a current daily smoker and more likely to have
used illicit substances.276 The mechanisms by which connection with traditional lands
is associated with an increased cost of illness are likely to be complex and
multifaceted. Without further information, including input from Indigenous
Australians themselves, it is difficult to draw any definite conclusions from this
finding.
As discussed previously, among children presenting to an ED for their ARIwC, greater
cough duration prior to ED presentation was independently and significantly
associated with higher cost per illness. In addition to this, overall illness duration (i.e.
inclusive of symptoms other than cough) was also associated with increased cost per
illness. Unsurprisingly, being admitted to the hospital as an inpatient following the
ED presentation was significantly and substantially associated with a higher cost per
illness. However, other factors related to the ED presentation, such as triage category
and primary discharge diagnosis, were not found to significantly influence total cost
of illness.
Having a mother with a tertiary education was associated with a significantly lower
cost per episode of ARIwC among the cohort of children presenting to ED. Among this
cohort 48% of mothers had a tertiary level education; a further 27% of mothers had
a post-school qualification of a diploma or certificate. This compares to only 14% of
mothers in the TLSIM cohort of Indigenous Australian children who had any sort of
post-school qualification. The considerable differences in population demographics
may explain why education was not a significant predictor of cost of illness among
the TLSIM study cohort.
Season of illness was a factor that was identified as influencing the cost per episode
of ARIwC illness in both studies, despite the studies being conducted in different
settings and within different populations. For the non-hospitalised episodes among
the cohort of young Indigenous Australian children, episodes that began in winter
were significantly more costly than episodes that began in spring, summer or autumn.
For the episodes among the cohort of Australian children to an ED, participants who

232 Chapter 9: Discussion
presented to the ED during autumn or winter had significantly higher costs relative
to spring and summer.
Overall, a number of child, family, and illness-related characteristics were identified
as being associated with cost of illness. These findings need to be validated among
other studies of the economic burden of ARIs and cough among Australian children.
Additionally, the extent to which the factors identified as being significantly
associated with cost of illness are amenable to intervention needs to be considered
and explored in future research studies. Factors such as connections to traditional
lands for Indigenous Australians and maternal education attainment are population-
level factors that will likely require long-term investment in social and cultural
change, yet may also confer benefit to other aspects of health beyond respiratory. In
contrast, clinical and behavioural factors such as admission to hospital, a history of
wheezing and duration of antibiotics consumption may be factors that are likely to
be responsive to targeted interventions within specific settings and populations, and
therefore may facilitate more immediate outcomes on an individual-patient level.
9.2.6 Research question 2d
Among Indigenous and non-Indigenous Australian children aged <15 years presenting
to primary healthcare clinics and/or EDs with ARIwC, what child, family and illness-
related characteristics are associated with cough-specific quality of life (QoL)?
[Chapter 7 – The EDC Study]
This study addressed the lack of research on changes in QoL over the duration of an
episode of ARIwC and what characteristics are associated with QoL over this
period.226 The EDC study identified that cough-specific QoL was low at the time of
presentation to ED. This likely reflects the peak of parent-perceived illness severity
which prompted the decision to seek emergency healthcare. Participants in the EDC
cohort study were otherwise healthy children, the majority of whom experienced a
rapid onset of illness. Parents of children in the EDC study did not necessarily know
how or why their child was sick from a diagnosis perspective and therefore may have

Chapter 9: Discussion 233
been more uncertain about the well-being of the child, as well as the need to seek
healthcare. As cough severity decreased over the duration of the episode, cough-
specific QoL also improved.
A number of other factors were also identified as being associated with cough-
specific QoL at time of presentation as well as cough-specific QoL over the 4-week
follow-up period. A greater level of concern among parents/guardians about the
amount of money lost due to their cough were associated with poorer cough-specific
QoL at all timepoints. As patient-centred care and patient-centred outcomes are
nowadays a priority of public health research and clinical practice,277 it is important
to understand and appreciate the concerns parents may have about the financial
impact of the child’s illness even when the illness is acute. The extent to which these
financial concerns influence parent’s decisions and choices with respect to seeking
healthcare, and thereby potentially influence child health outcomes, is unclear and
should be explored in future research. Having private health insurance was
associated with higher cough-specific QoL over the follow-up period and may
influence cost of illness and therefore a parent’s level of financial concern.
A higher level of parent/guardian education was also associated with better cough-
specific QoL, however at the time of ED presentation it was maternal education level
that was significant, whereas during the follow-up period paternal education was
significant. The reasons for these differences are unclear but could be related to
which parent was caring for the child at the time. Although, perhaps more plausible
is that maternal and paternal education levels are likely to be correlated and
therefore may be proxy variables for each other.
Three variables related to ARIwC-related resource use were associated with poorer
cough-specific QoL over the follow-up period: child having taken medications in the
past week, child having seen a health professional in the past week and the primary
carer having missed any usual activities in the past week. In addition, a number of
factors identified in the TLSIM and EDC studies as being associated with cost of ARIwC
were also identified as being associated with cough-specific QoL in the EDC study.

234 Chapter 9: Discussion
These were a history of wheezing, maternal educational attainment, and parent
financial concerns about the amount of money spent of the child’s cough illness. In
light of these findings, there is a strong imperative to address factors which are
associated with both the economic burden of illness, as well as the impact of the
illness on QoL. Addressing these factors will likely have substantial positive benefits
for both families and health services simultaneously.
Finally, in addition to addressing the aforementioned factors associated with cough-
specific QoL among this cohort, health professionals should be encouraged more
broadly to make the most of opportunities to enhance parent’s ability and confidence
to manage their child’s cough illness effectively and appropriately.
9.2.7 Research question 3
Among Indigenous and non-Indigenous Australian children aged <15 years presenting
to primary healthcare clinics and/or EDs who develop chronic cough following an
episode of ARIwC, is early intervention using a cough management algorithm cost-
effective at achieving cough resolution from the perspective of the public healthcare
system and caretakers? [Chapter 8 – The RICCi Study]
This study addressed the lack of research on the cost-effectiveness of early
intervention among children with chronic cough using an evidence-based cough
management algorithm. Among the 45 children allocated to the intervention group
and for whom the outcome of cough resolution was known, 73% reported cough
resolution by 4 weeks post-randomisation. This compared to 51% of the 45 children
allocated to the usual care group for whom the outcome of cough resolution was
known. From the perspective of the public healthcare system, mean costs were
higher for the intervention group, compared to the usual care group ($179 vs $135).
It was estimated that use of the intervention resulted in a cost per additional cough
resolution of $704 from the perspective of public healthcare system and that there
was an 8% probability that the intervention was both cheaper and more effective
from this cost perspective. In contrast, from the perspective of caretakers, mean

Chapter 9: Discussion 235
costs were higher for the usual care group, compared to the intervention group ($444
vs $386). It was estimated that use of the intervention resulted in a cost saving of
$488 per cough resolution from the perspective of caretakers and there was a 52%
probability that the intervention was both cheaper and more effective from this cost
perspective.
The potential cost savings associated with the intervention from the perspective of
caretakers is a promising finding, however it is important to recognise that this cost-
saving may occur at the expense of the public healthcare system, which incurred the
majority of the direct costs of the intervention. Whether approximately $700 is a cost
that the public healthcare system is willing to pay for an additional cough resolution
is yet to be determined.
A significant gap in the literature that limits the ability to interpret these findings and
draw clear conclusions about the value of cough resolution, is the lack of research to
investigate and quantify the association between chronic cough and future
respiratory health outcomes and healthcare utilisation. Until the body of evidence in
this area is better established, it is difficult to make recommendations for clinical and
public health practice. Given that the use of a cough management algorithm by a
paediatrician may assist in the diagnosis of underlying respiratory conditions and risk
factors for poor health outcomes for a child, it is plausible that the benefits of the
intervention may extend beyond the current chronic cough episode. Among the 90
participants included in the intention-to-treat cost-effectiveness analysis, almost half
(47%) reported that the child had experienced a previous episode of chronic cough.
No information was collected on the diagnosis, management or treatment of
previous episodes of chronic cough. It is unclear whether the use of a cough
management algorithm during a first episode of chronic cough could prevent, or
improve management of, further episodes. Recent qualitative research suggests that
in some Indigenous communities in Australia, the occurrence of chronic wet cough
among children has become normalised among both health professionals and
community members.47 Consequently, barriers to appropriate management of
236 Chapter 9: Discussion
chronic cough by health professionals need to be explored and studies that plan to
evaluate the cost-effectiveness of the cough management algorithm in primary
healthcare settings would need to examine adherence to the algorithm.
Approximately one-third of the participants included in this economic evaluation
were identified as Indigenous Australian children. There is a recognised global
shortage of studies examining the cost-effectiveness of health interventions among
Indigenous populations.8 In order to ensure efficient and equitable distribution of
resources and to maximise the potential for improving the health of Indigenous
Australian populations, evidence on the economic value of clinical and public health
interventions is essential.5
Given that this is the first study to have conducted an economic evaluation of this
cough management algorithm among Australian children with chronic cough,
additional research is required to validate the study findings, particularly in larger
study cohorts and in different populations and settings across Australia.
Nevertheless, the findings of this study are likely to be generalisable to Indigenous
and non-Indigenous Australian children living in urban and regional areas, who
present to primary care or an ED with a low triage category, and who have access to
specialist services. The findings are unlikely to be generalisable to Australian children
with higher severity of illness requiring hospitalisation, and Australian children living
in rural and remote areas.
9.3 STRENGTHS AND LIMITATIONS
9.3.1 Strengths
A key strength of this thesis was the focus on Indigenous Australian children, in
particular Indigenous Australian children living in urban areas. The lack of health
research conducted among this population has been highlighted previously. Eades et
al.7 reported that during 2004-2009, of all peer-reviewed articles published about the

Chapter 9: Discussion 237
health of Indigenous Australians, only 23% of articles either focused exclusively on
urban populations, or included information or analyses on urban populations.
Furthermore, only 4% of articles reported on urban Indigenous Australian child
health. Yet, in 2016, 61% of Indigenous Australians lived in either a ‘Major City’ or an
‘Inner Regional’ area of Australia.227 Findings of research conducted in certain
geographical locations may not be applicable to other geographical locations given
potential differences in socio-demographic characteristics, as well as delivery, access
and use of healthcare services. As unavailability of appropriate information regarding
the health of urban Indigenous Australian populations poses a barrier to reducing the
disparities in health outcomes between Indigenous and non-Indigenous Australian
children, quality culturally-sensitive research in these populations needs to be
prioritised.
For each of the economic-based studies included in this thesis, comprehensive
costing of illness from multiple cost perspectives, including caretakers, the public
healthcare system and third parties, was undertaken. This ensured that the estimates
of costs in each study were an accurate representation of the economic burden of
respiratory illnesses among children. A recent paper identified, through a Delphi
consensus process, a list of core items of resource use recommended for inclusion in
an economic evaluation of a healthcare intervention from a healthcare
perspective.278 The economic studies in this thesis collected data on use of all 10
resource use items identified in the final list, suggesting that the priorities followed
in this thesis are reflective of best practices. The evaluation of costs associated with
illness and/or the intervention from the perspective of caretakers was also inclusive
of a wide range of resource use items, including any time spent seeking healthcare
for the child and additional time spent caring for the child. While a number of
different methods have been proposed regarding how to value this time, referred to
as ‘informal care’, most agree that the valuation of informal care is important.279-282
The valuation of care provided to a child at the expense of paid employment is
relatively straightforward, however valuation of care provided to a child at the
expense of non-work activities, including leisure time, is more complex. Costing
informal care is particularly relevant in paediatric research given children are almost

238 Chapter 9: Discussion
always under the care of someone older than them when they are sick and therefore
the burden of informal care can be substantial. Consequently, all economic studies in
this thesis employed established methods of valuing informal care in order to avoid
underestimating the burden of the illness.
Patient recall is acknowledged as a key challenge in studies costing illness and/or
interventions.283 A strength of all the studies included in the thesis was the
prospective study design and frequent follow-ups. Of the four studies, three collected
data from parents/guardians on a weekly basis, thereby decreasing the risk of recall
bias and increasing the reliability and accuracy of the data collected. The fourth study
collected data from parents/guardians on a monthly basis. A multi-country study
published in 2013 determined that a 7-day illness recall period was an acceptable
time period to ensure the accuracy of caregiver reported paediatric respiratory
illnesses.284 While that study examined recall of the prevalence of illness, it is not
unreasonable to assume that it also applies to caregiver reported resource use.
9.3.2 Limitations
The main limitations of the studies within this thesis are (a) the use of parent-
reported data on cough outcomes and resource use, (b) the occurrence of missing
data, and (c) the assumptions made when selecting and applying unit costs and
analysing resource use data.
In all four studies, data on cough outcomes and resource use were predominantly
self-reported by parents/guardians. As such, the accuracy of the findings of this thesis
rely to an extent on accurate reporting by parents/guardians. No objective measures
were used to assess cough outcomes. Cough resolution was assessed by asking
parents/guardians whether their child had experience a break in cough for ≥3
consecutive days and nights. This method of determining cough resolution has not
been validated, but has been used in previous paediatric respiratory research.149,206
Cough severity was assessed using a verbal category descriptive (VCD) score
completed by the parent/guardian. This tool has been shown to be moderately
Chapter 9: Discussion 239
correlated to objective measures of cough and more correlated than other subjective
methods, yet still somewhat variable.41,285 Given there are few alternatives, the VCD
has also been used extensively in previous paediatric respiratory research. With
respect to the measurement of illness-related resource use, all data were
parent/guardian-reported. Except for hospitalisations and some diagnostics tests,
resource use was not confirmed with any other sources such as medical records.
There are few studies examining the accuracy of research participants reporting
resource use in health economic studies. Studies which have attempted to do this are
not directly applicable to the studies in this thesis due to differences in study
populations, illnesses and follow-up time periods.286,287
Missing data were consistently an issue across all studies given the reliance on
parent/guardian-reported data. Across all four studies, rates of successful contact
generally decreased as the studies progressed, suggesting a decrease in
parent/guardian engagement for what could conceivably be a variety of reasons.
Some characteristics were identified as being significantly different between those
participants who completed the study (and therefore had complete data), compared
to those participants who did not complete the study (and therefore had missing
data). For the TLSIM study, characteristics associated with missing data were having
no family history of lung disease, not maintaining cultural connections at home,
having spent time in an Indigenous community during the 12 months prior to study
enrolment and exposure to household tobacco smoke. For the EDC QoL study,
characteristics associated with being LTFU or withdrawing from the study included
having a younger aged father and not having private health insurance. For the EDC
cost of illness study, enrolment in spring or summer, a history of itchy rash, having
no allergies and a maternal education level of high school or lower were associated
with having incomplete data. Where possible, missing data was dealt with using
statistical methods such as multiple imputation which takes into account the
characteristics associated with missing data. Nevertheless, these differences may still
limit, to an extent, the representativeness of the study populations to the broader
population.
240 Chapter 9: Discussion
Finally, a number of assumptions were made during the selection of unit costs and
the analysis of resource use data which may have affected estimates of cost. The
specifics of these assumptions were detailed extensively in Chapter 3. The
assumptions were determined with input from clinical, epidemiological and health
economic researchers; and were applied consistently across all participants in all
studies. Furthermore, a ‘minimum cost’ approach was taken in order to ensure any
misrepresentation of costs resulted in an underestimation of costs, rather than an
overestimation. While the potential inaccuracies introduced by the totality of these
assumptions were not able to be quantified, the assumptions that are likely to have
had the greatest impact on the cost of illness estimates were those made in relation
to the valuation of caretaker’s time off work and non-work activities. It is
recommended that future studies explore and compare the use and impact of
alternative methods of valuing caretaker’s time of work and non-work activities.
Greater accuracy in cost estimates may be achieved by using participant-reported
hourly incomes, however the desire for greater accuracy needs to be balanced with
ethical and practical considerations regarding the collection of such data.
9.4 CONCLUSION
Overall, this thesis has examined the economic burden and impact on QoL of a
number of respiratory illnesses among Indigenous and non-Indigenous children
seeking healthcare in a variety of settings, including primary care, emergency
departments and tertiary specialist clinics. The findings of this thesis reinforce the
substantial impact of paediatric respiratory illness on families and health services.
They also emphasise the importance of both the prevention and appropriate
management of respiratory illnesses from both a clinical and public health
perspective.
Given the influence of cough characteristics such as duration and severity of both the
cost of illness and the impact on quality of life, cough management and resolution
should continue to be the focus of clinical guidelines and clinical practice. Continued
Chapter 9: Discussion 241
efforts are required to identify public health strategies to prevent and manage both
acute respiratory infections, as well as chronic respiratory diseases. Addressing
factors that are associated with the incidence of respiratory illnesses, as well as the
cost and impact on quality of life, will assist in simultaneously alleviating the burden
of disease from a clinical, epidemiological, economic, and quality of life perspective.
Interventions that succeed in doing so are likely to have a positive influence on health
and wellbeing of children and families. It is crucial, however, that such interventions
are evaluated for both their clinical- and cost-effectiveness to ensure efficient and
equitable allocation of resources.
Finally, the findings presented within this thesis highlight the need for further
research in a number of areas. From a clinical and public health perspective, the most
pressing research to be conducted includes studies to: estimate the cost of
bronchiectasis and bronchiectasis management, identify risk factors for the
development of chronic cough and explore the use of the cough management
algorithm in a primary care setting.

242 Chapter 9: Discussion
Bibliography 243
Bibliography
1. Australian Institute of Health and Welfare. Australian Burden of Disease
Study: Impact and causes of illness and death in Australia 2011. Australian Burden
of Disease Study series no. 3. BOD 4. Canberra: AIHW; 2016.
2. Charles J, Pan Y, Britt H. Trends in childhood illness and treatment in
Australian general practice, 1971-2001. Med J Aust. 2004; 180(5): 216-9.
3. Acworth J, Babl F, Borland M, Ngo P, Krieser D, Schutz J, et al. Patterns of
presentation to the Australian and New Zealand Paediatric Emergency Research
Network. Emerg Med Australas. 2009; 21(1): 59-66.
4. De Civita M, Regier D, Alamgir AH, Anis AH, FitzGerald MJ, Marra CA.
Evaluating health-related quality-of-life studies in paediatric populations.
Pharmacoeconomics. 2005; 23(7): 659-85.
5. Angell B, Eades S, Jan S. To Close the Gap we need to identify the best (and
worst) buys in Indigenous health. Aust N Z J Public Health. 2017; 41(3): 224-6.
6. Carville KS, Lehmann D, Hall G, Moore H, Richmond P, de Klerk N, et al.
Infection is the major component of the disease burden in Aboriginal and non-
Aboriginal Australian children - A population-based study. Pediatr Infect Dis J. 2007;
26(3): 210-6.
7. Eades SJ, Taylor B, Bailey S, Williamson AB, Craig JC, Redman S, et al. The
health of urban Aboriginal people: Insufficient data to close the gap. Med J Aust.
2010; 193(9): 521-4.
8. Angell BJ, Muhunthan J, Irving M, Eades S, Jan S. Global systematic review of
the cost-effectiveness of Indigenous health interventions. PLoS One. 2014; 9(11):
e111249.
9. Angell B, Muhunthan J, Eades A-M, Cunningham J, Garvey G, Cass A, et al.
The health-related quality of life of Indigenous populations: a global systematic
review. Qual Life Res. 2016; 25(9): 2161-78.
10. Zar HJ, Ferkol TW. The global burden of respiratory disease—impact on child
health. Pediatr Pulmonol. 2014; 49(5): 430-4.
244 Bibliography
11. Nair H, Simões EAF, Rudan I, Gessner BD, Azziz-Baumgartner E, Zhang JSF, et
al. Global and regional burden of hospital admissions for severe acute lower
respiratory infections in young children in 2010: A systematic analysis. The Lancet.
2013; 381(9875): 1380-90.
12. Fischer Walker CL, Rudan I, Liu L, Nair H, Theodoratou E, Bhutta ZA, et al.
Global burden of childhood pneumonia and diarrhoea. The Lancet. 2013; 381(9875):
1405-16.
13. SCRGSP (Steering Committee for the Review of Government Service
Provision). Overcoming Indigenous Disadvantage: Key Indicators 2016. Canberra:
Productivity Commission; 2016.
14. Chang AB. Cough. Pediatr Clin North Am. 2009; 56(1): 19-31.
15. Sarna M, Ware RS, Sloots TP, Nissen MD, Grimwood K, Lambert SB. The
burden of community-managed acute respiratory infections in the first 2-years of
life. Pediatr Pulmonol. 2016; 51(12): 1336-46.
16. Kusel MMH, De Klerk NH, Holt PG, Kebadze T, Johnston SL, Sly PD. Role of
respiratory viruses in acute upper and lower respiratory tract illness in the first year
of life: A birth cohort study. Pediatr Infect Dis J. 2006; 25(8): 680-6.
17. Von Linstow ML, Holst KK, Larsen K, Koch A, Andersen PK, Høgh B. Acute
respiratory symptoms and general illness during the first year of life: A population-
based birth cohort study. Pediatr Pulmonol. 2008; 43(6): 584-93.
18. Hay AD, Heron J, Ness A. The prevalence of symptoms and consultations in
pre-school children in the Avon Longitudinal Study of Parents and Children
(ALSPAC): a prospective cohort study. Fam Pract. 2005; 22.
19. McCallum GB, Chatfield MD, Morris PS, Chang AB. Risk factors for adverse
outcomes of Indigenous infants hospitalized with bronchiolitis. Pediatr Pulmonol.
2016; 51(6): 613-23.
20. Chang AB, Oppenheimer JJ, Weinberger MM, Rubin BK, Grant CC, Weir K, et
al. Management of children with chronic wet cough and protracted bacterial
bronchitis: CHEST guideline and expert panel report. Chest. 2017; 151(4): 884-90.
21. Marchant JM, Masters IB, Taylor SM, Cox NC, Seymour GJ, Chang AB.
Evaluation and outcome of young children with chronic cough. Chest. 2006; 129(5):
1132-41.

Bibliography 245
22. Singleton RJ, Valery PC, Morris P, Byrnes CA, Grimwood K, Redding G, et al.
Indigenous children from three countries with non-cystic fibrosis chronic
suppurative lung disease/bronchiectasis. Pediatr Pulmonol. 2014; 49(2): 189-200.
23. Zgherea D, Pagala S, Mendiratta M, Marcus MG, Shelov SP, Kazachkov M.
Bronchoscopic findings in children with chronic wet cough. Pediatrics. 2012; 129(2):
e364-e9.
24. Chang A, Redding G, Everard M. Chronic wet cough: protracted bronchitis,
chronic suppurative lung disease and bronchiectasis. Pediatr Pulmonol. 2008; 43(6):
519-31.
25. Wurzel DF, Marchant JM, Clark JE, Masters IB, Yerkovich ST, Upham JW, et
al. Wet cough in children: infective and inflammatory characteristics in broncho-
alveolar lavage fluid. Pediatr Pulmonol. 2014; 49(6): 561-8.
26. Kapur N, Masters IB, Morris PS, Galligan J, Ware R, Chang AB. Defining
pulmonary exacerbation in children with non-cystic fibrosis bronchiectasis. Pediatr
Pulmonol. 2012; 47(1): 68-75.
27. Shoham Y, Dagan R, Givon-Lavi N, Liss Z, Shagan T, Zamir O, et al.
Community-acquired pneumonia in children: Quantifying the burden on patients
and their families including decrease in quality of life. Pediatrics. 2005; 115(5):
1213-9.
28. Hay AD, Wilson A, Fahey T, Peters TJ. The duration of acute cough in pre-
school children presenting to primary care: a prospective cohort study. Fam Pract.
2003; 20(6): 696-705.
29. Chang AB, Landau LI, Van Asperen PP, Glasgow NJ, Robertson CF, Marchant
JM, et al. Cough in children: definitions and clinical evaluation. Med J Aust. 2006;
184(8): 398.
30. Gibson PG, Chang AB, Glasgow NJ, Holmes PW, Katelaris P, Kemp AS, et al.
CICADA: Cough in children and adults: Diagnosis and assessment. Australian cough
guidelines summary statement. Med J Aust. 2010; 192(5): 265-71.
31. O'Grady KF, Grimwood K, Sloots TP, Whiley DM, Acworth JP, Phillips N, et al.
Prevalence, codetection and seasonal distribution of upper airway viruses and
bacteria in children with acute respiratory illnesses with cough as a symptom. Clin
Microbiol Infect. 2016; 22(6): 527-34.

246 Bibliography
32. Thompson M, Vodicka TA, Blair PS, Buckley DI, Heneghan C, Hay AD.
Duration of symptoms of respiratory tract infections in children: Systematic review.
BMJ Open. 2013; 347.
33. Cagney M, MacIntyre CR, McIntyre P, Torvaldsen S, Melot V. Cough
symptoms in children aged 5–14years in Sydney, Australia: non-specific cough or
unrecognized pertussis? Respirology. 2005; 10(3): 359-64.
34. O’Grady K-AF, Drescher BJ, Goyal V, Phillips N, Acworth J, Marchant JM, et
al. Chronic cough postacute respiratory illness in children: a cohort study. Arch Dis
Child. 2017; 102(11): 1044-8.
35. O'Grady KAF, Grimwood K, Sloots TP, Whiley DM, Acworth JP, Phillips N, et
al. Upper airway viruses and bacteria and clinical outcomes in children with cough.
Pediatr Pulmonol. 2017; 52(3): 373-81.
36. Hall KK, Chang AB, Anderson J, Arnold D, Goyal V, Dunbar M, et al. The
incidence and short-term outcomes of acute respiratory illness with cough in
children from a socioeconomically disadvantaged urban community in Australia: A
community-based prospective cohort study. Front Pediatr. 2017; 5: 228.
37. Hall KK, Chang AB, Anderson J, Dunbar M, Arnold D, O'Grady KF.
Characteristics and respiratory risk profile of children aged less than 5 years
presenting to an urban, Aboriginal-friendly, comprehensive primary health practice
in Australia. J Paediatr Child Health. 2017; 53(7): 636-43.
38. Shields MD, Bush A, Everard ML, McKenzie S, Primhak R. Recommendations
for the assessment and management of cough in children. Thorax. 2008; 63(3): iii1-
iii15.
39. Chang AB, Glomb WB. Guidelines for evaluating chronic cough in pediatrics:
ACCP evidence-based clinical practice guidelines. Chest. 2006; 129(1): 260S-83S.
40. Chang AB, Oppenheimer JJ, Weinberger M, Weir K, Rubin BK, Irwin RS. Use
of management pathways or algorithms in children with chronic cough. Chest. 2016;
149(1): 106-19.
41. Chang AB, Newman RG, Carlin JB, Phelan PD, Robertson CF. Subjective
scoring of cough in children: parent-completed vs child-completed diary cards vs an
objective method. Eur Respir J. 1998; 11(2): 462-6.

Bibliography 247
42. Chang AB, Phelan PD, Robertson CF, Roberts RGD, Sawyer SM. Relation
between measurements of cough severity. Arch Dis Child. 2003; 88(1): 57-60.
43. Anderson-James S, Newcombe PA, Marchant JM, O'Grady KAF, Acworth JP,
Stone DG, et al. An acute cough-specific quality-of-life questionnaire for children:
Development and validation. J Allergy Clin Immunol. 2015.
44. Newcombe PA, Sheffield JK, Juniper EF, Marchant JM, Halsted RA, Masters
IB, et al. Development of a parent-proxy quality-of-life chronic cough-specific
questionnaire: Clinical impact vs psychometric evaluations. Chest. 2008; 133(2):
386-95.
45. Newcombe PA, Sheffield JK, Chang AB. Parent cough-specific quality of life:
Development and validation of a short form. J Allergy Clin Immunol. 2013; 131(4):
1069-74.
46. Ingram J, Cabral C, Hay AD, Lucas PJ, Horwood J. Parents’ information needs,
self-efficacy and influences on consulting for childhood respiratory tract infections:
a qualitative study. BMC Fam Pract. 2013; 14(1): 106.
47. D'Sylva P, Walker R, Lane M, Chang AB, Schultz A. Chronic wet cough in
Aboriginal children: It's not just a cough. J Paediatr Child Health. 2018.
48. Kotsimbos T, Armstrong D, Buckmaster N, de Looze F, Hart D, Holmes P, et
al. Respiratory infectious disease burden in Australia. The Australian Lung
Foundation; 2007.
49. Australian Institute of Health and Welfare. Deaths in Australia Cat. no: PHE
229. 2018.Canberra: AIHW.
50. WHO and Maternal and Child Epidemiology Estimation Group (MCEE). Child
Mortality Estimates: Global and regional child deaths by cause. In: UNICEF Data and
Analytics Section- Division of Data Research and Policy, editor. 2018.Geneva: WHO.
51. Chen Y, Kirk MD. Incidence of acute respiratory infections in Australia.
Epidemiol Infect. 2014; 142(7): 1355-61.
52. Australian Institute of Health and Welfare. Aboriginal and Torres Strait
Islander Health Performance Framework 2010: detailed analyses; Tier 1: 1.04
Hospitalisations for pneumonia Canberra: AIHW; 2011.

248 Bibliography
53. Kusel MMH, De Klerk N, Holt PG, Landau LI, Sly PD. Occurrence and
management of acute respiratory illnesses in early childhood. J Paediatr Child
Health. 2007; 43(3): 139-46.
54. Lambert SB, O'Grady KF, Gabriel SH, Nolan TM. Respiratory illness during
winter: A cohort study of urban children from temperate Australia. J Paediatr Child
Health. 2005; 41(3): 125-9.
55. Leder K, Sinclair MI, Mitakakis TZ, Hellard ME, et al. A community-based
study of respiratory episodes in Melbourne, Australia. Aust N Z J Public Health.
2003; 27(4): 399-404.
56. Chen Y, Williams E, Kirk M. Risk factors for acute respiratory infection in the
Australian community. PLoS One. 2014; 9(7): e101440.
57. Paranjothy S, Dunstan F, Watkins WJ, Hyatt M, Demmler JC, Lyons RA, et al.
Gestational age, birth weight, and risk of respiratory hospital admission in
childhood. Pediatrics. 2013; 132(6): E1562-E9.
58. Barnes R, Blyth CC, de Klerk N, Lee WH, Borland ML, Richmond P, et al.
Geographical disparities in emergency department presentations for acute
respiratory infections and risk factors for presenting: a population-based cohort
study of Western Australian children. BMJ open. 2019; 9(2): e025360.
59. Department of Health [Australia]. National Notifiable Diseases Surveillance
System: notifications of a selected disease by age group, sex and year 2019.
Canberra: Australian Government.
60. Ranmuthugala G, Brown L, Lidbury BA. Respiratory syncytial virus--the
unrecognised cause of health and economic burden among young children in
Australia. Commun Dis Intell. 2011; 35(2): 177-84.
61. Wilson RD, & Australia Human Rights and Equal Opportunity Commission,.
Bringing them home: Report of the National Inquiry into the Separation of
Aboriginal and Torres Strait Islander Children from Their Families. Sydney: Human
Rights and Equal Opportunity Commission; 1997.
62. Porta M. A dictionary of epidemiology (6th ed): Oxford University Press;
2014.
63. Australian Institute of Health and Welfare. Asthma, chronic obstructive
pulmonary disease and other respiratory diseases in Australia 2010 AIHW Cat. no.
Bibliography 249
ACM 20.Available from: https://www.aihw.gov.au/getmedia/0b5e6ea6-0a53-4d3e-
890b-87688b233216/10518.pdf.aspx?inline=true.
64. Blackall SR, Hong JB, King P, Wong C, Einsiedel L, Rémond MG, et al.
Bronchiectasis in indigenous and non-indigenous residents of Australia and New
Zealand. Respirology. 2018; 23(8): 743-9.
65. Das L, Kovesi TA. Bronchiectasis in children from Qikiqtani (Baffin) Region,
Nunavut, Canada. Ann Am Thorac Soc. 2015; 12(1): 96-100.
66. Kinghorn B, Singleton R, McCallum GB, Bulkow L, Grimwood K, Hermann L,
et al. Clinical course of chronic suppurative lung disease and bronchiectasis in
Alaska Native children. Pediatr Pulmonol. 2018; 53(12): 1662-9.
67. Redding GJ, Singleton RJ, Valery PC, Williams H, Grimwood K, Morris PS, et
al. Respiratory exacerbations in indigenous children from two countries with non-
cystic fibrosis chronic suppurative lung disease/bronchiectasis. Chest. 2014; 146(3):
762-74.
68. Chang AB, Bush A, Grimwood K. Bronchiectasis in children: diagnosis and
treatment. The Lancet. 2018; 392(10150): 866-79.
69. McCallum GB, Binks MJ. The epidemiology of chronic suppurative lung
disease and bronchiectasis in children and adolescents. Front Pediatr. 2017; 5: 27.
70. Brower KS, Del Vecchio MT, Aronoff SC. The etiologies of non-CF
bronchiectasis in childhood: A systematic review of 989 subjects. BMC Pediatr.
2014; 14(1).
71. Chang AB, Masel JP, Boyce NC, Wheaton G, Torzillo PJ. Non-CF
bronchiectasis: Clinical and HRCT evaluation. Pediatr Pulmonol. 2003; 35(6): 477-83.
72. O'Grady KAF, Torzillo PJ, Chang AB. Hospitalisation of Indigenous children in
the Northern Territory for lower respiratory illness in the first year of life. Med J
Aust. 2010; 192(10): 586-90.
73. Janu EK, Annabattula BI, Kumariah S, Zajaczkowska M, Whitehall JS, Edwards
MJ, et al. Paediatric hospitalisations for lower respiratory tract infections in Mount
Isa. Med J Aust. 2014; 200(10): 591-4.
74. Edwards EA, Asher MI, Byrnes CA. Paediatric bronchiectasis in the twenty-
first century: Experience of a tertiary children's hospital in New Zealand. J Paediatr
Child Health. 2003; 39(2): 111-7.
250 Bibliography
75. Monteagudo M, Rodríguez-Blanco T, Barrecheguren M, Simonet P,
Miravitlles M. Prevalence and incidence of bronchiectasis in Catalonia, Spain: A
population-based study. Respir Med. 2016; 121: 26-31.
76. Australian Institute of Health and Welfare. Primary health care in Australia.
Canberra: AIHW; 2016.
77. Biezen R, Pollack AJ, Harrison C, Brijnath B, Grando D, Britt HC, et al.
Respiratory tract infections among children younger than 5 years: current
management in Australian general practice. Med J Aust. 2015; 202(5): 262-5.
78. Najnin N, Sinclair M, Forbes A, Leder K. Community based study to compare
the incidence and health services utilization pyramid for gastrointestinal,
respiratory and dermal symptoms. BMC Health Serv Res. 2012; 12: 211.
79. Clucas DB, Carville KS, Connors C, Currie BJ, Carapetis JR, Andrews RM.
Disease burden and health-care clinic attendances for young children in remote
aboriginal communities of northern Australia. Bull World Health Organ. 2008; 86(4):
275-81.
80. Kearns T, Clucas D, Connors C, Currie BJ, Carapetis JR, Andrews RM. Clinic
attendances during the first 12 months of life for Aboriginal children in five remote
communities of Northern Australia. PLoS One. 2013; 8(3).
81. Hendrickx D, Bowen AC, Marsh JA, Carapetis JR, Walker R. Ascertaining
infectious disease burden through primary care clinic attendance among young
Aboriginal children living in four remote communities in Western Australia. PLoS
One. 2018; 13(9): e0203684.
82. Hall KK, Chang AB, Anderson J, Arnold D, Otim M, O'grady KaF. Health
service utilisation amongst urban Aboriginal and Torres Strait Islander children aged
younger than 5 years registered with a primary health-care service in South-East
Queensland. J Paediatr Child Health. 2018; 54(6): 671-6.
83. Britt H MG, Henderson J, Bayram C, Harrison C, Valenti L, Pan Y, Charles J,
Pollack AJ, Wong C, Gordon J, . General practice activity in Australia 2015–16.
General practice series no. 40. Sydney: Sydney University Press; 2016.
84. Marchant JM, Newcombe PA, Juniper EF, Sheffield JK, Stathis SL, Chang AB.
What is the burden of chronic cough for families? Chest. 2008; 134(2): 303-9.

Bibliography 251
85. Anderson-James S, Marchant JM, Chang AB, Acworth JP, Phillips NT,
Drescher BJ, et al. Burden and emergency department management of acute cough
in children. J Paediatr Child Health. 2019; 55(2): 181-7.
86. Moore HC, De Klerk N, Jacoby P, Richmond P, Lehmann D. Can linked
emergency department data help assess the out-of-hospital burden of acute lower
respiratory infections? A population-based cohort study. BMC Public Health. 2012;
12(1): 703-.
87. Costa LDC, Costa PS, Camargos PAM. Exacerbation of asthma and airway
infection: is the virus the villain? J Pediatr (Rio J). 2014; 90(6): 542-55.
88. D’Souza RM, Bambrick HJ, Kjellstrom TE, Kelsall LM, Guest CS, Hanigan I.
Seasonal variation in acute hospital admissions and emergency room presentations
among children in the Australian Capital Territory. J Paediatr Child Health. 2007;
43(5): 359-65.
89. Australian Bureau of Statistics. Health of Children in Australia: A Snapshot,
2004-05 2007. ABS cat. no. 4829.0.55.001. Available from:
http://www.abs.gov.au/AUSSTATS/[email protected]/Lookup/4829.0.55.001Main+Features
12004-05?OpenDocument
90. Moore HC, De Klerk N, Richmond P, Lehmann D. A retrospective population-
based cohort study identifying target areas for prevention of acute lower
respiratory infections in children. BMC Public Health. 2010; 10(1): 757-.
91. Fathima P, Blyth CC, Lehmann D, Lim FJ, Abdalla T, de Klerk N, et al. The
impact of pneumococcal vaccination on bacterial and viral pneumonia in Western
Australian children: Record linkage cohort study of 469589 births, 1996–2012. Clin
Infect Dis. 2017; 66(7): 1075-85.
92. Australian Health Ministers’ Advisory Council. Aboriginal and Torres Strait
Islander Health Performance Framework 2014 Report. Canberra: Australian
Government. 2015.
93. Bailey EJ, MacLennan C, Morris PS, Kruske SG, Brown N, Chang AB. Risks of
severity and readmission of Indigenous and non-Indigenous children hospitalised
for bronchiolitis. J Paediatr Child Health. 2009; 45(10): 593-7.

252 Bibliography
94. Adekoya N. Reasons for visits to emergency departments for Medicaid and
State Children’s Health Insurance Program patients: United States, 2004. N C Med J.
2010; 71(2): 123-30.
95. O'Grady K, Revell A, Maguire G, Millonig R, Newman M, Reid D, et al. Lung
health services for Aboriginal and Torres Strait Islander peoples in Queensland.
Brisbane: Queensland Government. 2010.
96. Bibby S, Milne R, Beasley R. Hospital admissions for non-cystic fibrosis
bronchiectasis in New Zealand. N Z Med J. 2015; 128(1421): 30.
97. Yin JK, Salkeld G, Lambert SB, Dierig A, Heron L, Leask J, et al. Estimates and
determinants of economic impacts from influenza-like illnesses caused by
respiratory viruses in Australian children attending childcare: a cohort study.
Influenza Other Respi Viruses. 2013; 7(6): 1103-12.
98. Willis GA, Preen DB, Richmond PC, Jacoby P, Effler PV, Smith DW, et al. The
impact of influenza infection on young children, their family and the health care
system. Influenza Other Respi Viruses. 2019; 13(1): 18-27.
99. Thomson F, Masters IB, Chang AB. Persistent cough in children and the
overuse of medications. J Paediatr Child Health. 2002; 38(6): 578-81.
100. Baxter JA. Parents working out work (Australian Family Trends No. 1).
Melbourne: Australian Institute of Family Studies; 2013.
101. Slack-Smith L, Read A, Stanley F. Absence from childcare for respiratory
illness. Child Care Health Dev. 2004; 30(1): 29-37.
102. Baxter JA. Child care and early childhood education in Australia (Facts Sheet
2015). Melbourne: Australian Institute of Family Studies; 2015.
103. Australian Bureau of Statistics. ‘2016 Census QuickStats: Australia,
Indigenous Profile’ 2016. Available from:
https://quickstats.censusdata.abs.gov.au/census_services/getproduct/census/2016
/quickstat/IQS036.
104. Australian Bureau of Statistics. ‘2016 Census QuickStats: Australia’ 2016.
Available from:
https://quickstats.censusdata.abs.gov.au/census_services/getproduct/census/2016
/quickstat/036?opendocument#employment.

Bibliography 253
105. Slack-Smith L, Read A, Stanley F. A prospective study of absence for illness
and injury in childcare children. Child Care Health Dev. 2002; 28(6): 487-94.
106. Lambert S, O'Grady KA, Nolan T, Carter R, Gabriel S. The cost of seasonal
respiratory illnesses in Australian children: the dominance of patient and family
costs and implications for vaccine use. Commun Dis Intell Q Rep. 2004; 28(4): 509-
16.
107. Lambert SB, Allen KM, Carter RC, Nolan TM. The cost of community-
managed viral respiratory illnesses in a cohort of healthy preschool-aged children.
Respir Res. 2008; 9.
108. Ebrahim S. Clinical and public health perspectives and applications of health-
related quality-of-life measurement. Soc Sci Med. 1995; 41(10): 1383-94.
109. Varni JW, Limbers CA, Burwinkle TM. Parent proxy-report of their children's
health-related quality of life: an analysis of 13,878 parents' reliability and validity
across age subgroups using the PedsQL™ 4.0 Generic Core Scales. Health Qual Life
Outcomes. 2007; 5(1): 2.
110. Eiser C, Morse R. Can parents rate their child's health-related quality of life?
Results of a systematic review. Qual Life Res. 2001; 10(4): 347-57.
111. Hays RD, Morales LS. The RAND-36 measure of health-related quality of life.
Ann Med. 2001; 33(5): 350-7.
112. Gusi N, Olivares PR, Rajendram R. The EQ-5D Health-Related Quality of Life
Questionnaire. New York, NY: Springer New York; 2010. p. 87-99.
113. Upton P, Eiser C, Cheung I, Hutchings HA, Jenney M, Maddocks A, et al.
Measurement properties of the UK-English version of the Pediatric Quality of Life
Inventory™ 4.0 (PedsQL™) generic core scales. Health Qual Life Outcomes. 2005;
3(1): 22-.
114. Wiebe S, Guyatt G, Weaver B, Matijevic S, Sidwell C. Comparative
responsiveness of generic and specific quality-of-life instruments. J Clin Epidemiol.
2003; 56(1): 52-60.
115. Chow MYK, Morrow AM, Cooper Robbins SC, Leask J. Condition-specific
quality of life questionnaires for caregivers of children with pediatric conditions: a
systematic review. Qual Life Res. 2013; 22(8): 2183-200.

254 Bibliography
116. Quittner AL, Modi A, Cruz I. Systematic review of health-related quality of
life measures for children with respiratory conditions. Paediatr Respir Rev. 2008;
9(3): 220-32.
117. Berdeaux G, Hervie C, Smajda C, Marquis P. Parental quality of life and
recurrent ENT infections in their children: development of a questionnaire. Qual Life
Res. 1998; 7(6): 501-12.
118. Chow MYK, Morrow A, Heron L, Yin JK, Booy R, Leask J. Quality of life for
parents of children with influenza-like illness: development and validation of Care-
ILI-QoL. Qual Life Res. 2014; 23(3): 939-51.
119. Newcombe PA, Sheffield JK, Juniper EF, Petsky HL, Willis C, Chang AB.
Validation of a parent-proxy quality of life questionnaire for paediatric chronic
cough (PC-QOL). Thorax. 2010; 65(9): 819-23.
120. Newcombe PA, Sheffield JK, Petsky HL, Marchant JM, Willis C, Chang AB. A
child chronic cough-specific quality of life measure: Development and validation.
Thorax. 2016.
121. Jiang X, Sun L, Wang B, Yang X, Shang L, Zhang Y. Health-related quality of
life among children with recurrent respiratory tract infections in Xi'an, China. PLoS
One. 2013; 8(2): e56945.
122. Chow MYK, Yin JK, Heron L, Morrow A, Dierig A, Booy R, et al. The impact of
influenza-like illness in young children on their parents: a quality of life survey. Qual
Life Res. 2014; 23(5): 1651-60.
123. Erdem E, Ersu R, Karadag B, Karakoc F, Gokdemir Y, Ay P, et al. Effect of night
symptoms and disease severity on subjective sleep quality in children with non-
cystic-fibrosis bronchiectasis. Pediatr Pulmonol. 2011; 46(9): 919-26.
124. Bahali K, Gedik AH, Bilgic A, Cakir E, Kahraman FU, Osmanoglu NK, et al. The
relationship between psychological symptoms, lung function and quality of life in
children and adolescents with non-cystic fibrosis bronchiectasis. Gen Hosp
Psychiatry. 2014; 36(5): 528-32.
125. Gokdemir Y, Hamzah A, Erdem E, Cimsit C, Ersu R, Karakoc F, et al. Quality of
life in children with non-cystic-fibrosis bronchiectasis. Respiration. 2014; 88(1): 46-
51.

Bibliography 255
126. Kapur N, Masters IB, Newcombe P, Chang AB. The burden of disease in
pediatric non-cystic fibrosis bronchiectasis. Chest. 2012; 141(4): 1018-24 7p.
127. Chang AB, Robertson CF, Van Asperen PP, Glasgow NJ, Mellis CM, Masters
IB, et al. A multicenter study on chronic cough in children : burden and etiologies
based on a standardized management pathway. Chest. 2012; 142(4): 943-50 8p.
128. Newall AT, Scuffham PA. Influenza-related disease: The cost to the
Australian healthcare system. Vaccine. 2008; 26(52): 6818-23.
129. Homaira N, Oei JL, Mallitt KA, Abdel-Latif ME, Hilder L, Bajuk B, et al. High
burden of RSV hospitalization in very young children: a data linkage study.
Epidemiol Infect. 2015: 1-10.
130. Australian Institute of Health and Welfare. Expenditure on health for
Aboriginal and Torres Strait Islander people 2010-11: An analysis by remoteness and
disease. 2013 . AIHW cat. no. HWE 58. Available from:
https://www.aihw.gov.au/getmedia/a1d7ec9d-7735-4293-8a32-
956c20026aa2/15080.pdf.aspx?inline=true.
131. Hollinghurst S, Gorst C, Fahey T, Hay AD. Measuring the financial burden of
acute cough in pre-school children: a cost of illness study. BMC Fam Pract. 2008;
9(1): 10-.
132. Dal Negro RW, Turco P, Povero M. Cost of acute cough in Italian children.
Clinicoecon Outcomes Res. 2018; 10: 529.
133. Kapur N, Mackay IM, Sloots TP, Masters IB, Chang AB. Respiratory viruses in
exacerbations of non-cystic fibrosis bronchiectasis in children. Arch Dis Child. 2014;
99(8): 749-53.
134. Özcan C, Toyran M, Civelek E, Erkoço lu M, Alta AeBa, Albayrak N, et al.
Evaluation of respiratory viral pathogens in acute asthma exacerbations during
childhood. J Asthma. 2011; 48(9): 888-93.
135. Bucens IK, Reid A, Sayers SM. Risk factors for reduced lung function in
Australian Aboriginal children. J Paediatr Child Health. 2006; 42(7‐8): 452-7.
136. Moore HC, Hall GL, de Klerk N. Infant respiratory infections and later
respiratory hospitalisation in childhood. Eur Respir J. 2015; 46(5): 1334-41.

256 Bibliography
137. Skirrow H, Wincott T, Cecil E, Bottle A, Costelloe C, Saxena S. Preschool
respiratory hospital admissions following infant bronchiolitis: A birth cohort study.
Arch Dis Child. 2019.
138. Duijts L, Reiss IK, Brusselle G, de Jongste JC. Early origins of chronic
obstructive lung diseases across the life course. Eur J Epidemiol. 2014; 29(12): 871-
85.
139. Wurzel DF, Chang AB. An update on pediatric bronchiectasis. Expert Rev
Respir Med. 2017; 11(7): 517-32.
140. Trenholme AA, Byrnes CA, McBride C, Lennon DR, Chan-Mow F, Vogel AM,
et al. Respiratory health outcomes 1 year after admission with severe lower
respiratory tract infection. Pediatr Pulmonol. 2013; 48(8): 772-9.
141. Valery PC, Torzillo PJ, Mulholland K, Boyce NC, Purdie DM, Chang AB.
Hospital-based case-control study of bronchiectasis in Indigenous children in
Central Australia. Pediatr Infect Dis J. 2004; 23(10): 902-8.
142. Monto AS, Lehmann D. Acute respiratory infections (ARI) in children:
prospects for prevention. Vaccine. 1998; 16(16): 1582-8.
143. Rabie T, Curtis V. Handwashing and risk of respiratory infections: a
quantitative systematic review. Trop Med Int Health. 2006; 11(3): 258-67.
144. Couriel J. Assessment of the child with recurrent chest infections. Br Med
Bull. 2002; 61(1): 115-32.
145. Leconte S, Valentin S, Dromelet E, de Jonghe M. Prolonged cough in
pediatric population first line care, Belgian guidelines. Open Respir Med J. 2017; 11:
54-66.
146. Bailey EJ, Morris PS, Kruske SG, Chang AB. Clinical pathways for chronic
cough in children. Cochrane Database Syst Rev. 2008; (2).
147. Chang AB, Oppenheimer JJ, Weinberger M, Weir K, Rubin BK, Irwin RS. Use
of management pathways or algorithms in children with chronic cough: systematic
reviews. Chest. 2016; 149(1): 106-19.
148. Chang AB, Robertson CF, van Asperen PP, Glasgow NJ, Masters IB, Mellis
CM, et al. Can a management pathway for chronic cough in children improve clinical
outcomes: protocol for a multicentre evaluation. Trials. 2010; 11(1): 103-.

Bibliography 257
149. Chang AB, Robertson CF, van Asperen PP, Glasgow NJ, Masters IB, Teoh L, et
al. A cough algorithm for chronic cough in children: A multicenter, randomized
controlled study. Pediatrics. 2013; 131(5): E1576-E83.
150. Karabel M, Kelekçi S, Karabel D, Gürkan MF. The evaluation of children with
prolonged cough accompanied by American College of Chest Physicians guidelines.
Clin Respir J. 2014; 8(2): 152-9.
151. Asilsoy S, Bayram E, Agin H, Apa H, Can D, Gulle S, et al. Evaluation of chronic
cough in children. Chest. 2008; 134(6): 1122-8.
152. Gedik AH, Cakir E, Torun E, Demir AD, Kucukkoc M, Erenberk U, et al.
Evaluation of 563 children with chronic cough accompanied by a new clinical
algorithm. Ital J Pediatr. 2015; 41(1): 73.
153. Akenroye AT, Baskin MN, Samnaliev M, Stack AM. Impact of a bronchiolitis
guideline on ED resource use and cost: A segmented time-series analysis. Pediatrics.
2014; 133(1): E227-E34.
154. Quint JK, Smith MP. Paediatric and adult bronchiectasis: Diagnosis, disease
burden and prognosis. Respirology. 2019.
155. Goyal V, Grimwood K, Marchant J, Masters IB, Chang AB. Pediatric
bronchiectasis: No longer an orphan disease. Pediatr Pulmonol. 2016; 51(5): 450-69.
156. Australian Bureau of Statistics. Estimates of Aboriginal and Torres Strait
Islander Australians June 2011, 'Table 1: Estimated resident Aboriginal and Torres
Strait Islander and Non-Indigenous population, Remoteness Areas, Single year of
age, 30 June 2011', data cube: Excel spreadsheet, cat. no. 3238.0.55.001 2013 [cited
2019 22 April]. Available from:
http://www.abs.gov.au/AUSSTATS/[email protected]/DetailsPage/3238.0.55.001June%2020
11?OpenDocument
157. Australian Bureau of Statistics. 'Greater Brisbane (Greater Capital City
Statistical Areas), Aboriginal and Torres Strait Islander Peoples Profile. Table I03:
age by Indigenous status by sex', data cube: Excel spreadsheet 2016 [Available
from:
https://quickstats.censusdata.abs.gov.au/census_services/getproduct/census/2016
/communityprofile/3GBRI?opendocument.

258 Bibliography
158. Australian Bureau of Statistics. 'Toowoomba (Statistical Area Level 4),
Aboriginal and Torres Strait Islander Peoples Profile. Table I03: age by Indigenous
status by sex', data cube: Excel spreadsheet 2016. Available from:
https://quickstats.censusdata.abs.gov.au/census_services/getproduct/census/2016
/communityprofile/317?opendocument
159. Australian Bureau of Statistics. 'Darwin (Statistical Area Level 4), Aboriginal
and Torres Strait Islander Peoples Profile. Table I03: age by Indigenous status by
sex', data cube: Excel spreadsheet 2016. Available from:
https://quickstats.censusdata.abs.gov.au/census_services/getproduct/census/2016
/communityprofile/701?opendocument.
160. Australian Bureau of Statistics. 'Australia, Aboriginal and Torres Strait
Islander Peoples Profile. Table I03: age by Indigenous status by sex', data cube:
Excel spreadsheet 2016. Available from:
https://quickstats.censusdata.abs.gov.au/census_services/getproduct/census/2016
/communityprofile/036?opendocument.
161. Hall KK, Chang AB, Sloots TP, Anderson J, Kemp A, Hammill J, et al. The
respiratory health of urban indigenous children aged less than 5 years: study
protocol for a prospective cohort study. BMC Pediatr. 2015; 15(1): 56.
162. Drescher BJ, Chang AB, Phillips N, Acworth J, Marchant J, Sloots TP, et al. The
development of chronic cough in children following presentation to a tertiary
paediatric emergency department with acute respiratory illness: study protocol for
a prospective cohort study. BMC Pediatr. 2013; 13(1): 125-.
163. O'Grady K-AF, Grimwood K, Toombs M, Sloots TP, Otim M, Whiley D, et al.
Effectiveness of a cough management algorithm at the transitional phase from
acute to chronic cough in Australian children aged< 15 years: protocol for a
randomised controlled trial. BMJ open. 2017; 7(3): e013796.
164. Australian Institute of Health and Welfare. Time spent in emergency
departments - Measure: percentage of patients seen on time. . In: MyHospitals.
Canberra: AIHW. 2019.
165. De Jongste J, Shields M. Cough• 2: Chronic cough in children. Thorax. 2003;
58(11): 998-1003.

Bibliography 259
166. Newcombe PA, Sheffield JK, Chang AB. Minimally important change in a
parent-proxy quality-of-life questionnaire for pediatric chronic cough. Chest. 2011;
139(3): 576-80.
167. Drummond MF, Sculpher MJ, Claxton K, Stoddart GL, Torrance GW. Methods
for the economic evaluation of health care programmes: Oxford university press;
2015.
168. Tarricone R. Cost-of-illness analysis: what room in health economics? Health
Policy. 2006; 77(1): 51-63.
169. Reserve Bank of Australia. Inflation Calculator 2018. Available from:
https://www.rba.gov.au/calculator/
170. Department of Health [Australia]. Medicare Benefits Schedule Book
operating from 01 November 2017 2017. Available from:
http://www.mbsonline.gov.au/internet/mbsonline/publishing.nsf/Content/AC4BB7
9DA21FF800CA2581A1000AE4F1/$File/201711-MBS%2016%20Nov.pdf
171. Department of Health [Australia]. Annual Medicare Statistics - Public Release
of Medicare Statistics: Financial Year 2017-18 2018. Available from:
https://www1.health.gov.au/internet/main/publishing.nsf/Content/Annual-
Medicare-Statistics.
172. Independent Hospital Pricing Authority. About IHPA n.d. Available from:
https://www.ihpa.gov.au/who-we-are.
173. Administrator of the National Health Funding Pool. Glossary n.d. Available
from: https://www.publichospitalfunding.gov.au/Glossary.
174. Independent Hospital Pricing Authority. NWAU calculators 2017-18 n.d.
Available from: https://www.ihpa.gov.au/what-we-do/pricing/national-weighted-
activity-unit-nwau-calculators/nwau-calculators-2017-18.
175. Britt H, Valenti L, Miller G. Time for care. Length of general practice
consultations in Australia. Aust Fam Physician. 2002; 31(9): 876.
176. Australian Medical Association. List of Medical Services and Fees 1
November 2017 2017.
177. Bensoussan A, Myers SP, Wu S, O’Connor K. Naturopathic and Western
herbal medicine practice in Australia—a workforce survey. Complement Ther Med.
2004; 12(1): 17-27.

260 Bibliography
178. Farag I, Sherrington C, Ferreira M, Howard K. A systematic review of the unit
costs of allied health and community services used by older people in Australia.
BMC Health Serv Res. 2013; 13(1): 69.
179. 13 HEALTH hotline service open for your calls [press release]. 01 March
2006.
180. Queensland Health. Wage rates - Nursing Stream - Nursing wage rates as at
1 April 2017 2017 Available from:
https://www.health.qld.gov.au/hrpolicies/wage_rates/nursing#2017
181. Australian Bureau of Statistics. Average Weekly Earnings, Australia, Nov
2017 'Table 3: Average Weekly Earnings, Australia, Original, November 2017' Cat.
no. 6302.0 2018.
182. Australian Government Fair Work Ombudsman. Hours of work n.d. Available
from: https://www.fairwork.gov.au/employee-entitlements/hours-of-work-breaks-
and-rosters/hours-of-work.
183. Australian Prudential Regulation Authority. Statistics: Private Health
Insurance Membership and Benefits 2017 Available from:
http://webarchive.nla.gov.au/gov/20170816054020/http://www.apra.gov.au/PHI/P
ublications/Pages/Private-Health-Insurance-Membership-and-Benefits.aspx.
184. Arnold D, Rabin S, O'Grady K-A. Contact attempts and loss to follow-up in a
cohort study of acute respiratory illness outcomes in a low-socioeconomic
community (E-Poster). 35th Annual Meeting of the European Society for Paediatric
Infectious Diseases; Madrid, Spain2017.
185. McKnight PE, McKnight KM, Sidani S, Figueredo AJ. Missing data: A gentle
introduction: Guilford Press; 2007.
186. Sterne J, White I, Carlin J, Spratt M, Royston P, Kenward M, et al. Multiple
imputation for missing data in epidemiological and clinical research: potential and
pitfalls. Br Med J. 2009; 339(7713): 157.
187. Enders CK. Multiple imputation as a flexible tool for missing data handling in
clinical research. Behav Res Ther. 2017; 98: 4-18.
188. Lee KJ, Simpson JA. Introduction to multiple imputation for dealing with
missing data. 2014. p. 162-7.

Bibliography 261
189. Chandrasekaran R, Mac Aogáin M, Chalmers JD, Elborn SJ, Chotirmall SH.
Geographic variation in the aetiology, epidemiology and microbiology of
bronchiectasis. BMC Pulm Med. 2018; 18(1): 83.
190. Nathan AM, de Bruyne JA, Eg KP, Thavagnanam S. Quality of life in children
with non-cystic fibrosis bronchiectasis. Front Pediatr. 2017; 5: 84.
191. Schmets G RD, Kadandale S, editors,. Strategizing national health in the 21st
century: a handbook. Geneva: World Health Organization; 2016.
192. Aliberti S, Masefield S, Polverino E, De Soyza A, Loebinger MR, Menendez R,
et al. Research priorities in bronchiectasis: a consensus statement from the
EMBARC Clinical Research Collaboration. Eur Respir J. 2016; 48(3): 632-47.
193. Goyal V, Grimwood K, Byrnes CA, Morris PS, Masters IB, Ware RS, et al.
Amoxicillin–clavulanate versus azithromycin for respiratory exacerbations in
children with bronchiectasis (BEST-2): a multicentre, double-blind, non-inferiority,
randomised controlled trial. The Lancet. 2018; 392(10154): 1197-206.
194. Valery PC, Morris PS, Byrnes CA, Grimwood K, Torzillo PJ, Bauert PA, et al.
Long-term azithromycin for Indigenous children with non-cystic-fibrosis
bronchiectasis or chronic suppurative lung disease (Bronchiectasis Intervention
Study): a multicentre, double-blind, randomised controlled trial. Lancet Respir Med.
2013; 1(8): 610-20.
195. Bayram C, Harrison C, Charles J, Britt H. 'The kids are alright'-Changes in GP
consultations with children 2000-15. Aust Fam Physician. 2015; 44(12): 877.
196. Lovie-Toon YG, McPhail SM, Au-Yeung YT, Hall KK, Chang AB, Vagenas D, et
al. The cost of acute respiratory infections with cough among urban Aboriginal and
Torres Strait Islander children. Front Pediatr. 2018; 6.
197. Gadzhanova S, Roughead E. Prescribed antibiotic use in Australian children
aged 0-12 years. Aust Fam Physician. 2016; 45(3): 134.
198. Hobbs MR, Grant CC, Ritchie SR, Chelimo C, Morton S, Berry S, et al.
Antibiotic consumption by New Zealand children: exposure is near universal by the
age of 5 years. J Antimicrob Chemother. 2017; 72(6): 1832-40.
199. Yan J, Hawes L, Turner L, Mazza D, Pearce C, Buttery J. Antimicrobial
prescribing for children in primary care. J Paediatr Child Health. 2019; 55(1): 54-8.
262 Bibliography
200. Milton B, Whitehead M, Holland P, Hamilton V. The social and economic
consequences of childhood asthma across the lifecourse: a systematic review. Child
Care Health Dev. 2004; 30(6): 711-28.
201. Black LI, Zablotsky B. Chronic school absenteeism among children with
selected developmental disabilities: National Health Interview Survey, 2014-2016.
National Health Statistics Reports. Number 118. National Center for Health
Statistics. 2018.
202. Lum A, Wakefield C, Donnan B, Burns M, Fardell J, Marshall G.
Understanding the school experiences of children and adolescents with serious
chronic illness: a systematic meta-review. Child Care Health Dev. 2017; 43(5): 645-
62.
203. Satırer O, Yesil AM, Emiralioglu N, Tugcu GD, Yalcın E, Dogru D, et al. A
review of the etiology and clinical presentation of non-cystic fibrosis bronchiectasis:
A tertiary care experience. Respir Med. 2018; 137: 35-9.
204. Jepsen N, Charania NA, Mooney S. Health care experiences of mothers of
children with bronchiectasis in Counties Manukau, Auckland, New Zealand. BMC
Health Serv Res. 2018; 18(1): 722.
205. Schmit KM, Coeytaux RR, Goode AP, McCrory DC, Yancy WS, Jr., Kemper AR,
et al. Evaluating cough assessment tools: a systematic review. Chest. 2013; 144(6):
1819-26.
206. Marchant J, Masters IB, Champion A, Petsky H, Chang AB. Randomised
controlled trial of amoxycillin clavulanate in children with chronic wet cough.
Thorax. 2012; 67(8): 689-93.
207. Petsky HL, Acworth JP, Clark R, Thearle DM, Masters IB, Chang AB. Asthma
and protracted bronchitis: who fares better during an acute respiratory infection? J
Paediatr Child Health. 2009; 45(1-2): 42-7.
208. Mulholland K. Global burden of acute respiratory infections in children:
Implications for interventions. Pediatr Pulmonol. 2003; 36(6): 469-74.
209. Britt H MG, Henderson J, Bayram C, Harrison C, Valenti L, Wong C, Gordon J,
Pollack AJ, Pan Y, Charles J. . General practice activity in Australia 2014–15. General
practice series no. 38. Sydney: Sydney University Press; 2015.

Bibliography 263
210. Verhagen LM, de Groot R. Recurrent, protracted and persistent lower
respiratory tract infection: A neglected clinical entity. J Infect. 2015; 71: S106-S11.
211. O'Grady K-AF, Hall KK, Bell A, Chang AB, Potter C. Review of respiratory
disease among Aboriginal and Torres Strait Islander children. Australian Indigenous
HealthBulletin. 2018; 18(2).
212. Bell AM. Respiratory illness in urban Indigenous children: risk and cultural
context Brisbane, Australia: The University of Queensland; 2014.
213. Healthdirect Australia. Bulk billing for medical services 2018 Available from:
https://www.healthdirect.gov.au/bulk-billing-for-medical-services.
214. Pharmaceutical Benefits Scheme Closing the Gap (CTG) Indigenous chronic
disease package PBS co-payment measure: pharmacy staff resource booklet.
Canberra: Department of Health; 2016.
215. Australian Institute of Health and Welfare. Chapter 2.1 How does Australia’s
health system work? Australia’s health system (Australia's health 2018, Australia’s
health series no. 16. AUS 221). Canberra: AIHW; 2018.
216. Australian Institute of Health and Welfare. The health & welfare of
Australia's Aboriginal & Torres Strait Islander people – Glossary. Canberra: AIHW;
2017.
217. Department of Health [Australia]. Pharmaceutical Benefits Scheme, Effective
01 November 2017 2017. Available from:
http://www.pbs.gov.au/publication/schedule/2017/11/2017-11-01-general-
schedule.pdf.
218. Chemist Warehouse. Chemist Warehouse Discount Chemist 2017 [cited
2017 21 December]. Available from:
https://www.chemistwarehouse.com.au/prescriptions.
219. Independent Hospital Pricing Authority. National Hospital Cost Data
Collection Cost Report: Table 16: URG table, URG VERSION 1.4.3, Round 19 Financial
year 2014-15. 2017.
220. Independent Hospital Pricing Authority. National Hospital Cost Data
Collection Cost Report: Table 3 Acute national actual cost weights, Cost weights for
AR-DRG version 8.0, Round 19 (2014-15), national sample. 2017.
264 Bibliography
221. Koopmanschap MA, van Exel NJA, van den Berg B, Brouwer WB. An overview
of methods and applications to value informal care in economic evaluations of
healthcare. Pharmacoeconomics. 2008; 26(4): 269-80.
222. Azur MJ, Stuart EA, Frangakis C, Leaf PJ. Multiple imputation by chained
equations: what is it and how does it work? Int J Methods Psychiatr Res. 2011;
20(1): 40-9.
223. StataCorp. Multiple Imputation Reference Manual. 2017. College Station, TX:
Stata Press. Available from: https://www.stata.com/manuals/mi.pdf.
224. Rubin DB. Multiple imputation for nonresponse in surveys: John Wiley &
Sons; 2004.
225. Enserink R, Lugner A, Suijkerbuijk A, Bruijning-Verhagen P, Smit HA, van Pelt
W. Gastrointestinal and respiratory illness in children that do and do not attend
child day care centers: a cost-of-illness study. PLoS One. 2014; 9(8).
226. Lovie-Toon YG, Chang AB, Newcombe PA, Vagenas D, Anderson-James S,
Drescher BJ, et al. Longitudinal study of quality of life among children with acute
respiratory infection and cough. Qual Life Res. 2018: 1-13.
227. Australian Bureau of Statistics. Census of Population and Housing 2016,
Counts of Aboriginal and Torres Strait Islander Australians, Cat. no. 2075.0 2018.
228. White I, Royston P, Wood A. Multiple imputation using chained equations:
Issues and guidance for practice. Stat Med. 2011; 30(4): 377.
229. Saunders NR, Tennis O, Jacobson S, Gans M, Dick PT. Parents' responses to
symptoms of respiratory tract infection in their children. Can Med Assoc J. 2003;
168(1): 25-30.
230. Australian Institute of Health and Welfare. Emergency department care
2017–18: Australian hospital statistics. Health services series no. 89. Cat. no. HSE
216. Canberra: AIHW.; 2018.
231. Gazzaz ZJ, Dhafar KO, Maimini O, Farooq MU, Ahmad I. Audit of an urban
paediatric emergency department visits. Niger Med J. 2012; 53(3): 129.
232. Pandee U, Vallipakorn SA-o, Plitponkarnpim A. The profile of pediatric
patients visit emergency department at urban university hospital in Thailand. J Med
Assoc Thai. 2015; 98(8): 761-7.

Bibliography 265
233. Yaprak S, Bulut U, Okudan YE, Gokdemir O, Colak M, Yıldırım E, et al.
Caregiver reasons for tertiary health‐care seeking for children aged≤ 12 years.
Pediatr Int. 2016; 58(10): 1037-41.
234. Hardy A, Fuller DG, Forrester M, Anderson KP, Cooper C, Jenner B, et al. Per
capita increase in hospital presentations and admissions among children since the
1990s. J Paediatr Child Health. 2016; 52(10): 935-8.
235. Angoulvant F, Jumel S, Prot-Labarthe S, Bellettre X, Kahil M, Smail A, et al.
Multiple health care visits related to a pediatric emergency visit for young children
with common illnesses. Eur J Pediatr. 2013; 172(6): 797-802.
236. Petsios KT, Priftis KN, Tsoumakas C, Perperoglou A, Hatziagorou E, Tsanakas
JN, et al. Cough affects quality of life in asthmatic children aged 8-14 more than
other asthma symptoms. Allergol Immunopathol (Madr). 2009; 37(2): 80.
237. Oostenbrink R, Jansingh-Piepers EM, Raat H, Nuijsink M, Landgraf JM,
Essink-Bot ML, et al. Health-related quality of life of pre-school children with
wheezing illness. Pediatr Pulmonol. 2006; 41(10): 993-1000.
238. Jensen ME, Mendelson MJ, Desplats E, Zhang X, Platt R, Ducharme FM.
Caregiver's functional status during a young child's asthma exacerbation:
A validated instrument. J Allergy Clin Immunol. 2016; 137(3): 782-8.e6.
239. De Livera AM, Zaloumis S, Simpson JA. Models for the analysis of repeated
continuous outcome measures in clinical trials. Respirology. 2014; 19(2): 155-61.
240. Galecki AT, West BT, Welch KB. Linear Mixed Models: A Practical Guide
Using Statistical Software. Philadelphia, PA: Chapman and Hall/CRC; 2006.
241. Zuur A, Ieno EN, Walker N. Statistics for Biology and Health: Mixed Effects
Models and Extensions in Ecology with R: Springer New York; 2009.
242. Australian Bureau of Statistics. 2016 Census of Population and Housing,
Quick Stats Queensland - Level of highest educational attainment [Internet]. 2017.
Available from:
http://www.censusdata.abs.gov.au/census_services/getproduct/census/2016/quick
stat/3?opendocument
243. Australian Bureau of Statistics. 2016 Census of Population and Housing,
General Community Profile: Queensland, Table G28 Total Family Income (Weekly)
by Family Composition - Couple family with children. [Excel spreadsheet]. 2017 [
266 Bibliography
cat. no. 2001.0. Available from:
http://www.censusdata.abs.gov.au/CensusOutput/copsub2016.NSF/All%20docs%2
0by%20catNo/2016~Community%20Profile~3/$File/GCP_3.zip?OpenElement.
244. Australian Institute of Family Studies. Parents working out work (Australian
Family Trends No. 1) [Internet]. 2013. Available from:
https://aifs.gov.au/publications/parents-working-out-work.
245. Australian Bureau of Statistics. Australian Health Survey: First Results, 2011–
12 — Table 3.3 Long-term conditions, Proportion of persons, children aged 0-14 yrs.
[Excel spreadsheet]. 2012 [cat. no. 4364.0.55.001. Available from:
http://www.abs.gov.au/ausstats/subscriber.nsf/log?openagent&43640do003_2011
2012v2.xls&4364.0.55.001&Data%20Cubes&C6D4971625F0E865CA257B820017A5
4F&0&2011-12&07.06.2013&Previous.
246. Australian Bureau of Statistics. 2016 Census of Population and Housing,
General Community Profile: Queensland, G01 Selected Person Characteristics by
Sex (1 of 2) - Males and Females 0-14 years [Excel spreadsheet ]. 2017 [cat. no.
2001.0. Available from:
http://www.censusdata.abs.gov.au/CensusOutput/copsub2016.NSF/All%20docs%2
0by%20catNo/2016~Community%20Profile~3/$File/GCP_3.zip?OpenElement.
247. Osman LM, Baxter-Jones A, Helms P. Parents' quality of life and respiratory
symptoms in young children with mild wheeze. Eur Respir J. 2001; 17(2): 254-8.
248. Brunello G, Fort M, Schneeweis N, Winter-Ebmer R. The causal effect of
education on health: What is the role of health behaviors? Health Econ. 2016; 25(3):
314-36.
249. Cutler DM, Lleras-Muney A. Understanding differences in health behaviors
by education. J Health Econ. 2010; 29(1): 1-28.
250. Bont L, Steijn M, van Aalderen WM, Kimpen JL. Impact of wheezing after
respiratory syncytial virus infection on health-related quality of life. Pediatr Infect
Dis J. 2004; 23(5): 414-7.
251. Desager KN, Nelen V, Weyler JJ, De Backer WA. Sleep disturbance and
daytime symptoms in wheezing school-aged children. J Sleep Res. 2005; 14(1): 77-
82.

Bibliography 267
252. Mistry RD, Stevens MW, Gorelick MH. Health-related quality of life for
pediatric emergency department febrile illnesses: an evaluation of the Pediatric
Quality of Life Inventory™ 4.0 generic core scales. Health Qual Life Outcomes. 2009;
7(1): 5.
253. O’Grady KF, Grimwood K, Torzillo PJ, Rablin S, Lovie-Toon YG, Kaus M, et al.
Effectiveness of a chronic cough management algorithm at the transitional stage
from acute to chronic cough in children: a multi-centre randomised controlled trial.
Lancet Child & Adolescent Health. 2019; In press.
254. Independent Hospital Pricing Authority. National Weighted Activity Unit
(NWAU) calculators 2017-18: Emergency Department Services. 2018.
255. Independent Hospital Pricing Authority. National Weighted Activity Unit
(NWAU) calculators 2017-18: Acute Admitted Services. 2018.
256. Lovie-Toon YG, Grimwood K, Byrnes CA, Goyal V, Busch G, Masters IB, et al.
Health-resource use and quality of life in children with bronchiectasis: a multi-
center pilot cohort study. BMC Health Serv Res. 2019; 19(1): 1-9.
257. Chang AB, Grimwood K, Maguire G, King PT, Morris PS, Torzillo PJ.
Management of bronchiectasis and chronic suppurative lung disease in Indigenous
children and adults from rural and remote Australian communities. Med J Aust.
2008; 189(7): 386-93.
258. Homaira N, Wiles LK, Gardner C, Molloy CJ, Arnolda G, Ting HP, et al.
Assessing appropriateness of paediatric asthma management: A population-based
sample survey. Respirology. 2019.
259. Bereznicki BJ, Beggs S, Duff C, Bereznicki L. Adherence to management
guidelines for childhood asthma in Australia. Aust Fam Physician. 2015; 44(12): 933-
8.
260. Sulaiman N, Aroni R, Thien F, Schattner R, Simpson P, del Colle E, et al.
Written asthma action plans (WAAPS) in Melbourne general practices: A sequential
mixed methods study. Prim Care Respir J. 2011; 20(2): 161-9.
261. Elaro A, Shah S, Armour CL, Bosnic-Anticevich S. A snapshot of pharmacist
attitudes and behaviors surrounding the management of pediatric asthma. J
Asthma. 2015; 52(9): 957-68.
268 Bibliography
262. Roydhouse JK, Shah S, Toelle BG, Sawyer SM, Mellis CM, Usherwood TP, et
al. A snapshot of general practitioner attitudes, levels of confidence and self-
reported paediatric asthma management practice. Aust J Prim Health. 2011; 17(3):
288-93.
263. Goeminne PC, Hernandez F, Diel R, Filonenko A, Hughes R, Juelich F, et al.
The economic burden of bronchiectasis - nnown and unknown: A systematic review.
BMC Pulm Med. 2019; 19(1).
264. Goyal V, McPhail SM, Hurley F, Grimwood K, Marchant J, Masters IB, et al.
Cost of hospitalisation for bronchiectasis in children (Under review). 2019.
265. Lee E, Shim JY, Kim HY, Suh DI, Choi YJ, Han MY, et al. Clinical characteristics
and etiologies of bronchiectasis in Korean children: A multicenter retrospective
study. Respir Med. 2019; 150: 8-14.
266. Visser SK, Bye PT, Fox GJ, Burr LD, Chang AB, Holmes-Liew C-L, et al.
Australian adults with bronchiectasis: The first report from the Australian
Bronchiectasis Registry. Respir Med. 2019; 155: 97-103.
267. Quittner AL, O'Donnell AE, Salathe MA, Lewis SA, Li X, Montgomery AB, et al.
Quality of Life Questionnaire-Bronchiectasis: final psychometric analyses and
determination of minimal important difference scores. Thorax. 2015; 70(1): 12-20.
268. Spinou A, Siegert RJ, Guan W-j, Patel AS, Gosker HR, Lee KK, et al. The
development and validation of the bronchiectasis health questionnaire. Eur Respir J.
2017; 49(5): 1601532.
269. Murray M, Turnbull K, MacQuarrie S, Pentland J, Hill A. Validation of the
Leicester Cough Questionnaire in non-cystic fibrosis bronchiectasis. Eur Respir J.
2009; 34(1): 125-31.
270. Vodanovich DA, Bicknell TJ, Holland AE, Hill CJ, Cecins N, Jenkins S, et al.
Validity and reliability of the chronic respiratory disease questionnaire in elderly
individuals with mild to moderate non-cystic fibrosis bronchiectasis. Respiration.
2015; 90(2): 89-96.
271. Wilson CB, Jones PW, O'Leary CJ, Cole PJ, Wilson R. Validation of the St.
George's Respiratory Questionnaire in bronchiectasis. Am J Respir Crit Care Med.
1997; 156(2): 536-41.

Bibliography 269
272. Anderson AJ, Snelling TL, Moore HC, Blyth CC. Advances in vaccines to
prevent viral respiratory illnesses in children. Paediatr Drugs. 2017; 19(6): 523-31.
273. Walker N, Johnston V, Glover M, Bullen C, Trenholme A, Chang A, et al.
Effect of a family-centered, secondhand smoke intervention to reduce respiratory
illness in Indigenous infants in Australia and New Zealand: A randomized controlled
trial. Nicotine Tob Res. 2015; 17(1): 48-57.
274. Gkentzi D, Katsakiori P, Marangos M, Hsia Y, Amirthalingam G, Heath PT, et
al. Maternal vaccination against pertussis: a systematic review of the recent
literature. Arch Dis Child. 2017; 102(5): F456-F63.
275. Regan AK, De Klerk N, Moore HC, Omer SB, Shellam G, Effler PV. Effect of
maternal influenza vaccination on hospitalization for respiratory infections in
newborns. Pediatr Infect Dis J. 2016; 35(10): 1097-103.
276. Australian Bureau of Statistics. The Health and Welfare of Australia's
Aboriginal and Torres Strait Islander Peoples, Social and emotional wellbeing:
Removal from natural family, Oct 2010, cat no. 4704.0 2011.
277. Snyder CF, Jensen RE, Segal JB, Wu AW. Patient-reported outcomes (PROs):
putting the patient perspective in patient-centered outcomes research. Med Care.
2013; 51(8 0 3): S73.
278. Thorn JC, Brookes ST, Ridyard C, Riley R, Hughes DA, Wordsworth S, et al.
Core items for a standardized resource use measure: expert Delphi consensus
survey. Value Health. 2018; 21(6): 640-9.
279. Grosse SD, Pike J, Soelaeman R, Tilford JM. Quantifying family spillover
effects in economic evaluations: measurement and valuation of informal care time.
Pharmacoeconomics. 2019: 1-13.
280. Oliva-Moreno J, Trapero-Bertran M, Peña-Longobardo LM, del Pozo-Rubio R.
The valuation of informal care in cost-of-illness studies: a systematic review.
Pharmacoeconomics. 2017; 35(3): 331-45.
281. Van den Berg B, Brouwer WB, Koopmanschap MA. Economic valuation of
informal care. Eur J Health Econ. 2004; 5(1): 36-45.
282. Weatherly H, Faria R, Van Den Berg B. Valuing informal care for economic
evaluation. 2014.

270 Bibliography
283. Thorn JC, Coast J, Cohen D, Hollingworth W, Knapp M, Noble SM, et al.
Resource-use measurement based on patient recall: issues and challenges for
economic evaluation. Appl Health Econ Health Policy. 2013; 11(3): 155-61.
284. Arnold BF, Galiani S, Ram PK, Hubbard AE, Briceño B, Gertler PJ, et al.
Optimal recall period for caregiver-reported illness in risk factor and intervention
studies: a multicountry study. Am J Epidemiol. 2013; 177(4): 361-70.
285. Morey MJ, Cheng AC, McCallum GB, Chang AB. Accuracy of cough reporting
by carers of Indigenous children: Cough reporting in indigenous children. J Paediatr
Child Health. 2013; 49(3): E199-E203.
286. Petrou S, Murray L, Cooper P, Davidson LL. The accuracy of self-reported
healthcare resource utilization in health economic studies. Int J Technol Assess
Health Care. 2002; 18(3): 705-10.
287. Lubeck DP, Hubert HB. Self-report was a viable method for obtaining health
care utilization data in community-dwelling seniors. J Clin Epidemiol. 2005; 58(3):
286-90.

Appendices 271
Appendices
Appendix A: Published study protocol for the Tooth and Lung Sickness in Murri
Kids (TLSIM) study

STUDY PROTOCOL Open Access
The respiratory health of urban indigenouschildren aged less than 5 years: study protocolfor a prospective cohort studyKerry K. Hall1*, Anne B. Chang1,2,3, Theo P. Sloots4,5, Jennie Anderson6, Anita Kemp6, Jan Hammill7, Michael Otim8
and Kerry-Ann F. O’Grady1
Abstract
Background: Despite the burden of acute respiratory illnesses (ARI) among Aboriginal and Torres Strait Islanderchildren being a substantial cause of childhood morbidity and associated costs to families, communities and thehealth system, data on disease burden in urban children are lacking. Consequently evidence-based decision-making,data management guidelines, health resourcing for primary health care services and prevention strategies are lacking.This study aims to comprehensively describe the epidemiology, impact and outcomes of ARI in urban Aboriginal andTorres Strait Islander children (hereafter referred to as Indigenous) in the greater Brisbane area.
Methods/Design: An ongoing prospective cohort study of Indigenous children aged less than five years registeredwith a primary health care service in Northern Brisbane, Queensland, Australia. Children are recruited at time ofpresentation to the service for any reason. Demographic, epidemiological, risk factor, microbiological, economicand clinical data are collected at enrolment. Enrolled children are followed for 12 months during which time ARIevents, changes in child characteristics over time and monthly nasal swabs are collected. Children who develop anARI with cough as a symptom during the study period are more intensely followed-up for 28 (±3) days includingweekly nasal swabs and parent completed cough diary cards. Children with persistent cough at day 28 post-ARIare reviewed by a paediatrician.
Discussion: Our study will be one of the first to comprehensively evaluate the natural history, epidemiology,aetiology, economic impact and outcomes of ARIs in this population. The results will inform studies for thedevelopment of evidence-based guidelines to improve the early detection, prevention and management ofchronic cough and setting of priorities in children during and after ARI.
Trial registration: Australia New Zealand Clinical Trial Registry Registration Number: 12614001214628. Registered18 November 2014
Keywords: Acute Respiratory Illness, Urban, Economics, Primary health care centre, Aboriginal and Torres StraitIslander, Children
* Correspondence: [email protected] Children’s Medical Research Institute, Queensland University ofTechnology, Herston, QLD, AustraliaFull list of author information is available at the end of the article
© 2015 Hall et al.; licensee BioMed Central. This is an Open Access article distributed under the terms of the CreativeCommons Attribution License (http://creativecommons.org/licenses/by/4.0), which permits unrestricted use, distribution, andreproduction in any medium, provided the original work is properly credited. The Creative Commons Public DomainDedication waiver (http://creativecommons.org/publicdomain/zero/1.0/) applies to the data made available in this article,unless otherwise stated.
Hall et al. BMC Pediatrics (2015) 15:56 DOI 10.1186/s12887-015-0375-y

BackgroundRespiratory illnesses (RI) in Aboriginal and Torres StraitIslander people (here forth referred to as Indigenous)are common, serious and important. Nationally, diseasesof the respiratory system, although ranked 4th as thecause of death in Indigenous infants, are the commonestcause of preventable deaths [1]. Respiratory disease isthe second most common reason for hospitalisationamong Indigenous Australians (after renal dialysis) [1].Lower acute RIs (ARI) account for the greatest numberof hospitalisations in young Indigenous children agedunder-5 years [1]. Also, the prevalence of serious chronicRIs such as non-cystic fibrosis (CF) bronchiectasis ishigh (one in 68 children) in Indigenous children livingin remote regions [2] and this is associated with repeatedepisodes of hospitalised RIs [3]. Thus, Indigenous childrenbear a disproportionate burden of acute and chroniclower RIs [4, 5].Worldwide, many factors have been identified as
increasing the risk of developing ARI. Most of these pre-dictors are inherently related to both the prenatal andantenatal periods and the first five years of life. Theseinclude overcrowding, malnutrition, exposure to tobaccosmoke, young maternal age, low birth weight, anaemia,poverty, illiteracy, overcrowding, parental smoking, pol-lution, socio economic status, social behaviours, culturalfactors and family history [6–9]. Despite the burden ofARI in Australian Indigenous children, there are limitedstudies that have examined these factors at the commu-nity level.To date the focus on ARI in Australian Indigenous
children has been almost entirely on children living in ruraland remote regions of Australia, with no community-baseddata on disease and its social and economic impacts intheir urban contemporaries. This is despite the fact thatmore Indigenous children live in urban Australia andsocio-economic and health indices are consistently lowerfor urban Indigenous communities when compared tonon-Indigenous populations [1]. Further, there are fewstudies that have examined differences in ARI incidenceand predictors between urban Indigenous and non-Indigenous children at the community level, particularlyin communities that are socio-economically and geo-graphically similar. A community-based Australian studyin west Sydney estimated that the reported rate ofpneumonia in non-Indigenous children was 7.5/1000,compared to 12/1000 in Indigenous Children [10]. Asurvey in the Australian Capital Territory reported thatIndigenous children had a higher prevalence of recentwheeze (21 %), wheeze with colds (36 %), dry cough atnight (27 %) and parent-reported asthma (24 %) comparedto 15 %, 23 %, 19 % and 15 % respectively in non- Indi-genous Islander children [11]. Maternal factors and theexternal environment have been linked to infertility,
early pregnancy loss, premature labour and low birth-weight. Children with low birth weight are six timesmore likely to be hospitalised with ARI than childrenwith normal birth weight [12, 13].In addition to the above, ARIs are also associated with
social and economic costs. Those relevant to the urbanIndigenous community are unknown. In non-Indigenouscommunities the only the Australian studies to investi-gate the cost associated with ARI have been conductedin cohorts of Melbourne pre-school aged children [14,15]. In the first study of children aged 12 – 71 monthsthat focussed on influenza like illness, the average costof community-managed episodes (without hospitalisa-tion) was $241 (95 % CI $191 - $291). The key costdrivers were carer time away from usual activities caringfor the ill child (70 % of costs), use of non-prescriptionmedications (5.4 %), and general practice visits (5.0 %).The patient and family met 87 % of total costs. In a fur-ther study focussing on viral respiratory illnesses, themean cost of ARIs was AU$309 (95 % CI $263 to $354).Influenza illnesses had a mean cost of AU$904 and RSV,AU$304. These studies were however conducted in apopulation with relatively high social and economic indi-ces. Data was not collected on the impact of theseillnesses on health service providers themselves.The lack of data on urban Indigenous populations has
been identified as one important barrier to Closing theGap initiatives [16]. Although more than half of Australia’sAboriginal and Torres Strait Islander population live inurban and regional centres, most research and commen-taries address the health and social issues of remote com-munities [17]. In the absence of such data, we plan toconduct a study that addresses some of these gaps. Here,we present our protocol for a longitudinal, community-based, cohort study of ARI in urban children aged < 5 yearspresenting to a presenting to a primary health care centre.
Aims and objectivesThis study aims to comprehensively describe the epidemi-ology, aetiology, social and economic impact and out-comes of ARI in children aged less than 5 years registeredwith an urban primary health care service. Our primaryobjectives are to determine the incidence and predictorsof ARI amongst urban Indigenous children over 12 monthsof child observation. Our secondary objectives are to: a)determine the prevalence of chronic cough (≥4 weeks dur-ation) following an ARI; b) determine the direct and indir-ect economic costs of ARI, and; c) examine nasal carriageof respiratory viruses and bacteria over a 12 month period.
Methods/DesignSettingThis study is being undertaken at Murri Medical(MM), a not-for-profit, Aboriginal owned and operated
Hall et al. BMC Pediatrics (2015) 15:56 Page 2 of 8

comprehensive primary health care service in Caboolture,a northern suburb of Brisbane, Queensland, Australia.MM provides services to the Moreton Bay RegionalCouncil Area, a region with a comparatively lowersocio-economic status than inner Brisbane areas [18],and has approximately 9500 registered clients of whichapproximately two-thirds identify as Aboriginal and/orTorres Strait Islander.
Research teamThe research team responsible for inception, implemen-tation, actioning and management of the protocol in-cludes paediatric specialists in the field of respiratorymedicine, microbiology, epidemiology, nursing, healtheconomics and biostatistics. Study specific research offi-cers (Aboriginal women) undertake recruitment, datacollection, complete participant follow-up, data entryand attend to daily study requirements such as bookingof specialist reviews. A paediatrician is responsible forthe review and assessment of children who developchronic cough following an ARI.
Study designAn ongoing prospective cohort study of Indigenous chil-dren aged less than 5 years registered with MM with12 months of observation per child. Children who developcough as a symptom at any time over the 12 months aresubsequently followed weekly for four weeks to ascertaincosts and cough outcomes. Participation in the study hasno bearing on the medical care provided to children atMM, which is conducted separately and in accordancewith clinic policies and procedures. Parents are also en-couraged to practice normal healthcare seeking behavioursthroughout the duration of their participation.Our primary endpoint is an ARI defined as an acute
illness (i.e. less than 14 days duration) with cough assymptom with or without any accompanying symptoms.Our secondary endpoints are: a) chronic cough defined ascough duration of greater than 28 days with no cessationof cough lasting more than 3 days; b) direct and indirectcosts of illness in Australian dollars, and c) detection ofper protocol respiratory viruses and bacteria by polymer-ase chain reaction (PCR) on nasal swabs.The study has been approved by Queensland Chil-
dren’s Health Services Human Research Ethics Commit-tee (HREC/12/QRCH/169), the Medical Research EthicsCommittee of the University of Queensland (2012001395)and the Human Research Ethics Committee of theQueensland University of Technology (1300000741).
RecruitmentRecruitment began in February 2013 and is planned tocontinue until June 2015 to account for annual variationin ARI incidence and aetiology. All children aged less
than 5 years presenting to MM during business hours(Monday to Friday, 0830 – 1700 h) are recorded on adetailed screening log by the research assistant. This logcontains de-identified demographic data as well as thereason for non-participation in the study (e.g.; ineligible,refused). Parents/guardians of all children are approachedby an Aboriginal researcher at the time of presentationto the clinic for assessment of eligibility. Using a plainlanguage statement or flip chart that explains the studyin detail, written informed consent is obtained from aparent(s) or carer if they agree to participate.
Inclusion criteriaChildren are eligible for the study if: a) they identify asAboriginal and/or Torres Strait Islander; b) they areaged less than five years at time of enrolment; c) theyare registered as a client of MM; d) the parent/guardianhas provided written informed consent, and; e) the par-ent/guardian is willing and able to complete the protocolrequirements.
Exclusion criteriaChildren are excluded from the study if they are planningto move from the study area in the following 12 months.
Study participationAt enrolment, a dedicated Indigenous research officercompletes a comprehensive questionnaire with the childand their guardian. (Fig. 1) Parent(s) or carers of enrolledchildren are contacted monthly via telephone, email orhome visiting for 12 months. Data collection during thesetime points include parent-collected nasal swabs, ARIevents and changes in child characteristics over time.Children with an ARI at any time during the study (at
presentation or later development of an ARI) are thenintensively followed via weekly follow-up via telephoneand/or email contacts for four weeks including nasalswabs, and parent-completed cough diary cards. Thesecontacts are used to ascertain parent reported cough per-sistence and type, parental absence from work due to theirchild’s cough, missed day-care/school due to cough andwhether or not the child’s cough has ceased for a period ofgreater than three consecutive days during the follow-upperiod. If a child has a persistent cough at day 28, he/sheis reviewed by a paediatrician with expertise in respiratorymedicine at the Queensland Children’s Respiratory Centrein Brisbane. At this review a comprehensive assessment iscompleted in accordance with current cough managementguidelines [19, 20]. Children are managed and investiga-tions performed as clinically indicated.
Data collectionAt enrolment, demographic, epidemiological, cultural,economic and clinical data are recorded including, but
Hall et al. BMC Pediatrics (2015) 15:56 Page 3 of 8

not limited to; reason for presentation to the clinical,the presence of any respiratory symptoms, healthcareutilisation prior to presentation, current and past med-ical history, medication use, treatment and diagnosis,clinical investigation results, socioeconomic status anddirect and indirect cost of ARI. Historical variables andthose previously described as risk factors for paediatricARI and lung disease are also collected, including; pastrespiratory history, familial history, asthma and lungdisease, household information (e.g. number of occu-pants), pregnancy related factors (e.g. gestational ageand birth weight), tobacco smoke exposure and culturalfactors (e.g. connection to traditional lands and cul-ture). A bilateral anterior nasal swab is collected atenrolment.For the economic data, both direct and indirect costs
to the family, health service provider and employer/
community are collected. (Table 1) Time spent by theproviders and associated activities will be measuredeither as resources/inputs used or the time spent by thehealth care personnel. Where such data may not beavailable, as is often the case, mainstream data can beadopted using Indigenous templates [21], or expertjudgement or explicit framework maybe used. The valu-ation of the resources used will involve the use of unitcosts from the Medicare Benefits Schedule, Pharma-ceutical Benefits Scheme and Aboriginal communityexpert judgements on certain activities [22, 23].Monthly data collection includes: parent(s) or carers
of enrolled children being contacted monthly viatelephone, email or home visiting for a period of12 months. Data collection during this time includesparent-collected nasal swabs, ARI events and changesin child characteristics over time.
Fig. 1 Study design
Hall et al. BMC Pediatrics (2015) 15:56 Page 4 of 8

Laboratory methodsThe nasal swabs are stored at −80 °C at the QueenslandPaediatric Infectious Diseases Laboratory, Royal Chil-dren’s Hospital, Brisbane. Nasal swabs are thawed andprocessed in batches for viral and bacterial identificationby polymerase chain reaction (PCR) testing as per ourpreviously described methods.PCR testing for M. pneumoniae, S.pneumoniae, Non
Typable Haemophilis influenzae (NTHi) and M. cattar-halis is conducted and a 16S signature sequence todetect all strains of Chlamydiales is used as an initialscreen before + ve specimens are tested for specific C.trachomatis, C pneumoniae and S. negevensis sequences.PCR will also be used to detect 17 viruses associated
with the human respiratory tract including; adenovirus,respiratory syncytial virus, influenza virus types A & B,parainfluenza virus types 1–3, human metapneumovirus,human rhinoviruses, human coronaviruses (OC43, 229E,NL63 + HKU1), human bocavirus and human polyoma-viruses KI and WU. Specimen extracts to be tested fromeach individual will be pooled and will undergo PCRtesting for the above-mentioned respiratory pathogens.
Data handling and storageData are collected using paper-based case report formsand entered into a secure Filemaker Pro V12.0 (FilemakerInc, Santa Clara, CA) database. On completion of studyparticipation, the Chief Investigator reviews all participant
files and approves them for sign off and storage. All studyfolders are stored in a locked secure cabinet accessibleonly to study staff unless required by legislative or regula-tory agencies. Data collected throughout the study aremonitored and participant files checked against sourcedocuments for completeness and accuracy at completionof each stage.
Sample sizeIn the absence of published data on the incidence ofrespiratory illness, in urban Aboriginal and Torres StraitIslander children at the community level, calculating asample size on a priori evidence is not possible. A studyof urban children living in Melbourne during the wintermonths reported an incidence of influenza-like illnessesof 0.53 episodes per child-month (95 % CI 0.44-0.61)[24]. If we assume a similar incidence, 242 children willbe sufficient to detect this rate with a 95 % CI and mar-gin of error of 5.8 %. As the incidence is likely to behigher, a preliminary analysis will be performed when120 children are enrolled to determine whether the apriori sample size can be modified.
Data analysisBroadly, descriptive and analytical statistical methods willbe utilised including univariate and multivariate logisticand Poisson regression to identify independent predictorsof study endpoints. Demographic, clinical, laboratory,
Table 1 Direct and indirect cost of ARI
Family Employers/Community Healthcare Service
Medication usage Time spent seeking healthcare Medication usage
- includes over-the-counter and prescribedmedications
- Time off work with pay - includes over-the-counter and prescribed medications
- Time off work with pay lost
- Time off usual activity
Healthcare seeking travel costs Extra time spent caring for child Healthcare service utilisation
- includes ambulance and communitytransport services
- Time off work with pay - diagnostic tests and complementary/alternative therapies
- Time off work with pay lost - distinguishes between public and private, paid and bulkbilled services
- Time off usual activity
Time spent seeking healthcare Healthcare seeking travel costs Healthcare seeking travel costs
- Time off work with pay - includes ambulance and communitytransport services
- includes ambulance and community transport services
- Time off work with pay lost
- Time off usual activity
Extra time spent caring for child
- Time off work with pay
- Time off work with pay lost
- Time off usual activity
Missed childcare/school
Missed planned activities
- child and others
Hall et al. BMC Pediatrics (2015) 15:56 Page 5 of 8

socio-economic and risk factor data will be tabulatedand expressed as proportions and/or means of theselected characteristics with the corresponding 95 %Confidence Intervals (CI).Economic analyses will be done according to estab-
lished methods [25]: including detailed subanalyses ofdata that account for epidemiological, social, cultural,risk factor and microbiological variables.The primary analysis will be the incidence density of
ARI over a 12-month period. Differences in demo-graphic, clinical, laboratory and risk factor data betweenchildren who do and do not develop ARI will beassessed by the normal test for comparisons of meansand χ2 tests for comparison of proportions. The inci-dence of ARI and the predictors for episodes will beassessed assuming a Poisson distribution and multivari-ate analyses performed using Poisson regressionmethods. The denominator will be child weeks of obser-vation, with the number of days of ARI experienced foreach child removed from person-time at risk calculations.To estimate the cost of ARI illness, the costing ap-
proach will involve following three steps [26]: a) Identifi-cation of the appropriate resources used, b) Measurementof resources used; and c) valuation of such resources used.Identification of the resources or inputs used, such ashealth care personnel, transport, consumables, will beguided by the ARI clinical or care pathway, which will beused to identify key care activities and associated unitcosts. The pathway will reflect the purpose of the exercise,identify all the components or elements of the program/service in a linear manner, and may involve disease pro-gressions [27]. Some or all of the following type of activ-ities will be included in the costing, which may differ fromcosts in non-ACCHS services: Co-payments for thepharmaceutical products; transport of clients to and fromclinic /or services, social and cultural issue that clinic staffwith on behalf of client’s e.g. economic hardship, legalissues. The units of measure of costing data will then becombined with the unit costs to estimate the cost of eachactivity. The costs of the activities will be aggregated toestimate the cost of illness in Indigenous peoples.
DiscussionTo our best of our knowledge, this will be the firstAustralian study and one of the few worldwide to com-prehensively evaluate ARIs and their outcomes in Indi-genous children living in an urban area. To date, thefocus on ARIs has been almost entirely on childrenliving in rural and remote regions of Australia, with nocommunity based data on disease and its social andeconomic impacts in urban Indigenous children. Ourprospective cohort study design in conjunction with acomprehensive clinical, epidemiological, economic andmicrobiological collection of data will address issues at
both the time of presentation and during the recoveryphase of cough illness. Data from this study will likelycontribute to future research aiming to develop evidence-based guidelines to improve the early detection, preventionand management of chronic cough in children during andafter ARI.
Rationale for study endpointsOur definition of ARI that incorporates cough as asymptom is designed to be more specific for events thatare likely to lead to higher morbidity and reflect illnessessuch as bronchiolitis and pneumonia, important pre-cursors to the development of chronic lung diseases inchildren, particularly if recurrent [20]. Monitoring thedevelopment of chronic cough (i.e. > 4 week’s duration)is therefore a key secondary endpoint given its role as anindicator of lower airways disease. Enrolling children fora period of 12 months and incorporating monthly followup will enable us to measure changes in predictors (e.g.child care attendance, changes in breastfeeding andvaccination status and exposure to tobacco smoke) andimpacts over time.Our economic endpoints, using a societal perspective,
will include cost to the parent/family, cost to the healthcare sector and other sectors of the economy, such asschool attendance and absenteeism from employment[25]. This will enable a complete analysis of the cost ofillness that incorporates both direct and indirect costs.Establishing these costs will enable the development ofinterventions to reduce the burden of disease that in-corporate the cost effectiveness of these strategies.Our microbiological endpoints will provide new infor-
mation on the characteristics of these infections inurban Indigenous children at the community level givenvery few children presenting to primary care settingswith ARI undergo bacterial and viral testing. The collec-tion of bilateral anterior nasal swabs on all study childrenwill identify viral and bacterial pathogens associated withARI and cough at both the time of enrolment, and atmonthly time points and specialist review. An extendedpanel of known respiratory pathogens (previously dis-cussed) was chosen to ensure that pathogens excludedfrom routine respiratory PCR testing were included foranalysis and contribute to the literature on pathogens forwhich the association between nasal detection and clinicalillness is still being explored (e.g. polyomaviruses) [28].Using an extended panel also enhances our ability to ex-plore viral and bacterial interactions and their effects oncough outcomes. However, associating viral detection withcurrent illness is not straight forward as up to 42 % of chil-dren who have a non-classical virus detected are asymp-tomatic [29]. Also, co-detection of viruses and/or viruswith bacteria are also commonly found in children withacute and chronic respiratory illnesses [30, 31].
Hall et al. BMC Pediatrics (2015) 15:56 Page 6 of 8

A major strength of our study is that Aboriginal re-search officers are undertaking all recruitment and datacollection in an Indigenous specific primary health caresetting, recruitment and data collection is conducted ina culturally safe environment. The relationship betweenthe researcher and participants established with mutualrespect and empathy under an ‘indigenous’ umbrella of‘unwritten’ respect and trust better known as an indigen-ous methodology, indigenous way of doing [32].
LimitationsSelection biasA difference may exist between families who seek carethrough MM and those who attend other primary carefacilities. As MM services an area of predominantly lowsocio-economic status, ARI incidence and its predictors/outcomes may be higher than other settings. It is plausiblethat parents of children with recurrent ARI are more likelyto enrol and complete the study, potentially overestimat-ing the prevalence of chronic cough at day 28. Similarlychildren with existing undiagnosed chronic lung diseasemay be enrolled in the study also inflating the prevalenceof chronic cough. However, the identification of thesechildren will be an important outcome for the child andhis/her family. Our extensive baseline data collection andcomprehensive assessment of child at specialist review willallow assessment of these potential biases.There is also the potential of bias derived from loss-
to-follow-up, particularly as those who complete thestudy may differ from those who do not. However it isexpected that this will be limited due to the relationshipbetween the researcher and participants established withmutual respect and empathy under an ‘Indigenous’ um-brella of ‘unwritten’ respect and trust better known as anIndigenous methodology, Indigenous way of doing [32].Early specialist referral (within 2 weeks of day 28) as partof the study is likely to underestimate costs in childrenwith chronic cough and is therefore, more likely to repre-sent the cost-of-illness incurred with early intervention.However, retrospective collection of cough persistenceand healthcare utilisation data at the time of enrolmentwill allow for assessment of such a bias. The collection ofdetailed symptom, treatment and clinical data, as well asthe collection of study specific anterior nasal swabs willminimise the effect of any potential bias.
Measurement biasClinician diagnosis may vary between doctors at theclinic due to experience and expertise consequentlydiagnosis, clinical investigations performed and treat-ment given may vary between clinicians. Our collectionof detailed symptom, treatment and clinical data willfacilitate standardising study specific case definitions.
Proxy reporting by parents of cough persistence and typevia a diary card using a VCD score was the chosen methodfor recording cough data during ARI follow up [33]. Eventhough some misclassification of cough may occur, Changet al. [34] report that VCD diary cards have the highestcorrelation to cough frequency when measured objectivelyand hence, can be used in the absence of practical objectivemeasures to evaluate cough severity and persistence. Atspecialist review (where required), both the parent andtreating physician report on cough type allowing for theassessment of inter-rater reliability and the potential forderived bias Through employing a small team of studyspecific respiratory specialists from the same centre, thepotential for bias derived from inconsistency of diagnosisat the time of specialist review will be minimised.
ConclusionARIs are an inadequately researched cause of morbidityin urban Indigenous children. This study will describethe natural history, epidemiology, aetiology, outcomesand cost of ARI in urban Indigenous children. The re-sults will inform studies for evidence-based guidelines toimprove the early detection, prevention and manage-ment of chronic cough in children during and after ARI.
AbbreviationsARI: Acute respiratory illness; cHRCT: Chest high resolution computerisedtomography; CSLD: Chronic suppurative lung disease; NHMRC: NationalHealth and Medical Research Council; PBB: Protracted bacterial bronchitis;PCR: Polymerase chain reaction; VCD: Verbal category descriptive; MM: MurriMedical; RI: Respiratory Illness; SMS: Short message service.
Competing interestsThe authors declare that they have no competing interests.
Authors’ contributionsKH was the primary author of the manuscript with substantial contributionfrom KOG, ABC and TS. JA, AK, JH, MO, all contributed to the developmentof the study protocol. Contributed to the study protocol and developmentof standard operating procedures. All authors reviewed and approved thedraft manuscript.
AcknowledgementsThe authors would like to thank the following for their support with studyimplementation and recruitment: Amber Revel, Melissa Dunbar, Jane Pooley,Dan Arnold, Benjamin Drescher from the Queensland Children’s MedicalResearch Institute Respiratory infection Outreach and Research team. JacobAnderson, Ryan Anderson, Kim Bullivant, Gavan Bullivant, Megan Anderson,Lauren Doheny, Loretta Anderson, Melissa Bond from Murri Health Group.
FundingFunding for the study has been provided through a Queensland Children’sMedical Research Institute Project Grant, UQ Foundation Research ExcellenceAward and a Queensland University of Technology Indigenous Health start-upresearch grant. Kerry-Ann O’Grady is funded by a National Health and MedicalResearch Council (NHMRC) Career Development Fellowship (grant 1045157)and Queensland Government Smart Futures Fellowship. Anne Chang is fundedby a NHMRC Practitioner Fellowship (grant 1058213). KH is funded by anAustralian Postgraduate Award (2014–2015) and a supervisor top-upscholarship through the NHMRC Centre for Research Excellence for LungHealth in Aboriginal and Torres Strait Islander children. The views expressedin this publication are those of the authors and do not reflect the views ofthe NHMRC.
Hall et al. BMC Pediatrics (2015) 15:56 Page 7 of 8

Author details1Queensland Children’s Medical Research Institute, Queensland University ofTechnology, Herston, QLD, Australia. 2Menzies School of Health Research,Charles Darwin University, Tiwi, NT, Australia. 3Queensland Children’sRespiratory Centre, Royal Children’s Hospital, Brisbane, QLD, Australia. 4SirAlbert Sakzewski Virus Research Centre, Queensland Paediatric InfectiousDiseases Laboratory, Royal Children’s Hospital, Brisbane, Australia. 5ChildHealth Research Centre, The University of Queensland, Herston, QLD,Australia. 6Murri Medical, Caboolture, QLD, Australia. 7University ofQueensland Centre for Clinical Research, The University of Queensland,Herston, QLD, Australia. 8School of Allied Health, Australian CatholicUniversity, North Sydney, NSW, Australia.
Received: 21 November 2014 Accepted: 6 May 2015
References1. Australian Institute of Health & Welfare. Aboriginal and Torres Strait Islander
Health Performance Framework 2008 report: detailed analyses. Canberra:Australian Government; 2009.
2. Chang AB, Grimwood K, Mulholland EK, Torzillo PJ, Working Group onIndigenous Paediatric Respiratory Health. Bronchiectasis in indigenouschildren in remote Australian communities. Med J Aust. 2002;177(4):200–4.
3. Valery PC, Torzillo PJ, Mulholland K, Boyce NC, Purdie DM, Chang AB.Hospital-based case–control study of bronchiectasis in indigenous childrenin Central Australia. Pediatr Infect Dis J. 2004;23(10):902–8.
4. O’Grady KA, Chang AB. Lower respiratory infections in Australian Indigenouschildren. J Paediatr Child Health. 2010;46(9):461–5.
5. O’Grady KA, Torzillo PJ, Chang AB. Hospitalisation of Indigenous children inthe Northern Territory for lower respiratory illness in the first year of life.Med J Aust. 2010;192(10):586–90.
6. Ali M, Emch M, Tofail F, Baqui AH. Implications of health care provision onacute lower respiratory infection mortality in Bangladeshi children. SocialScience & Medicine. 2001;52(2):267–77.
7. Fuchs SC, Maynart R, Costa LF, Cardozo A, Schierholt R. Duration of day-careattendance and acute respiratory infection. Cad Saude Publica.1996;12(3):291–6.
8. Wald ER, Guerra N, Byers C. Upper respiratory tract infections in youngchildren: duration of and frequency of complications. Pediatrics.1991;87(2):129–33.
9. Wald ER, Dashefsky B, Byers C, Guerra N, Taylor F. Frequency and severity ofinfections in day care. J Pediatr. 1988;112(4):540–6.
10. Macintyre S, McKay L, Der G, Hiscock R. Socio-economic position and health:what you observe depends on how you measure it. J Public HealthMedicine. 2003;25(4):288–94.
11. Glasgow NJ, Goodchild EA, Yates R, Ponsonby AL. Respiratory health inAboriginal and Torres Strait Islander children in the Australian CapitalTerritory. J Paediatrics Child Health. 2003;39(7):534–9.
12. Cardoso AM, Coimbra CEA, Werneck GL. Risk factors for hospital admissiondue to acute lower respiratory tract infection in Guarani indigenouschildren in southern Brazil: a population-based case-control study. Trop MedInt Health. 2013;18:596–607.
13. Victora CG, Smith PG, Vaughan JP, Nobre LC, Lombardi C, Teixeira AM, et al.Influence of birth weight on mortality from infectious diseases: a case–controlstudy. Pediatrics. 1988;81(6):807–11.
14. Lambert S, O’Grady KA, Gabriel S, Carter R, Nolan T. The cost of seasonalrespiratory illnesses in Australian children: the dominance of patient andfamily costs and implications for vaccine use. Commun Dis Intell Q Rep.2004;28:510–6.
15. Lambert SB, Allen KM, Carter RC, Nolan TM. The cost of community-managedviral respiratory illnesses in a cohort of healthy preschool-aged children. RespirRes 2008; 9(11) doi:10.1186/1465-9921-9-11.
16. Eades SJ. Reconciliation, social equity and indigenous health. Med J Aust.2000;172(10):468–9.
17. Pyett P, Waples‐Crowe P, Van Der Sterren A. Engaging with Aboriginalcommunities in an urban context some practical suggestions for publichealth researchers. Aust New Zealand J Public Health. 2009;33(1):51–4.
18. Australian Bureau of Statistics. Census data. Canberra: AustralianGovernment; 2011.
19. Chang AB, Bell SC, Byrnes CA, Grimwood K, Holmes PW, King PT, et al.Chronic suppurative lung disease and bronchiectasis in children and adults
in Australia and New Zealand. A position statement from the ThoracicSociety of Australia and New Zealand and the Australian Lung Foundation.Med J Aust. 2010;193(6):356–65.
20. Chang AB, Glomb WB. Guidelines for evaluating chronic cough in pediatrics:ACCP evidence-based clinical practice guidelines. Chest.2006;129(1 Suppl):260S–83.
21. Ong KS, Kelaher MIA, Carter R. A cost-based equity weight for use in theeconomic evaluation of primary health care interventions: case study of theAustralian Indigenous population. Int J Equity in Health. 2009;8:34.
22. Doran CM, Einfeld SL, Madden RH, Otim M, Horstead SK, Ellis LA, et al. Howmuch does intellectual disability really cost? First estimates for Australia.J Intellectual and Developmental Disability. 2012;37(1):42–9.
23. Otim M, Anderson I, Deeble J. Expenditure on Health Services for AboriginalPeople in the DHS Loddon Mallee Region, 2003–04. Melbourne: Universityof Melbourne; 2005.
24. Lambert SB, O’Grady KB, Gabriel SH, Nolan TM. Respiratory illness duringwinter: a cohort study of urban children from temperate Australia. J PaediatrChild Health. 2005;41(3):125–9.
25. Drummond MF, Sculpher M, Torrance G, O’Brien B, Stoddart G. Methods forthe economic evaluation of health care programmes. New York: OxfordUniversity Press; 2005.
26. Drummond MF, McGuire A. Economic evaluation in health care: mergingtheory with practice. 1st ed. New York: Oxford University Press; 2001.
27. Crockett A, Cranston J, Moss J, Scown P, Mooney G, Alpers J. Programbudgeting and marginal analysis: a case study in chronic airflow limitation.Australian Health Review. 1999;22(3):65–77.
28. Sloots TP, Whiley DM, Lambert S, Nissen MD. Emerging respiratory agents:new viruses for old diseases? J Clinical virology. 2008;42(3):233–43.
29. Advani S, Sengupta A, Forman M, Valsamakis A, Milstone AM. Detectingrespiratory viruses in asymptomatic children. Pediatr Infect Dis J.2012;31(12):1221–6.
30. Wurzel DF, Marchant JM, Clark JE, Masters B, Yerkovich ST, Upham JW, et al.Wet cough in children: Infective and inflammatory characteristics inbroncho‐alveolar lavage fluid. Pediatric Pulmonology. 2014;49(6):561–8.
31. Brand HK, de Groot R, Galama J, Brouwer ML, Teuwen K, Hermans PWM,et al. Infection with multiple viruses is not associated with increased diseaseseverity in children with bronchiolitis. Pediatric Pulmonology. 2012;47(4):393–400.
32. Moreton- Robinson A, Walter M. Indigenous methodologies in socialresearch. Social Research Methods : An Australian Perspective. SouthMelbourne: Oxford University Press; 2009. p. 1–18.
33. Chang AB, Newman RG, Carlin JB, Phelan PD, Robertson CF. Subjectivescoring of cough in children: parent-completed vs child-completed diarycards vs an objective method. Eur Respir J. 1998;11(2):462–6.
34. Chang A, Gaffney JT, Eastburn MM, Faoagali J, Cox NC, Masters IB. Coughquality in children: a comparison of subjective vs. bronchoscopic findings.Respir Res. 2005;6:3.
Submit your next manuscript to BioMed Centraland take full advantage of:
• Convenient online submission
• Thorough peer review
• No space constraints or color figure charges
• Immediate publication on acceptance
• Inclusion in PubMed, CAS, Scopus and Google Scholar
• Research which is freely available for redistribution
Submit your manuscript at www.biomedcentral.com/submit
Hall et al. BMC Pediatrics (2015) 15:56 Page 8 of 8

280 Appendices
Appendix B: Published study protocol for the Emergency Department Cough (EDC)
study

STUDY PROTOCOL Open Access
The development of chronic cough in childrenfollowing presentation to a tertiary paediatricemergency department with acute respiratoryillness: study protocol for a prospective cohortstudyBenjamin J Drescher1†, Anne B Chang2,3,4†, Natalie Phillips5, Jason Acworth5, Julie Marchant1, Theo P Sloots1,6,Michael David1 and Kerry-Ann F O’Grady1*†
Abstract
Background: Acute respiratory illness, a leading cause of cough in children, accounts for a substantial proportionof childhood morbidity and mortality worldwide. In some children acute cough progresses to chronic cough(>4 weeks duration), impacting on morbidity and decreasing quality of life. Despite the importance of chroniccough as a cause of substantial childhood morbidity and associated economic, family and social costs, data on theprevalence, predictors, aetiology and natural history of the symptom are scarce. This study aims to comprehensivelydescribe the epidemiology, aetiology and outcomes of cough during and after acute respiratory illness in childrenpresenting to a tertiary paediatric emergency department.
Methods/design: A prospective cohort study of children aged <15 years attending the Royal Children’s HospitalEmergency Department, Brisbane, for a respiratory illness that includes parent reported cough (wet or dry) as asymptom. The primary objective is to determine the prevalence and predictors of chronic cough (≥4 weeksduration) post presentation with acute respiratory illness. Demographic, epidemiological, risk factor, microbiologicaland clinical data are completed at enrolment. Subjects complete daily cough dairies and weekly follow-up contactsfor 28(±3) days to ascertain cough persistence. Children who continue to cough for 28 days post enrolment arereferred to a paediatric respiratory physician for review. Primary analysis will be the proportion of children withpersistent cough at day 28(±3). Multivariate analyses will be performed to evaluate variables independentlyassociated with chronic cough at day 28(±3).
Discussion: Our protocol will be the first to comprehensively describe the natural history, epidemiology, aetiologyand outcomes of cough during and after acute respiratory illness in children. The results will contribute to studiesleading to the development of evidence-based clinical guidelines to improve the early detection and managementof chronic cough in children during and after acute respiratory illness.
Keywords: Acute respiratory illness, Chronic lung disease, Chronic cough, Paediatric emergency department
* Correspondence: [email protected]†Equal contributors1Queensland Children’s Medical Research Institute, The University ofQueensland, Level 4, Foundation Building, Royal Children’s Hospital, HerstonRoad, Brisbane, Herston QLD 4029, AustraliaFull list of author information is available at the end of the article
© 2013 Drescher et al.; licensee BioMed Central Ltd. This is an Open Access article distributed under the terms of the CreativeCommons Attribution License (http://creativecommons.org/licenses/by/2.0), which permits unrestricted use, distribution, andreproduction in any medium, provided the original work is properly cited.
Drescher et al. BMC Pediatrics 2013, 13:125http://www.biomedcentral.com/1471-2431/13/125
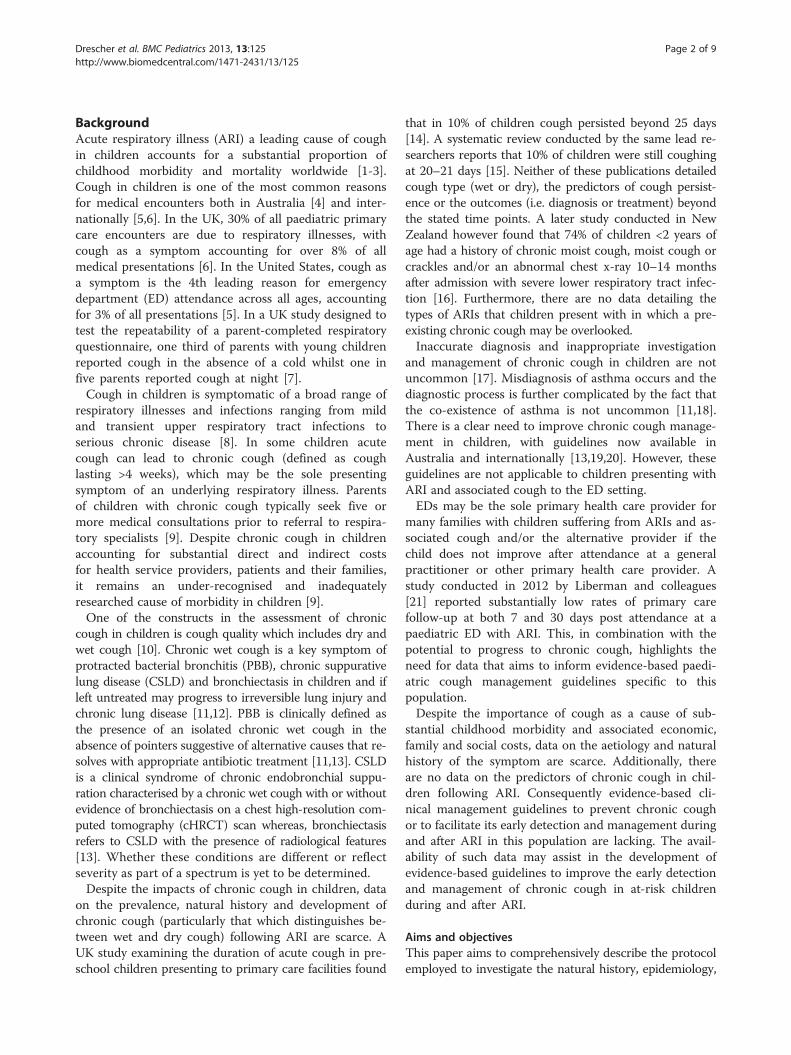
BackgroundAcute respiratory illness (ARI) a leading cause of coughin children accounts for a substantial proportion ofchildhood morbidity and mortality worldwide [1-3].Cough in children is one of the most common reasonsfor medical encounters both in Australia [4] and inter-nationally [5,6]. In the UK, 30% of all paediatric primarycare encounters are due to respiratory illnesses, withcough as a symptom accounting for over 8% of allmedical presentations [6]. In the United States, cough asa symptom is the 4th leading reason for emergencydepartment (ED) attendance across all ages, accountingfor 3% of all presentations [5]. In a UK study designed totest the repeatability of a parent-completed respiratoryquestionnaire, one third of parents with young childrenreported cough in the absence of a cold whilst one infive parents reported cough at night [7].Cough in children is symptomatic of a broad range of
respiratory illnesses and infections ranging from mildand transient upper respiratory tract infections toserious chronic disease [8]. In some children acutecough can lead to chronic cough (defined as coughlasting >4 weeks), which may be the sole presentingsymptom of an underlying respiratory illness. Parentsof children with chronic cough typically seek five ormore medical consultations prior to referral to respira-tory specialists [9]. Despite chronic cough in childrenaccounting for substantial direct and indirect costsfor health service providers, patients and their families,it remains an under-recognised and inadequatelyresearched cause of morbidity in children [9].One of the constructs in the assessment of chronic
cough in children is cough quality which includes dry andwet cough [10]. Chronic wet cough is a key symptom ofprotracted bacterial bronchitis (PBB), chronic suppurativelung disease (CSLD) and bronchiectasis in children and ifleft untreated may progress to irreversible lung injury andchronic lung disease [11,12]. PBB is clinically defined asthe presence of an isolated chronic wet cough in theabsence of pointers suggestive of alternative causes that re-solves with appropriate antibiotic treatment [11,13]. CSLDis a clinical syndrome of chronic endobronchial suppu-ration characterised by a chronic wet cough with or withoutevidence of bronchiectasis on a chest high-resolution com-puted tomography (cHRCT) scan whereas, bronchiectasisrefers to CSLD with the presence of radiological features[13]. Whether these conditions are different or reflectseverity as part of a spectrum is yet to be determined.Despite the impacts of chronic cough in children, data
on the prevalence, natural history and development ofchronic cough (particularly that which distinguishes be-tween wet and dry cough) following ARI are scarce. AUK study examining the duration of acute cough in pre-school children presenting to primary care facilities found
that in 10% of children cough persisted beyond 25 days[14]. A systematic review conducted by the same lead re-searchers reports that 10% of children were still coughingat 20–21 days [15]. Neither of these publications detailedcough type (wet or dry), the predictors of cough persist-ence or the outcomes (i.e. diagnosis or treatment) beyondthe stated time points. A later study conducted in NewZealand however found that 74% of children <2 years ofage had a history of chronic moist cough, moist cough orcrackles and/or an abnormal chest x-ray 10–14 monthsafter admission with severe lower respiratory tract infec-tion [16]. Furthermore, there are no data detailing thetypes of ARIs that children present with in which a pre-existing chronic cough may be overlooked.Inaccurate diagnosis and inappropriate investigation
and management of chronic cough in children are notuncommon [17]. Misdiagnosis of asthma occurs and thediagnostic process is further complicated by the fact thatthe co-existence of asthma is not uncommon [11,18].There is a clear need to improve chronic cough manage-ment in children, with guidelines now available inAustralia and internationally [13,19,20]. However, theseguidelines are not applicable to children presenting withARI and associated cough to the ED setting.EDs may be the sole primary health care provider for
many families with children suffering from ARIs and as-sociated cough and/or the alternative provider if thechild does not improve after attendance at a generalpractitioner or other primary health care provider. Astudy conducted in 2012 by Liberman and colleagues[21] reported substantially low rates of primary carefollow-up at both 7 and 30 days post attendance at apaediatric ED with ARI. This, in combination with thepotential to progress to chronic cough, highlights theneed for data that aims to inform evidence-based paedi-atric cough management guidelines specific to thispopulation.Despite the importance of cough as a cause of sub-
stantial childhood morbidity and associated economic,family and social costs, data on the aetiology and naturalhistory of the symptom are scarce. Additionally, thereare no data on the predictors of chronic cough in chil-dren following ARI. Consequently evidence-based cli-nical management guidelines to prevent chronic coughor to facilitate its early detection and management duringand after ARI in this population are lacking. The avail-ability of such data may assist in the development ofevidence-based guidelines to improve the early detectionand management of chronic cough in at-risk childrenduring and after ARI.
Aims and objectivesThis paper aims to comprehensively describe the protocolemployed to investigate the natural history, epidemiology,
Drescher et al. BMC Pediatrics 2013, 13:125 Page 2 of 9http://www.biomedcentral.com/1471-2431/13/125

aetiology and outcomes of cough during and after ARI inchildren presenting to a tertiary paediatric ED. The datacollected will potentially inform studies leading to thedevelopment of evidence-based clinical guidelines toimprove the early detection and management of chroniccough in children.The primary objective of this study is to determine the
prevalence of parent reported chronic cough (≥4 weeksduration) amongst children at 28 days following presen-tation with ARI to a tertiary paediatric ED. Secondaryobjectives are:
� To determine the prevalence of parent reportedchronic cough by type (wet or dry) amongstchildren at 28 days following presentation with ARIto a tertiary paediatric ED
� To determine the prevalence of underlying lungdisease (PBB, CSLD or bronchiectasis) amongstchildren with ARI presenting to a tertiarypaediatric ED
� To identify predictors/risk factors independentlyassociated with chronic cough at 28 days followingpresentation to a tertiary paediatric ED with ARI
� To identify viral and bacterial pathogens associatedwith ARI at presentation to a tertiary paediatric ED
� To identify upper airway viral and bacterialpathogens associated with chronic cough at 28 daysfollowing presentation to a tertiary paediatric EDwith ARI
Methods/designSettingThe Royal Children’s Hospital (RCH), Brisbane, Australia,was chosen for the setting of this cohort study as it is thelargest tertiary paediatric public hospital in the state. TheED services an average of 29000 children per year. Ap-proximately 4116 (14%) presentations per year are for re-spiratory complaints, with 2220 (54%) of these reportingcough as a symptom (RCH, unpublished ED triage data,2010). The ED has ready access to full diagnostic servicesand, amongst other services, the RCH operates a large ter-tiary paediatric respiratory medicine service.
Research teamThe research team responsible for inception, implemen-tation, actioning and management of the protocol in-cludes paediatric specialists in the fields of respiratoryand ED medicine, microbiology, epidemiology, nursingand biostatistics. A team of clinical nurses from thePaediatric Emergency Research Unit (PERU) at the RCHED are responsible for participant recruitment and base-line data collection. A study specific research assistantcompletes participant follow-up, data entry and attendsto daily study requirements such as the booking of
specialist reviews. A paediatric respiratory specialist isresponsible for the review and assessment of childrenwith chronic cough at 28 days post enrolment.
Study designA prospective cohort study of children aged <15 yearsattending the RCH ED for a respiratory illness that in-cludes parent reported cough (wet or dry) as a symptom.Enrolled children are followed for 28 days post ED pres-entation to ascertain cough status following ARI. Chil-dren with persistent cough at day 28 (i.e. no more than a3 day break in cough during the follow-up period) willundergo a respiratory assessment within 2 weeks by apaediatric respiratory physician.The study protocol has been approved by the Queensland
Children’s Health Services Human Research EthicsCommittee (HREC/11/QRCH/83) and by the Medical Re-search Ethics Committee of the University of Queensland(2012000700). Standard operating procedures for all studyoperations have been developed and implemented inaccordance with International Conference on Harmo-nisation - Good Clinical Practice [22] guidelines and theNational Health and Medical Research Council’s (NHMRC)[23] ethical guidelines.
RecruitmentParticipant recruitment for the study began in December2011 and will continue through until July 2015 to ac-count for annual variations in ARI prevalence. Childrenpresenting to the RCH ED with a possible respiratory ill-ness (cough and/or fever) are identified by a PERU nurseat the time of triage (Monday-Saturday, between 0600–2100 hours) for potential participation in the study. ThePERU nurse then assesses the child for eligibilitythrough medical record review, discussion with thetreating medical team and/or parent/guardian. ThePERU nurse then invites eligible children and their par-ents to the study via the provision of child and parentspecific plain language statements. Written informedconsent from parents/guardians and assent from chil-dren aged ≥12 years is obtained in accordance with theDeclaration of Helsinki [24] and NHMRC [23] guide-lines. All children presenting to the RCH ED with a pos-sible respiratory illness are recorded on a detailedscreening log by a PERU nurse. This log contains de-identified demographic and ED triage data as well as thereason for non-participation in the study (eg; ineligible,refused, presented outside of recruitment hours).
Inclusion criteriaAge <15 years; parent reported cough as a symptom,and; present in the ED between the hours of 6am and9pm (or an inpatient ward within 24 hours post EDpresentation).
Drescher et al. BMC Pediatrics 2013, 13:125 Page 3 of 9http://www.biomedcentral.com/1471-2431/13/125
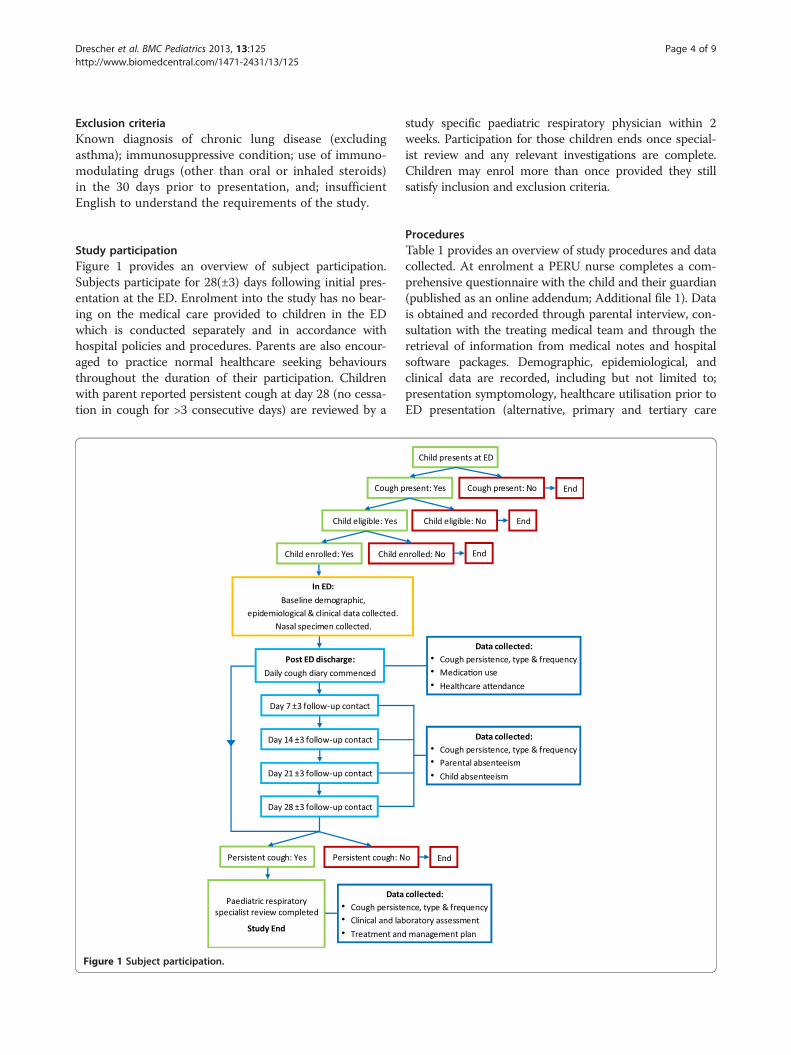
Exclusion criteriaKnown diagnosis of chronic lung disease (excludingasthma); immunosuppressive condition; use of immuno-modulating drugs (other than oral or inhaled steroids)in the 30 days prior to presentation, and; insufficientEnglish to understand the requirements of the study.
Study participationFigure 1 provides an overview of subject participation.Subjects participate for 28(±3) days following initial pres-entation at the ED. Enrolment into the study has no bear-ing on the medical care provided to children in the EDwhich is conducted separately and in accordance withhospital policies and procedures. Parents are also encour-aged to practice normal healthcare seeking behavioursthroughout the duration of their participation. Childrenwith parent reported persistent cough at day 28 (no cessa-tion in cough for >3 consecutive days) are reviewed by a
study specific paediatric respiratory physician within 2weeks. Participation for those children ends once special-ist review and any relevant investigations are complete.Children may enrol more than once provided they stillsatisfy inclusion and exclusion criteria.
ProceduresTable 1 provides an overview of study procedures and datacollected. At enrolment a PERU nurse completes a com-prehensive questionnaire with the child and their guardian(published as an online addendum; Additional file 1). Datais obtained and recorded through parental interview, con-sultation with the treating medical team and through theretrieval of information from medical notes and hospitalsoftware packages. Demographic, epidemiological, andclinical data are recorded, including but not limited to;presentation symptomology, healthcare utilisation prior toED presentation (alternative, primary and tertiary care
Figure 1 Subject participation.
Drescher et al. BMC Pediatrics 2013, 13:125 Page 4 of 9http://www.biomedcentral.com/1471-2431/13/125

services), current and past medical history, medicationuse, ED clinical management, treatment and diagnosis,clinical investigation results and socioeconomic status.Historical variables and those previously described as riskfactors for paediatric ARI and lung disease will also becollected at enrolment, including; past respiratory history,familial history of atopy, asthma and lung disease, house-hold information (e.g. number of occupants), pregnancyrelated factors (e.g. gestational age and birth weight),tobacco smoke exposure and being of Aboriginal orTorres Strait Islander decent. In cases where the child wasadmitted to a RCH ward post ED discharge, basic hospi-talisation data will also be collected, including; primaryand secondary diagnoses, length of stay, clinical investi-gation data and respiratory medicine consultations. Abilateral anterior nasal swab will be collected (or a sam-ple of nasopharyngeal aspirate if obtained during clinicalcare).Parents are also asked to complete a previously vali-
dated verbal category descriptive (VCD) [25] scorecough diary card for 28 days post enrolment. Therecruiting PERU nurse provides the parent with bothverbal and written instruction on how to complete thedairy card and a reply paid envelope to facilitate diaryreturn. Parents also receive weekly dairy reminders viaphone or email. Diary items include, cough persistenceand frequency, medication use, and whether or not theysought further medical advice for the cough. If the diarycard shows that the child has not stopped coughing for
a period of greater than three consecutive days duringthe 28 day follow-up period, he/she will be referred to astudy specific paediatric respiratory specialist at theRCH within 2 weeks for further investigation andmanagement.Follow-up contacts, via phone or email are also conducted
by a study specific research assistant with parents at day7, 14, 21 and 28(±3). Three contact attempts are made ateach follow-up time point. If at any time point a contactis unsuccessful, a diary card reminder is still issued andeach successive contact attempted. These contacts areused to ascertain parent reported cough persistence andtype, parental absence from work due to their child’scough, missed day-care/school due to cough and whetheror not the child’s cough has ceased for a period of greaterthan three consecutive days during the follow-up period.In cases where a diary card is not returned, cough persis-tence information gathered at these contacts will identifychildren requiring specialist review.At specialist review a comprehensive assessment is
completed in accordance with current cough manage-ment guidelines [13,19]. Assessment items include, butare not limited to; cough persistence, frequency andtype, physical examination for chest wall deformity andclubbing, chest sound auscultation, spirometry (whereage appropriate) and a repeat bilateral anterior nasalswab. Other investigations such as chest imaging (x-rayor cHRCT), immunological work-up, sweat chloridetesting and bronchoscopy are performed as clinically in-dicated. Study participation for these children ends onceall relevant investigations are complete and an appropri-ate management or treatment plan is in place.
Laboratory methodsBilateral anterior nasal swabs will be stored at −80°Cwithin 24 hours of collection and transferred to theQueensland Paediatric Infectious Diseases Laboratory,Royal Children’s Hospital, Brisbane, for viral and bacte-rial identification by polymerase chain reaction (PCR)testing.Bacterial PCR testing will include M. pneumonia, S.
pneumoniae, nontypeable Haemophilus influenza andM. catarrhalis. A 16S signature sequence will be used todetect all strains of Chlamydiales as an initial screenbefore positive specimens are tested for specific C.trachomatis, C. pneumoniae and S. negevensis sequences.PCR testing will further detect 17 viruses associated with thehuman respiratory tract including; adenovirus, respiratorysyncytial virus, influenza virus types A & B, parainfluenzavirus types 1–3, human metapneumovirus, human rhinovi-ruses, human coronaviruses (OC43, 229E, NL63 + HKU1),human bocavirus and human polyomaviruses KI and WUas per published methods [26-30]. Should more than onerespiratory viral or bacterial pathogen simultaneously appear
Table 1 Outline of study procedures and data collected
Day0
Day7
Day14
Day21
Day28
Specialistreview
Screening X
Assess eligibility criteria X
Informed consent X
Demographic data X
Epidemiological data X
Risk factor data X
Cough score, type andpersistence data
X X X X X X
Healthcare utilisationdata
X X X X X X
Medication use data X X X X X X
Parent and childabsenteeism
X X X X X X
Nasal swab X X
Clinical treatment data X X
Clinical investigations X X
Specialist reviewmanagement plan
X
Specialist reviewoutcomes
X
Drescher et al. BMC Pediatrics 2013, 13:125 Page 5 of 9http://www.biomedcentral.com/1471-2431/13/125

in respiratory specimens, quantification of individual nu-cleic acids may help identify the dominant agent withinthese classes of pathogens by comparing cycle threshold(Ct) values [31]. The dominant pathogen in each sample isidentified as that with a Ct-value at least 3 cycles lower thanthe Ct-values for any other respiratory pathogen [31].
Data handling and storageData collected over the study duration are recorded in apaper based case report form and later entered into apassword protected FileMaker Pro Advanced V12(FileMaker Inc, Santa Clara, California) database. Copiesof source documents, such as investigation results, arefiled in the participants individual study folder and en-tered into the electronic database. At participant com-pletion a file audit is completed in which paper basedand electronic records are checked for consistency, com-pleteness and accuracy of data. Data query forms arecompleted for any discrepancies and returned to the ap-propriate study staff for correction. Following this thechief investigator reviews all participant files and ap-proves them for signoff and storage. All study folders arestored in a locked secure cabinet. Access to identifiableparticipant information is only provided to immediatestudy staff unless otherwise required by legislative orregulatory agencies.
Sample sizeThe RCH ED has an average of 343 presentations permonth for respiratory complaints of which 185 (54%)have cough recorded as a symptom (RCH, unpublishedED triage data, 2010). One hundred and forty eight(80%) of these presentations occur during study recruit-ment hours (6am to 9pm) (RCH, unpublished ED triagedata, 2010) and thus, assuming a 70% enrolment, pro-vides a potential sample of 1243 participants per year.As the prevalence of persistent cough amongst childrenwith ARI is unknown, an estimated prevalence of 50%was used for sample size calculation to produce thehighest estimate. To address the primary objective anddetect a prevalence of 50% per year (α=0.05 and 95%confidence interval) assuming a 30% loss-to-follow-up,an annual minimum of 500 children with complete dataat day 28 is required. Bi-monthly reviews are completedto evaluate recruitment progression and interventionsimplemented where required.
Data analysisDescriptive analyses including demographic, clinical, la-boratory and risk factor data will be tabulated andexpressed as proportions and/or means of the selectedcharacteristics with the corresponding 95% confidence in-tervals. Where continuous data are not normally distrib-uted, medians with accompanying interquartile ranges will
be presented. The primary analysis will be the proportionof children with persistent cough at day 28(±3) post pres-entation to the ED with a respiratory illness. Differencesin demographic, clinical, laboratory and risk factor databetween children with and without cough at day 28(±3)will be assessed using two sided t-tests for the comparisonof means and chi-square tests for the comparison ofproportions. Where data are not normally distributednon-parametric methods, such as a Mann–Whitney Utest, will be used. Multivariate analyses, for example, ageneralised linear model with logit link, will be performedto evaluate variables independently associated withchronic cough at day 28(±3).Laboratory data arising from nasal swabs will be
analysed for each study time point (enrolment and specia-list review). Individual pathogens, their proportions andcorresponding 95% confidence intervals will be tabulatedand presented. These analyses will be conducted by indi-vidual pathogen and any pathogen overall and will ac-count for variation in bacterial and/or viral load, mode ofcollection (nasal swab or nasopharyngeal aspiration) andthe quality of specimen collection (as reported by thecollecting nurse). The association between bacterial andviral co-infection and chronic cough will be exploredthrough multiple regression models after adjusting forpotential confounders.
DiscussionThis study will be the first to comprehensively describe thenatural history, epidemiology, aetiology and outcomes ofchronic cough, during and after ARI in children. Ourprospective cohort study design in conjunction with acomprehensive clinical, epidemiological and microbio-logical approach will enable the collection of data that willaddress issues at both the time of presentation and duringthe recovery phase. Results will be published in nationaland international peer-reviewed journals and where appro-priate presented at relevant conferences. We believe thedissemination of our results will contribute to futureresearch aiming to develop and/or review new and existingevidence-based paediatric cough management guidelines.
Rationale for study endpointsThere are limited studies that have evaluated the pro-gression to chronic cough post ARI and none that havedifferentiated between wet and dry cough. Similarlythere are limited data from select populations on thepredictors of, and microorganisms associated with,chronic cough post ARI. The definition of chronic coughused here is a cough lasting >4 weeks. This definition isconsistent with both prior research [8,14,15] and theAmerican College of Chest Physicians guidelines forevaluating cough in children [19]. A break in cough ofgreater than 3 consecutive days was incorporated into
Drescher et al. BMC Pediatrics 2013, 13:125 Page 6 of 9http://www.biomedcentral.com/1471-2431/13/125

our definition to ensure that children who recover butsubsequently become unwell with a second cough illnessare not misclassified as having chronic cough. The con-tinued participation of children until day 28 regardlessof cough persistence will elicit data on the frequency ofcough reoccurrence post ARI recovery and allows amore comprehensive comparison of children who doand do not continue to cough during the follow-upperiod.Furthermore, ARIs in children are commonly the result
of bacterial and viral infections. However, very few chil-dren presenting to the ED (or primary care settings) withARI undergo bacterial and viral testing. The collection ofbilateral anterior nasal swabs on all study children willidentify viral and bacterial pathogens associated with ARIand cough at both the time of ED presentation and spe-cialist review. An extended panel of known respiratorypathogens (previously discussed) was chosen to ensurethat pathogens excluded from routine respiratory PCRtesting in the ED were included for analysis and contributeto the literature on pathogens for which the associationbetween nasal detection and clinical illness is still beingexplored (e.g. polyomaviruses) [32]. Using an extendedpanel also enhances our ability to explore viral and bacter-ial interactions and their effects on cough outcomes.
LimitationsSelection biasGiven funding, feasibility and logistic constraints onlychildren present at the RCH between the hours of 6am to9pm will be approached for participation. Children andtheir families attending the ED outside of these hours maydiffer from those attending during these hours. De-identified demographic and ED triage data will be collatedand analysed to assess the extent to which children whowere potentially eligible but not enrolled may bias thestudy findings. Furthermore, a difference may existbetween families who seek care through the ED and thosewho attend primary care facilities.Given that families may attend multiple healthcare facil-
ities for management of the same illness, that many familiesseen in the ED are referred from other healthcare settingsand that EDs are commonly used as a substitute for pri-mary care services [33-35], the effects of restricting recruit-ment to a tertiary ED on the results are likely to be limited.Collection of illness severity, symptom, ED triage and priorhealthcare utilisation data at enrolment will enable assess-ment and description of how our results may be biased.Furthermore, as recruitment is restricted to one tertiarypaediatric ED in Brisbane, Queensland, Australia, the re-sults are likely to be more representative of children livingin urban communities and developed countries with tem-perate climates.
It is also plausible that parents of children with recur-rent cough are more likely to enrol and complete thestudy, potentially overestimating the prevalence of chroniccough at day 28. Additionally, it is possible that childrenwith existing undiagnosed chronic lung disease may beenrolled in the study also inflating the prevalence ofchronic cough. Data pertaining to the child’s past respira-tory health in conjunction with a comprehensive assess-ment of children with persistent cough at specialist reviewwill allow assessment of this potential bias. It is possiblethese children will be amongst those referred for respira-tory physician review and the identification of these chil-dren will be an important study outcome.There is also the potential of bias derived from loss-to-
follow-up, particularly as those who complete the studymay differ from those who do not. Demographical, epi-demiological, risk factor and clinical data collected at en-rolment in combination with weekly cough persistencedata will permit sensitivity analyses to assess the impact ofthis bias on study outcomes.
Measurement biasParent proxy reporting via a diary card using a VCD scoreis the chosen method for obtaining cough persistence dataover the follow-up period. Although it is possible to col-lect the same data using objective measures, for examplethrough use of ambulatory cough meters, they are notfeasible as analysis is resource heavy. Furthermore, giventhe intended size of our cohort it was not feasible in termsof cost or practicality. Chang et al. [25], report that VCDdiary cards have the highest correlation to cough fre-quency when measured objectively and hence, can be usedin the absence of practical objective measures to evaluatecough severity and persistence.Parental report is also used to determine cough type over
the follow-up time period. It is possible that some mis-classification will occur, although this is likely to be limited.Chang et al. [36], found that parental assessment ofcough type had excellent agreement with that of clini-cians (K= 0.75, 95% CI: 0.58-0.93) and that clinicians'assessments were only marginally better than that of par-ents when compared to bronchoscopic findings. At special-ist review (where required), both the parent and treatingphysician report on cough type allowing for the assessmentof inter-rater reliability and the potential for derived bias.Furthermore, on any given day in the ED there are nu-
merous different clinicians with differing levels of ex-pertise and experience. Consequently, diagnosis, clinicalinvestigations performed and treatment initiated mayvary significantly across physicians. The collection of de-tailed symptom, treatment and clinical data, as well asthe collection of study specific anterior nasal swabs willminimise the effect of any potential bias by reducingdependence on clinician directed data. Furthermore,
Drescher et al. BMC Pediatrics 2013, 13:125 Page 7 of 9http://www.biomedcentral.com/1471-2431/13/125

through employing a small team of study specific re-spiratory specialists from the same centre, the potentialfor bias derived from inconsistency of diagnosis at thetime of specialist review will be minimised.
ConclusionChronic cough is an under-recognised and inadequatelyresearched cause of morbidity and decreased quality of lifein children. This study will describe the natural history,epidemiology, aetiology and outcomes of chronic cough inchildren presenting to a tertiary paediatric ED. Our resultswill inform studies for evidence-based guidelines to im-prove the early detection, prevention and management ofchronic cough in children during and after ARI.
Additional file
Additional file 1: ED Cough Study Case Report Form.
AbbreviationsARI: Acute respiratory illness; cHRCT: Chest high resolution computerisedtomography; Ct: Cycle threshold; CSLD: Chronic suppurative lung disease;ED: Emergency department; NHMRC: National Health and Medical ResearchCouncil; PBB: Protracted bacterial bronchitis; PCR: Polymerase chain reaction;PERU: Paediatric Emergency Research Unit; RCH: Royal Children’s Hospital,Brisbane, Australia; VCD: Verbal category descriptive.
Competing interestsThe authors declare they have no competing interests.
Authors’ contributionsKFO and ABC conceptualised the study. All authors contributed to protocoldevelopment. ABC and JM contributed respiratory specialist advice. NP andJA contributed emergency specialist advice. TS contributed specialistmicrobiological advice. MD provides statistical support for the study.KFO and BJD oversee the everyday functioning of the study with supportfrom ABC, JM, NP, JA and TS. BJD drafted the manuscript. All authorsreviewed and approved the final manuscript.
AcknowledgementsThe authors would like to thank the following for their support with studyimplementation and recruitment: Mary Lang, Petrina Hetherington, EmilyCasey, Meegan Price, Becky Saul and Jane O’Shea from the RCH PaediatricEmergency Research Unit; Sheree Rablin, Kerry Hall and Ben Arnold from theQueensland Children’s Medical Research Institute Respiratory infectionOutreach and Research team, and; Jayne Gaydon and David Whiley from theQueensland Paediatric Infectious Diseases Laboratory. Professor KeithGrimwood from QCMRI has also provided ongoing support and guidancefor the study. Finally, we thank the Queensland Children’s Health Foundationfor funding this project.
Funding sourcesFunding for the study has been provided through a Queensland Children’sHealth Foundation, Program Grant awarded to investigators ABC and JA. BJDis funded by a University of Queensland Postgraduate Research Scholarshipand QCMRI. KFO is supported by a Queensland Government Smart FuturesFellowship (51008) and a NHMRC Career Development Award (1045157).ABC is supported by a NHMRC Practitioner Fellowship (545216).
Author details1Queensland Children’s Medical Research Institute, The University ofQueensland, Level 4, Foundation Building, Royal Children’s Hospital, HerstonRoad, Brisbane, Herston QLD 4029, Australia. 2Queensland Children’s MedicalResearch Institute, Queensland University of Technology, Level 4, FoundationBuilding, Royal Children’s Hospital, Herston Road, Brisbane, Herston QLD
4029, Australia. 3Queensland Children’s Respiratory Centre, QueenslandChildren’s Health Services, Royal Children’s Hospital, Herston Road, Brisbane,Herston QLD 4029, Australia. 4Menzies School of Health Research, CharlesDarwin University, Rocklands Drive, Darwin, Tiwi NT 0811, Australia.5Department of Emergency Medicine, Queensland Children’s Health Services,Royal Children’s Hospital, Herston Road, Brisbane, Herston QLD 4029,Australia. 6Sir Albert Sakzewski Virus Research Centre, Queensland PaediatricInfectious Diseases Laboratory, Royal Children’s Hospital, Herston Road,Brisbane, Herston QLD 4029, Australia.
Received: 14 November 2012 Accepted: 9 July 2013Published: 15 August 2013
References1. Mulholland K: Global burden of acute respiratory infections in children:
Implications for interventions. Pediatr Pulmonol 2003, 36(6):469–474.2. Nair H, Brooks WA, Katz M, Roca A, Berkley JA, Madhi SA, Simmerman JM,
Gordon A, Sato M, Howie S, et al: Global burden of respiratory infectionsdue to seasonal influenza in young children: a systematic review andmeta-analysis. Lancet 2011, 378(9807):1917–1930.
3. Williams BG, Gouws E, Boschi-Pinto C, Bryce J, Dye C: Estimates ofworld-wide distribution of child deaths from acute respiratory infections.Lancet Infect Dis 2002, 2(1):25–32.
4. Britt H, Miller GC, Charles J, Henderson J, Bayram C, Pan Y, Valenti L,Harrison C, O’Halloran J, Fahridin S: General practice activity in Australia2009–10. General Practice Series no. 27. AIHW: Canberra; 2010.
5. Nawar EW, Niska RW, Xu J: National Hospital Ambulatory Medical CareSurvey: 2005 emergency department summary. Adv Data 2007, 29(386):1–32.
6. Whitburn S, Costelloe C, Montgomery AA, Redmond NM, Fletcher M,Peters TJ, Hay AD: The frequency distribution of presenting symptoms inchildren aged six months to six years to primary care. Prim Health CareRes Dev 2011, 12(2):123–134.
7. Strippoli MP, Silverman M, Michel G, Kuehni CE: A parent-completedrespiratory questionnaire for 1-year-old children: repeatability. Arch DisChild 2007, 92(10):861–865.
8. Chang A: Cough: are children really different to adults? Cough 2005, 1(1):7.9. Marchant JM, Newcombe PA, Juniper EF, Sheffield JK, Stathis SL, Chang AB:
What is the burden of chronic cough for families? Chest 2008, 134(2):303–309.10. Chang AB, Landau LI, Van Asperen PP, Glasgow NJ, Robertson CF,
Marchant JM, Mellis CM: Cough in children: definitions and clinicalevaluation. Med J Aust 2006, 184(8):398–403.
11. Chang AB, Redding GJ, Everard ML: Chronic wet cough: protractedbronchitis, chronic suppurative lung disease and bronchiectasis. PediatrPulmonol 2008, 43(6):519–531.
12. King PT, Holdsworth SR, Farmer M, Freezer N, Villanueva E, Holmes PW:Phenotypes of adult bronchiectasis: onset of productive cough inchildhood and adulthood. COPD 2009, 6(2):130–136.
13. Chang AB, Bell SC, Byrnes CA, Grimwood K, Holmes PW, King PT, Kolbe J,Landau LI, Maguire GP, McDonald MI, et al: Chronic suppurative lungdisease and bronchiectasis in children and adults in Australia and NewZealand. Med J Aust 2010, 193(6):356–365.
14. Hay AD, Wilson A, Fahey T, Peters TJ: The duration of acute cough inpre-school children presenting to primary care: a prospective cohortstudy. Fam Pract 2003, 20(6):696–705.
15. Hay AD, Wilson AD: The natural history of acute cough in children aged 0to 4 years in primary care: a systematic review. Br J Gen Pract 2002,52(478):401–409.
16. Trenholme AA, Byrnes CA, McBride C, Lennon DR, Chan-Mow F, Vogel AM,Stewart JM, Percival T: Respiratory health outcomes 1 year afteradmission with severe lower respiratory tract infection. PediatrPulmonol2012. Epub ahead of print. Retrieved from: http://www.ncbi.nlm.nih.gov/pubmed/22997178.
17. Thomson F, Masters IB, Chang AB: Persistent cough in children and theoveruse of medications. J Paediatr Child Health 2002, 38(6):578–581.
18. Faniran AO, Peat JK, Woolcock AJ: Persistent cough: is it asthma? Arch DisChild 1998, 79(5):411–414.
19. Chang AB, Glomb WB: Guidelines for evaluating chronic cough inpediatrics: ACCP evidence-based clinical practice guidelines. Chest 2006,129(1 Suppl):260S–283S.
20. Keeley D: Cough in children: new guidelines from the British ThoracicSociety. Postgrad Med J 2008, 84(995):449.
Drescher et al. BMC Pediatrics 2013, 13:125 Page 8 of 9http://www.biomedcentral.com/1471-2431/13/125

21. Liberman DB, Shelef DQ, He J, McCarter R, Teach SJ: Low rates of follow-upwith primary care providers after pediatric emergency department visitsfor respiratory tract illnesses. Pediatr Emerg Care 2012, 28(10):956–961.
22. International Conference on Harmonisation: Guidelines for Good ClinicalPractice. International Conference on Harmonisation 1996. Date accessed:10 May 2013, http://www.ich.org/fileadmin/Public_Web_Site/ICH_Products/Guidelines/Efficacy/E6_R1/Step4/E6_R1__Guideline.pdf.
23. National Health and Medical Research Council: National Statement on EthicalConduct in Human Research 2007 (Updated 2009). Canberra: AustralianGovernmen; 2009.
24. World Medical Association: WMA Declaration of Helsinki - Ethical Principles forMedical Research Involving Human Subjects. Korea: 59th WMA GeneralAssembly, Seoul; 2008. Data accessed: 10 May 2013, http://www.wma.net/en/30publications/10policies/b3/.
25. Chang AB, Newman RG, Carlin JB, Phelan PD, Robertson CF: Subjectivescoring of cough in children: parent-completed vs child-completed diarycards vs an objective method. Eur Resp J 1998, 11(2):462–466.
26. Binks MJ, Cheng AC, Smith-Vaughan H, Sloots T, Nissen M, Whiley D,McDonnell J, Leach AJ: Viral-bacterial co-infection in AustralianIndigenous children with acute otitis media. BMC Infect Dis 2011, 11:161.
27. Greiner O, Day PJ, Altwegg M, Nadal D: Quantitative detection ofMoraxella catarrhalis in nasopharyngeal secretions by real-time PCR.J Clin Microbiol 2003, 41(4):1386–1390.
28. Greiner O, Day PJ, Bosshard PP, Imeri F, Altwegg M, Nadal D: Quantitativedetection of Streptococcus pneumoniae in nasopharyngeal secretionsby real-time PCR. J Clin Microbiol 2001, 39(9):3129–3134.
29. Kilic A, Muldrew KL, Tang YW, Basustaoglu AC: Triplex real-timepolymerase chain reaction assay for simultaneous detection ofStaphylococcus aureus and coagulase-negative staphylococci anddetermination of methicillin resistance directly from positive bloodculture bottles. Diagn Microbiol Infect Dis 2010, 66(4):349–355.
30. Loens K, Beck T, Ursi D, Pattyn S, Goossens H, Ieven M: Two qualitycontrol exercises involving nucleic acid amplification methods fordetection of Mycoplasma pneumoniae and Chlamydophilapneumoniae and carried out 2 years apart (in 2002 and 2004). J ClinMicrobiol 2006, 44(3):899–908.
31. O'Grady KA, Torzillo PJ, Rockett RJ, Whiley DM, Nissen MD, Sloots TP,Lambert SB: Successful application of a simple specimen transportmethod for the conduct of respiratory virus surveillance in remoteIndigenous communities in Australia. TM & IH 2011, 16(6):766–772.
32. Sloots TP, Whiley DM, Lambert SB, Nissen MD: Emerging respiratoryagents: New viruses for old diseases? J Clin Virol 2008, 42(3):233–243.
33. Afilalo J, Marinovich A, Afilalo M, Colacone A, Leger R, Unger B, Giguere C:Nonurgent emergency department patient characteristics and barriersto primary care. Acad Emerg Med 2004, 11(12):1302–1310.
34. Beattie TF, Gorman DR, Walker JJ: The association between deprivation levels,attendance rate and triage category of children attending a children'saccident and emergency department. Emerg Med J 2001, 18(2):110–111.
35. Hendry SJ, Beattie TF, Heaney D: Minor illness and injury: factorsinfluencing attendance at a paediatric accident and emergencydepartment. Arch Dis Child 2005, 90(6):629–633.
36. Chang AB, Gaffney JT, Eastburn MM, Faoagali J, Cox NC, Masters IB: Coughquality in children: a comparison of subjective vs. bronchoscopicfindings. Respir Res 2005, 6:3.
doi:10.1186/1471-2431-13-125Cite this article as: Drescher et al.: The development of chronic cough inchildren following presentation to a tertiary paediatric emergencydepartment with acute respiratory illness: study protocol for aprospective cohort study. BMC Pediatrics 2013 13:125.
Submit your next manuscript to BioMed Centraland take full advantage of:
• Convenient online submission
• Thorough peer review
• No space constraints or color figure charges
• Immediate publication on acceptance
• Inclusion in PubMed, CAS, Scopus and Google Scholar
• Research which is freely available for redistribution
Submit your manuscript at www.biomedcentral.com/submit
Drescher et al. BMC Pediatrics 2013, 13:125 Page 9 of 9http://www.biomedcentral.com/1471-2431/13/125

290 Appendices
Appendix C: Published study protocol for the Researching Intervention in Chronic
Cough in Kids (RICCi) study

Effectiveness of a cough managementalgorithm at the transitional phasefrom acute to chronic cough inAustralian children aged <15 years:protocol for a randomised controlledtrial
Kerry-Ann F O’Grady,1 Keith Grimwood,2 Maree Toombs,3,4,5 Theo P Sloots,6,7
Michael Otim,8 David Whiley,7 Jennie Anderson,9 Sheree Rablin,1 Paul J Torzillo,10
Helen Buntain,11 Anne Connor,12 Don Adsett,13 Oon Meng kar,13
Anne B Chang1,5,14
To cite: O’Grady KF,Grimwood K, Toombs M,et al. Effectiveness of acough managementalgorithm at the transitionalphase from acute to chroniccough in Australian childrenaged <15 years: protocol fora randomised controlled trial.BMJ Open 2017;7:e013796.doi:10.1136/bmjopen-2016-013796
▸ Prepublication history forthis paper is available online.To view these files pleasevisit the journal online(http://dx.doi.org/10.1136/bmjopen-2016-013796).
Received 9 August 2016Revised 2 November 2016Accepted 30 January 2017
For numbered affiliations seeend of article.
Correspondence toDr Kerry-Ann F O’Grady;[email protected]
ABSTRACTIntroduction: Acute respiratory infections (ARIs) areleading causes of hospitalisation in Australian childrenand, if recurrent, are associated with increased risk ofchronic pulmonary disorders later in life. Chronic(>4 weeks) cough in children following ARI isassociated with decreased quality-of-life scores andincreased health and societal economic costs. We willdetermine whether a validated evidence-based coughalgorithm, initiated when chronic cough is firstdiagnosed after presentation with ARI, improves clinicaloutcomes in children compared with usual care.Methods and analysis: A multicentre, parallel group,open-label, randomised controlled trial, nested within aprospective cohort study in Southeast Queensland,Australia, is underway. 750 children aged <15 years will beenrolled and followed weekly for 8 weeks after presentingwith an ARI with cough. 214 children from this cohortwith persistent cough at day 28 will be randomised toeither early initiation of a cough management algorithm orusual care (107 per group). Randomisation is stratified byreason for presentation, site and total cough duration atday 28 (<6 and ≥6 weeks). Demographic details, riskfactors, clinical histories, examination findings, cost-of-illness data, an anterior nasal swab and parent and childexhaled carbon monoxide levels (when age appropriate)are collected at enrolment. Weekly contacts will collectcough status and cost-of-illness data. Additional nasalswabs are collected at days 28 and 56. The primaryoutcome is time-to-cough resolution. Secondaryoutcomes include direct and indirect costs of illness andthe predictors of chronic cough postpresentation.Ethics and dissemination: The Children’s HealthQueensland (HREC/15/QRCH/15) and the QueenslandUniversity of Technology University (1500000132)Research Ethics Committees have approved the study. Thestudy will inform best-practice management of cough inchildren.
Trial registration number: ACTRN12615000132549.
INTRODUCTIONCough in children is one of the mostcommon reasons for medical encounters inAustralia1 and internationally.2 In the UK,30% of hospital paediatric medical encoun-ters (including emergency department (ED)visits) are due to respiratory illnesses, withcough as a symptom accounting for over 8%of all presentations.3 Cough in children ispresent in a broad range of respiratory ill-nesses ranging from mild, self-limiting rhin-itis to life-threatening acute and chronicpulmonary disorders.4 Furthermore, acuteillness may bring to medical attention for thefirst time those with chronic underlyingdisease. In the analyses of our recent cohortstudy of 817 children (96% non-Indigenous)aged <15 years presenting with cough to a
Strengths and limitations of this study
▪ Our study will be the first to assess the clinicaland economic impact of an early, evidence-based intervention in the transitional stage fromacute to chronic cough in children.
▪ Conducting the study in primary care facilitiesaddresses the predominant setting in whichacute respiratory illnesses are managed.
▪ A limitation of the study is its generalisability tochildren with acute respiratory illnesses in ruraland remote regions.
O’Grady KF, et al. BMJ Open 2017;7:e013796. doi:10.1136/bmjopen-2016-013796 1
Open Access ProtocolP
rotected by copyright. on S
eptember 16, 2019 at Q
ueensland University of T
echnology.http://bm
jopen.bmj.com
/B
MJ O
pen: first published as 10.1136/bmjopen-2016-013796 on 3 M
arch 2017. Dow
nloaded from

tertiary paediatric ED,5 20% (95% CI 17.2 to 22.7) devel-oped chronic (>4 weeks duration) cough after an acuterespiratory infection (ARI). Of those, 42% were diag-nosed at specialist review with protracted bacterial bron-chitis (PBB) and 32% were found to have a previouslyundiagnosed respiratory disorder, including asthma,large airway lesions (such as tracheomalacia), obstructivesleep apnoea and bronchiectasis (unpublished).Chronic cough in children is an under-recognised, but
important cause of morbidity and decreased quality oflife (QoL).6 Although an economic evaluation has neverbeen undertaken, chronic cough likely accounts for sub-stantial direct and indirect economic costs.7 AnAustralian study found that >80% of parents had soughtfive or more medical consultations for their child in the12 months immediately prior to referral to respiratoryspecialists for their child’s chronic cough.7 Nevertheless,there are few high-quality studies that address thenatural history of acute and chronic cough and nonecompleted that have a predominant focus on AustralianIndigenous children. Systematic reviews of the naturalhistory of acute cough in children in primary healthcarefound wide variation in the design and quality ofstudies.8 9 There was large variability in the duration ofillnesses evaluated, how outcomes were measured andcompleteness of follow-up. Importantly, in most studiesaddressing acute cough in children, validated outcomemeasures for cough were not used; those with prolongedcough were not reviewed and there was no differenti-ation between ‘wet’ and ‘dry’ types.9 Wet cough isimportant as it implies increased airway secretions andusually indicates clinically significant lower airway infec-tion and neutrophilic inflammation.10 11 For example,chronic wet cough is the most common symptom ofbronchiectasis12 and early diagnosis and treatmentimproves long-term outcomes.13 14
Indigenous people are at high risk of developingchronic pulmonary disorders. Indeed, in nationwidedata for Indigenous Australians, respiratory disordersare: (1) the most common reason for primary health-care encounters; (2) the second most prevalent self-reported chronic condition and (3) the second mostcommon cause for hospitalisation.15 Overall, 27% ofIndigenous people report some form of respiratorydisease; 19% in those aged <14 years and 38% in thoseaged >55 years. In remote Indigenous children, the ratesof hospitalisation for ARI and radiographically diag-nosed pneumonia,16 17 and the incidence of bronchiec-tasis,18 are among the highest reported worldwide.Recurrent ARI episodes are common17 and studies inIndigenous children from central and northernAustralia demonstrated associations between these infec-tions and subsequent diagnosis of bronchiectasis.19 20
To date, the focus on ARI has been largely on remoteIndigenous children, with limited community-based datafrom those living in urban settings. This is despite socio-economic and health indices being consistently lowerfor urban Indigenous populations compared with
non-Indigenous groups.15 The lack of data on urbanand rural Indigenous populations has been identified asa significant barrier to ‘Closing the Gap’ initiatives.21
Although over half of the Indigenous population live inurban and regional centres, most research addresses thehealth and social issues of remote communities and only11% of all articles about Indigenous health during a5-year period addressed urban populations.21 However,preliminary data from our ongoing cohort study of ARIin young urban Indigenous children22 suggest 20% willdevelop chronic cough post-ARI, principally from PBB.Early detection and appropriate management of the
underlying aetiology (eg, bronchiectasis) causingchronic cough in children is important as it results inimproved short23 and medium-term14 outcomes. Despitethe availability of evidence-based cough managementguidelines for children in several countries,24 25 includ-ing Australia,26 the uptake and impact of the guidelinesis largely unknown. So far, only one randomised con-trolled trial (RCT) has evaluated any of these guide-lines27 28 and economic evaluation was absent. This wasconducted in five Australian cities where 272 children(mean age 4.5 years, SD 3.7) newly referred to a paediat-ric respiratory physician were randomly allocated toeither early review and use of a cough algorithm orusual care until review and subsequent use of a prede-fined cough algorithm.27 28 The study28 found that chil-dren in the ‘early-arm’ group had significantly betterclinical outcomes (ie, cough resolution at week 6 postin-tervention; absolute risk reduction=24.7%, 95% CI 13%to 35%) and better cough-specific QoL compared withthe control group. However, in this study,28 the medianduration of cough at enrolment was 16 weeks (IQR 8–32), and investigating earlier intervention is warranted.Furthermore, the use of the cough algorithm in 346children found that ∼18% had a serious underlyingillness. Indigenous children (10/34; 29.4%) were morelikely to have bronchiectasis than non-Indigenous chil-dren (6.7%; 21/312; OR=5.78, 95% CI 2.15 to 14.5;p<0.001).29
Despite the high burden of ARI, there are little pub-lished data on interventions for acute and chroniccough, especially for urban and regional Indigenouschildren. An ARI sometimes unmasks a previously unrec-ognised chronic respiratory illness, which is a majorproblem in Indigenous Australians, but one that receiveslimited attention.30–32 Early diagnosis and managementof chronic respiratory illness in children reduces mor-bidity and improves QoL. This RCT will thereforeanswer the primary question: ‘Amongst children aged<15 years with chronic cough post-ARI, does active inter-vention at 4 weeks improve clinical outcomes?’
Study objectivesOur primary objective is to determine if children aged<15 years with chronic (>4 weeks) cough post-ARI andmanaged according to an evidence-based cough
2 O’Grady KF, et al. BMJ Open 2017;7:e013796. doi:10.1136/bmjopen-2016-013796
Open AccessP
rotected by copyright. on S
eptember 16, 2019 at Q
ueensland University of T
echnology.http://bm
jopen.bmj.com
/B
MJ O
pen: first published as 10.1136/bmjopen-2016-013796 on 3 M
arch 2017. Dow
nloaded from

algorithm have better clinical outcomes (faster coughresolution) than those receiving standard care.Our secondary objectives are to:1. Determine the cost-effectiveness of early intervention
in chronic cough following an ARI compared tostandard care.
2. Identify the microbiological predictors of chroniccough following an ARI.
3. Characterise the epidemiological, clinical, socio-economic and cultural predictors of chronic coughfollowing an ARI.
4. Establish the epidemiological, clinical, socioeconomicand cultural predictors of success or failure of anearly intervention in chronic cough following an ARI.Our study tests the primary hypothesis that among
children aged <15 years with chronic (>4 weeks) coughpost-ARI, initiation of a cough management algorithm atthe transition from acute to chronic cough will reducecough duration.
METHODS AND ANALYSISStudy designA nested, open-label RCT (with concealed allocation)within a prospective cohort study of children aged<15 years presenting to three primary healthcare serviceswith an ARI that includes cough as a symptom, and whoare followed for 56 days (figure 1).
EligibilityInclusion criteria are:▸ Aged <15 years,▸ At the time of attending the clinic, the child is identi-
fied as having a possible respiratory illness (includingthose reported to have fever or viral/bacterial illness)that has parent-reported cough as a symptom,
▸ Provision of written informed consent from the parent/guardian and assent from children aged 12—<15 years,
▸ Siblings are permitted if each meets the abovecriteria.The exclusion criteria are: known diagnosis of an
underlying medical condition, including chronic pulmon-ary disorders (excluding asthma); immunosuppressiveillness, such as primary immunodeficiency, HIV infectionor receiving immunomodulating drugs (except short-course (<2 weeks) oral and ongoing maintenance inhaledcorticosteroids) in the 30 days prior to presentation;current or planned participation in another interventionstudy during the 8 weeks of follow-up; severe ARI requir-ing hospitalisation, and/or insufficient English inhibitingprovision of written informed consent or completion ofparticipant interviews.
RecruitmentEligible children are identified when presenting to oneof three primary healthcare centres in subtropical,Southeast Queensland, Australia, involving metropolitanBrisbane (population 2.2 million), the regional city ofToowoomba (110 000) and the rural town of Warwick(14 000). Parents and their child(ren) will be approachedby clinic personnel and informed consent/assentobtained using written and/or pictorial plain languagestatements.
Data collection, follow-up and interventionChildren enrolled in each of the three primary health-care centre cohorts undergo baseline clinical assess-ments that include demographic details, medical history,risk factors for ARI and cough, presenting features, vitalsigns, investigations, treatment and cost-of-illness data(figure 1). Weekly telephone and/or email and/orface-to-face contacts collect cough status, type (ie wet,dry variable) and cough score,33 medication (includingover-the-counter remedies) and health service provideruse for the cough and cost-of-illness data. Wet and drycough are classified as per parent/carer reports, which
Figure 1 Overview of study
design.
O’Grady KF, et al. BMJ Open 2017;7:e013796. doi:10.1136/bmjopen-2016-013796 3
Open AccessP
rotected by copyright. on S
eptember 16, 2019 at Q
ueensland University of T
echnology.http://bm
jopen.bmj.com
/B
MJ O
pen: first published as 10.1136/bmjopen-2016-013796 on 3 M
arch 2017. Dow
nloaded from

were found previously to be accurate (compared withrespiratory physician and bronchoscopy) in a study ofchildren with chronic cough.34 The cost-of-illness dataare collected at each parent/carer contact, specialistreview and from examining medical records. Aminimum of three contact attempts are made at eachweekly time-point. We did not employ daily diary cardsas planned originally, since although their use inchronic cough studies was reliable, we found that in chil-dren with acute cough diary completion and returnrates were low during preliminary work undertaken forthis study. We also could not use smartphone apps as theownership of smart phones in the target communities islow. Thus, instead we relied on weekly parent recall ofacute child illness, which has been shown to introduceminimal bias (<10%) in prevalence studies.35
At day 28, any child with persistent cough (ie, ≤3 daybreak in cough in the preceding 28 days) is randomised(1:1 allocation) to clinical review and initiation of thecough management algorithm or to continue weeklyfollow-up. All study participants continue weekly follow-upuntil day 56 and any child still coughing at that time pointundergoes clinical review until a definitive diagnosis isestablished or the child exits the protocol. The decision tofollow children until day 56 was based on data from ourED cough study, suggesting 42% of children with persist-ent cough at day 28 will be diagnosed with PBB (manu-script in preparation) that resolves with a 14-day course ofamoxycillin–clavulanic acid. Children requiring ongoingcare beyond two study physician reviews are referred to atertiary paediatric respiratory medicine service.
The study intervention involves study physician clinicalreview within 2 weeks of day 28 where the cough man-agement algorithm (figures 2 and 3) is implementeddepending on whether the child has a specific or non-specific cough. Children in whom the cough hasresolved spontaneously between randomisation andphysician review, and at that point are deemed by thestudy physician to require no further management, willnot contribute to the primary analysis.Children in the control group follow a standard care
pathway. This reflects what occurs normally in the com-munity for children with cough where the generalwaiting period for review by a paediatric respiratory phys-ician is on average 6 weeks following referral from afamily physician. The parents/guardians of children ran-domised to the control group are advised to continuefollow-up with instructions that they will be reviewed by astudy doctor following day 56 if they are still coughing.They are also counselled to seek advice from their familyphysician or other healthcare provider if their childbecomes unwell or they are worried, otherwise to con-tinue to self-manage their child’s cough as they see fit.
Randomisation, allocation and blindingAn independent biostatistician prepared the randomisa-tion code using a permuted blocking design (block sizeof 4) to maintain group balance. Randomisation wasstratified by reason for presentation (ARI with cough oranother reason with an ARI noted incidentally), site andcough duration at day 28 (<6 or ≥6 weeks). Group alloca-tion is concealed in opaque, consecutively numbered
Figure 2 Specific cough
pathway.
4 O’Grady KF, et al. BMJ Open 2017;7:e013796. doi:10.1136/bmjopen-2016-013796
Open AccessP
rotected by copyright. on S
eptember 16, 2019 at Q
ueensland University of T
echnology.http://bm
jopen.bmj.com
/B
MJ O
pen: first published as 10.1136/bmjopen-2016-013796 on 3 M
arch 2017. Dow
nloaded from

envelopes kept in a locked cabinet at the Centre forChildren’s Health Research, South Brisbane. At random-isation, the child’s cough history over the past 28 days andstudy-specific strata are confirmed by the CentralCoordinating Site. The Study Coordinator selects the nextconsecutively numbered, opaque, sealed envelope fromthe relevant strata pack, opens the envelope and extractsthe randomisation code. Two people check the allocationand the code is assigned to the participant. The StudyCoordinator then arranges for the study physician toreview within 2 weeks of randomisation those children allo-cated to the intervention arm. If siblings are also enrolledand each child is still coughing at day 28, randomisationoccurs for the first child enrolled (ie, earliest study
number) and all siblings are allocated subsequently to thesame arm. Differences in strata (eg presentation type andcough duration) will be accounted for in the analysis.Blinding is not undertaken in this study; however,
parents are not informed at enrolment that their childwill be randomised at day 28 to a specific intervention ifthe child has a persistent cough. Instead, they areinformed that children who develop persistent coughwill be reviewed by a paediatrician during the study withsome children being seen earlier and some later in the8-week follow-up period. Limited disclosure is permittedunder the Australian ethical standards for humanresearch36 if it is scientifically justifiable and does notpresent an increased risk of harm to the participant.
Figure 3 Non-specific cough
pathway.
O’Grady KF, et al. BMJ Open 2017;7:e013796. doi:10.1136/bmjopen-2016-013796 5
Open AccessP
rotected by copyright. on S
eptember 16, 2019 at Q
ueensland University of T
echnology.http://bm
jopen.bmj.com
/B
MJ O
pen: first published as 10.1136/bmjopen-2016-013796 on 3 M
arch 2017. Dow
nloaded from

DefinitionsDefinitions used for the clinical managementpathway23 27 are as follows:▸ Asthma: recurrent (>2) episodes of wheeze and/or
dyspnoea that responds (within minutes) to inhaledβ2 agonist or demonstrates bronchodilator responsive-ness documented on spirometry (≥12% change inthe percentage predicted forced expiratory volume in1 s after 400 µg of salbutamol).
▸ Cough resolution: improvement ≥75% or total reso-lution according to cough diary data for ≥3 consecu-tive days.37 38 When cough diary data are unavailable,resolution is defined as total cessation of coughaccording to parent/guardian verbal report.
▸ Chest radiograph abnormality: any abnormality (otherthan peribronchial thickening) identified by a paediat-ric respiratory physician or radiologist.
▸ Spirometry abnormality: as determined by theAmerican Thoracic Society and European RespiratorySociety criteria with Australian predicted values used.39
▸ Primary diagnosis of cough aetiology: diagnosis con-firmed by subsequent specific treatment that resultedin cough resolution within 3 weeks.26 37 The diagnos-tic criteria are defined a priori following publishedguidelines:6
– PBB: presence of an isolated chronic wet or pro-ductive cough, without signs of another cause andwhich responds to at least a 2 weeks course of anappropriate antibiotic, such asamoxicillin-clavulanate.
– Recurrent PBB: ≥3 episodes over a 12-monthperiod.
– Reversible airway obstruction: in accordance withAmerican Thoracic Society and EuropeanRespiratory Society criteria and adopting Australianpredicted values.39
Secondary diagnosis: diagnosis found on objective tests,but where: (1) specific treatment did not lead to reso-lution or improvement in the cough; or (2) no treat-ment for this diagnosis was trialled and the cougheither resolved spontaneously or with other therapies.6
Specific cough pointers: presence of any of the follow-ing: auscultatory abnormality (wheezes, crackles ordifferential breath sounds), classical cough character-istics, cardiac abnormalities, chest pain, chest walldeformity, daily moist or productive cough for>3 months, digital clubbing, dyspnoea (exertional or atrest), failure to thrive, feeding difficulties (includingchoking/vomiting), haemoptysis, immune deficiency,neuro-developmental abnormality, recurrent pneumoniaand wheeze. These pointers are explained in theThoracic Society of Australia and New Zealand positionstatement.37
Tertiary hospital management: that usually requiresinvestigations to be conducted at a paediatric tertiarycentre (eg, flexible bronchoscopy with bronchoalveolarlavage, chest high-resolution CT scan, fluoroscopicswallow screening, etc).
Specimen collectionAt recruitment, exhaled carbon monoxide (eCO) mea-sures from the child (if aged ≥ 3 years and can providean adequate sample) and parent/guardian are collectedto provide an objective, non-invasive assessment of cigar-ette smoking status and exposure40 using a portableeCO monitor (Smokerlyzer, Bedfont Scientific,England).All children have bilateral anterior nasal swabs col-
lected at enrolment and at days 28 and 56. Anteriornasal swabs rather than nasopharyngeal swabs are beingused as: (1) they are more acceptable to children; (2) inour experience have comparable sensitivity to nasopha-ryngeal specimens41 and, besides, any loss in sensitivity isconsidered acceptable when the purpose of the speci-men is epidemiological rather than for a clinical diagno-sis42 and (3) they permit more extensive swabbing of thenares. Nasal swabs are collected using Virocult plaincotton tip swabs with viral transport medium (Virocult,MW951, Medical Wire and Equipment, England)inserted 1 cm into the nostril and rotated four times onthe right side and then on the left side. Swabs are storedlocally in −20°C freezers before being transported to theresearch laboratory where they are stored at −80°C untilprocessing occurs.
Laboratory methodsSwabs are batch-tested for respiratory viruses and bac-teria using validated real-time PCR assays described pre-viously.42 43 Virus testing includes rhinoviruses, adenovirus,respiratory syncytial virus, influenza virus types A and B,parainfluenza virus types 1–3, human metapneumovirus,human coronaviruses (OC43, 229E, NL63, HKU1), humanbocavirus and human polyomaviruses KI and WU. Bacterialtesting includes Bordetella pertussis, Mycoplasma pneumoniae,Streptococcus pneumoniae, Staphylococcus aureus, Haemophilusinfluenzae (including differentiating between encapsulatedand non-encapsulated strains and Haemophilus haemolyticus)and Moraxella catarrhalis.
End pointsParticipation is completed 56 days (+3 days) followingenrolment or, for children in the RCT, when a final diag-nosis is determined by the study physician. Other exitpoints are serious protocol violations and worsening ofthe child’s condition that requires hospitalisation orother active intervention elsewhere. Children meetingthe exit criteria will continue to be followed until theend of the study period.
Outcome measuresPrimary clinical outcome: Time-to-cough resolution in days.Secondary cost-effectiveness outcomes: Total direct and indir-ect costs of illness calculated according to the criteriaoutlined in table 1.Secondary microbiological outcomes: Anterior nasal detectionby PCR of respiratory viruses and bacteria at days 28and 56.
6 O’Grady KF, et al. BMJ Open 2017;7:e013796. doi:10.1136/bmjopen-2016-013796
Open AccessP
rotected by copyright. on S
eptember 16, 2019 at Q
ueensland University of T
echnology.http://bm
jopen.bmj.com
/B
MJ O
pen: first published as 10.1136/bmjopen-2016-013796 on 3 M
arch 2017. Dow
nloaded from

Sample sizeSample sizes for each of the primary healthcare cohortscomprising this study are based on the expectednumber of eligible children with ARI presenting to eachof these services over the study’s timeframe and derivedfrom our current studies of chronic cough post-ARI inchildren.22 52 Between July 2015 and June 2017, weanticipate 750 eligible children will present to theprimary healthcare services participating in this study.Our preliminary data from a cohort study of
Indigenous children aged <5 years22 suggest 20% ofIndigenous children with an ARI will have chroniccough at day 28. Based on data from the first study ofthe algorithm28 for the primary end point of cough reso-lution at day 56, we anticipate a 54% reduction in theproportion of children (54.3% in the early arm com-pared with 29.5% in the delayed arm) with persistentcough at day 56. Hence, 89 children per group withcomplete evaluable data at day 56 will provide 90%power (α=0.05), to detect this 54% reduction for ourprimary aim. Assuming a 20% loss to follow-up andspontaneous resolution of cough of between randomisa-tion and physician review of 5%, we will therefore ran-domise a minimum of 112 children per group at day 28across all 3 sites.Given that the entire cohort study will have a 2-year
recruitment period, and the natural history and
predictors of chronic cough and cost-effectiveness of theintervention are important secondary outcomes, we willnot limit recruitment to the RCT arm once 224 childrenhave been randomised. Ongoing enrolment will henceincrease study power to address the primary and second-ary objectives. This approach has approval from the allrelevant human research ethics committees (HREC).
Data managementData will be entered into a password-protected, custom-built, Filemaker Pro Advanced V.14 (Filemaker, SantaClara, USA) database. The database has been designedto incorporate automatic data checking including logicand inaccurate ranges and maintains a log of anychanges to the data. Data fields cannot be left blank andmissing data must be coded as such in the database. Aspecific data management protocol compliant with theQueensland University of Technology’s data manage-ment policies and principles is in place.
Statistical methodsData will be presented in accordance with the updatedCONSORT criteria.53 Demographic, clinical, economic,risk factor and microbiological data will be tabulated forthe study population overall, by centre and by random-isation group and expressed as proportions and/ormeans of the selected characteristics by study centre,
Table 1 Cost item, sector allocation and source of cost used in costing acute and chronic cough
Cost item Sector Source of cost to be applied
Healthcare service usage
▸ Includes costs for diagnostic tests and complementary/
alternative therapies
▸ Distinguishes between public and private, paid and
bulk-billed services
Family
Healthcare
Health
insurers
Manual of resource items and their
associated costs44
National Hospital Costs Data Collection45
Quarterly Gap Payment and Medical Benefits
Statistics46
Medicare Quarterly Statistics47
Medicare Benefits Schedule48
Expert panel or large online provider where
required
Medication usage
Includes over-the-counter and prescribed medications
Family
Healthcare
Pharmaceuticals Benefits Scheme (PBS)49
Online providers when not listed on PBS
Healthcare seeking travel costs
Includes ambulance and community transport services
Family Parental Report
Private Health Insurance Administration
Council50
Petrol: average unleaded retail price
Translink: average ticket prices
Time spent seeking healthcare
▸ Time off work with pay
▸ Time off work with pay lost
▸ Time off usual activity
Family
Employers
Parental report
Average weekly earnings, Australia51
Extra time spent caring for child
▸ Time off work with pay
▸ Time off work with pay lost
▸ Time off usual activity
Family
Employers
Parental report
Average weekly earnings, Australia51
Missed childcare/school Family Parental report
Missed planned activities
Child and others
Family Parental report
Costs will be applied following the completion of data collection ensuring up-to-date cost data.
O’Grady KF, et al. BMJ Open 2017;7:e013796. doi:10.1136/bmjopen-2016-013796 7
Open AccessP
rotected by copyright. on S
eptember 16, 2019 at Q
ueensland University of T
echnology.http://bm
jopen.bmj.com
/B
MJ O
pen: first published as 10.1136/bmjopen-2016-013796 on 3 M
arch 2017. Dow
nloaded from

and presence/absence of chronic cough at day 56 withthe corresponding 95% CI. Differences between groupswill be assessed using t-tests for comparisons of meansand χ2 test for comparisons of proportions, conditionalon test assumptions for each being satisfied. Non-normallydistributed data will be analysed with appropriatenon-parametric tests.
Primary objectiveIntention-to-treat analyses will be employed. Time-to-cough resolution will be compared between groupsusing the Cox proportional hazard methods, adjustingfor independent explanatory variables, subject to model-ling assumptions being met, particularly proportionalityof hazards. All analyses will be performed on the wholecohort and then additional analyses will be performedusing frailty models54 that account for the clusteringeffects of siblings and site of recruitment.
Economic objectivesCosting of the intervention will be performed accordingto established methods,55 56 including detailed subana-lyses of data that account for epidemiological, social,cultural, risk factor and microbiological variables.Cost-effectiveness analysis (CEA) will be modelled usingthe health sector perspective. Broader societal issuesusing data from the trial as described above and aug-mented by the evidence from the literature, especiallysystematic reviews, will also be taken into consideration.The CEA approach will involve: identification ofresources using the intervention pathway (activities,probabilities and unit costs); measurement of resourceuse/outcomes; and valuation of costs using unit costspublished in the literature and from the trial itself. Thetime horizon will be specified and current practice(standard care) will be the comparator; and future costsand benefits will be discounted at 3% to present values.Central to this analysis will be the modelling of uncer-tainty surrounding data quality and gaps using sensitivityanalyses, and extension of time horizon, using Treeagesoftware (Treeage Software, Williamstown, Massachusetts,USA). The key outcomes will be incremental cost-effectiveness, and cost-savings to the health system dueto the interventions.
Other objectivesMultivariable modelling will be employed to: (1) evalu-ate the microbiological predictors of chronic cough fol-lowing an ARI as determined at days 28, 42 and 56postenrolment; (2) evaluate the epidemiological, clin-ical, socioeconomic and cultural predictors of chroniccough at day 28 post-ARI; (3) evaluate the epidemio-logical, clinical, socioeconomic and cultural predictorsof success or failure of the intervention at day 56 and(4) to compare these predictors between the three studypopulations. Crude and adjusted relative risks and the
respective 95% CIs will be presented, with differencesconsidered statistically significant at p<0.05.Subgroup analyses will be performed for all primary
and secondary objectives to examine potential differ-ences by study-specific strata. Univariate and multivariateanalyses will be performed to evaluate variables inde-pendently associated with study end points and to assesspotential confounding factors in the association betweenvaccination and disease. Multiple imputation models willbe used to evaluate the effect of missing data. Additionalanalyses will be undertaken to assess the effect of multi-plicity in the assessment of microbial associations withcough outcomes.
Participant safetyParents/guardians of all participants will be informed ofany new information that arises during the study thatmay indicate potential harm to the child if he/she wereto continue in the study. Any trial-related adverse eventswill be documented and reported to the relevant HREC.Serious adverse events will be reported to the HRECwithin 24 hours of notification and will be followed untilresolution. A decision to withdraw the child following aserious adverse event will be made in consultation withthe HREC, investigating team and the child’s primaryphysician. If an adverse event is deemed related to studyprocedures, the child and his/her family will be eligiblefor compensation under the Clinical Trial Insurance pol-icies in place for the duration of the study. All partici-pant data will be kept confidential and stored securely inaccordance with Australian Privacy Laws. Identifyingdata will not be provided to any persons outside of thestudy team unless required by Australian law (eg, in theevent of the diagnosis of a notifiable disease). Publisheddata will be deidentified and presented in aggregateform.
Independent monitoring and quality controlIndependent study monitors have been engaged toundertake regular data quality audits, assess compliancewith Good Clinical Practice guidelines and ensure thatthe study is being conducted according to the studyprotocol and ethical approvals. Inbuilt data quality mon-itoring and generation of data queries are establishedwithin the trial database, with data queries sent to studysites weekly for resolution.
Protocol amendmentsAll protocol amendments will be submitted to the study’sHREC (see below) for approval prior to implementation.If any amendments have the potential to affect a family’swillingness to continue in the study, all participants willbe reconsented to the amended protocol.
Study statusRecruitment began in July 2015.
8 O’Grady KF, et al. BMJ Open 2017;7:e013796. doi:10.1136/bmjopen-2016-013796
Open AccessP
rotected by copyright. on S
eptember 16, 2019 at Q
ueensland University of T
echnology.http://bm
jopen.bmj.com
/B
MJ O
pen: first published as 10.1136/bmjopen-2016-013796 on 3 M
arch 2017. Dow
nloaded from

DISSEMINATIONParticipants will be provided with regular study progressreports and a written letter outlining the results of thestudy. The trial results, including any negative findings,will be published in open-access peer-reviewed journalsand presented at scientific conferences, paediatricsociety and general practitioner meetings and otherfora. The primary author of the main paper will be theprincipal investigator (KFO). The trial findings are likelyto be incorporated into clinical management guidelines.Study data will be held in metadata repositories until theyoungest child turns 25 years of age at the QueenslandUniversity of Technology. Deidentified study data will bemade available to external parties on request and, ifrelevant, with the appropriate HREC approvals.
DISCUSSIONChronic cough in children is a defining symptom ofseveral chronic pulmonary disorders worldwide.Preventing persistent cough in children may lead toimportant short and long-term health benefits. Our pro-posed intervention22 26 is similar to the existingAustralian guidelines,57 but also has some differencesthat were developed following the incorporation of newdata unavailable at the time the guidelines were pub-lished. The use of guidelines by clinicians depends onseveral factors, which include level of evidence, feasibil-ity, degree of implementation and inherent clinicianfactors.58 Using an algorithm facilitates clinical guidelineimplementation by clearly describing pathways of carebased on whether the child presents with a specific ornon-specific cough. While this study uses specific studyphysicians, the overall goal is widespread adoption ofthe guidelines and management algorithm in theprimary healthcare setting. Our extensive data collec-tion, including direct and indirect costs of illness andhealthcare provision, are important in achieving thisgoal. The study will also provide an avenue for assessingthe extent to which these guidelines are being used cur-rently in different clinical settings given. We will collectdata on any intervention a child may receive external toour study.Study site selection was based on several factors,
including existing relationships, feasibility and how theyincorporated geographically and demographically differ-ent Indigenous communities. Studies evaluating ARIand chronic cough have had differing study designs,objectives and end points between populations.Australian data suggest cough burden is independent ofage and aetiology, but dependent on clinical setting.29
In Australia, there are clear risk and burden distinctionsbetween children from urban and remote areas andbetween Indigenous and non-Indigenous children.59
Indigenous children in urban areas have received muchless attention than those in remote centres. Failure toaccount for these differences may lead to inappropriate
interventions or implementation of management guide-lines that may not be applicable across all settings.The economic data and analyses in this study will be
the first to describe the cost of ARI and its outcomes inIndigenous children in Australia, and one of the fewworldwide. Further, the CEA of the intervention willprovide data critical to clinical and public policy deci-sions with respect to incorporation of the interventioninto routine care at the primary and tertiary healthcarelevels. Such decisions will be enhanced by our incorpor-ation of direct and indirect costs to the family, the com-munity and the healthcare sector,60 particularly giventhe focus on resource allocation in Indigenous health inAustralia,61 and the different mechanisms for delivery ofprimary healthcare services compared with mainstreamAustralia.62
We have incorporated microbiological componentsinto the RCT as the role of infectious agents in the tran-sition from ARI to chronic wet cough remains largelyunknown. Whether persistent shedding, new acquisitionand/or virus–bacteria interactions are associated withthe development of chronic cough post-ARI is a clinicaland research gap needing to be addressed. A study of170 children aged 5–16 years presenting to their familyphysician with a cough lasting >14 days detected M. pneu-moniae and B. pertussis in 12.9% and 36.6%,respectively.63 Cough duration was shorter in M. pneumo-niae than B. pertussis cases and codetection with respira-tory viruses was not associated with cough duration.63
An important limitation of this study63 was that datawere not collected from the time of ARI onset. Otherstudies64 have also tested for bacteria and viruses innasopharyngeal specimens, but to date none have fol-lowed children from ARI onset and examined the associ-ation with developing chronic cough. In the analyses ofmicrobiological data collected in our study of childrenattending an ED with cough, M. cattarhalis detected byPCR in anterior nasal swabs collected at time presenta-tion was the only organism independently associatedwith persistent cough at 4 weeks after controlling forage, gender and the presence of any viruses.5 OurBrisbane-based lower airway studies of children withchronic cough from PBB found intense neutrophilicairway inflammation and evidence of innate immuneactivation, suggesting that PBB may follow a single ARIepisode with impaired pathogen clearance from theairways, either permanently or temporarily leading to acycle of chronic inflammation.65 Small case series fromthe late 1990s have reported chronic pulmonary seque-lae following influenza infection in young children66
and a relationship between adenovirus infection andbronchiectasis.67
The major threats to the validity of our proposal areloss to follow-up and potential for contamination of thecontrol group based on the type of standard care theymay receive. In our current ARI study in urbanIndigenous children, loss to follow-up at the 4-week timepoint post-ARI is 23%. Procedures to minimise this loss
O’Grady KF, et al. BMJ Open 2017;7:e013796. doi:10.1136/bmjopen-2016-013796 9
Open AccessP
rotected by copyright. on S
eptember 16, 2019 at Q
ueensland University of T
echnology.http://bm
jopen.bmj.com
/B
MJ O
pen: first published as 10.1136/bmjopen-2016-013796 on 3 M
arch 2017. Dow
nloaded from

include: home visiting by Indigenous research person-nel, regular text and email messaging, and personalletters to families. Analysis plans will include measures toaccount for missing data and sensitivity analyses to assessthe extent of bias.Although contamination of the control group is pos-
sible, based on a multicentre RCT conducted in fivemajor Australian cities,29 it is unlikely that a child instandard care will receive treatment similar to the inter-vention arm. In another of our studies,52 just 27% ofchildren sought further medical advice for cough in the4 weeks following presentation to an ED for an illnesswith cough as a symptom (unpublished data).Furthermore, of the 9.7% receiving antibiotics duringthis 4-week period,5 most were prescribed antibiotics atthe time of the original ED presentation. Hence, it isunlikely this will influence the validity of our RCT forseveral reasons: (1) We can assess any interventioneither group receives outside of the RCT since ourweekly follow-up data collection captures these events.(2) In the possible, but unlikely event of a change intreatment in the control group, the effect size of theintervention will be smaller requiring a larger samplesize. The a priori sample size is conservative with 90%power and a smaller effect size will still be detectablewithin the available study population (eg, a 35% differ-ence with power of 80% requires 114 per group). (3) Toensure robustness, an independent person will recalcu-late the sample size when 50% of children have com-pleted the RCT component.In summary, our RCT will be the first to examine the
impact of a cough management algorithm implementedat the transitional stage from acute to chronic cough inIndigenous children. Clinical effectiveness will be evalu-ated concurrently with detailed epidemiological, clinical,microbiological and economic determinants of ARI andcough persistence in this population. If successful, thestudy may provide the data necessary to facilitate theuptake and implementation of cough managementguidelines in the primary healthcare setting, potentiallyreducing the long-term burden of disease on the child,family, community and healthcare sector.
Author affiliations1Centre for Children’s Health Research, Institute of Health and BiomedicalInnovation, Queensland University of Technology, Brisbane, Queensland,Australia2Menzies Health Institute Queensland, Griffith University and Gold CoastHealth, Southport, Queensland, Australia3The University of Queensland Rural Clinical School, The University ofQueensland, Toowoomba, Queensland, Australia4Carbal Health Services, Toowoomba, Queensland, Australia5Menzies School of Health Research, Charles Darwin University, Casuarina,Northern Territory, Australia6Queensland Paediatric Infectious Diseases Laboratory, Children’s HealthQueensland, Brisbane, Queensland, Australia7Faculty of Medicine and Biomedical Sciences, The University of Queensland,Herston, Queensland, Australia8School of Public Health, Australian Catholic University, Sydney, New SouthWales, Australia
9Caboolture Community Medical, Caboolture, Queensland, Australia10School of Medicine, The University of Sydney, Newtown, New South Wales,Australia11Wesley Medical Centre, Brisbane, Queensland, Australia12Ferny Grove Chambers Medical Practice, Brisbane, Queensland, Australia13Department of Paediatrics, Toowoomba Hospital, Toowoomba, Queensland,Australia14Queensland Children’s Respiratory Centre, Lady Cilento Children’s Hospital,Brisbane, Queensland, Australia
Acknowledgements The authors thank those who have facilitated the study;Robert Ware for generating the randomisation sequences; Daniel Arnold fordatabase development and data management; the Boards and staff of MurriMedical and Carbal Health Services and the Respiratory infection Outreachand Research Team’s Indigenous Research Reference Group for their culturaloversight and support of the study. This project is conducted under theauspices of the NHMRC Centre for Research Excellence in Lung Health forAboriginal and Torres Strait Islander children (1040830).
Contributors KFO conceived the study, devised the study protocol andoversees study implementation nationally and was the primary author of themanuscript. KG contributed to study conception, the grant application andwill play a leading role in the interpretation of the microbiological data. MTcontributed to study conception, grant application, community consultationand implementation of the study. TPS and DW contributed to studyconception and the grant application and are responsible for themicrobiological components of the study and interpretation of thelaboratory data. MO contributed to study conception and the grantapplication and is responsible for the economic components of the study.SR is the National Study Coordinator with major input into datainstruments, standard operating procedures and GCP compliance. HB, AC,DA and OMk are responsible for the clinical implementation of theintervention and evaluation of study diagnostic outcomes. PJT contributedto study conception and will play a role in knowledge translation andimplementation of study findings into clinical guidelines. ABC played amajor role in study conception, grant application, protocol development andimplementation and helped draft the manuscript. All authors read andapproved the final manuscript.
Funding The study is funded by a 3-year Australian National Health andMedical Research Council (NHMRC) project grant (1080298). KFO issupported by an NHMRC Career Development Fellowship (1045157). ABC(grant 545216) is supported by an NHMRC practitioner fellowship.
Competing interests None declared.
Patient consent Obtained.
Ethics approval Queensland Children’s Health Services Human ResearchEthics Committee and the Queensland University of Technology UniversityResearch Ethics Committee.
Provenance and peer review Not commissioned; externally peer reviewed.
Open Access This is an Open Access article distributed in accordance withthe Creative Commons Attribution Non Commercial (CC BY-NC 4.0) license,which permits others to distribute, remix, adapt, build upon this work non-commercially, and license their derivative works on different terms, providedthe original work is properly cited and the use is non-commercial. See: http://creativecommons.org/licenses/by-nc/4.0/
REFERENCES1. Britt H, Miller GC, Charles J, et al. General practice activity in
Australia 2009–10. General Practice Series no. 27. Canberra: AIHW,2010.
2. Irwin RS, Gutterman DD. American College of Chest Physicians’cough guidelines. Lancet 2006;367:981.
3. Whitburn S, Costelloe C, Montgomery AA, et al. The frequencydistribution of presenting symptoms in children aged six months tosix years to primary care. Prim Health Care Res Dev2011;12:123–34.
4. Chang AB. Cough: are children really different to adults? Cough2005;1:7.
10 O’Grady KF, et al. BMJ Open 2017;7:e013796. doi:10.1136/bmjopen-2016-013796
Open AccessP
rotected by copyright. on S
eptember 16, 2019 at Q
ueensland University of T
echnology.http://bm
jopen.bmj.com
/B
MJ O
pen: first published as 10.1136/bmjopen-2016-013796 on 3 M
arch 2017. Dow
nloaded from

5. O’Grady KF, Grimwood K, Sloots TP, et al. Upper airway viruses andbacteria and clinical outcomes in children with cough. PediatrPulmonol. doi: 10.1002/ppul.23527 [Epub ahead of print]26 Jul 2016.
6. Marchant JM, Masters IB, Taylor SM, et al. Evaluation andoutcome of young children with chronic cough. Chest2006;129:1132–41.
7. Marchant JM, Newcombe PA, Juniper EF, et al. What is the burdenof chronic cough for families? Chest 2008;134:303–9.
8. Thompson M, Vodicka TA, Blair PS, et al. Duration of symptoms ofrespiratory tract infections in children: systematic review. BMJ2013;347:f7027.
9. Hay AD, Wilson AD. The natural history of acute cough in childrenaged 0 to 4 years in primary care: a systematic review. Br J GenPract 2002;52:401–9.
10. Chang AB, Faoagali J, Cox NC, et al. A bronchoscopic scoringsystem for airway secretions—airway cellularity andmicrobiological validation. Pediatr Pulmonol 2006;41:887–92.
11. Douros K, Alexopoulou E, Nicopoulou A, et al. Bronchoscopic andhigh-resolution CT scan findings in children with chronic wet cough.Chest 2011;140:317–23.
12. Chang AB, Redding GJ, Everard ML. Chronic wet cough: protractedbronchitis, chronic suppurative lung disease and bronchiectasis.Pediatr Pulmonol 2008;43:519–31.
13. Bastardo CM, Sonnappa S, Stanojevic S, et al. Non-cystic fibrosisbronchiectasis in childhood: longitudinal growth and lung function.Thorax 2009;64:246–51.
14. Kapur N, Masters IB, Chang AB. Longitudinal growth and lungfunction in pediatric non-cystic fibrosis bronchiectasis: whatinfluences lung function stability? Chest 2010;138:158–64.
15. Pink B, Allbon P. The health and welfare of Australia’s aboriginaland Torres Strait Islander peoples: 2008. Canberra: AustralianBureau of Statistics and Australian Institute of Health & Welfare,2008.
16. O’Grady KA, Taylor-Thomson DM, Chang AB, et al. Rates ofradiologically confirmed pneumonia as defined by the World HealthOrganization in Northern Territory Indigenous children. Med J Aust2010;192:592–5.
17. O’Grady KA, Torzillo PJ, Chang AB. Hospitalisation of Indigenouschildren in the Northern Territory for lower respiratory illness in thefirst year of life. Med J Aust 2010;192:586–90.
18. Chang AB, Grimwood K, Mulholland EK, et al. Bronchiectasis inindigenous children in remote Australian communities. Med J Aust2002;177:200–4.
19. Valery PC, Torzillo PJ, Mulholland K, et al. Hospital-basedcase-control study of bronchiectasis in indigenous children in CentralAustralia. Pediatr Infect Dis J 2004;23:902–8.
20. Singleton RJ, Valery PC, Morris P, et al. Indigenous childrenfrom three countries with non-cystic fibrosis chronic suppurativelung disease/bronchiectasis. Pediatr Pulmonol2014;49:189–200.
21. Eades SJ, Taylor B, Bailey S, et al. The health of urban Aboriginalpeople: insufficient data to close the gap. Med J Aust2010;193:521–4.
22. Hall KK, Chang AB, Sloots TP, et al. The respiratory health of urbanindigenous children aged less than 5 years: study protocol for aprospective cohort study. BMC Pediatr 2015;15:56.
23. Chang AB, Robertson CF, van Asperen PP, et al. A cough algorithmfor chronic cough in children: a multicenter, randomized controlledstudy. Pediatrics 2013;131:e1576–83.
24. Irwin RS, Baumann MH, Bolser DC, et al. Diagnosis andmanagement of cough executive summary: ACCPevidence-based clinical practice guidelines. Chest 2006;129(1 Suppl):1S–23S.
25. Keeley D. Cough in children: new guidelines from the BritishThoracic Society. Postgrad Med J 2008;84:449.
26. Chang AB, Glomb WB. Guidelines for evaluating chronic cough inpediatrics: ACCP evidence-based clinical practice guidelines. Chest2006;129(1 Suppl):260S–83S.
27. Chang AB, Robertson CF, van Asperen PP, et al. Can amanagement pathway for chronic cough in children improveclinical outcomes: protocol for a multicentre evaluation. Trials2010;11:103.
28. Chang AB, Robertson CFPP, van Asperen PP, et al. Effect of acough algorithm on chronic cough in children: a multicentrerandomized controlled study. Pediatrics 2013;131:e1576–83.
29. Chang AB, Robertson CF, Van APP, et al. A multi-centrestudy on chronic cough in children: burden and etiologies basedon a standardized management pathway. Chest2012;142:943–50.
30. O’Grady KA, Revell A, Maguire GP, et al. Lung health care forAboriginal and Torres Strait Islander Queenslanders: breathingeasy is not so easy. Aust Health Rev 2011;35:512–19.
31. O’Grady KF, Revell A, Maguire G, et al. Lung health services foraboriginal and Torres Strait Islander peoples in Queensland.Brisbane: Queensland Government, 2010.
32. Chang AB, Marsh RL, Upham JW, et al. Toward making inroads inreducing the disparity of lung health in Australian indigenous andNew Zealand Maori children. Front Pediatr 2015;3:9.
33. Chang AB, Newman RG, Carlin JB, et al. Subjective scoring ofcough in children: parent-completed vs child-completed diarycards vs an objective method. Eur Respir J 1998;11:462–6.
34. Chang AB, Gaffney JT, Eastburn MM, et al. Cough quality inchildren: a comparison of subjective vs. bronchoscopic findings.Respir Res 2005;6:3.
35. Arnold BF, Galiani S, Ram PK, et al. Optimal recall period forcaregiver-reported illness in risk factor and intervention studies:a multicountry study. Am J Epidemiol 2013;177:361–70.
36. Council NHMR. National statement on ethical conduct in humanresearch (2007). Canberra: Australian Government, 2007.
37. Chang AB, Landau LI, Van Asperen PP, et al. Cough in children:definitions and clinical evaluation—position statement of theThoracic Society of Australia and New Zealand. Med J Aust2006;184:398–403.
38. Marchant JM, Masters IB, Taylor SM, et al. Utility of signs andsymptoms of chronic cough in predicting specific cause in children.Thorax 2006;61:694–8.
39. Hibbert ME, Lannigan A, Landau LI, et al. Lung function values froma longitudinal study of healthy children and adolescents. PediatrPulmonol 1989;7:101–9.
40. Sandberg A, Skold CM, Grunewald J, et al. Assessing recentsmoking status by measuring exhaled carbon monoxide levels.PLoS ONE 2011;6:e28864.
41. Lambert SB, Whiley DM, O’Neill NT, et al. Comparingnose-throat swabs and nasopharyngeal aspirates collected fromchildren with symptoms for respiratory virus identification usingreal-time polymerase chain reaction. Pediatrics 2008;122:e615–20.
42. O’Grady KA, Torzillo PJ, Rockett RJ, et al. Successful application ofa simple specimen transport method for the conduct of respiratoryvirus surveillance in remote Indigenous communities in Australia.Trop Med Int Health 2011;16:766–72.
43. O’Grady KA, Whiley DM, Torzillo PJ, et al. Mailed versus frozentransport of nasal swabs for surveillance of respiratory bacteria inremote Indigenous communities in Australia. BMC Infect Dis2013;13:543.
44. Department of Health & Ageing. Manual of resource items and theirassociated costs for use in submissions to the PharmaceuticalBenefits Advisory Committee involving economic evaluation.Canberra: Australian Government, 2015 (cited 1 April 2015). http://www.health.gov.au/internet/main/publishing.nsf/content/health-pbs-general-pubs-manual-content.htm
45. Department of Health and Ageing. National Hospital Cost DataCollection (NHCDC) Report. Canberra: Australian Government.http://www.health.gov.au/internet/main/publishing.nsf/content/health-casemix-data-collections-NHCDCReports
46. Private Health Insurance Administration Council. Quarterly gappayment & medical benefits statistics. Canberra: AustralianGovernment, 2012. http://phiac.gov.au/wp-content/uploads/2012/11/Gap-Sep12.pdf
47. Department of Health & Ageing. Quarterly medicare statistics.Canberra: Australian Government. http://www.health.gov.au/internet/main/publishing.nsf/Content/Quarterly-Medicare-Statistics
48. Department of Health & Ageing. Medicare benefits schedule.Canberra: Australian Government. http://www.mbsonline.gov.au/
49. Department of Health and Ageing Pharmaceutical Benefits Scheme.Canberra: Australian Government . http://www.pbs.gov.au/pbs
50. Private Health Insurance Administration Council. Private HealthInsurance Administration Council Queensland Reports. Canberra:Australian Government. http://phiac.gov.au/industry/industry-statistics
51. Australian Bureau of Statistics. Average weekly earnings. Canberra,Australia: Australian Government. http://www.abs.gov.au/austats
52. Drescher BJ, Chang AB, Phillips N, et al. The development ofchronic cough in children following presentation to a tertiarypaediatric emergency department with acute respiratory illness:study protocol for a prospective cohort study. BMC Pediatr2013;13:125.
53. Schulz KF, Altman DG, Moher D. CONSORT 2010 Statement:updated guidelines for reporting parallel group randomised trials.Trials 2010;11:32.
O’Grady KF, et al. BMJ Open 2017;7:e013796. doi:10.1136/bmjopen-2016-013796 11
Open AccessP
rotected by copyright. on S
eptember 16, 2019 at Q
ueensland University of T
echnology.http://bm
jopen.bmj.com
/B
MJ O
pen: first published as 10.1136/bmjopen-2016-013796 on 3 M
arch 2017. Dow
nloaded from
54. Hougaard P. Frailty models for survival data. Lifetime Data Anal1995;1:255–73.
55. Drummond MF, Sculpher MJ, Torrance GW. Methods for theeconomic evaluation of health care programs. Oxford: OxfordUniversity Press, 2005.
56. Gold MR, ed. Cost effectiveness in health and medicine. Oxford:Oxford University Press, 1996.
57. Gibson PG, Chang AB, Glasgow NJ, et al. CICADA: Cough inChildren and Adults: Diagnosis and Assessment. Australiancough guidelines summary statement. Med J Aust2010;192:265–71.
58. Chang AB, Landau LI, Van Asperen PP, et al. Cough in children:definitions and clinical evaluation. Med J Aust2006;184:398–403.
59. O’Grady KA, Chang AB. Lower respiratory infections inAustralian Indigenous children. J Paediatr Child Health2010;46:461–5.
60. Ungar WJ, Coyte PC, Pharmacy Medication Monitoring ProgramAdvisory Board. Prospective study of the patient-level cost of asthmacare in children. Pediatr Pulmonol 2001;32:101–8.
61. Peiris D, Brown A, Howard M, et al. Building better systems of carefor Aboriginal and Torres Strait Islander people: findings from the
Kanyini health systems assessment. BMC Health Serv Res2012;12:369.
62. Ong KS, Carter R, Kelaher M, et al. Differences in primary healthcare delivery to Australia’s Indigenous population: a template for usein economic evaluations. BMC Health Serv Res 2012;12:307.
63. Wang K, Chalker V, Bermingham A, et al. Mycoplasma pneumoniaeand respiratory virus infections in children with persistent cough inEngland: a retrospective analysis. Pediatr Infect Dis J2011;30:1047–51.
64. Bisgaard H, Hermansen MN, Bonnelykke K, et al. Association ofbacteria and viruses with wheezy episodes in young children:prospective birth cohort study. BMJ 2010;341:c4978.
65. Marchant JM, Gibson PG, Grissell TV, et al. Prospectiveassessment of protracted bacterial bronchitis: airwayinflammation and innate immune activation. Pediatr Pulmonol2008;43:1092–9.
66. Laraya-Cuasay LR, DeForest A, Huff D, et al. Chronic pulmonarycomplications of early influenza virus infection in children. Am RevRespir Dis 1977;116:617–25.
67. Bateman ED, Hayashi S, Kuwano K, et al. Latent adenoviralinfection in follicular bronchiectasis. Am J Respir Crit Care Med1995;151:170–6.
12 O’Grady KF, et al. BMJ Open 2017;7:e013796. doi:10.1136/bmjopen-2016-013796
Open AccessP
rotected by copyright. on S
eptember 16, 2019 at Q
ueensland University of T
echnology.http://bm
jopen.bmj.com
/B
MJ O
pen: first published as 10.1136/bmjopen-2016-013796 on 3 M
arch 2017. Dow
nloaded from

Appendices 303
Appendix D: Chapter 4 (COBS study) supplementary materials
Table D1. Parent and child-reported cough severity scores at time of clinic visits. Baseline Month 3 Month 6 Month 9 Month 12 Parent
(n=85) Child
(n=49) Parent (n=85)
Child (n=52)
Parent (n=85)
Child (n=54)
Parent (n=85)
Child (n=57)
Parent (n=85)
Child (n=57)
Cough severity scores¶ 0 (least severe) 24 14 17 5 19 8 17 6 18 9 1 18 5 10 2 8 6 8 6 6 4 2 16 11 7 8 14 2 7 1 15 4 3 7 4 4 2 8 5 6 3 4 4 4 8 1 5 2 3 2 5 4 6 4 5 (most severe) 1 0 1 1 2 2 0 0 0 0 Missing 11 14 41 32 31 29 42 37 36 32
Median (IQR) 1.0 (0.0-2.0)
1.0 (0.0-2.0)
1.0 (0.0-2.0)
2.0 (0.5-2.5)
1.5 (0.0-2.0)
1.0 (0.0-3.0)
1.0 (0.0-3.0)
1.0 (0.0-3.0)
2.0 (0.0-2.0)
1.0 (0.0-3.0)
¶0 = no cough, 1 = cough for one or two short periods only, 2 = cough for more than two short periods, 3 = frequent coughing which does not interfere with school or other normal activities, 4 = frequent coughing which does interfere with school or other normal activities, 5 = cannot perform most usual activities due to severe coughing.

304 Appendices
Table D2. Correlations between parent and child-reported quality-of-life (QoL) and parent and child-reported cough severity at baseline and months 3, 6, 9 and 12.
Parent QoL – child QoL n Pearson coefficient p-value Baseline 33 0.67 <0.001 Month 3 19 0.67 0.002 Month 6 25 0.75 <0.001 Month 9 19 0.73 <0.001 Month 12 25 0.62 <0.001
Parent cough severity – child cough severity n Spearman coefficient p-value Baseline 35 0.77 <0.001 Month 3 19 0.85 <0.001 Month 6 24 0.93 <0.001 Month 9 18 0.73 <0.001 Month 12 24 0.95 <0.001
Child QoL – child cough severity n Spearman coefficient p-value Baseline 35 -0.59 <0.001 Month 3 20 -0.63 0.003 Month 6 25 -0.78 <0.001 Month 9 19 -0.79 <0.001 Month 12 24 -0.76 <0.001
Parent QoL – parent cough severity n Spearman coefficient p-value Baseline 70 -0.69 <0.001 Month 3 40 -0.65 <0.001 Month 6 54 -0.75 <0.001 Month 9 42 -0.57 <0.001 Month 12 45 -0.83 <0.001

Appendices 305
Table D3. Comparison of baseline characteristics between those participants who completed all 12-monthly follow-up tasks and those participants who did not.
Baseline characteristics, n (%) Monthly follow-up tasks complete
n=67
Monthly follow-up tasks incomplete
n=18 Enrolment site
Brisbane 38 (56.7) 9 (50.0) Darwin 9 (11.9) 4 (22.2) Auckland 21 (31.3) 5 (27.8)
Age at enrolment <5-years 15 (22.4) 1 (5.6) 5-9 years 25 (37.3) 13 (72.2) ≥10-years 26 (38.8) 4 (22.2) Missing 1 (1.5) 0 (0.0)
Sex Male 33 (49.3) 10 (55.6) Female 34 (50.8) 8 (44.4)
Indigenous status Indigenous Australian 5 (7.5) 2 (11.1) Indigenous New Zealander 22 (32.8) 5 (27.8) Non-Indigenous 40 (59.7) 11 (61.1)
Gestational age <37-weeks 19 (28.4) 1 (5.6) ≥37-weeks 47 (70.2) 17 (94.4)
Birthweight <2500 grams 17 (25.4) 1 (5.6) ≥2500 grams 50 (74.6) 17 (94.4)
Number of lobes affected 1 7 (10.5) 1 (5.6) 2 21 (31.3) 12 (66.7) 3 1 (26.9) 2 (11.1) 4 5 (7.5) 1 (5.6) 5 4 (6.0) 2 (11.1) 6 1 (1.45) 0 (0.0) Missing 11 (16.4) 0 (0.0)
Aetiology of bronchiectasis Post-infectious 38 (56.7) 13 (72.2) Idiopathic 11 (16.4) 3 (16.7) Aspiration 5 (7.5) 2 (11.1) Primary immunodeficiency 4 (6.0) 0 (0.0) Primary ciliary dyskinesia 3 (4.5) 0 (0.0) Other 6 (9.0) 0 (0.0)

306 Appendices
Appendix E: Chapter 5 (TLSIM study) supplementary materials
Table E1. Self-reported baseline characteristics of children eligible for inclusion in analysis, of children who reported at least one ARIwC illness during the study period and of children who reported no ARIwC illnesses during the study period. All children,
n=178, n (%) Children with ≥1 ARIwC illness, n=138, n (%)
Children with 0 ARIwC illnesses, n=40, n (%)
p-value
DEMOGRAPHIC CHARACTERISTICS Child’s sex
Male Female
91 (51.12) 87 (48.88)
67 (48.55) 71 (51.45)
24 (60.00) 16 (40.00)
0.202
Mum’s age (years) ≤19 20-24 25-29 30-34 35+ Unknown2
30 (16.85) 62 (34.83) 36 (20.22) 29 (16.29) 20 (11.24) 1 (0.56)
18 (13.04) 52 (37.68) 29 (21.01) 20 (14.49) 19 (13.77) 0 (0.00)
(30.00) 10 (25.00) 7 (17.50) 9 (22.50) 1 (2.50) 1 (2.50)
0.016
Dad’s age (years) ≤19 20-24 25-29 30-34 35+ Unknown2
8 (4.49) 56 (31.46) 46 (25.84) 22 (12.36) 45 (25.28) 1 (0.56)
7 (5.07) 45 (32.61) 35 (25.36) 14 (10.14) 37 (26.81) 0 (0.00)
1 (2.50) 11 (27.50) 11 (27.50) 8 (20.00) 8 (20.00) 1 (2.50)
0.464
Mother’s highest level of education Did not finish high school Finished high school Higher levels Unknown/declined/ missing2
67 (37.64) 84 (47.19) 25 (14.04) 2 (1.12)
47 (34.06) 70 (50.72) 21 (15.22) 0 (0.00)
20 (50.00) 14 (35.00) 4 (10.00) 2 (5.00)
0.118
Father’s highest level of education Did not finish high school Finished high school Higher levels Unknown/declined/ missing
80 (44.94) 51 (28.65) 22 (12.36) 25 (14.04)
58 (42.03) 46 (33.33) 18 (13.04) 16 (11.59)
22 (55.00) 5 (12.50) 4 (10.00) 9 (22.50)
0.025
Mother’s employment status Employed Unemployed Unknown2
25 (14.04) 152 (85.39) 1 (0.56)
22 (15.94) 116 (84.06) 0 (0.00)
3 (7.50) 36 (90.00) 1 (2.50)
0.2971
Father’s employment status

Appendices 307
Employed Unemployed Unknown/ declined
77 (43.26) 75 (42.13) 26 (14.61)
59 (42.75) 62 (44.93) 17 (12.32)
18 (45.00) 13 (32.50) 9 (22.50)
0.199
Total annual household income ($AU) <26,000 26000 - <52000 52000 and above
68 (38.20) 68 (38.20) 42 (23.60)
46 (33.33) 56 (40.58) 36 (25.09)
22 (55.00) 12 (30.00) 6 (15.00)
0.044
Primary carer on government benefits Yes No
160 (89.89) 18 (10.11)
124 (89.86) 14 (10.14)
36 (90.00) 4 (10.00)
1.0001
Family has private insurance that covers the child Yes No
9 (5.06) 169 (94.94)
7 (5.07) 131 (94.93)
2 (5.00) 38 (95.00)
1.0001
HOUSEHOLD CHARACTERISTICS Care type at home
Both parents at home Single Parent Other
99 (55.62) 68 (38.20) 11 (6.18)
81 (58.70) 49 (35.51) 8 (5.80)
18 (45.00) 19 (47.50) 3 (7.50)
0.309
Child’s primary carer Mother Other
165 (92.70) 13 (7.30)
128 (92.75) 10 (7.25)
37 (92.50) 3 (7.50)
1.0001
Child’s primary carer identifies as Indigenous Australian Yes 128 (71.91) 99 (71.74) 29 (72.50) 0.925 No 50 (28.09) 39 (28.26) 11 (27.50)
Number of children living in the household 0 1 2 3+ Missing2
38 (21.35) 53 (29.78) 45 (25.28) 41 (23.03) 1 (0.56)
31 (22.46) 37 (26.81) 37 (26.81) 33 (23.91) 0 (0.00)
7 (17.50) 16 (40.00) 8 (20.00) 8 (20.00) 1 (2.50)
0.414
Number of people usually living in the household 2 - 3 4 - 5 6+ Unknown/declined2
54 (30.34) 78 (43.82) 45 (25.28) 1 (0.56)
41 (29.71) 61 (44.20) 36 (26.09) 0 (0.00)
13 (32.50) 17 (42.50) 9 (22.50) 1 (2.50)
0.886
Condition of the house in which the child usually lives Excellent Good Average Poor/Very poor Missing2
31 (17.42) 96 (53.93) 33 (18.54) 17 (9.55) 1 (0.56)
25 (18.12) 75 (54.35) 23 (16.67) 15 (10.87) 0 (0.00)
6 (15.00) 21 (52.50) 10 (25.00) 2 (5.00) 1(2.50)
0.465
Mold, mildew, dampness and/or smell in house in which child usually lives Yes No Unknown/declined2
61 (34.27) 116 (65.17) 1 (0.56)
47 (34.06) 91 (65.94) 0 (0.00)
14 (35.00) 25 (62.50) 1 (2.50)
0.831
CHILD AND FAMILY MEDICAL HISTORY CHARACTERISTICS

308 Appendices
Child ever had a cough lasting > 4 weeks Yes No Missing2
43 (24.16) 134 (75.28) 1 (0.56)
37 (26.81) 101 (73.19) 0 (0.00)
6 (15.00) 33 (82.50) 1 (2.50)
0.142
Child diagnosed with a respiratory illness by a doctor in 12 months prior to enrolment Yes No Missing2
60 (33.71) 117 (65.73) 1 (0.56)
52 (37.68) 86 (62.32) 0 (0.00)
8 (20.00) 31 (77.50) 1 (2.50)
0.0551
Child hospitalized for an acute respiratory illness in 12 months prior to enrolment Yes No Unknown/declined2
20 (11.24) 157 (88.20) 1 (0.56)
17 (12.32) 121 (87.68) 0 (0.00)
3 (7.50) 36 (90.00) 1 (2.50)
0.5711
Child had wheezing in 12 months prior to enrolment Yes No Missing2
65 (36.52) 112 (62.92) 1 (0.56)
57 (41.30) 81 (58.70) 0 (0.00)
8 (20.00) 31 (77.50) 1 (2.50)
0.0171
Child has eczema, currently or previously Yes No
23 (12.92) 155 (87.08)
21 (15.22) 117 (84.78)
2 (5.00) 38 (95.00)
0.1111
Family history of reactive airways disease Yes No Unknown/missing2
132 (74.16) 42 (23.60) 4 (2.25)
106 (76.81) 30 (21.74) 2 (1.45)
26 (65.00) 12 (30.00) 2 (5.00)
0.225
Family history of other chronic lung diseases Yes No Unknown/missing2
44 (24.72) 130 (73.03) 4 (2.25)
37 (26.81) 99 (71.74) 2 (1.45)
7 (17.50) 31 (77.50) 2 (5.00)
0.271
CULTURAL CHARACTERISTICS Family maintains cultural connections at home
Yes No Unknown2
110 (61.80) 66 (37.08) 2 (1.12)
89 (64.49) 49 (35.51) 0 (0.00)
21 (52.50) 17 (42.50) 2 (5.00)
0.298
Family has a connection with traditional lands/homelands Yes No Unknown2
78 (43.82) 91 (51.12) 9 (5.06)
64 (46.38) 70 (50.72) 4 (2.90)
14 (35.00) 21 (52.50) 5 (12.50)
0.412
Child spent time in an Aboriginal/Torres Strait Islander community outside Brisbane in 12 months prior to enrolment
Yes No Unknown2
21 (11.80) 156 (87.64) 1 (0.56)
19 (13.77) 119 (86.23) 0 (0.00)
2 (5.00) 37 (92.50) 1 (2.50)
0.1711
Child has any family members from the Stolen Generation Yes No Unknown/declined2
82 (46.07) 41 (23.03) 55 (30.90)
69 (50.00) 34 (24.64) 35 (25.36)
13 (32.50) 7 (17.50) 20 (50.00)
0.012
RISK FACTOR CHARACTERISTICS

Appendices 309
Child’s gestational age (weeks) < 37 ≥ 37
19 (10.67) 159 (89.33)
15 (10.87) 123 (89.13)
4 (10.00) 36 (90.00)
1.000
Child’s birthweight (grams) <2500 ≥2500
30 (16.85) 148 (83.15)
26 (18.84) 112 (81.16)
4 (10.00) 36 (90.00)
0.2351
Child admitted to neonatal intensive care unit for breathing issues post-birth Yes No Unknown/declined2
22 (12.36) 154 (86.52) 2 (1.12)
18 (13.04) 120 (86.96) 0 (0.00)
4 (10.00) 34 (85.00) 2 (5.00)
0.7881
Mother smoked during pregnancy Yes No Unknown/declined2
87 (48.88) 90 (50.56) 1 (0.56)
68 (49.28) 70 (50.72) 0 (0.00)
19 (47.50) 20 (50.00) 1 (2.50)
0.951
Mother exposed to household smoke during pregnancy Yes No Missing2
119 (66.85) 58 (32.58) 1 (0.56)
92 (66.67) 46 (33.33) 0 (0.00)
27 (67.50) 12 (30.00) 1 (2.50)
0.763
Child currently exposed to smoke in the household or car Yes No Unknown/declined2
127 (71.35) 50 (28.09) 1 (0.56)
99 (71.74) 39 (28.26) 0 (0.00)
28 (70.00) 11 (27.50) 1 (2.50)
0.995
Child was, or currently is, breastfed Yes No Missing2
129 (72.47) 48 (26.97) 1 (0.56)
104 (75.36) 34 (24.64) 0 (0.00)
25 (62.50) 14 (35.00) 1 (2.50)
0.163
Up to date with immunisations with respect to age at enrolment and as per Qld Immunisation Schedules
Yes No N/A (aged <3mths) Missing
43 (24.16) 116 (65.17) 18 (10.11) 1 (0.56)
33 (23.91) 90 (65.22) 15 (10.87) 0 (0.00)
10 (25.00) 26 (65.00) 3 (7.50) 1 (2.50)
0.4121
Child currently attends preschool or childcare Yes No Unknown/declined2
58 (32.58) 119 (66.85) 1 (0.56)
46 (33.33) 92 (66.67) 0 (0.00)
12 (30.00) 27 (67.50) 1 (2.50)
0.763
PARENT/GUARDIAN COUGH KNOWLEDGE Is a cough that goes on for more than 4 weeks normal or abnormal?
Normal Abnormal Question not asked3
8 (4.49) 124 (69.66) 46 (25.84)
8 (5.80) 95 (68.84) 35 (25.36)
0 (0.00) 29 (72.50) 11 (27.50)
0.3671
Is a wet sounding cough normal or abnormal? Normal Abnormal Unknown2 Question not asked3
6 (3.37) 124 (69.66) 2 (1.12) 46 (25.84)
4 (2.90) 97 (70.29) 2 (1.45) 35 (25.36)
2 (5.00) 27 (67.50) 0 (0.00) 11 (27.50)
0.7301

310 Appendices
Do you think your child should get antibiotics when he/she has a cold or the flu? Yes No Unknown Question not asked3
46 (25.84) 56 (31.46) 30 (16.85) 46 (25.84)
34 (24.64) 49 (35.51) 20 (14.49) 35 (25.36)
12 (30.00) 7 (17.50) 10 (25.00) 11 (27.50)
0.131
If your child is prescribed antibiotics by your doctor, how long should you give them to your child for?
Until no more symptoms Until they are all finished Unknown2 Question not asked3
17 (9.55) 113 (63.48) 2 (1.12) 46 (25.84)
12 (8.70) 91 (65.84) 0 (0.00) 35 (25.36)
5 (12.50) 22 (55.00) 2 (5.00) 11 (27.50)
0.588
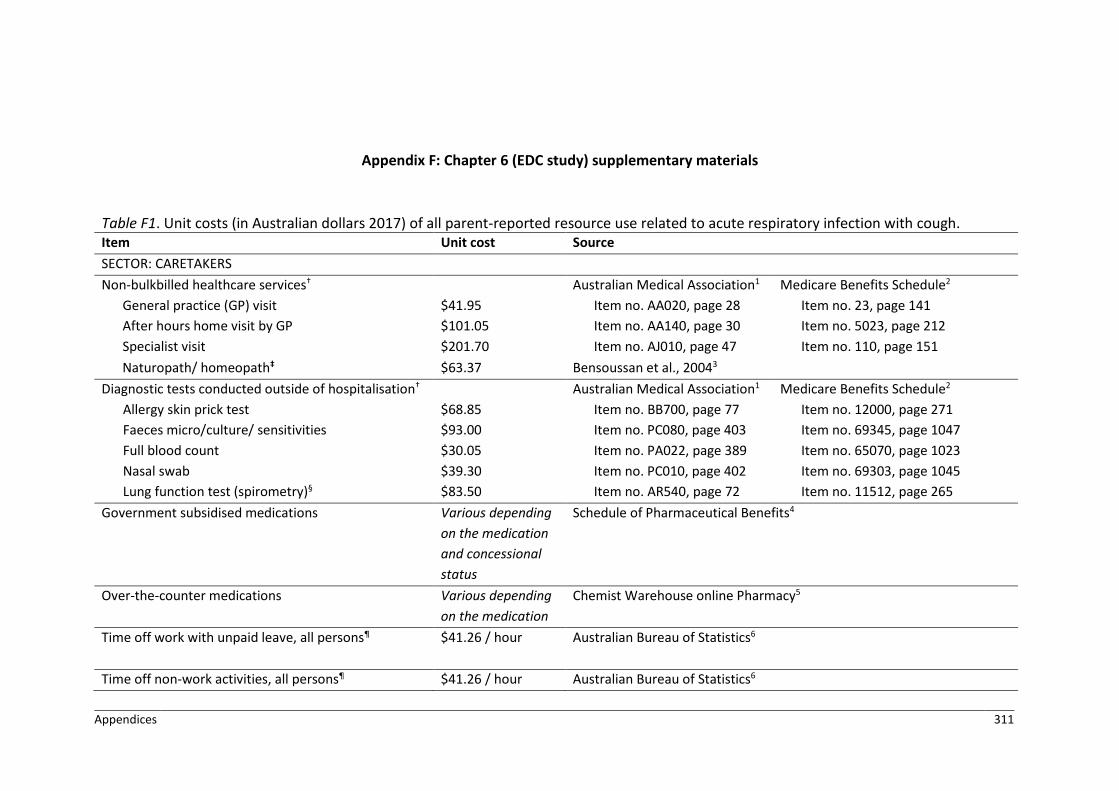
Appendices 311
Appendix F: Chapter 6 (EDC study) supplementary materials
Table F1. Unit costs (in Australian dollars 2017) of all parent-reported resource use related to acute respiratory infection with cough. Item Unit cost Source SECTOR: CARETAKERS Non-bulkbilled healthcare services†
General practice (GP) visit After hours home visit by GP Specialist visit
$41.95 $101.05 $201.70
Australian Medical Association1 Item no. AA020, page 28 Item no. AA140, page 30 Item no. AJ010, page 47
Medicare Benefits Schedule2 Item no. 23, page 141 Item no. 5023, page 212 Item no. 110, page 151
Naturopath/ homeopath‡ $63.37 Bensoussan et al., 20043 Diagnostic tests conducted outside of hospitalisation†
Allergy skin prick test Faeces micro/culture/ sensitivities Full blood count Nasal swab Lung function test (spirometry)§
$68.85 $93.00 $30.05 $39.30 $83.50
Australian Medical Association1 Item no. BB700, page 77 Item no. PC080, page 403 Item no. PA022, page 389 Item no. PC010, page 402 Item no. AR540, page 72
Medicare Benefits Schedule2 Item no. 12000, page 271 Item no. 69345, page 1047 Item no. 65070, page 1023 Item no. 69303, page 1045 Item no. 11512, page 265
Government subsidised medications Various depending on the medication and concessional status
Schedule of Pharmaceutical Benefits4
Over-the-counter medications Various depending on the medication
Chemist Warehouse online Pharmacy5
Time off work with unpaid leave, all persons¶
$41.26 / hour Australian Bureau of Statistics6
Time off non-work activities, all persons¶ $41.26 / hour Australian Bureau of Statistics6

312 Appendices
Childcare fees already paid N/A Self-reported by person completing questionnaire Child or parent/carer missed activities N/A Self-reported by person completing questionnaire Other miscellaneous costs (e.g. parking, medical supplies, food purchases at hospital, babysitter)
N/A Self-reported by person completing questionnaire
SECTOR : PUBLIC HEALTHCARE SYSTEM Healthcare services
General practice (GP) visit After hours home visit by GP Specialist visit Nurse practitioner visit
$37.05 $74.95 $128.30 $17.85
Medicare Benefits Schedule2 Item no. 23, page 141 Item no. 5023, page 212 Item no. 110, page 151 Item no. 82205, page 1245
Non-admitted emergency department presentation
Various depending on triage category and Indigenous status Range = $184.00 - $1365.00
Independent Hospital Pricing Authority7 Classifications used:
Triage 1, All diagnoses (code: URG039) Triage category 2, Respiratory system illness (code: URG095) Triage category 3, Respiratory system illness (code: URG055) Triage category 4, Respiratory system illness (code: URG108) Triage category 5, Illness of the eyes, ear, nose and throat (code: URG115) Did not wait (code: URG073)
Hospitalisation, public or private admission††
Various depending on discharge diagnosis, Indigenous status, ICU admission, whether patient
Independent Hospital Pricing Authority8 Classifications (based on hospitalisation discharge diagnosis) used:
Otitis Media and Upper Respiratory Infections (code: D63B) Respiratory Infections and Inflammations (code: E62B) Respiratory Signs & Symptoms (code: E67B)

Appendices 313
was admitted privately or publicly, and length of stay Range = $0.00 - $4047.00
Bronchitis and Asthma (code: E69B) Whooping Cough and Acute Bronchiolitis (code: E70B)
Diagnostic tests conducted outside of hospitalisation Allergy skin prick test Abdominal radiograph Chest radiograph Faeces micro/culture/ sensitivities Full blood count Nasal swab Lung function test (spirometry) Nasopharyngeal aspirate Urine micro/culture/ sensitivities
$33.15 $15.20 $20.10 $45.00 $14.45 $18.70 $52.50 $36.60 $17.50
Medicare Benefits Schedule2 Item no. 12000, page 271 Item no. 58902, page 891 Item no. 58505, page 889 Item no. 69345, page 1047 Item no. 65070, page 1023 Item no. 69303, page 1045 Item no. 11512, page 265 Item no. 69496, page 1054 Item no. 69333, page 1047
Government subsidised medications Various depending on the medication
Schedule of Pharmaceutical Benefits4
Ambulance $689.13 Australian Prudential Regulation Authority – Private Health Insurance Membership and Benefits, Part 9, Page 10, June 20179
Call to 13 Health‡‡ $11.22 Queensland Health Wage rates – Nursing Stream10 SECTOR: THIRD PARTIES (EMPLOYERS AND PRIVATE HEALTH INSURANCE COMPANIES) Time off work with paid leave, all persons¶ $41.26 / hour Australian Bureau of Statistics6

314 Appendices
Hospitalisation, private admission††, §§
Various depending on discharge diagnosis, Indigenous status, ICU admission and length of stay Range = $315.00 - $1932.00
Independent Hospital Pricing Authority8 Classifications (based on diagnoses) used:
Otitis Media and Upper Respiratory Infections (code: D63B) Respiratory Infections and Inflammations (code: E62B) Respiratory Signs & Symptoms (code: E67B) Bronchitis and Asthma (code: E69B) Whooping Cough and Acute Bronchiolitis (code: E70B)
†In Australia, a healthcare service which is bulk-billed refers to a healthcare service in which the government funds a pre-specified amount for the service with no additional out-of-pocket expenses to the patient. A non bulk-billed healthcare service refers to a service in which there is an additional cost above the amount specified by the government, which is charged by the healthcare service and must then be met by the patient. For non-bulkbilled healthcare services and diagnostic tests, cost to caretakers equals the Australian Medical Association fee, minus the Medicare Benefits Schedule rebate. ‡Costs have been adjusted for inflation from 2003 to 2017 using Reserve Bank of Australia inflation calculator. §Cost of generic medication was used, regardless of brand name reported by parent/guardian. ¶Used reported average weekly earnings from Australian Bureau of Statistics, divided by 38 to obtain an average cost per hour. †† Standard criteria applied to all hospitalisations included: aged less than 17 years, admitted to a specialised children’s hospital, in a major city, in Queensland, Australia. If an ICU admission occurred within a hospitalisation duration of time spent in ICU was assumed to be 12 hours. ‡‡Assumed Grade 6, Band 2, Pay point 1, nurse casual wage = $61.22/h. Assumed phone call length of 11 minutes11
§§All private admissions were among children with private health insurance. The cost to private health insurance companies was calculated as the cost incurred by public healthcare system for a public admission, minus the cost incurred by the public healthcare system for a private admission Table F1 References 1. Australian Medical Association. List of Medical Services and Fees 1 November 2017, 2017. 2. Australian Government Department of Health and Ageing. Medicare Benefits Schedule Book operating from 01 November 2017, 2017. 3. Bensoussan A, Myers SP, Wu S, et al. Naturopathic and Western herbal medicine practice in Australia—a workforce survey. Complement Ther Med 2004;12(1):17-27. 4. Australian Government Department of Health and Ageing. Pharmaceutical Benefits Scheme, Effective 01 November 2017, 2017. 5. Chemist Warehouse. Chemist Warehouse Discount Chemist 2017 [cited 2017 21 December]. Available from: https://www.chemistwarehouse.com.au.

Appendices 315
6. Australian Bureau of Statistics. Average Weekly Earnings, Australia, Nov 2017 'Table 3: Average Weekly Earnings, Australia, Original, November 2017' Cat. no. 6302.0 2018. 7. Independent Hospital Pricing Authority. National Weighted Activity Unit (NWAU) calculators 2017-18: Emergency Department Services, 2018. 8. Independent Hospital Pricing Authority. National Weighted Activity Unit (NWAU) calculators 2017-18: Acute Admitted Services, 2018. 9. Authority APR. Private Health Insurance Membership and Benefits Sydney: Australian Prudential Regulation Authority; 2017 [cited 2019 29 March]. Available from: http://webarchive.nla.gov.au/gov/20170816054020/http://www.apra.gov.au/PHI/Publications/Pages/Private-Health-Insurance-Membership-and-Benefits.aspx. 10. Queensland Health. Wage rates - Nursing Stream - Nursing wage rates as at 1 April 2017 2017. Available from: https://www.health.qld.gov.au/hrpolicies/wage_rates/nursing - 2017 11. Queensland Cabinet and Ministerial Directory. 13 HEALTH hotline service open for your calls, 2006. Available from: http://statements.qld.gov.au/Statement/Id/44766

316 Appendices
Table F2. Characteristics of all children at enrolment, with comparison of characteristics between participants with and without complete economic data.
All participants n=292, n (%)
Participants with complete data n=129, n (%)
Participants with incomplete data n=163, n (%)
P value
ILLNESS-RELATED CHARACTERISTICS Season of illness onset
Spring (Sept-Nov) 38 (13.01) 13 (10.08) 25 (15.34) 0.006 Summer (Dec-Feb) 44 (15.07) 11 (8.53) 33 (20.25) Autumn (Mar-May) 91 (31.16) 49 (37.98) 42 (25.77) Winter (June-Aug) 119 (40.75) 56 (43.41) 63 (38.65)
Duration of cough at time of enrolment (days) 0 to <14 228 (78.08) 99 (76.74) 129 (79.14) 0.892 14 to <28 31 (10.62) 14 (10.85) 17 (10.43) ≥28 30 (10.27) 15 (11.63) 15 (9.20) Unknown† 3 (1.03) 1 (0.78) 2 (1.23)
Day-time cough severity at time of enrolment 0 (least severe) 4 (1.37) 2 (1.55) 2 (1.23) 0.033 1 11 (3.77) 9 (6.98) 2 (1.23) 2 31 (10.62) 9 (6.98) 22 (13.50) 3 59 (20.21) 27 (20.93) 32 (19.63) 4 67 (22.95) 26 (20.16) 41 (25.15) 5 (most severe) 33 (11.30) 13 (10.08) 20 (12.27) Not applicable 75 (25.68) 40 (31.01) 35 (21.47) Missing 12 (4.11) 3 (2.33) 9 (5.52)
Night-time cough severity at enrolment 0 (least severe) 11 (3.77) 5 (3.88) 6 (3.68) 0.033 1 36 (12.33) 17 (13.18) 19 (11.66) 2 46 (15.75) 11 (8.53) 35 (21.47) 3 79 (27.05) 42 (32.56) 37 (22.70) 4 63 (21.58) 31 (24.03) 32 (19.63) 5 (most severe) 54 (18.49) 21 (16.28) 33 (20.25) Missing/Unknown† 3 (1.02) 2 (1.55) 1 (0.61)
Medications given in the 7 days prior to enrolment Yes 264 (90.41) 113 (87.60) 151 (92.64) 0.067 No 26 (8.90) 16 (12.40) 10 (6.13) Missing† 2 (0.68) 0 (0.00) 2 (1.23)
Parent/guardian worried about the amount of money lost due to child’s cough illness Not 182 (62.33) 85 (65.89) 97 (59.51) 0.728 A little/hardly 58 (19.86) 25 (19.38) 33 (20.25) Fairly/somewhat 35 (11.99) 13 (10.08) 22 (13.50) Very, very/ very 15 (5.14) 6 (4.65) 9 (5.52) Missing† 2 (0.68) 0 (0.00) 2 (1.23)
EMERGENCY DEPARTMENT PRESENTATION CHARACTERISTICS

Appendices 317
All participants n=292, n (%)
Participants with complete data n=129, n (%)
Participants with incomplete data n=163, n (%)
P value
Season of presentation Spring (Sept-Nov) 43 (14.73) 15 (11.63) 28 (17.18) 0.091 Summer (Dec-Feb) 42 (14.38) 13 (10.08) 29 (17.79) Autumn (Mar-May) 80 (27.40) 40 (31.01) 40 (24.54) Winter (June-Aug) 127 (43.49) 61 (47.29) 66 (40.49)
Triage category 5 (least urgent) 2 (0.68) 1 (0.78) 1 (0.61) 0.594 4 77 (26.37) 36 (27.91) 41 (25.15) 3 106 (36.30) 41 (31.78) 65 (39.88) 2 102 (34.93) 49 (37.98) 53 (32.52) 1 (most urgent) 4 (1.37) 1 (0.78) 3 (1.84) Missing† 1 (0.34) 1 (0.78) 0 (0.00)
Discharge destination post-ED Discharged home 127 (43.49) 59 (45.74) 68 (41.72) 0.801 Admitted to short-stay 116 (39.73) 49 (37.98) 67 (41.10) Admitted as inpatient 48 (16.44) 21 (16.28) 27 (16.56) Did not wait 1 (0.34) 0 (0.00) 1 (0.61)
CHILD AND FAMILY MEDICAL HISTORY Number of times child has had cough lasting >4 weeks in the 12 months prior to enrolment
0 221 (75.68) 96 (74.42) 125 (76.69) 0.991 1 42 (14.38) 19 (14.73) 23 (14.11) 2 to 4 19 (6.51) 9 (6.98) 10 (6.13) >4 4 (1.37) 2 (1.55) 2 (1.23) Missing/Unknown 6 (2.05) 3 (2.33) 3 (1.84)
Child has been diagnosed with any respiratory illness in the 12 months prior to enrolment Yes 175 (59.93) 83 (64.34) 92 (56.44) 0.212 No 115 (39.38) 46 (35.66) 69 (42.33) Missing† 2 (0.68) 0 (0.00) 2 (1.23)
Child has been hospitalised for a respiratory illness in the 12 months prior to enrolment Yes 73 (25.00) 29 (22.48) 44 (26.99) 0.343 No 217 (74.32) 100 (77.52) 117 (71.78) Missing† 2 (0.68) 0 (0.00) 2 (1.23)
Child has allergies Yes 59 (20.21) 33 (25.58) 26 (15.95) 0.051 No 230 (78.77) 96 (74.42) 134 (82.21) Missing† 3 (1.03) 0 (0.00) 3 (1.84)
Child has ever had an itchy rash that was coming and going for ≥6 months Yes 45 (15.41) 12 (9.30) 33 (20.25) 0.008 No 245 (83.90) 117 (90.70) 128 (78.53) Missing† 2 (0.68) 0 (0.00) 2 (1.23)
Child has ever had eczema

318 Appendices
All participants n=292, n (%)
Participants with complete data n=129, n (%)
Participants with incomplete data n=163, n (%)
P value
Yes 73 (25.00) 31 (24.03) 42 (25.77) 0.693 No 215 (73.63) 97 (75.19) 118 (72.39) Missing/Unknown† 4 (1.37) 1 (0.78) 3 (1.84)
Wheezing/whistling in the 12 months prior to enrolment Yes 146 (50.00) 68 (52.71) 78 (47.85) 0.493 No 141 (48.29) 60 (46.51) 81 (49.69) Missing/Unknown† 5 (1.71) 1 (0.78) 4 (2.45)
Child has other medical conditions Yes 65 (22.26) 29 (22.48) 36 (22.09) 0.998 No 222 (76.03) 99 (76.74) 123 (75.46) Missing† 5 (1.71) 1 (0.78) 4 (2.45)
Family history of asthma Yes 203 (69.52) 92 (71.32) 111 (68.10) 0.661 No 87 (29.79) 37 (28.68) 50 (30.67) Missing† 2 (0.68) 0 (0.00) 2 (1.23)
Family history of other lung disease Yes 44 (15.07) 21 (16.28) 23 (14.11) 0.767 No 242 (82.88) 106 (82.17) 136 (83.44) Missing 6 (2.05) 2 (1.55) 4 (2.45)
Child admitted to neonatal ICU post-birth for problems with breathing Yes 29 (9.93) 10 (7.75) 19 (11.66) 0.025 No 253 (86.64) 118 (91.47) 135 (82.82) Missing/Unknown 10 (3.42) 1 (0.78) 9 (5.52)
RISK FACTORS Child has received an influenza vaccine in the 12 months prior to enrolment
Yes 36 (12.33) 21 (16.28) 15 (9.20) 0.085 No 251 (85.96) 108 (83.72) 143 (87.73) Missing/Unknown† 5 (1.71) 0 (0.00) 5 (3.07)
Child is age-appropriately immunised (parent-report) Yes 275 (94.18) 122 (94.57) 153 (93.87) 0.912 No 14 (4.79) 6 (4.65) 8 (4.91) Missing† 3 (1.03) 1 (0.78) 2 (1.23)
Child currently attends school or childcare Attends school 66 (22.60) 29 (22.48) 37 (22.70) 0.931 Attends childcare 141 (48.29) 64 (49.61) 77 (47.24) Attends neither 84 (28.77) 36 (27.91) 48 (29.45) Missing† 1 (0.34) 0 (0.00) 1 (0.61)
Child has travelled in 14 days prior to enrolment Yes 44 (15.07) 23 (17.83) 21 (12.88) 0.260 No 246 (84.25) 106 (82.17) 140 (85.89) Missing† 2 (0.68) 0 (0.00) 2 (1.23)
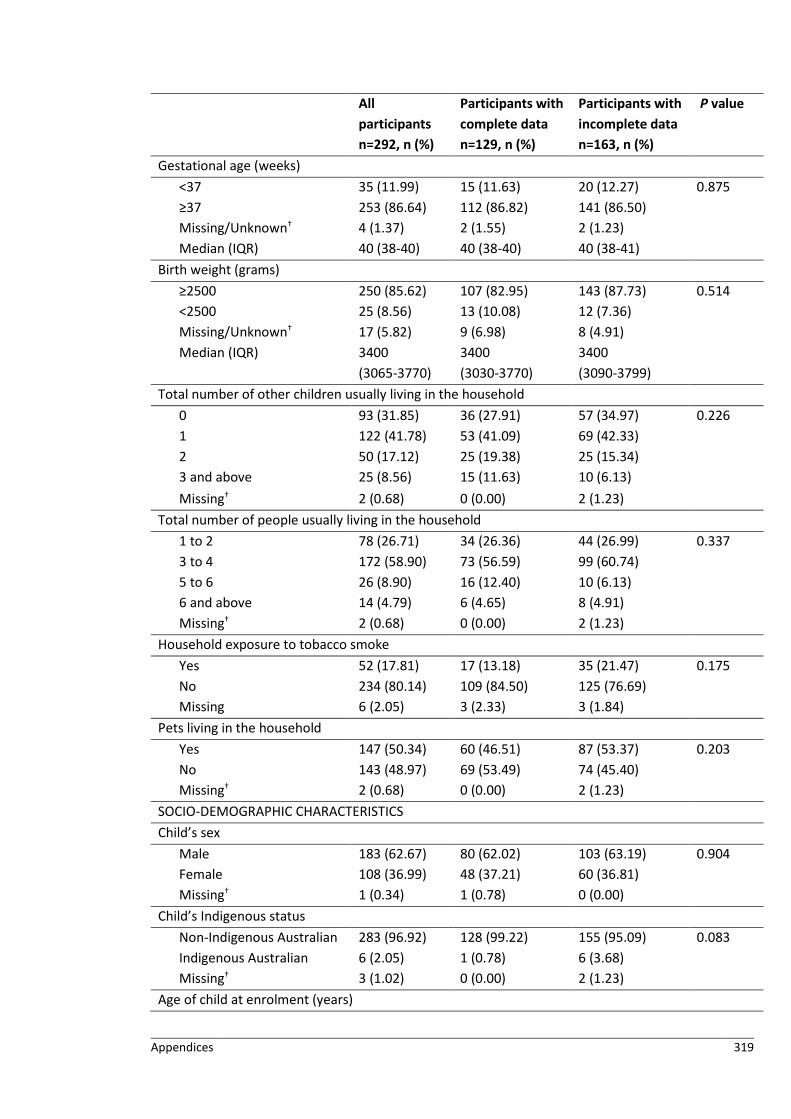
Appendices 319
All participants n=292, n (%)
Participants with complete data n=129, n (%)
Participants with incomplete data n=163, n (%)
P value
Gestational age (weeks) <37 35 (11.99) 15 (11.63) 20 (12.27) 0.875 ≥37 253 (86.64) 112 (86.82) 141 (86.50) Missing/Unknown† 4 (1.37) 2 (1.55) 2 (1.23) Median (IQR) 40 (38-40) 40 (38-40) 40 (38-41)
Birth weight (grams) ≥2500 250 (85.62) 107 (82.95) 143 (87.73) 0.514 <2500 25 (8.56) 13 (10.08) 12 (7.36) Missing/Unknown† 17 (5.82) 9 (6.98) 8 (4.91) Median (IQR) 3400
(3065-3770) 3400 (3030-3770)
3400 (3090-3799)
Total number of other children usually living in the household 0 93 (31.85) 36 (27.91) 57 (34.97) 0.226 1 122 (41.78) 53 (41.09) 69 (42.33) 2 50 (17.12) 25 (19.38) 25 (15.34) 3 and above 25 (8.56) 15 (11.63) 10 (6.13) Missing† 2 (0.68) 0 (0.00) 2 (1.23)
Total number of people usually living in the household 1 to 2 78 (26.71) 34 (26.36) 44 (26.99) 0.337 3 to 4 172 (58.90) 73 (56.59) 99 (60.74) 5 to 6 26 (8.90) 16 (12.40) 10 (6.13) 6 and above 14 (4.79) 6 (4.65) 8 (4.91) Missing† 2 (0.68) 0 (0.00) 2 (1.23)
Household exposure to tobacco smoke Yes 52 (17.81) 17 (13.18) 35 (21.47) 0.175 No 234 (80.14) 109 (84.50) 125 (76.69) Missing 6 (2.05) 3 (2.33) 3 (1.84)
Pets living in the household Yes 147 (50.34) 60 (46.51) 87 (53.37) 0.203 No 143 (48.97) 69 (53.49) 74 (45.40) Missing† 2 (0.68) 0 (0.00) 2 (1.23)
SOCIO-DEMOGRAPHIC CHARACTERISTICS Child’s sex
Male 183 (62.67) 80 (62.02) 103 (63.19) 0.904 Female 108 (36.99) 48 (37.21) 60 (36.81) Missing† 1 (0.34) 1 (0.78) 0 (0.00)
Child’s Indigenous status Non-Indigenous Australian 283 (96.92) 128 (99.22) 155 (95.09) 0.083 Indigenous Australian 6 (2.05) 1 (0.78) 6 (3.68) Missing† 3 (1.02) 0 (0.00) 2 (1.23)
Age of child at enrolment (years)

320 Appendices
All participants n=292, n (%)
Participants with complete data n=129, n (%)
Participants with incomplete data n=163, n (%)
P value
Median (IQR) 2 (1-5) 2 (1-5) 2 (1-5) 0.802 Age of mother at enrolment (years)
Median (IQR) 34 (29-38) 34 (30-38) 34 (29-39) 0.984 Age of father at enrolment (years)
Median (IQR) 36 (31-41) 36 (32-41) 35 (31-41) 0.330 Employment status of mother
Employed full-time 88 (30.14) 30 (23.26) 58 (35.58) 0.157 Employed part-time 88 (30.14) 45 (34.88) 43 (26.38) Employed casual 24 (8.22) 13 (10.08) 11 (6.75) Not employed 76 (26.03) 35 (27.13) 41 (25.15) Not applicable 12 (4.11) 6 (4.65) 6 (3.68) Missing/ Unknown/ Declined to answer†
4 (1.37) 0 (0.00) 4 (2.45)
Employment status of father Employed full-time 232 (79.45) 112 (86.82) 120 (73.62) 0.156 Employed part-time 11 (3.77) 3 (2.33) 8 (4.91) Employed casual 15 (5.14) 4 (3.10) 11 (6.75) Not employed 10 (3.42) 3 (2.33) 7 (4.29) Not applicable 14 (4.79) 4 (3.10) 10 (6.13) Missing/ Unknown/ Declined to answer
10 (3.42) 3 (2.33) 7 (4.29)
Maternal educational attainment‡ High school (or lower) 68 (23.29) 20 (15.50) 48 (29.45) 0.005 Post school 79 (27.05) 33 (25.58) 46 (28.22) Tertiary 140 (47.95) 74 (57.36) 66 (40.49) Missing/ Unknown/ Not applicable†
5 (1.71) 2 (1.55) 3 (1.84)
Paternal educational attainment‡ High school (or lower) 60 (20.55) 26 (20.16) 34 (20.86) 0.326 Post school 79 (27.05) 31 (24.03) 48 (29.45) Tertiary 134 (45.89) 66 (51.16) 68 (41.72) Missing/ Unknown/ Not applicable
19 (6.51) 6 (4.65) 13 (7.98)
Total annual household income ($AU) ≥ 200000 31 (10.62) 20 (15.50) 11 (6.75) 0.042 156,000 to <200,000 45 (15.41) 18 (13.95) 27 (16.56) 104,000 to <156,000 66 (22.60) 31 (24.03) 35 (21.47) 78,000 to <104,000 45 (15.41) 21 (16.28) 24 (14.72) 52,000 to <78,000 37 (12.67) 19 (14.73) 18 (11.04) <52000 38 (13.01) 12 (9.30) 26 (15.95)

Appendices 321
All participants n=292, n (%)
Participants with complete data n=129, n (%)
Participants with incomplete data n=163, n (%)
P value
Missing/ Unknown/ Declined to answer
30 (10.27) 8 (6.20) 22 (13.50)
Family receives government welfare benefits Yes 70 (23.97) 20 (15.50) 50 (30.67) 0.005 No 215 (73.63) 107 (82.95) 108 (66.26) Missing/Unknown 7 (2.40) 2 (1.55) 5 (3.07)
Family has private insurance that covers the child Yes 181 (61.99) 93 (72.09) 88 (53.99) 0.005 No 105 (35.96) 36 (27.91) 69 (42.33) Missing/Unknown 6 (2.05) 0 (0.00) 6 (3.68)

322 Appendices
Table F3. Mean cost per episode of acute respiratory infection with cough after multiple imputation, in 2017 Australian dollars, by timepoint,
and sector, n=292†.
Caretakers Public healthcare system Third parties Total Week 0 2096.15 (1570.84, 2621.45) 1025.11 (919.33, 1130.89) 251.57 (194.27, 308.88) 3372.83 (2820.46, 3925.20) Week 1 1536.91 (1326.67, 1747.15) 62.71 (27.33, 98.10) 306.46 (213.21, 399.72) 1906.08 (1670.20, 2141.97) Week 2 147.33 (94.52, 200.14) 21.90 (4.01, 39.80) 10.05 (2.37, 17.72) 179.28 (114.06, 244.50) Week 3 142.64 (89.66, 195.62) 71.52 (18.96, 124.09) 24.28 (0.80, 47.76) 238.44 (149.96, 326.92) Week 4 94.81 (51.63, 137.99) 8.67 (1.68, 15.66) 4.68 (0.17, 9.20) 108.16 (62.85, 153.48) Total 4017.84 (3418.66, 4617.02) 1189.92 (1060.45, 1319.38) 597.05 (472.36, 721.73) 5804.80 (5145.59, 6464.01)
†Outliers have been included.

Appendices 323
Table F4. Multiple linear regression model examining factors associated with total cost per episode of acute respiratory infection with cough, n=280†.
Variable Coefficient‡ 95% CI P value Cough duration at enrolment (days)
0 to <14 Reference 14 to <28 1547.13 -344.00, 3438.26 0.108 >28 4199.19 1813.80, 6584.58 0.001
Illness duration at enrolment (days) 71.54 37.34, 105.74 0.000 Cough duration post-enrolment (days)
0 to <14 Reference 14 to <28 330.00 -1342.61, 2002.61 0.698 >28 995.43 -932.57, 2923.43 0.310 Unknown 1264.08 -67.47, 2595.63 0.063
Season of presentation to ED Spring (Sept-Nov) Reference Summer (Dec-Feb) 296.07 -1739.97, 2332.10 0.775 Autumn (Mar-May) 1643.35 -177.78, 3464.48 0.077 Winter (June-Aug) 1251.38 -437.19, 2939.95 0.146
Discharge destination post-ED presentation at enrolment Discharged home Reference Admitted to short-stay 83.55 -1276.86, 1443.96 0.904 Admitted as inpatient 3710.10 2003.36, 5416.84 0.000 Did not wait¶ 95.76 -9354.24, 9545.77 0.984
Diagnosis assigned at ED discharge Upper respiratory tract infection / viral infection / other respiratory illnesses
Reference
Asthma/reactive airways disease -967.37 -2585.05, 650.31 0.240 Croup -337.37 -2307.49, 1632.74 0.736 Pneumonia -357.47 -2842.60, 2127.66 0.777 Bronchiolitis 421.85 -1598.98, 2442.69 0.681 Other non-respiratory illness 2214.57 -535.75, 4964.89 0.114
Parent/guardian level of concern about the amount of money lost due to child’s cough illness at enrolment
Not Reference A little/Hardly 221.28 -1183.96, 1626.53 0.757 Fairly/Somewhat 578.23 -1215.23, 2371.69 0.526 Very, very/Very 4812.44 1933.95, 7690.93 0.001
Maternal educational attainment High school Reference Post school 9.58 -1522.24, 1541.40 0.990 Tertiary -802.78 -2206.28, 600.72 0.261
Total number of people living in the household 1-2 Reference 3-4 1049.31 -250.12, 2348.74 0.113

324 Appendices
5-6 469.24 -1672.13, 2610.61 0.666 6+ -401.87 -3175.20, 371.47 0.776
Maternal age at enrolment (years) -31.68 -132.33, 68.97 0.536 Child age at enrolment (years) -37.20 -260.53, 186.13 0.743 Intercept 2927.48 -981.16, 6836.12 0.141

Appendices 325
Appendix G: Chapter 7 (EDC study) supplementary materials
Table G1. Baseline multiple linear regression model, with 7 high leverage participants removed, N=232, adjusted R2 = 44.6%.
Variable Coeffa (95% CI) p-value Intercept 1.99 (1.29, 2.69) <0.001 Gender
Female Ref 0.49 Male 0.09 (-0.16, 0.33)
Age of child at enrolment (in years) <1 Ref 0.03 1-<2 0.27 (-0.08, 0.61) 2- <5 0.41 (0.06, 0.76) 5- <10 0.65 (0.21, 1.08) 10- <15 0.75 (0.11, 1.38)
Age of father at enrolment (in years) <25 Ref 0.04 25- <30 -0.83 (-1.52, -0.15) 30- <35 -0.94 (-1.60, -0.28) 35 - <40 -0.67 (-1.35, 0.01) >40 -0.61 (-1.30, 0.08)
Day cough severity scoreb 0 (least severe) Ref 0.002 1 1.86 (0.77, 2.95) 2 0.98 (0.02, 1.94) 3 1.19 (0.24, 2.14) 4 0.78 (-0.16, 1.72) 5 (most severe) 0.61 (-0.36, 1.58) N/A 1.01 (0.08, 1.94)
Night cough severity scoreb 0 (least severe) Ref <0.001 1 -0.95 (-1.73, -0.17) 1b -1.51 (-2.40, -0.61) 2 -1.71 (-2.43, -0.98) 3 -1.98 (-2.69, -1.26) 4 -2.13 (-2.86, -1.40) 5 (most severe) -2.66 (-3.40, -1.92)
Maternal educational attainment High school (or lower) Ref 0.06 Post school (Certificate or Diploma) 0.40 (0.05, 0.75) Tertiary (Under- or post-graduate qualification) 0.33 (-0.01, 0.67)
Wheeze in the past 12 months No Ref 0.006 Yes -0.34 (-0.59, -0.10)
Private health insurance that covers the child No Ref 0.009 Yes 0.37 (0.09, 0.64)
Parent/ guardian worried about money Not Ref 0.002 Hardly/ A little -0.38 (-0.68, -0.07) Somewhat / Fairly -0.66 (-1.05, -0.26) Very / Very, very -0.49 (-1.13, 0.15)

326 Appendices
Appendix H: Chapter 8 (RICCi study) supplementary materials
Table H1. Itemised summary of resource use for 90 participants included in the intention-to-treat cost-effectiveness analysis, presented by allocation group.
Intervention, n=45 Usual care, n=45 Any use Number of times Any use Number of times n (%) Range Mean 95% CI n (%) Range Mean 95% CI General practitioner consultation 11 (24) 0 – 3 0.42 0.20, 0.71 18 (40) 0 – 3 0.71 0.43, 1.02 Specialist consultation 37 (82) 0 – 1 0.82 0.69, 0.92 3 (7) 0 – 1 0.07 0.00, 0.16 Use of other healthcare service 4 (9) 0 – 2 0.11 0.02, 0.25 3 (7) 0 – 2 0.09 0.00, 0.22 Emergency department presentation without admission
3 (7) 0 – 1 0.07 0.00, 0.15 3 (7) 0 – 3 0.13 0.00, 0.33
Hospitalisation 0 (0) - - - 1 (2) 0 – 1 0.02 0, 0.08 Diagnostic tests conducted outside of an emergency department/hospital – all
27 (60) 0 – 7 1.44 0.97, 2.07 7 (16) 0 – 4 0.27 0.09, 0.54
Chest radiograph 22 (49) 0 – 1 0.49 0.33, 0.63 4 (9) 0 – 1 0.09 0.02, 0.2 Full blood count 8 (18) 0 – 1 0.18 0.08, 0.31 3 (7) 0 – 1 0.07 0.00, 0.16 Culture (from swab) 8 (18) 0 – 1 0.18 0.08, 0.30 0 (0) - - - Blood microbial antibody test 9 (20) 0 – 3 0.38 0.17, 0.64 1 (2) 0 – 2 0.04 0.00, 0.16 Spirometry 1 (2) 0 – 1 0.02 0.00, 0.08 0 (0) - - - Computed tomography scan of chest 0 (0) - - - 1 (2) 0 – 1 0.02 0.00, 0.08 Any use Number of weeks reported¶ Any use Number of weeks reported¶ n (%) Range Mean 95% CI n (%) Range Mean 95% CI
Government-subsidised prescription medications 33 (73) 0 – 4 1.93 1.51, 2.33 19 (42) 0 – 4 0.89 0.54, 1.29 Over the counter medications 24 (53) 0 – 4 0.84 0.57, 1.13 16 (36) 0 – 4 0.64 0.37, 0.98 Child, parent or other carer missed usual activities due to cough illness
Money lost as a result of missed activity
13 (29)
7 (16)
0 – 4
0 – 2
0.38
0.18
0.18, 0.63
0.06, 0.33
12 (27)
4 (9)
0 – 2
0 – 1
0.31
0.09
0.16, 0.49
0.02, 0.19 Miscellaneous 6 (13) 0 – 3 0.20 0.07, 0.41 3 (7) 0 – 1 0.07 0.00, 0.15

Appendices 327
Missed childcare/school Money lost as a result of missed childcare
14 (31) 9 (20)
0 – 2 0 – 2
0.40 0.29
0.23, 0.60 0.13, 0.49
11 (24) 8 (18)
0 – 4 0 – 4
0.38 0.27
0.17, 0.66 0.10, 0.54
Any time spent Number of hours Any time spent Number of hours n (%) Range Mean 95% CI n (%) Range Mean 95% CI Time off work (paid leave) to seek healthcare 12 (27) 0 – 10 1.05 0.46, 1.82 8 (18) 0 – 72 2.34 0.38, 6.39 Time off work (unpaid leave) to seek healthcare 11 (24) 0 – 6 0.76 0.35, 1.28 6 (13) 0 – 40 1.91 0.29, 4.57 Time off non-work activities to seek healthcare 28 (62) 0 – 12 2.68 1.81, 3.69 14 (31) 0 – 48 2.16 0.74, 5.09 Time off work (paid leave) to care for child 7 (16) 0 – 16 1.04 0.30, 2.15 4 (9) 0 – 38 1.56 0.15, 4.00 Time off work (unpaid leave) to care for child 3 (7) 0 – 8 0.33 0.00, 0.90 2 (4) 0 – 6 0.23 0.00, 0.65 Time off non-work activities to care for child 13 (29) 0 – 47 4.11 1.91, 7.76 11 (24) 0 – 84 3.64 1.09, 8.68
¶Maximum possible weeks is 4

328 Appendices
Table H2. Itemised summary of resource use for 76 participants included in the per-protocol cost-effectiveness analysis, presented by allocation group.
Intervention, n=36 Usual care, n=40 Any use Number of times Any use Number of times n (%) Range Mean 95% CI n (%) Range Mean 95% CI General practitioner consultation 11 (31) 0 – 3 0.53 0.27, 0.85 15 (38) 0 – 3 0.63 0.36, 0.96 Specialist consultation 36 (100) 1 – 1 1.00 1.00, 1.00 0 (0) - - - Use of other healthcare service 4 (11) 0 – 2 0.14 0.03, 0.29 1 (3) 0 – 1 0.03 0.00, 0.09 Emergency department presentation without admission
3 (8) 0 – 1 0.08 0.00, 0.20 2 (5) 0 – 2 0.08 0.00, 0.22
Hospitalisation 0 (0) - - - 0 (0) - - - Diagnostic tests conducted outside of an emergency department/hospital – all
26 (72) 0 – 7 1.67 1.09, 2.39 16 (40) 0 – 4 0.23 0.05, 0.53
Chest radiograph 21 (58) 0 – 1 0.58 0.42, 0.75 3 (8) 0 – 1 0.08 0.00, 0.17 Full blood count 7 (19) 0 - 1 0.19 0.08, 0.34 3 (8) 0 – 1 0.08 0.00, 0.17 Culture (from swab) 8 (22) 0 – 1 0.22 0.09, 0.37 0 (0) - - - Blood microbial antibody test 8 (22) 0 – 2 0.39 0.17, 0.66 1 (3) 0 – 2 0.05 0.00, 0.19 Spirometry 1 (3) 0 – 1 0.03 0.00, 0.10 0 (0) - - - Computed tomography scan of chest 0 (0) - - - 1 (3) 0 – 1 0.03 0.00, 0.09 Any use Number of weeks reported¶ Any use Number of weeks reported¶ n (%) Range Mean 95% CI n (%) Range Mean 95% CI
Government-subsidised prescription medications 32 (89) 0 – 4 2.36 1.94, 2.74 15 (33) 0 – 4 0.73 0.44, 1.13 Over the counter medications 24 (67) 0 – 4 1.06 0.74, 1.39 13 (33) 0 – 4 0.60 0.30, 0.97 Child, parent or other carer missed usual activities due to cough illness
Money lost as a result of missed activity
13 (36) 7 (19)
0 – 4 0 – 4
0.47 0.22
0.26, 0.81 0.09, 0.42
10 (25) 3 (8)
0 – 1 0 – 1
0.25 0.08
0.13, 0.41 0.00, 0.17
Miscellaneous 6 (17) 0 – 3 0.25 0.08, 0.53 2 (5) 0 – 1 0.05 0.00, 0.14 Missed childcare/school
Money lost as a result of missed childcare 13 (36) 8 (22)
0 – 2 0 – 2
0.44 0.31
0.25, 0.67 0.13, 0.56
9 (23) 7 (18)
0 – 4 0 – 4
0.30 0.25
0.12, 0.59 0.09, 0.56

Appendices 329
Any time spent Number of hours Any time spent Number of hours n (%) Range Mean 95% CI n (%) Range Mean 95% CI Time off work (paid leave) to seek healthcare 12 (33) 0 – 10 1.31 0.63, 2.25 4 (10) 0 – 8 0.35 0.05, 1.00 Time off work (unpaid leave) to seek healthcare 11 (31) 0 – 6 0.95 0.45, 1.58 3 (8) 0 – 8 0.30 0.00, 0.89 Time off non-work activities to seek healthcare 27 (75) 0 – 12 3.13 2.14, 4.38 11 (28) 0 – 48 2.09 0.55, 5.31 Time off work (paid leave) to care for child 7 (19) 0 – 16 1.31 0.39, 2.59 2 (5) 0 – 38 1.15 0.00, 3.95 Time off work (unpaid leave) to care for child 3 (8) 0 – 8 0.42 0.00, 1.09 1 (3) 0 – 4.25 0.11 0.00, 0.41 Time off non-work activities to care for child 13 (36) 0 – 47 5.14 2.28, 8.98 7 (18) 0 – 84 3.58 0.75, 9.49
¶Maximum possible weeks is 4

330 Appendices
Figure H1. Non-specific cough pathway of cough management algorithm.


332 Appendices
Figure H2. Specific cough pathway of cough management algorithm.
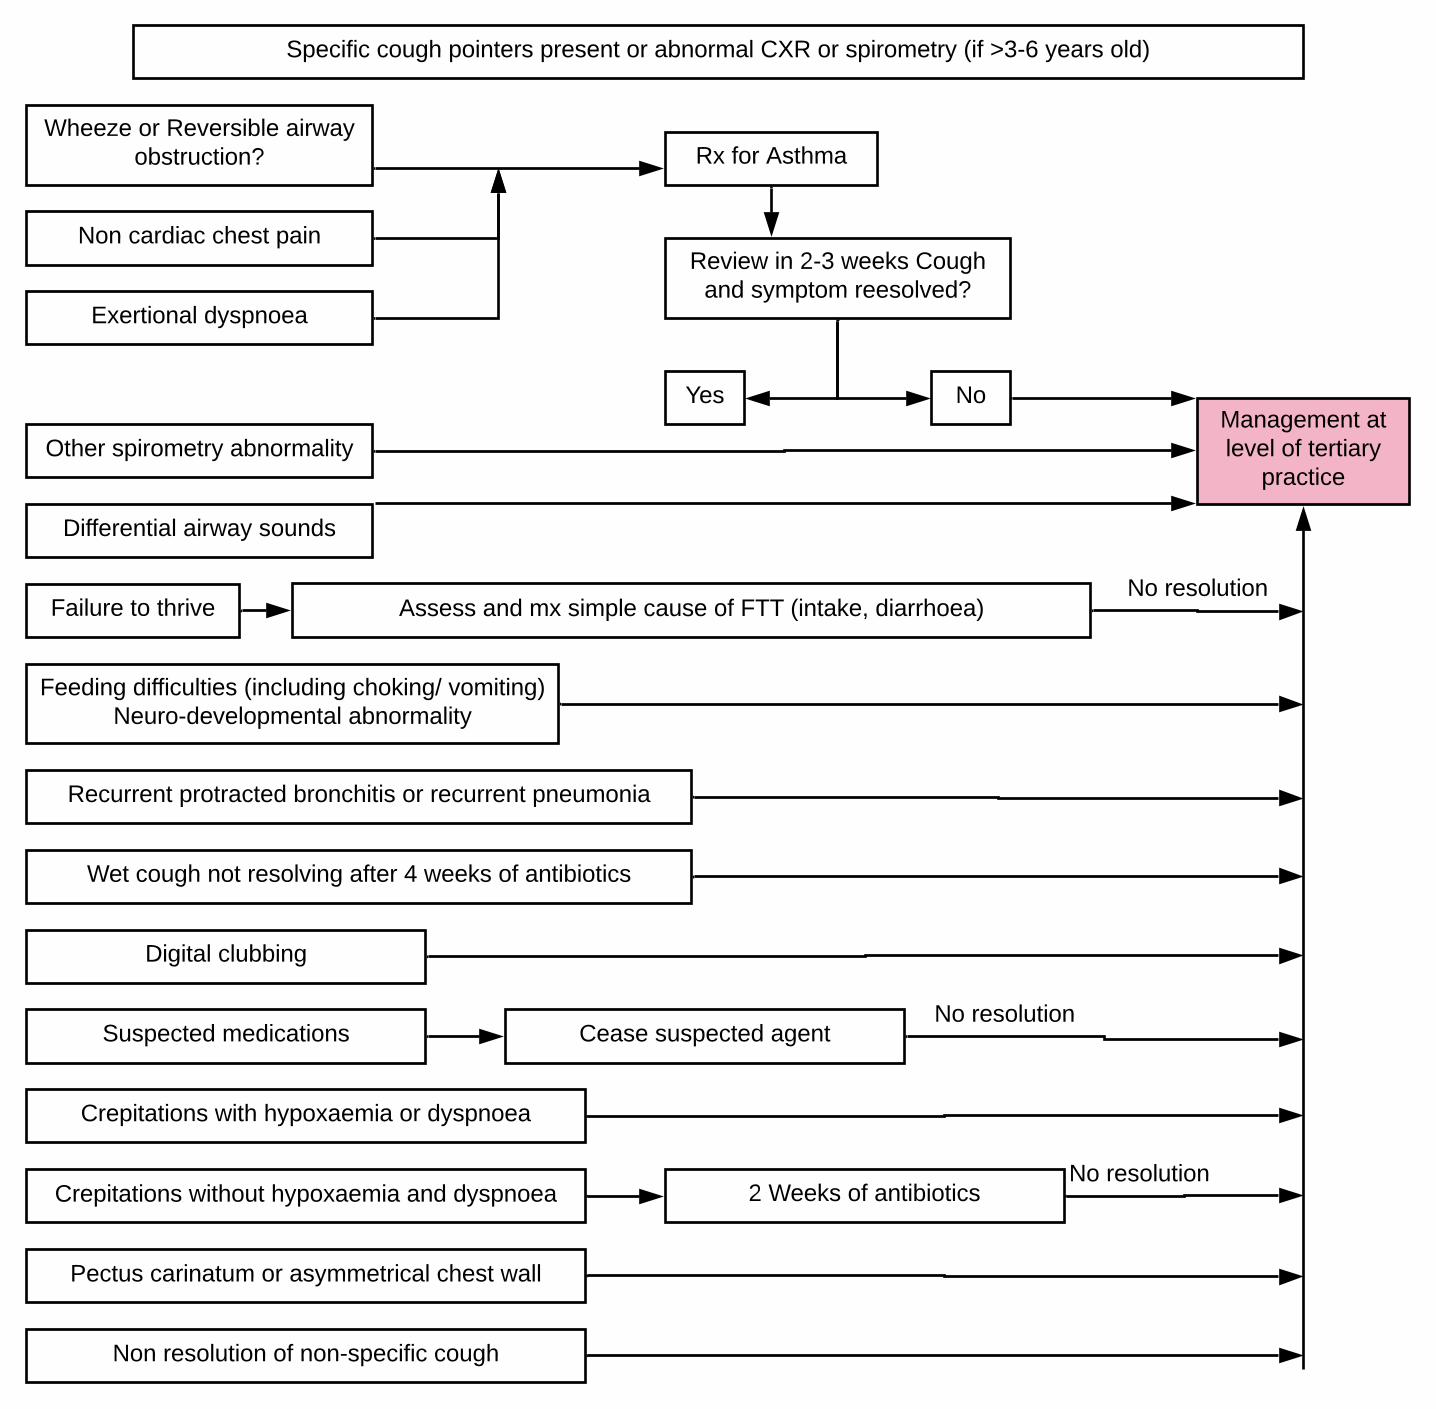
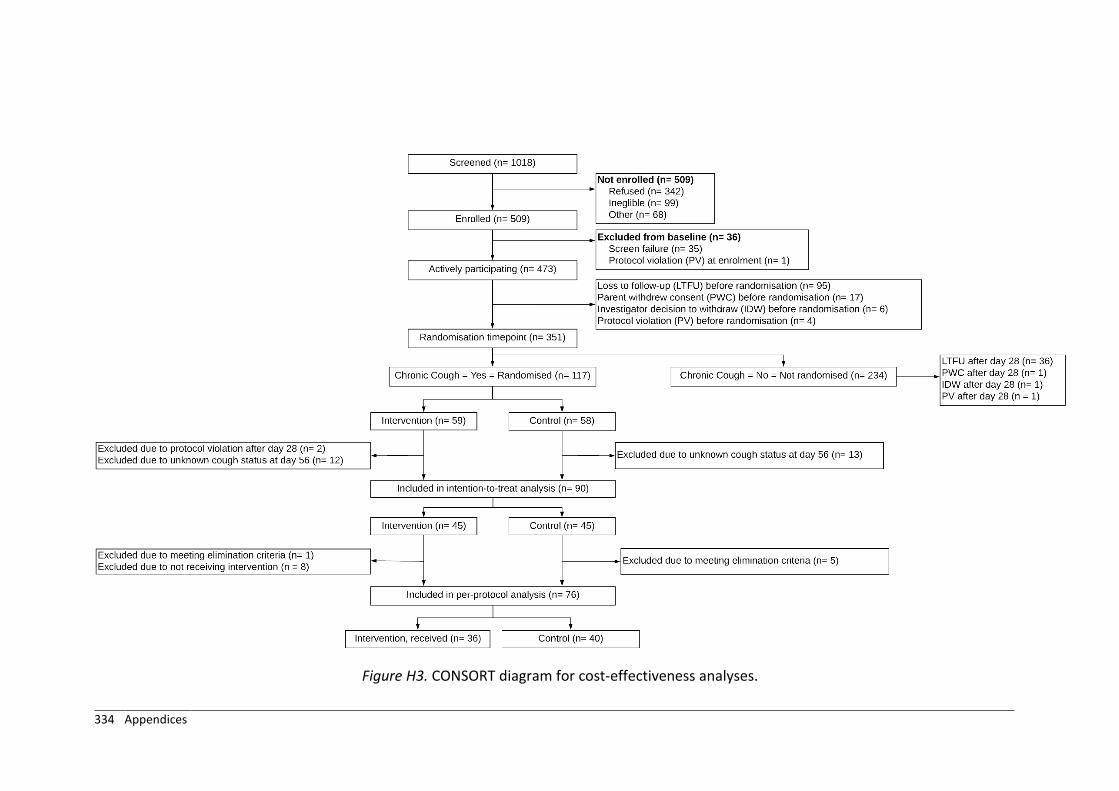
334 Appendices
Figure H3. CONSORT diagram for cost-effectiveness analyses.


![[Pharma] cough](https://img.dokumen.tips/doc/110x75/55ac456e1a28ab7f538b4570/pharma-cough.jpg)