Embed Size (px)
Citation preview

E n e r g y R e s e a r c h a n d De v e l o p m e n t Di v i s i o n F I N A L P R O J E C T R E P O R T
BURBANK WATER AND POWER AMERICAN RECOVERY AND REINVESTMENT ACT SMART GRID PROGRAM
NOVEMBER 2014 CEC-500 -2015-010
Prepared for: California Energy Commission Prepared by: Burbank Water and Power

PREPARED BY: Primary Author: Bruce M. Hamer Burbank Water and Power Burbank, California Contract Number: PIR-11-017 Prepared for: California Energy Commission Steve Ghadiri Contract Manager
Fernando Pina Office Manager Energy Systems Research Office
Laurie ten Hope Deputy Director ENERGY RESEARCH AND DEVELOPMENT DIVISION
Robert P. Oglesby Executive Director
DISCLAIMER This report was prepared as the result of work sponsored by the California Energy Commission. It does not necessarily represent the views of the Energy Commission, its employees or the State of California. The Energy Commission, the State of California, its employees, contractors and subcontractors make no warranty, express or implied, and assume no legal liability for the information in this report; nor does any party represent that the uses of this information will not infringe upon privately owned rights. This report has not been approved or disapproved by the California Energy Commission nor has the California Energy Commission passed upon the accuracy or adequacy of the information in this report.

i
PREFACE
The California Energy Commission Energy Research and Development Division supports
public interest energy research and development that will help improve the quality of life in
California by bringing environmentally safe, affordable, and reliable energy services and
products to the marketplace.
The Energy Research and Development Division conducts public interest research,
development, and demonstration (RD&D) projects to benefit California.
The Energy Research and Development Division strives to conduct the most promising public
interest energy research by partnering with RD&D entities, including individuals, businesses,
utilities, and public or private research institutions.
Energy Research and Development Division funding efforts are focused on the following
RD&D program areas:
Buildings End-Use Energy Efficiency
Energy Innovations Small Grants
Energy-Related Environmental Research
Energy Systems Integration
Environmentally Preferred Advanced Generation
Industrial/Agricultural/Water End-Use Energy Efficiency
Renewable Energy Technologies
Transportation
Burbank Water and Power American Recovery and Reinvestment Act Smart Grid Program is the final
report for the Burbank Water And Power American Recovery And Reinvestment Act Smart
Grid Program project (contract number PIR-11-017,) conducted by Bubank Water and Power.
The information from this project contributes to Energy Research and Development Division’s
Energy Technology Systems Integration program area.
For more information about the Energy Research and Development Division, please visit the
Energy Commission’s website at www.energy.ca.gov/research/ or contact the Energy
Commission at 916-327-1551.

ii
ABSTRACT
This report describes Burbank Water and Power’s Smart Grid program and the results achieved.
With a completed cost of $50.8 million, funded in part by a $20 million U.S. Department of
Energy Smart Grid Investment Grant, and a $1 million grant from the California Energy
Commission, Burbank Water and Power’s Smart Grid program includes a comprehensive
approach with multiple modernization projects. Most functional areas of the electric utility were
involved, with projects covering communications, metering, command and control, security,
improved business systems, distribution automation, retail customer programs, and
demonstrations. Implemented between 2006 and 2014, the program supports Burbank’s
Community Sustainability goals, and enables Burbank Water and Power to provide cost
effective, reliable, and high quality electric and water services.
Specific Smart Grid projects are described in detail, including implementing a hybrid fiber optic
and wireless communication network and Advanced Meter Infrastructure for electric meters.
The Advanced Meter Infrastructure project’s concept development and deployment plan are
discussed. The water Advanced Meter Infrastructure project, performed in parallel with the
Smart Grid program, was completed. Also, an electric vehicle charging infrastructure program
is also described along with sales performance results. Key benefits derived from the Smart
Grid implementations and lessons learned during the program are identified.
Burbank Water and Power is a municipal utility with a 17-square mile service territory in
Southern California. The utility employs approximately 340 workers and delivers power to
approximately 45,000 residential, 6,500 commercial and 200 industrial customers, as well as
providing water to 27,000 customers.
Keywords: BWP Smartgrid Project, Burbank Water and Power (BWP) American Recovery and
Reinvestment Act Grant, Burbank Water and Power Sustainability Efforts
Please use the following citation for this report:
Hammer, Bruce M. (Burbank Water and Power). 2015. Burbank Water and Power American
Recovery and Reinvestment Act Smart Grid Program. California Energy Commission.
Publication number: CEC-500-2015-010.
iii
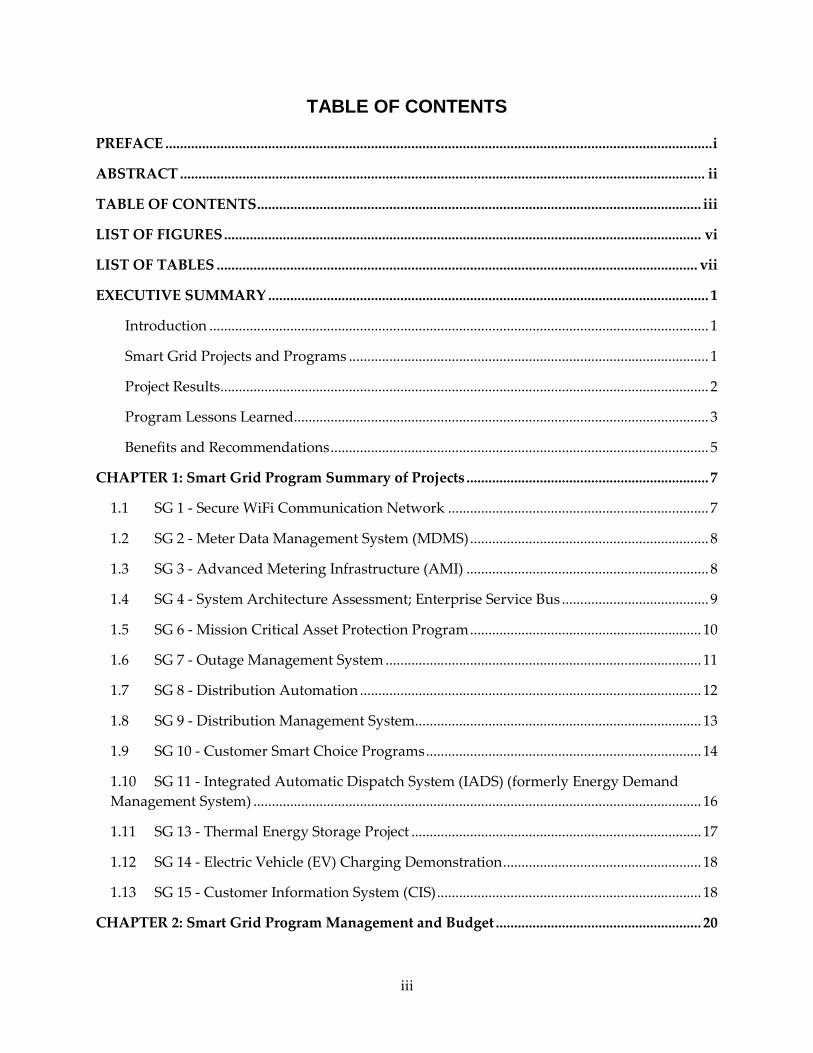
TABLE OF CONTENTS
PREFACE ..................................................................................................................................................... i
ABSTRACT ............................................................................................................................................... ii
TABLE OF CONTENTS ......................................................................................................................... iii
LIST OF FIGURES .................................................................................................................................. vi
LIST OF TABLES ................................................................................................................................... vii
EXECUTIVE SUMMARY ........................................................................................................................ 1
Introduction ........................................................................................................................................ 1
Smart Grid Projects and Programs .................................................................................................. 1
Project Results ..................................................................................................................................... 2
Program Lessons Learned................................................................................................................. 3
Benefits and Recommendations ....................................................................................................... 5
CHAPTER 1: Smart Grid Program Summary of Projects .................................................................. 7
1.1 SG 1 - Secure WiFi Communication Network ....................................................................... 7
1.2 SG 2 - Meter Data Management System (MDMS) ................................................................. 8
1.3 SG 3 - Advanced Metering Infrastructure (AMI) .................................................................. 8
1.4 SG 4 - System Architecture Assessment; Enterprise Service Bus ........................................ 9
1.5 SG 6 - Mission Critical Asset Protection Program ............................................................... 10
1.6 SG 7 - Outage Management System ...................................................................................... 11
1.7 SG 8 - Distribution Automation ............................................................................................. 12
1.8 SG 9 - Distribution Management System.............................................................................. 13
1.9 SG 10 - Customer Smart Choice Programs ........................................................................... 14
1.10 SG 11 - Integrated Automatic Dispatch System (IADS) (formerly Energy Demand
Management System) .......................................................................................................................... 16
1.11 SG 13 - Thermal Energy Storage Project ............................................................................... 17
1.12 SG 14 - Electric Vehicle (EV) Charging Demonstration ...................................................... 18
1.13 SG 15 - Customer Information System (CIS) ........................................................................ 18
CHAPTER 2: Smart Grid Program Management and Budget ........................................................ 20

iv
2.1 Project Management Process .................................................................................................. 20
CHAPTER 3: Communication Systems .............................................................................................. 22
3.1 BWP’s Smart Grid Vision ........................................................................................................ 22
3.2 Migration to IP Networks ....................................................................................................... 23
3.3 Ethernet Switched Services Network (ESSN) ...................................................................... 24
3.4 Wireless Network Design Criteria ......................................................................................... 25
3.5 Tropos Wi-Fi Mesh Network .................................................................................................. 26
3.6 Network Design and Construction ........................................................................................ 28
3.7 Network Operations Center (NOC) ...................................................................................... 30
3.8 BWP’s ONE Burbank Program .............................................................................................. 30
CHAPTER 4: Advanced Metering Infrastructure Systems ............................................................. 32
4.1 Selection of BWP’s Electric AMI System ............................................................................... 32
4.2 Planning Electric Meter Deployment .................................................................................... 34
4.3 Customer Notifications and Electric AMI Opt-Out ............................................................ 35
4.4 Electric Meter Deployment Process ....................................................................................... 36
CHAPTER 5: Water Leak Detection .................................................................................................... 39
5.1 Water Meter Deployment ....................................................................................................... 39
5.2 Water Leak Detection .............................................................................................................. 39
CHAPTER 6: Electric Vehicles .............................................................................................................. 44
6.1 Electric Utilities’ Role in Supporting Plug-in Electric Vehicles (PEVs) ............................ 44
6.2 BWP PEV Programs ................................................................................................................. 45
6.3 Electric Retail Sales Policy Issue ............................................................................................ 45
6.4 EV Charge Program Objectives .............................................................................................. 46
6.5 Host Right of Entry Agreements ............................................................................................ 46
6.6 Station Construction and Operation ..................................................................................... 47
6.7 EV Charge Program Service Results ..................................................................................... 47
6.7.1 Energy Delivery ................................................................................................................ 47
6.7.2 Green House Gas Saving................................................................................................. 48
v
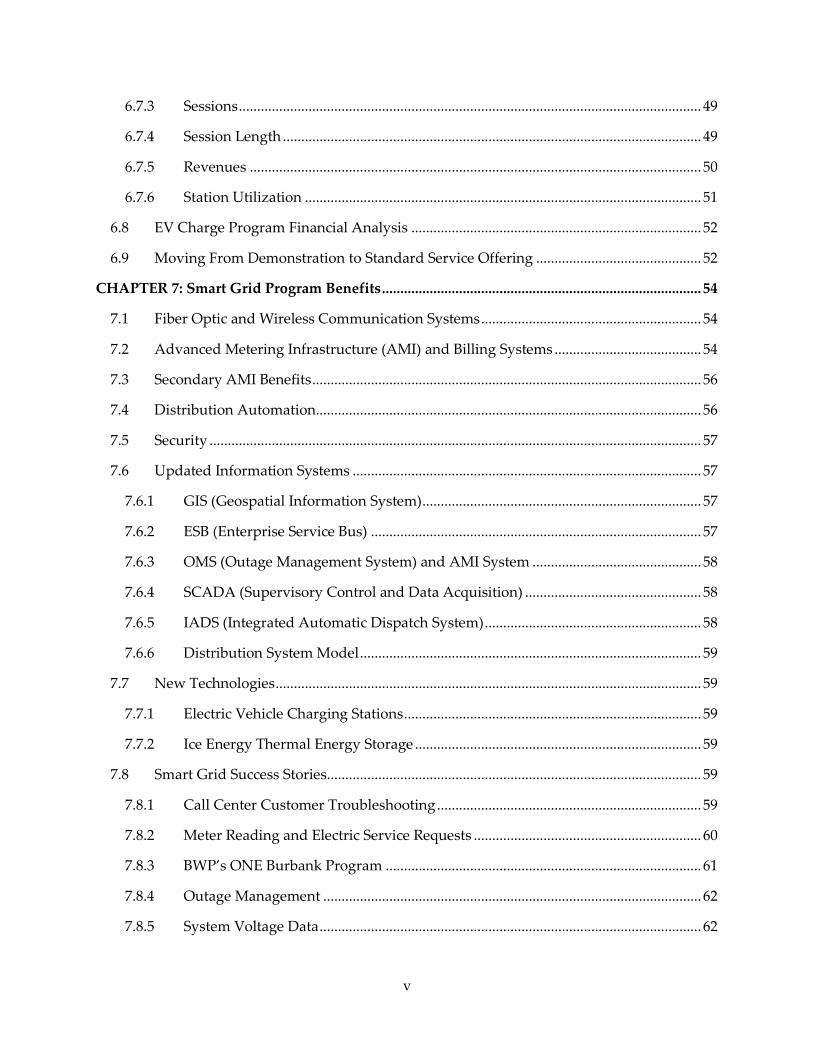
6.7.3 Sessions .............................................................................................................................. 49
6.7.4 Session Length .................................................................................................................. 49
6.7.5 Revenues ........................................................................................................................... 50
6.7.6 Station Utilization ............................................................................................................ 51
6.8 EV Charge Program Financial Analysis ............................................................................... 52
6.9 Moving From Demonstration to Standard Service Offering ............................................. 52
CHAPTER 7: Smart Grid Program Benefits ....................................................................................... 54
7.1 Fiber Optic and Wireless Communication Systems ............................................................ 54
7.2 Advanced Metering Infrastructure (AMI) and Billing Systems ........................................ 54
7.3 Secondary AMI Benefits .......................................................................................................... 56
7.4 Distribution Automation......................................................................................................... 56
7.5 Security ...................................................................................................................................... 57
7.6 Updated Information Systems ............................................................................................... 57
7.6.1 GIS (Geospatial Information System) ............................................................................ 57
7.6.2 ESB (Enterprise Service Bus) .......................................................................................... 57
7.6.3 OMS (Outage Management System) and AMI System .............................................. 58
7.6.4 SCADA (Supervisory Control and Data Acquisition) ................................................ 58
7.6.5 IADS (Integrated Automatic Dispatch System) ........................................................... 58
7.6.6 Distribution System Model ............................................................................................. 59
7.7 New Technologies .................................................................................................................... 59
7.7.1 Electric Vehicle Charging Stations ................................................................................. 59
7.7.2 Ice Energy Thermal Energy Storage .............................................................................. 59
7.8 Smart Grid Success Stories ...................................................................................................... 59
7.8.1 Call Center Customer Troubleshooting ........................................................................ 59
7.8.2 Meter Reading and Electric Service Requests .............................................................. 60
7.8.3 BWP’s ONE Burbank Program ...................................................................................... 61
7.8.4 Outage Management ....................................................................................................... 62
7.8.5 System Voltage Data ........................................................................................................ 62

vi
7.8.6 GRIDview Software Data Analytics .............................................................................. 64
7.8.7 Water Leak Detection ...................................................................................................... 65
CHAPTER 8: Smart Grid Program Lessons Learned ........................................................................ 67
8.1 General Program Lessons ....................................................................................................... 67
8.2 Project Management Lessons ................................................................................................. 68
8.3 Communications and Smart Grid Core Systems (Wireless, AMI) .................................... 70
8.4 Command and Control Systems (SCADA, OMS, IADS) .................................................... 71
8.5 Distribution Automation......................................................................................................... 71
8.6 Business Systems (GIS, ESB, CIS) .......................................................................................... 72
8.7 Retail Customer Services Lessons .......................................................................................... 73
GLOSSARY .............................................................................................................................................. 75
LIST OF FIGURES
Figure 1: Fiber/Wireless Network Conceptual Model ........................................................................ 26
Figure 2: A Typical Tropos Radio Installation with Collocated Trilliant Collector Radio ............ 30
Figure 3: Water Meter with Apparent Water Leak ............................................................................. 39
Figure 4: Listing of Leaks ........................................................................................................................ 40
Figure 5: Data for an Individual Customer’s Leak .............................................................................. 41
Figure 6: Comparison of One Day’s Interval Data with Day From Previous Month ..................... 42
Figure 7: Data Confirming Leak Resolution ........................................................................................ 43
Figure 8: Energy Delivery ....................................................................................................................... 48
Figure 9: Green House Gas Savings ...................................................................................................... 48
Figure 10: Sessions ................................................................................................................................... 49
Figure 11: Session Length ....................................................................................................................... 50
Figure 12: Revenues ................................................................................................................................. 50
Figure 13: Station Utilization .................................................................................................................. 51
Figure 14: AMI Meter Voltage Data ...................................................................................................... 63
Figure 15: GRIDview Software Sample Screen Shot ........................................................................... 65

vii
Figure 16: Water Meter with Apparent Water Leak ........................................................................... 66
LIST OF TABLES
Table 1: Program Budget Summary ...................................................................................................... 21
Table 2: Schedule of Systems Deployed from 2006 – 2011 with Construction and In-Service
Sequence .................................................................................................................................................... 29
1
EXECUTIVE SUMMARY
Introduction
Fundamental changes are underway in the electric utility industry that will significantly
increase the need for utilities to monitor and actively manage energy flow and use on their
systems. Utilities are already experiencing challenges integrating more renewable resources,
including adding distributed rooftop solar into the electric grid and reducing greenhouse gases
and other pollutant emissions, while preparing for increased electric demand to support
transportation electrification. By modernizing and developing a comprehensive integrated and
secure smart grid, electric utilities can better manage the electric system, promote conservation,
expand renewable resources, and increase reliability. These programs also support community
sustainability goals, and in some cases support water conservation.
Burbank Water and Power (BWP) is a municipal utility with a 17-square mile service territory in
Southern California. The utility delivers power to approximately 45,000 residential, 6,500
commercial and 200 industrial customers, as well as providing water to 27,000 customers.
The BWP Smart Grid program integrated multiple secure, intelligent Smart Grid infrastructure
systems, and control processes into the utility’s electric system. Beginning in 2009 and
completed in March 2014, the program was initially conceived as the modernization of many
functional areas of the utility and based on a high performing fiber optic and wireless
communication network. Grant funding from a US Department of Energy Smart Grid
Investment Grant and a California Energy Commission Public Interest Energy Research grant
provided funds that accelerated components of BWP’s modernization efforts. This report
provides an overview of the completed program, including final work scope, cost, and schedule
performance. Several successful aspects of the program are described, along with key lessons
learned, and may be helpful to other utilities developing a smart grid.
Smart Grid Projects and Programs
The Smart Grid program included the following projects and programs:
Secure Wi-Fi Communication Network
Meter Data Management System
Advanced Metering Infrastructure (AMI)
System Architecture Assessment; Enterprise Service Bus
Mission Critical Asset Protection Program
Outage Management System
Distribution Automation
Distribution Management System
Customer Smart Choice Programs
Integrated Automatic Dispatch System
Thermal Energy Storage Project
Electric Vehicle Charging Demonstration Project
2
Customer Information System
Project Results
Advanced Communication Systems
BWP recognized early in the program that advanced communication and information systems
would enable high-speed controls necessary to integrate renewable resources, manage
distributed generation and demand response, and help prevent blackouts. Monitoring and
controlling electricity at the point of use is fundamental to all smart grid systems and the
responsiveness of monitoring and control is one of the essential requirements of automatic
control applications. BWP’s vision for its Smart Grid program evolved to include upgrading the
fiber optic network to a high performing carrier class network, and integrating this with a wide
area wireless network that provides connectivity to customer metering systems, distribution
automation of field devises, and support for mobile data for field personnel. This core
communication system is the foundation for modernizing equipment and information systems
for grid operations, command, and control, and various business systems.
Advanced Metering Infrastructure
The utility industries’ evolution to Smart Meters has provided additional functionality and
efficiency. With advanced two-way communications, these meters offer near real time reads to
the broad population of meters, power outage notification, and power quality monitoring. The
utility can set the frequency of reading, often every 5, 15 or 60 minutes. Time differentiated
readings enable new billing structures that vary by time of day and season. Meters with remote
operated on/off service switches enable much faster service connection and reduced utility
costs. These new features greatly expand the capabilities of utilities to inform customers of
usage patterns, leading to advanced strategies to manage energy use and incorporate new
renewable energy resources. Furthermore, water conservation efforts by BWP have helped its
customers realize the benefits of an environmentally sustainable project in its community.
New Security Requirements
Implementing BWP’s Smart Grid program required a greater focus and management of
physical and cyber security and resulted in improved security for information systems, data
and physical assets, a safer work environment and lower theft. It also increased video
monitoring of electric and water facilities. More monitoring and greater control of data
networks, and cyber security is being achieved with new security systems.
Data Architecture and Upgraded Information Systems
New Smart Grid systems provide a significant increase in data flow to/from customer sites, field
facilities, and information and control systems centrally located at BWP. Some of this
information is envisioned to be used for near real-time command and control functions, and
much of the data will flow into Back Office functions. A data architecture assessment and plan
is prudent to prepare for big data flows, along with a migration to an Enterprise Service Bus
and virtual machine server architecture. BWP’s Smart Grid program included upgrades to

3
several BWP business systems including the Geospatial Information System, Supervisory
Control and Data Acquisition, Outage Management System, system model, and asset
management.
The existing Geospatial Information System version was upgraded and all electric grid assets
were accurately added to the database. This included station circuit logic to support interfaces
with Supervisory Control and Data Acquisition, Outage Management System, Work and Asset
Management, Integrated Automatic Dispatch System, power flow model, and a future
Distributed Management System. Retrieval and confirmation of the existing as-built plans for
operations and maintenance purposes are also performed with higher accuracy and simplicity.
This reduces costs and speeds service delivery throughout the work process. Furthermore, it
allows better asset management with an accurate inventory and location of distribution system
assets.
BWP’s Smart Grid program includes several elements to enhance management of electric
system outages. The Outage Management System was also version upgraded and integrated
with the Geospatial Information System. The last steps were to integrate the Outage
Management System with the AMI Meter Management system and the new Customer
Information System. The Outage Management System provides grid operators and Customer
Call center staff a grid map showing the location of meters without power. This information is
updated in near real time, and is used to direct and manage field crews to restore power, and
allows the Call Center to communicate outage location and estimate return to service
information to customers. Field personnel also use the Outage Management System to get
restoration assignments and to report status. When an outage event is occurring, the outage
information is provided in a greeting message for all incoming customer calls. The message
explains outage locations, estimated restoration times and gives customers a call back option to
notify of service restoration.
Water Leak Detection
During 2009 and 2010, BWP’s Water Department installed Itron Save Source AMI capability to
all its 27,000 water customers. The system collects and stores hourly water meter reads, and is
integrated to the Smart Grid program-funded wireless communications network, Meter Data
Management System and new billing system. This effort has benefitted Call Center
troubleshooting and reduced meter reading costs. It has also provided significant benefits in
water leak detection that was not possible before the AMI installation.
Program Lessons Learned
Several key lessons learned from this program are identified and may be helpful to other
utilities involved in system modernization:
1. Conduct a data architecture analysis and study early on to identify the overall scope of
information systems, interfaces, and provide a roadmap for development. Get
management team support for the roadmap to enforce decisions during the program,
and afterwards.

4
2. Deploy Virtual Machine Servers and Enterprise Service Bus early to support system
deployments. Realize that migration to the Enterprise Service Bus will happen over time
and will require reinforcement and continual support by the management team.
Continuing to make point to point connections will work against Enterprise Service Bus
implementation.
3. Seek opportunities to leverage investments for new revenues such as fiber optics
4. Modernization benefits from evolving the business organization to include staffing for
Operational Technology in addition to Information Technology. Operational Technology
plays an important role to bridge the gap between Information Technology and the
operating units that are focused on business functions, grid operations and reliability.
Operational Technology also helps the line organizations identify, implement and
maintain complex new network and information systems and is helpful to establish a
division of responsibility to clarify job requirements, authorities and who does what.
5. Organizational resistance to change and failure to revise and update work processes are
common obstacles to achieving the full benefits of investments in modernization
projects. Actions that can mitigate these challenges include:
Create ownership and anticipation by requiring end user groups to participate in
project scoping, deployment and start up.
Early in the program, establish organizational plans (Resource, Data Architecture,
Security, etc.) that clarify organizational goals, objectives and policy. Ongoing
management support for the organizational plans helps focus priorities and decision
making.
During scoping, perform Use Case analysis that helps the end user group
understand how the specific system or asset under development will be used and
the expected benefits to them.
During project scoping, engage the project team to brainstorm potential work
process re-engineering opportunities. Develop these during the implementation
phase of the project. Identify work process reengineering tasks and personnel
resources in the project plan.
Create a “Learning Organization” culture that provides a safe environment for idea
creation and evaluation, and encourages staff to leverage Smart Grid investments to
develop and implement new ways and processes to meet organizational goals.
6. Communication systems and data networks are crucial to modernization. Plan
communication systems to support wide range of applications/systems. Fiber optics are
the future trend of advanced communication system, which provide exceptional
capacity solution, however, need to implement communication systems early in the
modernization program. Deploy communications and wireless before AMI meter
installation so that the new meters are rapidly brought on-line and verified.

5
Benefits and Recommendations
The BWP Smart Grid program provides a wide range of benefits that cross many functional
areas of the utility. Some benefits were available immediately at completion of the respective
project, and many benefits are expected in the future. Also it is important to note that many
Smart Grid components work together as a system with a wide range of direct and indirect
benefits.
The electric AMI meters are providing a wealth of data on energy usage, system voltage and
other technical data. Prior to the AMI, system operators only had this data at electric stations,
grid intertie points and very few field devices. With AMI, this technical data is now available at
almost every customer service location. Voltage sag and swell events are reported daily as well
as time interval voltages. In initial operations, the data is reported by the meters and retained in
the Meter Data Management System. Operators and engineering staff are beginning to extract
this system data for operational assessments and engineering studies. The AMI meter data has
quickly become an essential tool in troubleshooting voltage problems. Swift problem resolution
helps mitigate potentially hazardous situations and avoids potential damage to equipment and
property. Engineering staff is evaluating new ways to use voltage data proactively to avoid
such problems in the future.
Modernizing systems and implementing smart grid technologies and programs help utilities
address the many new challenges on the horizon.

6
A blank page is inserted to insure Chapter 1 starts on an odd number page. Blank pages are not
labeled.
7
CHAPTER 1: Smart Grid Program Summary of Projects
The Burbank Water and Power (BWP) Smart Grid Program is a comprehensive integration of
multiple intelligent Smart Grid infrastructure and information systems designed to modernize
the BWP electrical energy delivery systems and Customer Services. The core objectives of the
program were to:
“Modernize BWP electric and water systems to improve service to our Customers; promote energy and
water efficiency and demand management; integrate renewable resources, and improve operational
efficiencies.”
The original program plan identified 14 separate but interrelated projects or programs, each
with designated Project Managers. In the process of preparing Project Charters to obtain
management authorization for each project, one project was added, and some were deferred
until after completing the Smart Grid Investment Grant (SGIG) implementation period.
The following is a description of all projects that have been completed.
1.1 SG 1 - Secure WiFi Communication Network
BWP recognized early that high capacity, secure communications networks were the key
foundation for utility modernization. A fiber optic network, started in the 1980s, was expanded
and utility grade metro Ethernet equipment was installed just prior to receiving the SGIG
funding. Some additions to the fiber optic network were funded by the Smart Grid program.
This fiber optic network was leveraged to provide wireless network connectivity throughout
Burbank.
The Wifi project was deployed and placed in-service in 2010 and 2011. It includes deployment
of a secure WiFi mesh network over the entire city of Burbank to be used for utility
communications with Advanced Metering Infrastructure (AMI) systems, Distribution
Automation facilities, mobile workforce data communications, and potentially limited City
public safety mobile data communications. The network is restricted for utility and City use for
security and capacity reasons, and will not be used for public Internet access.
An initial Proof of Concept wireless network was deployed in 2009 and 2010 which verified
operational performance of the network. A detailed Radio Frequency (RF) design of the
network was prepared, and the system was deployed in 2010. Within BWP’s 17 square mile
service area, the network consists of 410 Tropos 7320 dual band mesh router radios (24 radios
per square mile), with 59 fiber optic gateways. This high density of radios and interconnection
with the fiber optic network creates a very high performing, low latency network. The wireless
network is interconnected with the electric and water AMI RF systems. Additionally, all radios
have element management capability allowing BWP’s contract 24x7 Network Operations Center
(NOC) to immediately identify any radio failures.
8
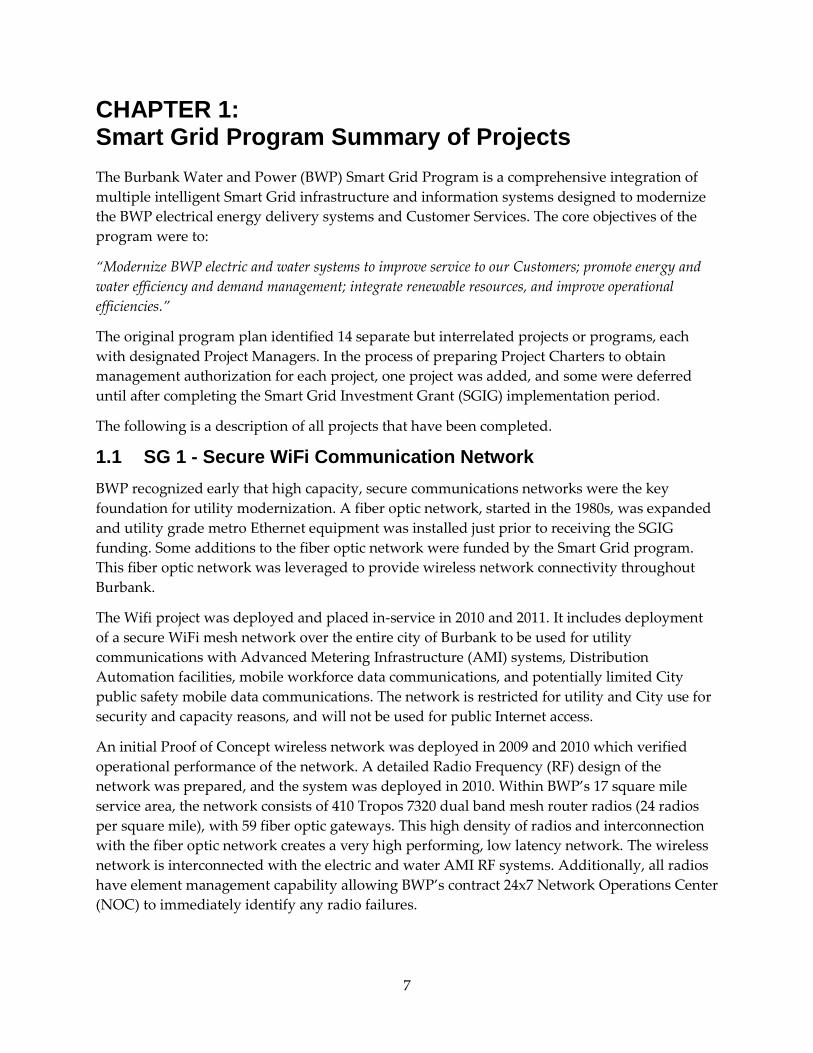
Project Summary
Schedule: January 2009 – June 2011
Project Charter Total Project: $4,151,500
Actual Total Costs: $4,426,350
1.2 SG 2 - Meter Data Management System (MDMS)
A Siemens eMeter Energy IP MDMS was installed and integrated with the Banner Billing
System and Trilliant head end. It was later integrated with the new TIBCO Enterprise Service
Bus and Oracle Customer Care and Billing System (CC&B). Phase 1 included Meter-to-Cash
functionality that enabled AMI meter data to automatically flow daily to the MDMS and then
into the Banner Billing system, which went into live production August 2010. Phase 2A
consisting of AMI meter remote service connect or disconnect is complete and went live June
2011. Phase 2B was integration of MDMS to the Telvent Responder Outage Management
System (OMS) which is complete. Phase 3 consisting of initial interfaces with the new TIBCO
Enterprise Service Bus (ESB) is complete. A planned MDMS software version upgrade was
evaluated and deleted from the project because of cost and schedule impacts that were not
financially justified. The last phase of MDMS work was integration with the CC&B Customer
Information System which is also complete.
Following the SGIG implementation period, the MDMS is expected to be integrated with the
Distribution Management System and other systems as appropriate.
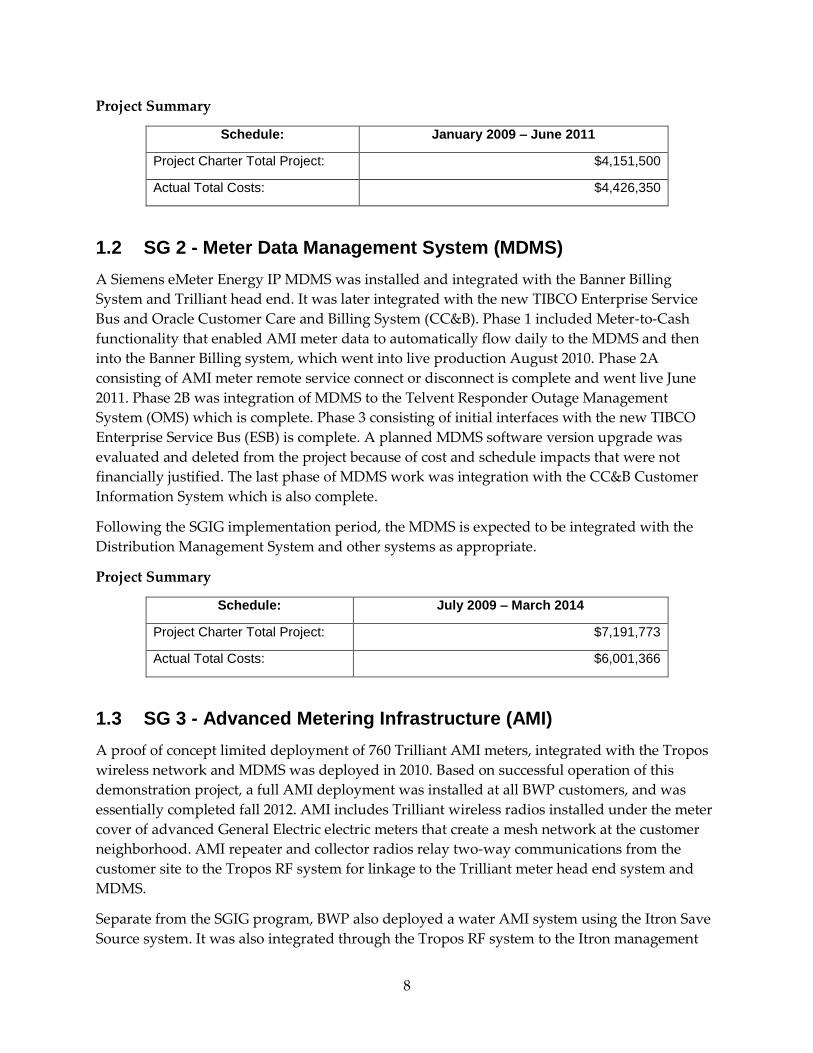
Project Summary
Schedule: July 2009 – March 2014
Project Charter Total Project: $7,191,773
Actual Total Costs: $6,001,366
1.3 SG 3 - Advanced Metering Infrastructure (AMI)
A proof of concept limited deployment of 760 Trilliant AMI meters, integrated with the Tropos
wireless network and MDMS was deployed in 2010. Based on successful operation of this
demonstration project, a full AMI deployment was installed at all BWP customers, and was
essentially completed fall 2012. AMI includes Trilliant wireless radios installed under the meter
cover of advanced General Electric electric meters that create a mesh network at the customer
neighborhood. AMI repeater and collector radios relay two-way communications from the
customer site to the Tropos RF system for linkage to the Trilliant meter head end system and
MDMS.
Separate from the SGIG program, BWP also deployed a water AMI system using the Itron Save
Source system. It was also integrated through the Tropos RF system to the Itron management
9
system, MDMS and billing system. This installation to 27,000 water meters was completed in
2011.
During Trilliant deployment a small number of customers raised concerns about RF radiation
health impacts, invasion of privacy and meter data security. These issues were thoroughly
investigated, researched and vetted with the Burbank City Council, resulting in a limited offer
Opt-Out program. Privacy and data security concerns were addressed, and those customers
with RF concerns were offered a one-time choice of an AMI meter with RF card removed, thus
requiring manual meter reading, all for a one-time charge of $75 and monthly recurring charge
of $10 to pay for manual meter reads.
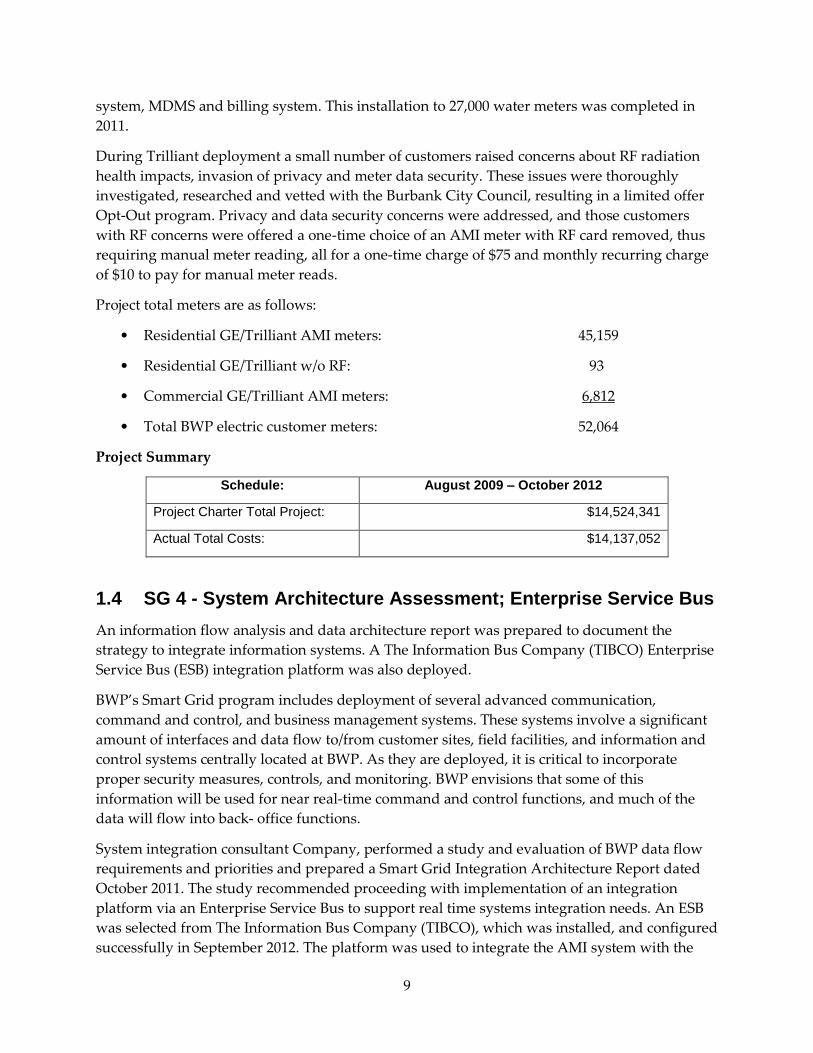
Project total meters are as follows:
• Residential GE/Trilliant AMI meters: 45,159
• Residential GE/Trilliant w/o RF: 93
• Commercial GE/Trilliant AMI meters: 6,812
• Total BWP electric customer meters: 52,064
Project Summary
Schedule: August 2009 – October 2012
Project Charter Total Project: $14,524,341
Actual Total Costs: $14,137,052
1.4 SG 4 - System Architecture Assessment; Enterprise Service Bus
An information flow analysis and data architecture report was prepared to document the
strategy to integrate information systems. A The Information Bus Company (TIBCO) Enterprise
Service Bus (ESB) integration platform was also deployed.
BWP’s Smart Grid program includes deployment of several advanced communication,
command and control, and business management systems. These systems involve a significant
amount of interfaces and data flow to/from customer sites, field facilities, and information and
control systems centrally located at BWP. As they are deployed, it is critical to incorporate
proper security measures, controls, and monitoring. BWP envisions that some of this
information will be used for near real-time command and control functions, and much of the
data will flow into back- office functions.
System integration consultant Company, performed a study and evaluation of BWP data flow
requirements and priorities and prepared a Smart Grid Integration Architecture Report dated
October 2011. The study recommended proceeding with implementation of an integration
platform via an Enterprise Service Bus to support real time systems integration needs. An ESB
was selected from The Information Bus Company (TIBCO), which was installed, and configured
successfully in September 2012. The platform was used to integrate the AMI system with the

10
MDMS which automated the once manual procedure of processing meter files and was
deployed in December 2012. Over time, several existing and new BWP information systems and
software version upgrade projects will incorporate a common information module to exchange
information. Eventually, most information systems will be integrated at the ESB rather than
traditional point to point interface methods.
One additional aspect of the Smart Grid program was to transition several information systems
to use Virtual Machine server technology. These systems use management software which
partitions multiple blade servers integrated in computer chassis, simulating multiple servers on
only a few devices. This technology provides reliability, flexibility, operational efficiencies and
redundancy as applications are significantly expanded.
Project Summary
Schedule: September 2009 – September 2012
Project Charter Total Project: $1,195,120
Actual Total Costs: $1,036,474
1.5 SG 6 - Mission Critical Asset Protection Program
Smart Grid implementation expanded BWP’s technology and related security risks. The Mission
Critical Asset Protection program included a comprehensive review of security needs,
regulations, threats, etc. and creation of an updated Security Plan, security policy and
procedures documentation, and enhancements in the hardware and systems deployed to
protect systems from security risks. The program addressed both cyber and physical asset
security risks. A Security Systems Manager was added to staff to develop and oversee security
planning and management.
The scope of the BWP Mission Critical Asset Program included the following general areas and
sub-components:
Physical Security applicable to the following assets and facilities:
BWP Campus protection, including personnel and vehicle entry and exit
Power plant control systems
Water Supervisory Control and Data Acquisition (SCADA) and pumping stations
Electric substation and switching station access and protection
Cyber Security for network systems:
Cyber Security for the Ethernet Switched Services Network (ESSN) Ethernet system,
Tropos Field Wireless Network, Electric SCADA Network, Water SCADA Network,
IT/City Network and Internet connections
11
Cyber Security for power plant control systems
Cyber Security for water operations systems
Data Security:
Data classification of information within BWP’s control
Protection of sensitive information entrusted to BWP such as Personally Identifiable
Information (PII)
Protection of sensitive BWP-specific information such as Critical Infrastructure
Information created and maintained by BWP
Compliance Program:
NERC CIP Conformance consisting of documentation and procedures to impose CIP
Compliance (45 documents), and Reliability Documents (558 documents)
Security Policy and Procedure record management and training
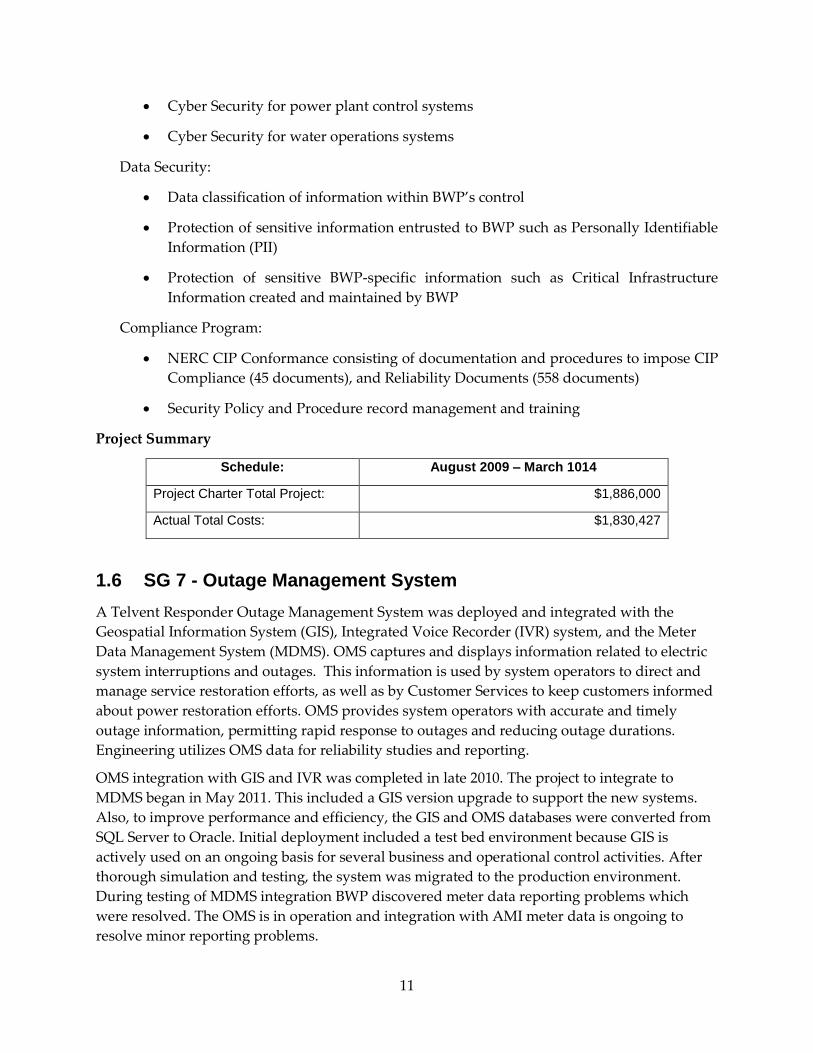
Project Summary
Schedule: August 2009 – March 1014
Project Charter Total Project: $1,886,000
Actual Total Costs: $1,830,427
1.6 SG 7 - Outage Management System
A Telvent Responder Outage Management System was deployed and integrated with the
Geospatial Information System (GIS), Integrated Voice Recorder (IVR) system, and the Meter
Data Management System (MDMS). OMS captures and displays information related to electric
system interruptions and outages. This information is used by system operators to direct and
manage service restoration efforts, as well as by Customer Services to keep customers informed
about power restoration efforts. OMS provides system operators with accurate and timely
outage information, permitting rapid response to outages and reducing outage durations.
Engineering utilizes OMS data for reliability studies and reporting.
OMS integration with GIS and IVR was completed in late 2010. The project to integrate to
MDMS began in May 2011. This included a GIS version upgrade to support the new systems.
Also, to improve performance and efficiency, the GIS and OMS databases were converted from
SQL Server to Oracle. Initial deployment included a test bed environment because GIS is
actively used on an ongoing basis for several business and operational control activities. After
thorough simulation and testing, the system was migrated to the production environment.
During testing of MDMS integration BWP discovered meter data reporting problems which
were resolved. The OMS is in operation and integration with AMI meter data is ongoing to
resolve minor reporting problems.
12
Project Summary
Schedule: August 2009 – March 2014
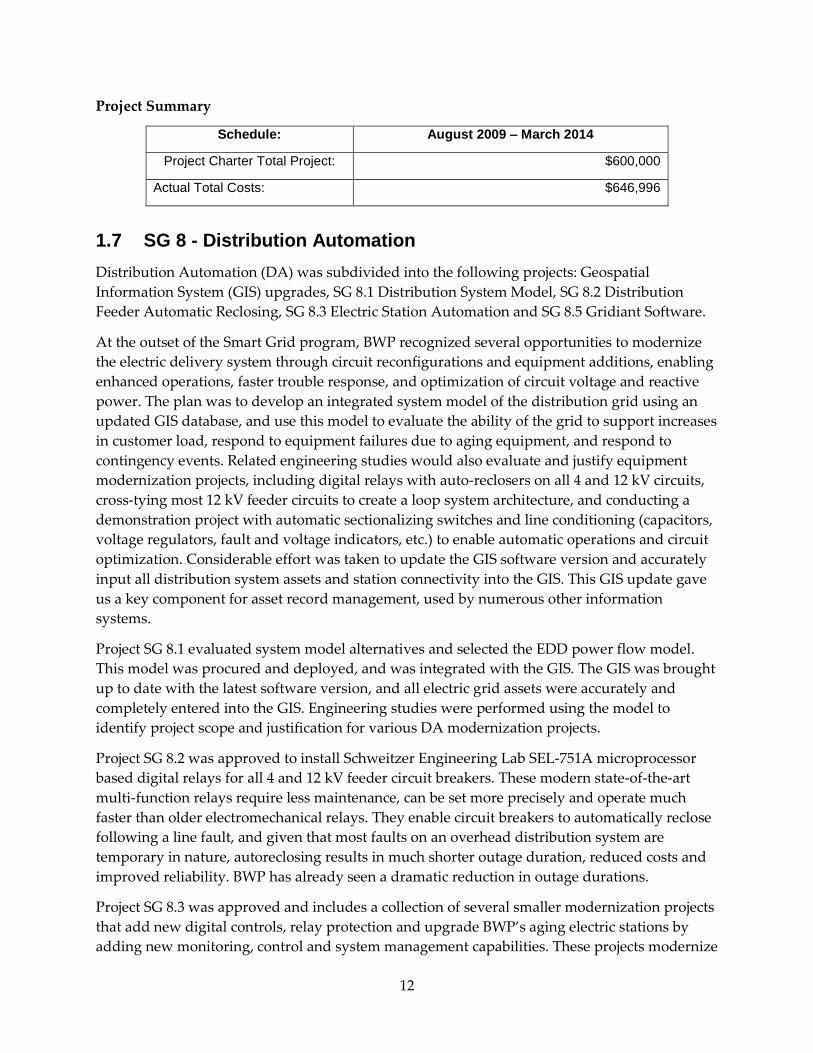
Project Charter Total Project: $600,000
Actual Total Costs: $646,996
1.7 SG 8 - Distribution Automation
Distribution Automation (DA) was subdivided into the following projects: Geospatial
Information System (GIS) upgrades, SG 8.1 Distribution System Model, SG 8.2 Distribution
Feeder Automatic Reclosing, SG 8.3 Electric Station Automation and SG 8.5 Gridiant Software.
At the outset of the Smart Grid program, BWP recognized several opportunities to modernize
the electric delivery system through circuit reconfigurations and equipment additions, enabling
enhanced operations, faster trouble response, and optimization of circuit voltage and reactive
power. The plan was to develop an integrated system model of the distribution grid using an
updated GIS database, and use this model to evaluate the ability of the grid to support increases
in customer load, respond to equipment failures due to aging equipment, and respond to
contingency events. Related engineering studies would also evaluate and justify equipment
modernization projects, including digital relays with auto-reclosers on all 4 and 12 kV circuits,
cross-tying most 12 kV feeder circuits to create a loop system architecture, and conducting a
demonstration project with automatic sectionalizing switches and line conditioning (capacitors,
voltage regulators, fault and voltage indicators, etc.) to enable automatic operations and circuit
optimization. Considerable effort was taken to update the GIS software version and accurately
input all distribution system assets and station connectivity into the GIS. This GIS update gave
us a key component for asset record management, used by numerous other information
systems.
Project SG 8.1 evaluated system model alternatives and selected the EDD power flow model.
This model was procured and deployed, and was integrated with the GIS. The GIS was brought
up to date with the latest software version, and all electric grid assets were accurately and
completely entered into the GIS. Engineering studies were performed using the model to
identify project scope and justification for various DA modernization projects.
Project SG 8.2 was approved to install Schweitzer Engineering Lab SEL-751A microprocessor
based digital relays for all 4 and 12 kV feeder circuit breakers. These modern state-of-the-art
multi-function relays require less maintenance, can be set more precisely and operate much
faster than older electromechanical relays. They enable circuit breakers to automatically reclose
following a line fault, and given that most faults on an overhead distribution system are
temporary in nature, autoreclosing results in much shorter outage duration, reduced costs and
improved reliability. BWP has already seen a dramatic reduction in outage durations.
Project SG 8.3 was approved and includes a collection of several smaller modernization projects
that add new digital controls, relay protection and upgrade BWP’s aging electric stations by
adding new monitoring, control and system management capabilities. These projects modernize

13
controls and equipment that are in some cases over 50 years old. Anticipated benefits include
remote and automatic switching which will improve crew safety by reducing arc-flash hazard,
and will also reduce outage durations. Automation of transformers, capacitors and voltage
regulators will enable significantly improved voltage control and will reduce losses while
improving power quality. New monitoring equipment will help locate and resolve fault
conditions and provide data for new reliability reporting requirements. Other safety and
operational efficiency improvements will be enabled.
Project SG 8.5 was to procure and install Gridiant software that provides a dashboard for easy
access and analysis of AMI meter voltage and loading data. The AMI and MDMS systems
collect voltage and loading data at 5 and 15 minute time intervals at virtually every customer
meter. This new software allows engineers and maintenance personnel to very easily evaluate
distribution transformer loading and voltages, feeder loading, substation loading, feeder section
loading, transformer loss-of-life and transformer total owning costs. This data also enables other
engineering analysis of distribution grid operations.
During the Smart Grid program, staff evaluated other potential DA projects. Specific projects
that were considered included cross tying some or all 12kV feeder circuits currently configured
in a radial in design, demonstrating automatic feeder sectionalizing switches, installing line
conditioning equipment such as field mounted voltage regulators and capacitor banks, and field
line sensing equipment. A key factor in evaluating and justifying DA projects is that BWP’s
electric grid already has a relatively high level of reliability, with low outage rates. Therefore it
was difficult to justify automation projects on the basis of improving reliability. Also, due to
changes in key engineering staff, limited construction forces, and the inability to develop
financial justifications, additional DA projects were deferred until completion of higher priority
projects.
Project Summary
Schedule: August 2009 – March 2014
Project Charter Total Project: $3,353,501
Actual Total Costs: $3,770,075
1.8 SG 9 - Distribution Management System
This project included a replacement upgrade of communication equipment at electric stations to
enable better security and control of equipment, and the evaluation and possible
implementation of a Distribution Management System (DMS). Existing Remote Terminal Units
(RTUs) required replacement because they were not capable of meeting updated security
protocols. This project replaced, tested and put into service upgraded RTUs at all electric
stations.
The DMS was envisioned to provide system operators with a geospatial view of the electric
grid. These systems display near realtime system condition information, and provide remote

14
control capability of feeders and the ability to analyze system configurations off line before
implementing with the energized system. This project was a companion to SG 8 Distribution
Automation that included updating GIS data to accurately represent all subtransmission,
distribution and station asset records, development of an Integrated System Model for power-
flow analysis, and integration with GIS, MDMS and OMS. Deploying and integrating
Distribution Automation, AMI, and DMS allows better management of distributed energy
resources, system optimization through phase balancing, voltage and var optimization, demand
response through voltage management, grid capacity expansion and other benefits
Studies were performed to evaluate DMS vendors and systems, and due to the immature state
of DMS software, and due to other work load that included deployment of several complex
information systems, the DMS project was deferred until 2015.
Project Summary
Schedule: September 2010 – December 2011
Project Charter Total Project: Project Charter Not Approved
Actual Total Costs: $307,374
1.9 SG 10 - Customer Smart Choice Programs
Customer Smart Choice Programs were originally envisioned as a suite of retail service
offerings and rate structures empowering customers to use energy wisely while creating value
from Smart Grid investments. During the course of the SGIG program, several Customer Smart
Choice programs were evaluated and implemented, and some were studied and not
implemented, as follows:
Electric Rate Structures: In 2010 upon completion of the early phases of AMI deployment,
all large commercial customers with electric service greater than 250 kVA were moved to
mandatory Time-of-Use rate plans. This was an early goal of the meter deployment. BWP
also implemented an optional TOU rate for Electric Vehicle operators. Rates Analyst staff
and the Electric Rate Consultant prepared a Cost of Service study to update BWPs utility
cost records. The team has been evaluating alternate rate structures including TOU rate
options for all customer classes. Over time it is expected the AMI systems will enable new
rate structures that send price signals to customers to support lower customer bills, and help
lower utility costs. Approval of new rate structures will be a time consuming process
requiring public input and City Council approvals, and is expected to play out over the
coming few years.
Home Energy Reports: A service provided by Opower, these are hard-copy reports mailed
to customers and display customer-specific energy usage information, comparisons in
energy use with other like customers, and provide energy saving tips. These reports were
introduced to 25,000 residences in April 2011 on a bi-monthly basis. Distribution was
expanded to all Burbank households in September 2012, with reports mailed to customers

15
on a quarterly basis. Opower provides an analysis of changes in energy usage patterns and
estimates energy savings averaging 2% as a result of its reports.
Customer Web Portal: This service provided by Opower was introduced in July 2012, and
displays AMI system data. Customers can visit BWP’s website to see hourly energy use data
that is updated daily. The web portal also provides customers with tips on how to save
energy and move energy use to off peak. To date 5 to 10% of customers are visiting the site.
The web portal is expected to be provided by the new Customer Information System (CIS)
in 2014 or 2015.
CEIVA Photo Frame Pilot: Staff evaluated several different in-home display alternatives,
and considered such issues as whether customers will actually look at the displays or if they
will end up unutilized. The CEIVA Frame service was identified as a creative way to
combine utility in-home display information with family sharing of photos and other
display information. A pilot project to demonstrate the CEIVA Frame with 50 residential
customers is underway. BWP will push a limited number of messages to the Frames, such as
customer energy usage charts, requests to temporarily reduce power consumption, and
energy saving tips. This pilot will continue until mid-2016 when it will be evaluated for
effectiveness in reducing energy and water usage, and as a messaging system.
Electric Vehicle (EV) Customer Incentive and Information: Burbank has established a
sustainability goal to promote alternative fuel vehicles. In support of this goal, BWP’s
website has been developed to provide EV program information, including charger
installation rebates, public accessible charging station locations, and other EV information.
The EV program provides $100 rebates to customers who install home EV charger
installations (rebate is not funded by the SGIG).
Summit Energy Demand Response Research: With a goal to reduce peak load by 50 MW
using Demand Response (DR), in March 2012 Summit Energy was selected to develop a DR
strategy. The Phase 1 Data Analysis report completed August 2012 showed energy use
profiles and peak demand for BWP’s 34 largest customers. In Phase 2 during 2013, Summit
conducted site visits to identify demand reduction possibilities for specific customers, and
recommend incentive alternatives for DR. A business case is being developed to justify a DR
program for these largest commercial customers, with possible program implementation in
late 2014 or 2015.
Smart Thermostat Demonstration: Staff evaluated a joint demonstration program with the
neighboring utility in Glendale to install programmable thermostats in both Burbank and
Glendale with the goal to determine energy savings and DR potential of thermostats. The
pilot has been deferred due to concerns regarding customer acceptance and cross subsidy
between customers.
Smart Appliances Demonstration: Staff has researched and evaluated options to
demonstrate smart appliances as a means to create DR and shift load to off peak. A proposal
was received from General Electric for a Smart Appliance demonstration, however staff was

16
not able to build a sufficient business case to invest in this program. A key issue was to
avoid cross subsidization between customers. This program has been canceled.
Additional programs: BWP’s Customer Service and Marketing department continually
monitors best practices in the energy industry that promote energy and water conservation,
efficiency and DR. Staff will evaluate promising programs as they are identified, which
could potentially lead to additional Customer Smart Choice programs.
Project Summary
Schedule: March 2010 – March 2014
Project Charter Total Project: $1,729,175
Actual Total Costs: $824,717
1.10 SG 11 - Integrated Automatic Dispatch System (IADS) (formerly Energy Demand Management System)
The IADS initial implementation is complete, and the associated SCADA system version
upgrade is complete.
The IADS project developed a real-time control system capable of automatically dispatching
generation resources, distributed energy resources (DER), and distributed storage (e.g., Plug-in
Electric Vehicle [PEV] batteries), or alternatively adjusting customer demand (loads) to match
BWP’s electric supply resource requirements. The IADS combines key functions of an Energy
Management System and a Demand Response Management System. It includes tools to build a
daily load forecast and supply plan. It receives input from wholesale energy and natural gas
markets, trading partners, Balancing Authority, weather forecasts, availability of DR and DER
resources, and other inputs. BWPs Customer Smart Choice programs are expected to sign-up
demand control infrastructure for the IADS to create so called “Virtual Power Plants”, located
by feeder, etc. thus enabling us to reduce energy costs, and shift energy usage to off peak. IADS
will inventory and aggregate various customer electric demand sources such as thermostats,
appliances, pool pumps, PEV charging devices, etc., and present these to system operators for
potential dispatch for DR. BWP envisions IADS to eventually have electric grid Ancillary
Services like functionality, and potentially provide Operating Reserves. When fully
implemented, system operators will be able to dispatch generation resources or adjust energy
demand resources to optimize system reliability while achieving the most economic energy
supply portfolio. This will support integration of new variable renewable energy resources and
effective demand response. As of March 2014, initial installation of IADS is complete, and
ongoing work process engineering and integration with DR and dispatchable generation
resources continues.
Associated with the IADS project was a version upgrade of the Supervisory Control and Data
Acquisition (SCADA) system. This work has been complete, and staff is working to resolve
various control issues that have arisen.

17
Project Summary
Schedule: March 2011 – March 2014
IADS Project Charter Total Project: $5,386,000
IADS Actual Total Costs: $5,513,196
SCADA Project Charter Total Project: $597,000
SCADA Actual Total Costs: $1,115,799
1.11 SG 13 - Thermal Energy Storage Project
This project was reduced in scope to a smaller scale thermal energy storage demonstration, and
the project is complete. It includes deployment of Ice Energy Ice Bear distributed energy storage
equipment at customer, utility and city building sites within Burbank. This innovative and
proven equipment makes ice during off peak hours which is then used for building space
cooling during the heat of the day when energy demand rises, effectively moving energy use to
off peak. The equipment can communicate with the utility and act as an energy sink, thus
supporting integration of renewable energy resources on BWPs system. Additionally, with the
proper control system, BWP believes a fleet of these units can be strategically dispatched to
provide utility ancillary services.
In 2008 and 2009 prior to the SGIG program, BWP installed the initial deployment of 16 Ice Bear
units at customer and city buildings. In 2011, as part of the SGIG program, an additional 19 Ice
Bear units were installed at City of Burbank buildings, bringing the total number of Ice Bear
units to 34, with an equivalent electric capacity of 0.27 MW. In parallel, staff was working to
develop the Project Charter to scope and justify a 2 MW capacity deployment for businesses in
the city. Because of the high cost of the Ice Bear units, and because BWP already had sufficient
electric generation capacity negating the need to procure new generation capacity, staff was not
able to build a viable business case for a $4 M deployment of 2 MW of new Ice Bears.
The last phase of this project was to install 8 Ice Bear units at some BWP buildings, and to
integrate the controls of some of the BWP Ice Bear units to a new Integrated Automatic
Dispatch. This brings the Ice Bear fleet on utility and city buildings to 29 units (not including
units on BWP customer sites), with equivalent electric capacity of 0.23 MW, which BWP will
monitor and evaluate for performance and related benefits.
The early installations of this project were funded with Public Benefits funds. Although a
project charter was prepared for the larger Mw scale deployment, the charter was not used.

18
Project Summary
Schedule: June 2010 – October 2013
Project Charter Total Project: No charter developed for reduced scope
Actual Total Costs: $85,801
1.12 SG 14 - Electric Vehicle (EV) Charging Demonstration
BWP completed Phase One of this project in 2011, deploying 11 EV charging stations in publicly
accessible locations in Burbank. The stations are integrated with the Coulomb Technologies
Charge Point America system to facilitate customer interfaces and back-office services. This
project is to promote EV use, and to evaluate the EV charging service market and impact on
utility grid. A mini cost of service study was developed to establish a pricing rate and
methodology. The units were first placed in service in December 2011. For the initial 7 months,
charging service was at no cost, and in July 2012 a price of $2 per hour was started. BWP is
monitoring usage and evaluating impacts on the utility grid. Staff has been evaluating a Phase 2
project to deploy a DC fast charge EV charging system for evaluation, however, this work is
being pushed out beyond March 2014.
Project Summary
Schedule: July 2011 – December 2011
Project Charter Total Project: $185,000
Actual Total Costs: $142,593
1.13 SG 15 - Customer Information System (CIS)
This project is complete and in-service March 2014. It includes purchase and implementation of
a new CIS to replace BWP’s existing increasingly outdated and inadequate billing system. New
Smart Grid-related initiatives require a very robust CIS that can handle data feeds from smart
meters, time-of-use (TOU) and real-time pricing (RTP) rate structures, demand response (DR)
programs, net metering, and support for new products and services such as those offered by
their One Burbank program. The sheer volume of data that will be generated from the Smart
Grid programs is beyond the capability of the Banner CIS. A modern CIS is also used to provide
water and energy usage data to customers via web portals, social media and mobile computing
devices. The previously existing Banner CIS could not support these requirements.
CIS provides customer account management and billing services, performed by a complex data
base and information system that contains all billing and personal data for utility customers.
This includes meter information, billing rates, historical water and electricity consumption, and
associated charges. The CIS obtains water and electricity usage data from BMPs utility meter
systems, calculates and provides customer bills, and is used extensively by their Customer
Service personnel on a daily basis in communicating with their customers and resolving

19
customer concerns and issues. In Burbank, the BWP CIS also performs billing services for the
Public Works department for sewer, trash and wastewater services.
In fall of 2011, the project team completed their RFP-based selection process, and the Oracle
Customer Care and Billing system (CC&B) was chosen as the best option for a replacement CIS.
The Oracle product architecture focuses on the use of plug-ins and configuration vs.
modification for customizations. Although this increases the complexity of the implementation,
it offers the following benefits:
Reduces the risk of implementation failure
More detailed account information for customers
Marketing to specific customer classes
Flexible billing cycles
More rate options
Customer self service
o Turn service on if customer meets certain criteria
o Credit extension options for certain customers
Customizations are easily migrated (migrations are less risky) allowing BWP to stay
current with the product and the Smart Grid technology demands.
The product is more operationally stable
Flexible billing for the future of their Smart Grid customer projects.
The new CC&B CIS allows BWP to consolidate other applications for operational efficiencies
and meet the contemporary billing needs of the utility for the next decade.
Project Summary
Schedule: September 2011 – March 2014
Project Charter Total Project: $9,943,235
Actual Total Costs: $7,155,715
The following chapters of the Final Project Report describe the program management and
budget, and provide greater detail on a few key projects.

20
CHAPTER 2: Smart Grid Program Management and Budget
This section describes Smart Grid program management process, funding and cost
performance. BWP was successful in receiving a US DOE Smart Grid Investment Grant (SGIG)
for $20,000,000 and a CEC Public Interest Energy Research (PIER) grant of $1,000,000, which
combined to offset some of the Smart Grid program’s approximately $60 million budget.
The SGIG grant agreement was finalized in March 2010. DOE required preparation of a Project
Execution Plan (PEP) that described the overall work plan for the program. The PEP presented
an overview of the program and how project management practices were to be employed to
ensure successful completion. Included were descriptions of the multiple projects, management
structure and resources, project management approach, resource loaded project schedule,
budget, program risk assessment and benefits assessments.
DOE also required periodic reporting throughout the program through the DOE’s SIPRIS and
SmartGrid.gov websites. A cyber-security plan and a metrics and benefits reporting plan were
required, and both were submitted and approved by the DOE. Throughout the process DOE
representatives were very helpful and supportive. Two DOE staff site visits to BWP’s campus
during the course of the program allowed a project review and status process.
The CEC PIER grant was structured to offset some of BWP’s matching funds for the SGIG. The
PIER grant was finally approved in January 2013, and its requirements were to share with the
CEC all results and findings that were required by the DOE grant. In this way the CEC was able
to capture program information and lessons learned from BWP’s $60 million Smart Grid
program.
2.1 Project Management Process
To manage the overall Smart Grid program, BWP established a Project Management Office
staffed with a full time manager at the Principal Power Engineer level. A Steering Committee
was created including Assistant General Managers from Customer Services, Power Supply,
Electric Services, and Operational Technology. The committee was charged with providing
policy direction, resources, and ensuring coordination and cooperation across departments.
This committee met with the Program Manager on a weekly basis and addressed topics
including the Project Execution Plan and Project Charter development issues, project schedule,
budget, problem resolution, scope changes, coordination issues, reporting and any other
program or project issues. Periodically the Steering Committee met with the BWP General
Manager to present status reports or key issues for decisions.
A program budget and integrated schedule were developed with the assistance of a Project
Management consultant who worked part time for the length of the program. The consultant
also prepared and submitted reporting to the DOE and CEC. The program schedule was
managed on Microsoft Project software that included the conceptual budget prepared by the
Program Manager. A program accounting structure was also established in BWP’s Oracle

21
accounting system. The schedule and accounting were integrated and updated monthly so that
a continuous tracking of schedule and costs was accomplished for reporting purposes.
At the outset of the program, BWP management established a policy that each Smart Grid
project or sub -project was to be documented in a Project Charter and approved by the BWP
General Manager. The Charter identifies the project manager and team, work scope, budget,
schedule, project financial or business justification, and other critical project information. In
certain cases staff was unable to develop an acceptable business justification, so the original
project scope was adjusted, reduced, deferred and/or deleted accordingly. Project Charters
became a very important requirement for management control of the Smart Grid program and a
success factor in completing a cost effective program.
Final expenditures for the overall Smart Grid program are $50,818,197. This number falls short
of the original budget plan of $62,650,755 due to the scope adjustments and deferrals. A copy of
the budget is included in Table 1.
Table 1: Program Budget Summary
Source: Burbank Water and Power
No. Project or ProgramOriginal DOE
SGIG Budget
Actual
Expenditures
through
3/31/14
DOE SGIG
Grant
Contribution
Budgeted CEC
PIER Grant
Contribution
BWP Cost
Share
SG 0 Program Management $5,831,645 $2,971,201 $1,393,586 $132,670 $1,444,945
SG 1 Secure Wi-Fi Communication Network $4,498,861 $4,426,350 $2,266,015 $2,160,335
SG 2 Meter Data Management System $5,273,266 $6,001,366 $2,310,001 $100,000 $3,591,365
SG 3 Advanced Meter Infrastructure $14,042,447 $14,137,052 $6,688,677 $7,448,375
Communications Modernization $370,977 $370,977
SG 4System Architecture Assessment:
Enterprise Service Bus$1,533,400 $1,036,474 $432,895 $100,000 $503,579
SG 5Network Control: Manager of
Managers ***DEFERRED***$883,862 $0 $0 $0 $0
SG 6Mission Critical Asset Protection
Program $1,126,400 $1,830,427 $785,739 $87,872 $956,816
SG 7 Outage Management System $604,842 $646,996 $203,411 $443,585
SG 8 Distribution Automation $10,000,840 $3,770,078 $1,556,817 $100,083 $2,113,178
SG 9 Distribution Management System $7,300,000 $307,374 $131,479 $100,021 $75,874
SG 10 Customer Smart Choice Programs $3,747,562 $824,717 $470,636 $74,815 $279,266
SG 11Integrated Automated Dispatch
System $1,377,630 $5,513,196 $2,059,139 $100,021 $3,354,036
11.1 SCADA Upgrade $1,115,799 $388,348 $727,451
SG 12Solar Energy Demonstration Project
***DEFERRED***$2,215,000 $55,960 $27,980 $27,980
SG 13 Thermal Energy Storage Program $4,215,000 $85,801 $8,684 $77,117
SG 14Electric Vehicle Level 1 and 2
Charging Demo$142,593 $70,625 $71,968
14.1 EV Charging Phase 2 DC Fast Charger $1,336 $1,336
SG 15 Customer Information System $7,155,715 $880,331 $102,098 $6,173,286
SG 16.1 Power Operations Center $225,799 $105,337 $102,420 $18,042
SG 17 Black Start Program $198,986 $82,619 $116,367
Total $62,650,755 $50,818,197 $19,862,319 $1,000,000 $29,955,878
22
CHAPTER 3: Communication Systems
3.1 BWP’s Smart Grid Vision
In 2006, BWP began researching ways to respond to changing business requirements by
modernizing systems and incorporating new communication and digital technologies. Changes
in energy supply requirements and regulations to reduce power plant emissions needed to be
addressed with cost effective solutions. For example, mandates to increase the use of renewable
energy resources required greater use of intermittent resources like wind and solar power.
However the intermittency of these resources required new tools to monitor and manage grid
reliability. The expected growth of rooftop solar generation throughout the distribution grid
posed challenges to system voltage stability and reliability. Also there was a need to upgrade
aging utility infrastructure, including various electric station equipment, as well as most electric
service meters that were nearing the end of their 40-year life cycle. Planners believed that the
expanded use of grid utilization and operations information could benefit both customers and
grid operators.
BWP recognized that advanced communication and information systems would enable high
speed controls needed for renewable resource integration, managing distributed generation,
demand response and preventing blackouts. Grid information could be used to support
innovative customer applications, energy efficiently, and improve system reliability. At a time
when many utility programs focused on metering systems, BWP recognized a well-conceived
reliable communication system would enable a wide range of innovative systems and services.
Some applications were available in the near term; however, communication systems must be
capable of supporting future innovation and new technology that will be developed in the long
term. The electric utility industry has referred to such programs as building the Smart Grid that
covers a wide range of modernization projects.
Change has also been driven by technology advances in fiber optic and wireless networks, and
a general migration from analog to digital monitoring and control systems. BWP’s early vision
for modernizing its electric system was to build a high performing data communication
network capable of supporting both energy supply and delivery systems. This would be done
by continuing to develop fiber optic systems that had been installed starting in the mid-1980s.
The fiber network connected electric stations, utility and city facilities, and some of BWP’s
largest customers. The fiber initially replaced aging copper cable systems, and updated circuit
and equipment protection systems. Surplus fiber capacity was installed at a nominal increase of
cost, creating surplus capacity for growth and expanded benefits to the City. Initially the fiber
was utilized by point to point circuits and a SONET (Synchronous Optical Network) system for
Supervisory Control and Data Acquisition (SCADA). In 2006 BWP deployed its Ethernet
Switched Services Network (ESSN), an Internet Protocol (IP) based Ethernet network that
offered scalability, reliability and security features meeting rigid utility requirements.
23
Fundamental to all the concepts of the Smart Grid is the monitoring and control of electricity at
the point of utilization. The responsiveness of such monitoring and control is one of the
fundamental requirements of automatic control applications. As a result, BWP sought to
achieve a monitoring and control response fast enough to respond to its power supply
requirements. That speed is a few milliseconds at the system level, and a few seconds at the
load level. BWP’s fiber network with the right carrier class Ethernet equipment could achieve
the required speed and reliability.
Analysis found that while fiber connected all electric stations and could provide an interface at
field locations, a wide area network would be required to connect to BWP’s over 50,000
customer meters. Radio technology offered the best cost effective option for such a link as it
could be done without wires to every customer site. New wireless mesh technology provides a
hub-less digital network that automatically reroutes the flow of data quickly to always find the
quickest path to deliver data.
Thus BWP’s vision for its Smart Grid program evolved to include upgrading the fiber optic
network to a high performing carrier class network, and integrating this with a wide area
wireless network that would provide connectivity to customer metering systems, distribution
automation of field devices, and support for mobile data for field personnel. This core
communication system would be the foundation for modernizing equipment and information
systems for grid operations, command and control, and various business systems. Lastly,
demonstration projects for energy efficiency and support for electric transportation were
included in the program.
3.2 Migration to IP Networks
BWP intended to build communication systems utilizing the best available technology with
future growth potential. Advances in digital communications had driven down the cost of high-
performance networks, giving utilities new options when designing communications solutions
to replace end-of-life equipment or to support new Smart Grid applications. Traditional utility
and other industrial control communication systems have used proprietary, closed or obscure
communication protocols. However, IP is increasingly being implemented as a communications
platform for utility networks. IP’s advantages include better management, easier scaling, and
quicker deployment using devices from a wide range of vendors that support numerous
applications over a common network.
IP infrastructure enables the use of common communications protocols system-wide. The single
IP network supports new, real-time applications that provide efficiency improvements and cost
savings, including meter reading, remote connect/disconnect, Quality of Service (QoS)
management with Volt/VAR control, and mobile field worker communications. BWP has seen
positive results by migrating other utility communication systems to IP over Ethernet, including
voice services with Voice over IP (VoIP) and SCADA systems that previously used IP over
SONET. In those cases, IP over Ethernet provided higher capacity networks, ease of scalability,
and the ability to implement security best practices.
24
IP networks also provide secure data exchange. For example, financial institutions transfer
billions of dollars a day securely with IP networks, using techniques such as virtual private
networks (VPN) and encryption that can also be employed in utility networks. Although there
is a constant threat of cyber-attack with IP, the concept of “security by obscurity” in proprietary
networks is a misconception. Utilities can leverage industry best practices and a well-trained
pool of engineers with expertise in IP networks for support. Government institutions, the
Internet security community, consultants, and academia are constantly looking for
vulnerabilities and ways to mitigate threats. As VPNs, encryption methods and other IP
security capabilities evolve; utilities can easily incorporate these new standards into networks,
and have numerous resources for support if needed.
3.3 Ethernet Switched Services Network (ESSN)
The ESSN is BWP’s fiber optic network that was upgraded in 2006 as a first step in the Smart
Grid program. Planning and design engineering for the network was performed by Sequoia
Telecom Associates. The ESSN is built only at electric stations and facilities, and is collocated
with power lines and BWP conduit systems. Access to the fiber and associated devices is
restricted and monitored. The system is designed to operate without interruption or loss of
performance during extreme emergencies including blackouts, earthquakes and other disasters.
Where most such networks are designed to work with the best efforts response, this network is
designed to operate at a specific level of service with any one element out of service.
The ESSN uses the same type of equipment used by major carriers of the internet, and hence is
called carrier-class equipment. It has the capability to route traffic across the network, and
allows BWP to employ a higher level of security to its network traffic. This provides the
capability to take any signal from a given port, add certain information to the signal, and then
allow that signal to only go to specific ports, and restrict it from specific ports. In this manner,
traffic from customer meters can be restricted from being in contact with the ports that control
substations or power plants.
The ESSN also supports Multiple Protocol Layer Switching (MPLS), a method of assuring that
certain applications are not delayed in passing across the network. This is very useful for video
and voice applications where delays can cause the picture to freeze or the audio to distort. By
using MPLS, the network knows what streams contain video and audio so those streams are not
delayed during periods of congestion. Also signals association with system protection can have
high priority and not encounter delays that would impair their service requirements.
The ESSN is composed of three 10 Gbps switches located at separate locations in the City. Each
switch is directly tied to the other two switches over 10 Gbps links. Each of the three switches is
linked to about a third of the BWP electric stations, and each electric substation is linked to two
switches. This approach assures that any element can fail and service can still be maintained to
any and all stations. During the Smart Grid program, the ESSN was extended into
neighborhoods in the city to provide connectivity to the wireless network described below.

25
3.4 Wireless Network Design Criteria
For network design and testing, BWP augmented internal resources with subject matter expert
consultants. IPKeys Technologies was selected to perform wireless network design and testing.
A phased approach to wireless network equipment selection and deployment was chosen with
the following steps.
Phase 1 – Network design and equipment selection
Phase 2 – Install a small demonstration network on the BWP campus to verify performance
Phase 3 – Install a proof of concept network serving 1000 customers; integrate to meter data
management and billing systems
Phase 4 – Full network deployment to all customers
To support and direct the design effort, the following design criteria were established for
selecting the communication solution:
• High reliability
• High resiliency
• Multi-layered standards-based security
• Sub-20 millisecond latency round trip
• Greater than 5 Mbps bandwidth
• Low RF emissions
• Ability to support multiple applications
• Support for mobile data for field personnel
A conceptual model of the fiber / wireless network is shown (Figure 1) (Source ABB/Tropos).
BWP did not deploy the Home Area Network (HAN) shown, and wireless nodes were installed
on street light poles, not power poles as shown.
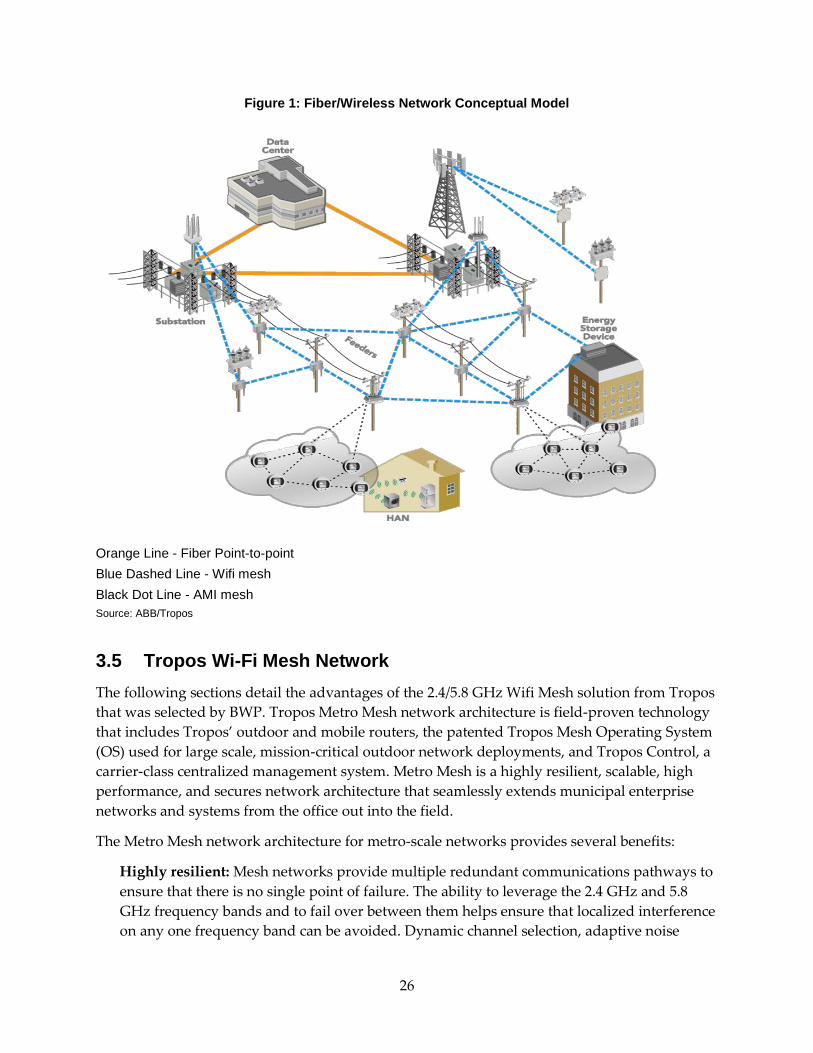
26
Figure 1: Fiber/Wireless Network Conceptual Model
Orange Line - Fiber Point-to-point
Blue Dashed Line - Wifi mesh
Black Dot Line - AMI mesh
Source: ABB/Tropos
3.5 Tropos Wi-Fi Mesh Network
The following sections detail the advantages of the 2.4/5.8 GHz Wifi Mesh solution from Tropos
that was selected by BWP. Tropos Metro Mesh network architecture is field-proven technology
that includes Tropos’ outdoor and mobile routers, the patented Tropos Mesh Operating System
(OS) used for large scale, mission-critical outdoor network deployments, and Tropos Control, a
carrier-class centralized management system. Metro Mesh is a highly resilient, scalable, high
performance, and secures network architecture that seamlessly extends municipal enterprise
networks and systems from the office out into the field.
The Metro Mesh network architecture for metro-scale networks provides several benefits:
Highly resilient: Mesh networks provide multiple redundant communications pathways to
ensure that there is no single point of failure. The ability to leverage the 2.4 GHz and 5.8
GHz frequency bands and to fail over between them helps ensure that localized interference
on any one frequency band can be avoided. Dynamic channel selection, adaptive noise
27
immunity and other advanced RF resource management techniques provide added
resiliency.
Multi-use network: The IP mesh network can be leveraged for applications such as utility,
municipal and public safety. Tropos’ multi-use feature set includes the ability to create
multiple virtual networks, each with their own Quality of Service (QoS) and security
specifications, and completely segregate the traffic of different applications and user groups.
Secure: Tropos multi-use feature set allows for multiple virtual networks over a single
physical infrastructure with traffic segregation across applications and user groups. 802.11i-
based link-layer security provides authentication using RADIUS and EAP plus AES
encryption for all control and data traffic.
High capacity for demanding applications: High-bandwidth applications such as video
surveillance and mobile video require the network to be engineered to provide high
capacity. This can be accomplished through a combination of higher node densities, the use
of fiber backhaul and use of Tropos multi-radio products in the network design.
Application Quality of Service (QoS): A municipal network that is being shared by
multiple applications and user groups needs to be designed with application QoS to ensure
that traffic for latency-sensitive mission-critical applications are prioritized relative to
latency-insensitive communications such as metering data. Tropos routers support IETF
(DiffServ) and IEEE (802.11e, 802.1p, 802.1q) QoS standards in addition to proprietary mesh
extensions to deliver application-based QoS.
No centralized controller: The Tropos Metro Mesh architecture is a fully distributed
architecture. The network does not rely on a centralized controller for its operation,
removing potential single-points-of-failure and eliminating unnecessary network traffic.
Use of PWRP routing rather than rapid spanning tree protocol (RSTP) bridging: RSTP
was specifically designed for Ethernet networks while PWRP was specifically designed for
wireless mesh networks. An Ethernet network connected with fiber, copper and switches
tends to remain in a constant topology, changing only in the rare case of a failure in the
copper, fiber or switch infrastructure. An outdoor wireless mesh is highly dynamic as the
outdoor RF environment changes by the second, minute, hour, day and week. Outdoor
mesh networks require a protocol that reacts predictably with sub-second response to
ensure network stability and high performance. PWRP provides the characteristics because
all Tropos routers are constantly aware of the best path and next-best paths available to it
and can immediately route traffic along an alternate path if the previous best path becomes
noisy or unavailable. Contrast this with RSTP, where a mesh node must receive a topology
change notification from its neighbor, clear its bridging tables and learn the new topology, a
process that can take many seconds and interrupts data flow.
Tropos multi-mode interfaces vs. competitive dedicated mesh and client interfaces: Most
mesh vendors require their products’ interfaces to be statically configured as either a mesh
interface or a client interface. The mesh interface is usually in the 4.9 GHz or 5.8 GHz
28
frequency band while the 2.4 GHz interface is generally reserved for client access only.
Mesh routers that only mesh on higher frequency bands inflate the cost of the deployment
by requiring higher node counts to provide multiple mesh backhaul paths at these
frequencies. With Tropos outdoor mesh routers, all interfaces can be dynamically used as
mesh interfaces and/or client interfaces. This is especially advantageous for the 2.4 GHz
interface as it will be able to close mesh links that higher frequencies cannot, resulting in
higher availability because more mesh backhaul paths will be available and lower
deployment costs through lower required node densities.
Field proven: Tropos mesh routers have been installed in the field since 2002. They are used
by more than 750 customers in more than 30 countries around the world. Tropos mesh
routers have more than 200,000,000 field operational hours. Based on this extensive in-field
experience, individual mesh routers have a measured and documented MTBF (Mean Time
Between Failure) in excess of 225,000 hours while Tropos Metro Mesh network systems have
demonstrated more than 99.99% availability.
Scalable: Tropos Metro Mesh networks have been proven to scale to large coverage areas
(555 square miles in Oklahoma City, Oklahoma), large number of users transferring massive
volumes of data (19,000 users transferring nearly 600 Gigabytes of data daily in Google’s
Mountain View, California network) and large numbers of routers (more than 4,000 routers
operating in the network in Philadelphia, Pennsylvania).
Durability: Tropos mesh routers combine sophisticated mesh networking intelligence,
designed to optimize throughput in a dynamic, metro-scale outdoor networks, with
purpose-built hardware that is ruggedized and weatherized to withstand extreme weather
conditions
3.6 Network Design and Construction
A schedule of deployed systems is included in Table 2. At the time of deployment, the final
design of BWP’s communications networks included the following components installed in
BWP’s 17 square mile service area:
ESSN
10 Gbps Core Network Router/Switches 3 each
1 Gbps Electric Station switches 20 each
Wi-fi Mesh Network
Field nodes 410
Field Fiber Gateways w/ Media converters 60
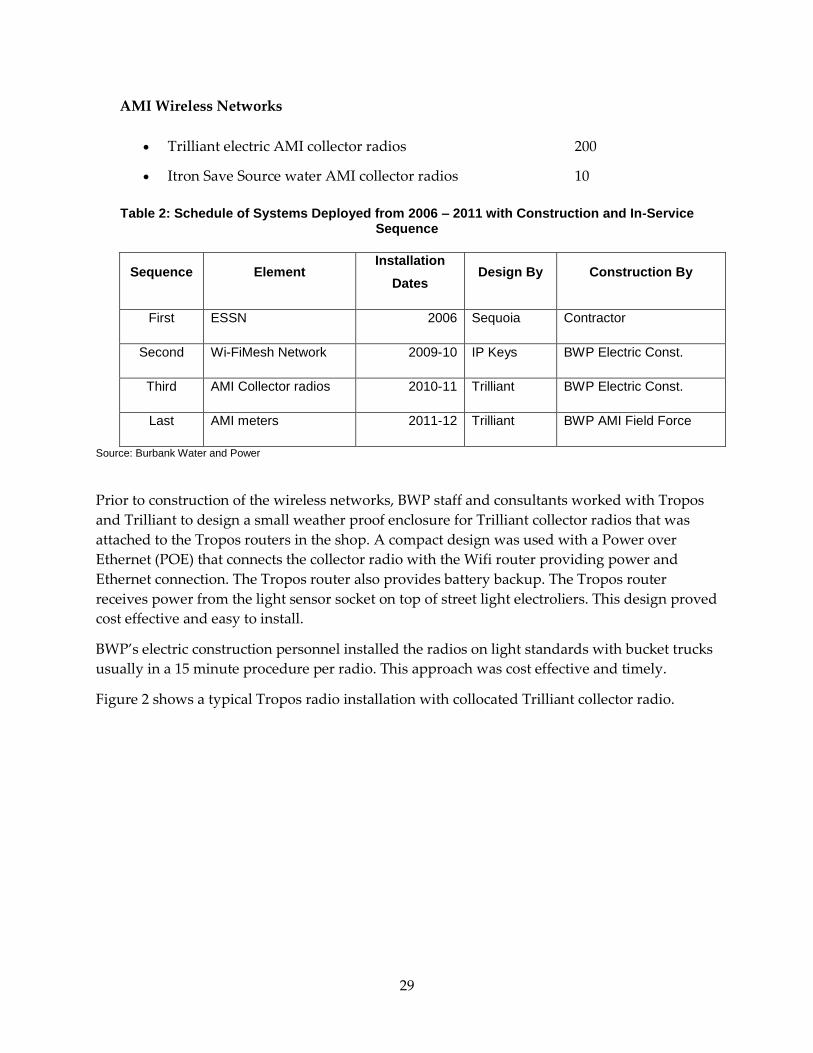
29
AMI Wireless Networks
Trilliant electric AMI collector radios 200
Itron Save Source water AMI collector radios 10
Table 2: Schedule of Systems Deployed from 2006 – 2011 with Construction and In-Service Sequence
Sequence Element Installation
Dates Design By Construction By
First ESSN 2006 Sequoia Contractor
Second Wi-FiMesh Network 2009-10 IP Keys BWP Electric Const.
Third AMI Collector radios 2010-11 Trilliant BWP Electric Const.
Last AMI meters 2011-12 Trilliant BWP AMI Field Force
Source: Burbank Water and Power
Prior to construction of the wireless networks, BWP staff and consultants worked with Tropos
and Trilliant to design a small weather proof enclosure for Trilliant collector radios that was
attached to the Tropos routers in the shop. A compact design was used with a Power over
Ethernet (POE) that connects the collector radio with the Wifi router providing power and
Ethernet connection. The Tropos router also provides battery backup. The Tropos router
receives power from the light sensor socket on top of street light electroliers. This design proved
cost effective and easy to install.
BWP’s electric construction personnel installed the radios on light standards with bucket trucks
usually in a 15 minute procedure per radio. This approach was cost effective and timely.
Figure 2 shows a typical Tropos radio installation with collocated Trilliant collector radio.

30
Figure 2: A Typical Tropos Radio Installation with Collocated Trilliant Collector Radio
Photo Credit: IP Keys
3.7 Network Operations Center (NOC)
BWP recognized the importance of establishing a 24x7x365 NOC capability to oversee the newly
expanded fiber and wireless networks. Network reliability was essential for mission critical
assets and to ensure high quality telecommunication services. In 2010 a competitive bid process
resulted in a contract to Lanair NOC services. Contracting this work was considered more cost
effective for the early years of the program. NOC personnel monitor network equipment and
operations, identify and analyze problems, provide outage notification, troubleshoot, work with
field technicians, track problems through resolution, and provide reporting. This service is
essential in instilling confidence in swift problem identification and resolution.
3.8 BWP’s ONE Burbank Program
BWP’s fiber optic network started in the mid 1980’s has grown to connect all BWP and most
City facilities, over 150 key businesses in the City, and interconnections to key
telecommunication hub buildings. As it was built surplus fiber strands were installed at
nominal cost with a long term strategy to use surplus capacity to provide beneficial uses and
revenue generation. In the past few years, redundant fiber circuits connecting to the largest
telecom hubs in downtown Los Angeles have been leased, essentially interconnecting BWP’s
networks to the worldwide telecom carriers. And, the ESSN was built with great capacity with
relatively low cost options to add capacity for future demand.
The ONE Burbank (Optical Network Enterprise) program began service in 2010, and represents
the strategy to use surplus communications capacity to sell services to businesses in Burbank.
31
Customers enjoy a highly reliable fiber based service at reasonable process. ONE Burbank
services include:
• Dark Fiber – Point-to-point fiber circuits connecting buildings in Burbank without BWP
network equipment
• Dedicated Internet Access – Internet service on secure, fully redundant, fiber-to-the-
business, IP/MPLS network, with port speeds of 20 Mbps to 1 Gbps, and symmetrical
uploads and downloads
• Virtual Private LAN Services (VPLS) – Layer 2 Ethernet-based services provide multi-
location business the ability to operate as part of a single meshed network at speeds from 10
Mbps to 1 Gbps. VPLS is a preferred technology to connect geographically dispersed
locations securely and reliably
• Wave Services – Secure, fully monitored high capacity point-to-point connections
delivered over a secure, low-latency Dense Wave Division Multiplex (DWDM) network,
scalable up to 10 G capacity
• All services are monitored 24 x 7 x 365 with management and customer support services
This program has been very well received by businesses and sales have grown steadily. Net
revenues from the program provide significant funding for the overall Smart Grid program.

32
CHAPTER 4: Advanced Metering Infrastructure Systems
4.1 Selection of BWP’s Electric AMI System
In 2006, BWP began to develop a vision to link critical electrical systems and customers with
secure high-speed communications. The vision included a service territory-wide fiber optic
network, tightly integrated with a Wi-Fi wireless mesh network and Smart Meters for electric
and water service. It was also desired to upgrade aging utility infrastructure including most
electric service meters that were nearing the end of their 40-year life cycle. It was determined
that no vendor could meet all of BWP’s meter and communication vision, but several vendors
had systems that could meet BWP’s core functional requirements. Vendors with technologies
that substantially aligned with BWP’s vision were studied and interviewed.
BWP, aided by metering consultant Maintenance and Test Engineering LLC, evaluated electric
AMI alternatives and selected Trilliant Networks as the best vendor to meet BWP’s
requirements. In July 2009 the BWP Board authorized an agreement with Trilliant Networks to
provide demonstration AMI metering and communication services. The selection of Trilliant
Networks was based on BWP’s evaluation that they provided the best AMI solution available,
given the following Trilliant attributes:
• Over 500,000 AMI modules installed and operating in North America
• Consistently follows and incorporates ANSI Metering and IEEE Communication
standards
• Employs off-the-shelf standards-based radio technology
• Has the greatest bandwidth, 2 to 8 times that of competitors
• Integrates cyber security standards at every level
• Integrates with WiFi and does not require a proprietary communication technology
from meter to Meter Data Management System (MDMS)
• Operates on the 2.4 GHz unlicensed frequency with other unlicensed devices that are
designed to operate in a crowded RF (radio frequency) environment and thus are more
noise and interference tolerant.
After Board approval was received, BWP commenced a proof-of-concept demonstration project
of approximately 1000 electric meters, including both commercial and residential accounts.
Work scope included deploying a Tropos WiFi mesh network, integrated with BWP’s fiber optic
network, eMeter MDMS and Banner Customer Information System. The demonstration project
began in late summer of 2009 with the procurement of AMI electric meters and communication
equipment. Installation took place in the winter of 2009-10 and testing began immediately
thereafter.

33
The tests performed were focused on:
• Ensuring that all meter reads and data delivered were accurately meeting or exceeding
BWP’s requirements
• Making sure the Trilliant communication system operated harmoniously with the Wi-Fi
system
• Integrating all key systems so that data could be seamlessly delivered to billing, and that
it could be made readily available to future engineering and operation applications
• Validating the reliability of the Trilliant AMI system
• Developing an operational understanding of AMI
Upon successful completion of the electric AMI Proof-of-Concept demonstration, staff
proceeded to finalize recommendations for a full AMI deployment. It was recognized that AMI
systems are not interoperable and they won’t be for the foreseeable future. Therefore selecting
any AMI vendor meant choosing a technology partner to work with for years to come, a
decision that in general is common for many technologies. Trilliant’s adherence to standards
and provision of a communication design compatible with multiple different meter
manufacturers offered the least restrictive AMI approach, promoted competitive meter prices,
and allowed BWP to build a Smart Grid comprised of “best of breed” components.
A final recommendation to procure the Trilliant AMI consisting of meters, communication
modules, radios, software, training, and services for hosting, integration, and design was based
on the following factors:
The demonstration project consisting of approximately 670 meters integrated with
BWP’s wireless network, Meter Data Management System and meter management
system (MV90) met all operational and performance requirements.
The Trilliant AMI system allows multiple meter manufacturers to compete in supplying
the AMI meters.
Trilliant, acting as the prime, would competitively procure the meters using Burbank’s
specifications and warranty the meter and the communication module within the meter.
Having Trilliant as the prime vendor facilitated the selection of the meters, integration of
the communication module, and the servicing of the meters during the warranty period.
The final scope of work provided by Trilliant included the following equipment and services:
Trilliant SecureMesh network, including Neighborhood Area Network wireless
communications infrastructure consisting of approximately:
o 52,250 General Electric residential and commercial and industrial (C&I) meters
o 170 Trilliant collector radios
o 100 Trilliant repeater radios
34
UnitySuite head-end services including:
o UnitySuite Metering and Network Element Management System (NEMS)
software applications to be installed at the beginning of the project
o UnitySuite Demand-Side Management (DSM) software application available to
be added in the future if BWP chooses to enable time-based pricing for programs
such as demand response and load control
Services to include:
o Project management and training to ensure deployment remains on schedule and
project is executed on-time and on-budget
o Design of the Neighborhood Area Network
o Support to third party who will integrate AMI equipment within Tropos Wifi
network
o Hosting services for the AMI head-end software with future option to transition
to BWP managed data center
o System Integration of UnitySuite head-end system to the BWP MDMS, and
Lanair network management system
4.2 Planning Electric Meter Deployment
The AMI deployment was set up as a project in the BWP Smart Grid program. A written Project
Charter was prepared that outlined work scope, schedule and budget. The Charter also
discussed project objectives, benefits and business case. Because of the complexity and critical
nature of the work, the Electric Services Assistant General Manager was assigned as the Project
Manager, and a senior electrical engineer assigned as project engineer. During the course of the
work, the project plan became to use Trilliant as the prime vendor providing the AMI
communication system and Smart Meters, including meter integration with the Trilliant
communication system. This approach consolidated responsibility for meter-communication
system integration. The prime contract was negotiated with Trilliant for the scope of work
mentioned above.
One of the keys to overall project success was performing very detailed planning of every
aspect of the design and installation. Nearly 12 months were involved to plan and procure the
AMI systems, and an additional 8 months for meter deployment. Residential meters were
deployed in the first 4 months, followed by installation of the approximately 7000 commercial
meters taking an additional 4 months. Planning addressed meter specifications, functionality,
procurement, and meter deployment logistics. The logistics planning included material receipt,
meter testing, inventory management, storage, mobilization, deployment, and installation
tracking.
A meter specification was developed for BWP’s 10 standard meter forms (types). The
specifications outlined all of the potential meter functions available. Then a series of meetings
35
were conducted internally to sort out functionality vs. the value received. In attendance were
customer services, meter shop, operations, engineering, and project management groups. This
included all groups who would eventually be involved in operating the completed metering
systems. From this process the meter specifications were developed. Trilliant then used these
specifications to competitively bid the meter supply to the three prime Smart Meter
manufacturers. The procurement process selected General Electric’s advanced Smart Meters.
Meters were shipped to BWP with the Trilliant communication card programmed and installed
in the meters.
The next issue to be addressed was determining who would install the meters. An informal bid
was issued for residential meter installation services. From this process, two bids were received
ranging from $1.2 M to $1.8 M. Staff also prepared a proposal to set up a temporary workforce
and manage deployment internally. This approach was eventually chosen because it was lower
cost and it offered greater control and flexibility over the meter installation process. This
flexibility later became very beneficial when the AMI meter opt-out issue was addressed. Using
internal workforce was also a great way to transition the Field Service Representative (FSR) staff
to new positions within the utility and to train potential new workforce.
A contract was negotiated with APEX CoVantage services for deployment software services.
This included lease of 12 handheld radio units, logistics software called Profield, and
deployment Quality Assurance services. The field force was allocated including 14 personnel.
This group included the 7 FSRs who would be reassigned at the end of the deployment because
their positions would no longer be needed. Also temporary workers were hired who were
actually candidates for electrical craft positions. Two senior/retired electricians were also
selected who became the supervisors and who performed electrical panel repairs as needed. No
full-time employees lost their jobs in the process, and downsizing was accomplished by
retirements or reassignments to vacant positions. The field force worked 10 hour shifts, 5 to 6
days per week. This overtime work schedule was cost effective because it provided optimal use
of equipment and motivated the work teams.
A fleet of vans was rented and outfitted. The vans were capable of being loaded with two
pallets, one with new meters and a second pallet for old meters removed from service. The
senior electrician supervisors provided a training program to the FSR’s and temporary workers
on electrical safety and electric panel evaluations.
4.3 Customer Notifications and Electric AMI Opt-Out
At the outset, the AMI project was viewed as a replacement and upgrade of aging utility
equipment. Most of the electric meters were approaching 40 years old, with a few meters up to
80 years old. It was believed that old meters may experience a nominal slowing related to
inaccuracy, resulting in under registration of energy or water use. Therefore, replacement was
required as a normal course of business. In such cases, it is common practice to provide
customers general notification of activities that would cause momentary service interruptions,
and that process was the expected course of action for the AMI deployment.

36
The AMI project was presented in several open sessions of the BWP Board and City Council,
and it was included in the BWP budget that was approved by City Council. Notices of
upcoming meter change out were provided on the BWP website. Also a letter to all customers
describing the AMI project was included in all customer bills. A public meeting was held for
staff to present information on the Smart Meter deployment, although there was very little
public attendance at the meeting. Additional information about AMI program status was
provided periodically on BWP’s website.
At about the time that the BWP meter deployment began, a northern California utilities AMI
program developed a public controversy regarding meter accuracy. This controversy eventually
spread to Burbank when a handful of citizens voiced their concerns to BWP and to the City
Council. Concerns included AMI meters caused adverse health effects, they were an invasion of
privacy, and they posed a threat to meter data security. The issues were discussed at several
BWP Board and City Council meetings and in letters to BWP’s staff. In response, BWP
conducted extensive site surveys, conducted research, and enlisted the services of industry
technical experts to evaluate all of the concerns. Several presentations were made by staff to
City Council, including testimony from independent industry experts.
After much research and evaluation, the City Council directed BWP to offer to all electric
customers who objected to their AMI meter installation an opt-out option to have a Smart Meter
without a radio installed. Such customers would be charged a fixed fee of $50 for installation of
the non-standard meter, plus a $10 monthly recurring charge to pay for manual meter reading.
Prior to the start of deployment, a special unit within Customer Service was set up to
communicate with the public, and to track and schedule appointments for meter installation. A
special phone number was set up for this purpose and BWP’s Customer Call Center was trained
to route inquires to this team. A letter identifying the AMI installation date was mailed to each
customer 1 to 2 weeks before meter installation.
4.4 Electric Meter Deployment Process
The actual meter deployment process included the following steps:
• Field Technicians were equipped with a specially equipped van, safety equipment and a
handheld communication and data recording device
• The APEX logistics system was programmed daily with installation route assignments
• Supervisors would use their handheld device to scan the van and badge of the
Technician to track equipment and assignments
• Technicians were given routing for the most efficient use of time and travel
• At each customer’s premises, the Technician would knock on the door to notify the
customer of installation and to gain access to meters

37
• If no one was present, either the new meter would be installed, or if there was no access
to the meters, the Technician would leave door hangers requesting that the customer call to
schedule an appointment for meter installation
• Prior to installing each meter, the Technician using the handheld data collection device
would:
o Take a photo of the meter site in general
o Take a photo of the old meter including the meter read
o Identify the physical location of the meter with a GPS locator
o Record on the handheld device the meter number of the old and new meters, the
meter reading of the old and new meters, validate street address, and other site specific
data
• At the end of each work day, the Technician would upload all handheld data, pre-stock
the van for the next day’s installations, and reschedule incomplete jobs
• The old meters would be placed in the scrap bin, and a random sampling of old MV90
commercial customer meters would be submitted for accuracy test. No residential meters
were tested because of confidence in their accuracy from previous testing.
• Supervisors would verify meter counts
A Quality Assurance process was established using off site APEX staff that would daily
compare field entries of meter readings from the handheld devices with the photo of the meter
read display. This process verified 100% of the initial meter read data, and only a few cases of
data input error were identified and corrected.
Overall the planning effort paid off with good steady progress on meter replacements.
Production rates averaged 50 meters per day per Technician, and final costs for residential
meter installation inclusive of labor, supervision, software and back office costs averaged less
than $20 per meter. Only a limited number of problems were encountered, with the most
common problem being faulty or damaged customer power panels. Many customers’ houses
were 50 to 70 years old, some with main power panels that were corroded or found loose from
the structure. In each case, Technicians would take a photo of the damaged panel and schedule
repairs. Energy theft was observed to be a very limited problem, with only 12 meters having an
illegal meter bypass identified. These bypassed meters were reported and replaced with a new
AMI meter. BWP believes theft was probably much greater than only 12 meters, as it is likely
many illegal bypasses were removed when all Customers were notified of the meter
replacement schedule. Meter accuracy was a concern, however random testing of larger
customer meters indicated all meters were essentially within acceptable meter tolerance.
The last notable challenge was radio access to a small number of the largest customers’ meters.
At BWP, approximately 200 of the largest customers consume 50% of total system electric load.
These customers are mainly entertainment studios, large commercial offices, and industrial

38
manufacturing or supply facilities. At many of these sites, the revenue meter is located several
levels below ground or in concrete rooms making RF communications between the meter and
the rest of BWP’s AMI network nearly impossible. BWP’s communication engineer resolved
each site problem by adding RF repeaters, installing special antennas, or in some cases creating
a VPN tunnel to BWP’s network using the customers’ broadband service. The process resulted
in eliminating several dedicated telephone lines, which previously required BWP staff to
manually dial the phone in order to establish the data connection needed to download meter
reads. After installation, all such sites have AMI meters with 5 minute interval reads and two-
way communications.
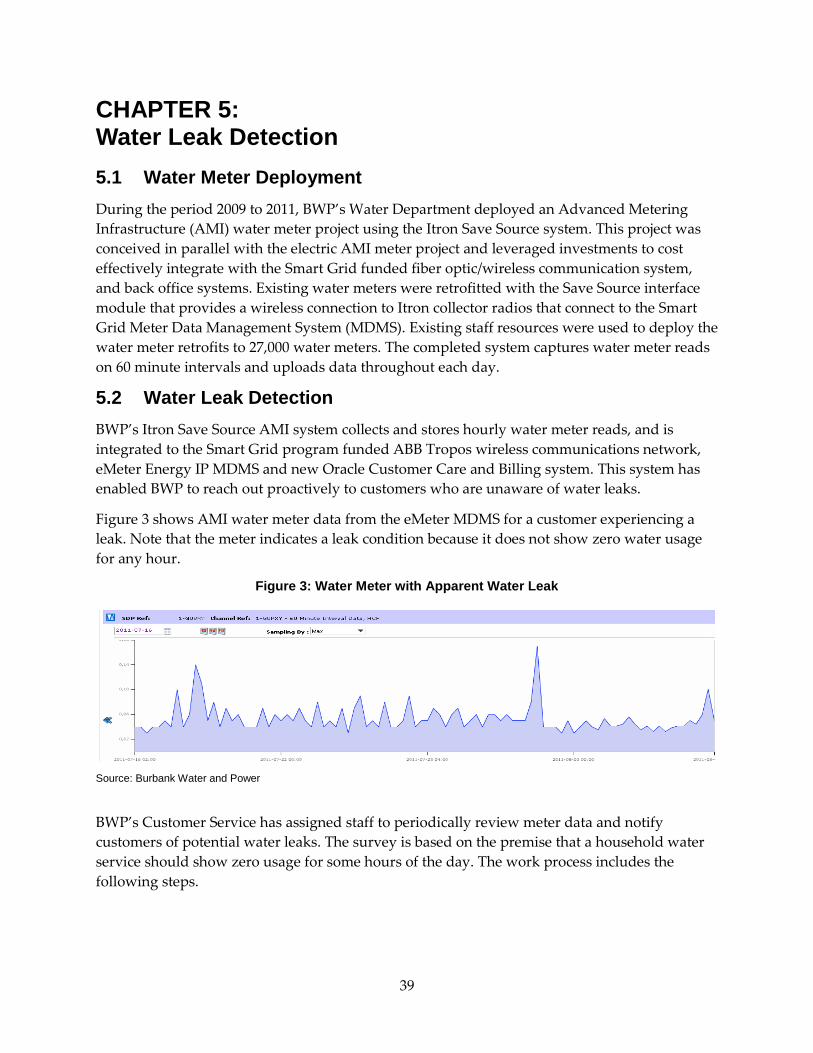
39
CHAPTER 5: Water Leak Detection
5.1 Water Meter Deployment
During the period 2009 to 2011, BWP’s Water Department deployed an Advanced Metering
Infrastructure (AMI) water meter project using the Itron Save Source system. This project was
conceived in parallel with the electric AMI meter project and leveraged investments to cost
effectively integrate with the Smart Grid funded fiber optic/wireless communication system,
and back office systems. Existing water meters were retrofitted with the Save Source interface
module that provides a wireless connection to Itron collector radios that connect to the Smart
Grid Meter Data Management System (MDMS). Existing staff resources were used to deploy the
water meter retrofits to 27,000 water meters. The completed system captures water meter reads
on 60 minute intervals and uploads data throughout each day.
5.2 Water Leak Detection
BWP’s Itron Save Source AMI system collects and stores hourly water meter reads, and is
integrated to the Smart Grid program funded ABB Tropos wireless communications network,
eMeter Energy IP MDMS and new Oracle Customer Care and Billing system. This system has
enabled BWP to reach out proactively to customers who are unaware of water leaks.
Figure 3 shows AMI water meter data from the eMeter MDMS for a customer experiencing a
leak. Note that the meter indicates a leak condition because it does not show zero water usage
for any hour.
Figure 3: Water Meter with Apparent Water Leak
Source: Burbank Water and Power
BWP’s Customer Service has assigned staff to periodically review meter data and notify
customers of potential water leaks. The survey is based on the premise that a household water
service should show zero usage for some hours of the day. The work process includes the
following steps.
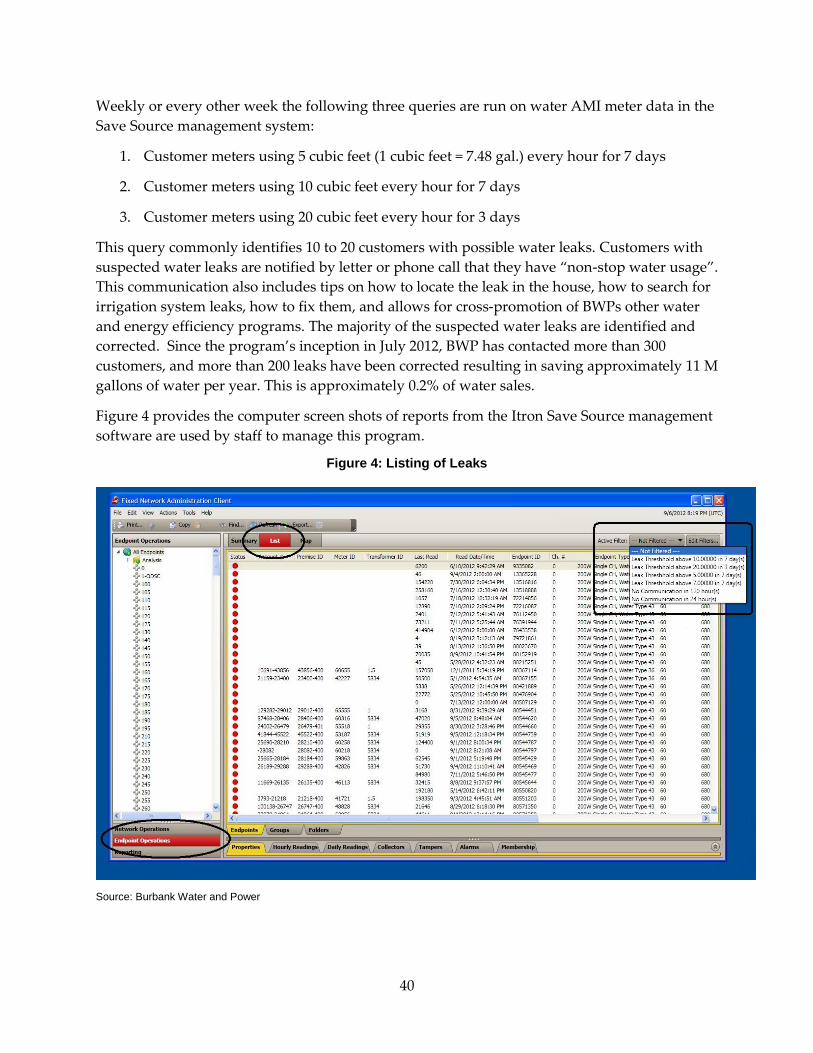
40
Weekly or every other week the following three queries are run on water AMI meter data in the
Save Source management system:
1. Customer meters using 5 cubic feet (1 cubic feet = 7.48 gal.) every hour for 7 days
2. Customer meters using 10 cubic feet every hour for 7 days
3. Customer meters using 20 cubic feet every hour for 3 days
This query commonly identifies 10 to 20 customers with possible water leaks. Customers with
suspected water leaks are notified by letter or phone call that they have “non-stop water usage”.
This communication also includes tips on how to locate the leak in the house, how to search for
irrigation system leaks, how to fix them, and allows for cross-promotion of BWPs other water
and energy efficiency programs. The majority of the suspected water leaks are identified and
corrected. Since the program’s inception in July 2012, BWP has contacted more than 300
customers, and more than 200 leaks have been corrected resulting in saving approximately 11 M
gallons of water per year. This is approximately 0.2% of water sales.
Figure 4 provides the computer screen shots of reports from the Itron Save Source management
software are used by staff to manage this program.
Figure 4: Listing of Leaks
Source: Burbank Water and Power
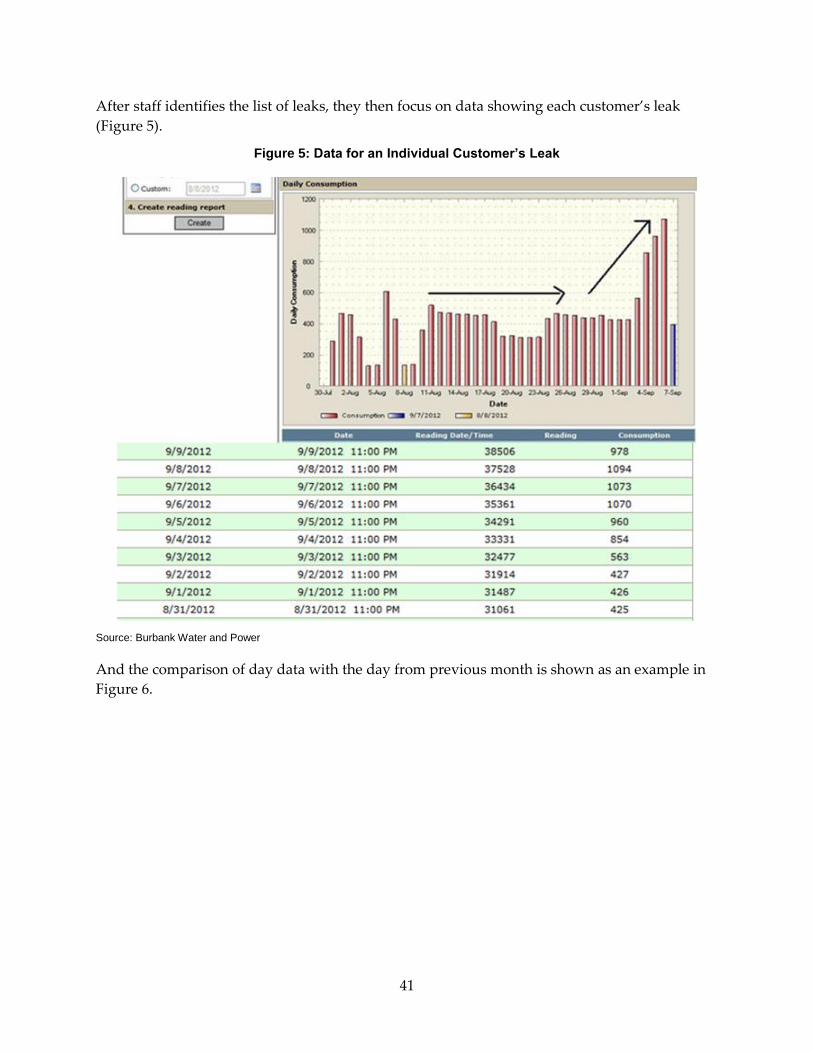
41
After staff identifies the list of leaks, they then focus on data showing each customer’s leak
(Figure 5).
Figure 5: Data for an Individual Customer’s Leak
Source: Burbank Water and Power
And the comparison of day data with the day from previous month is shown as an example in
Figure 6.
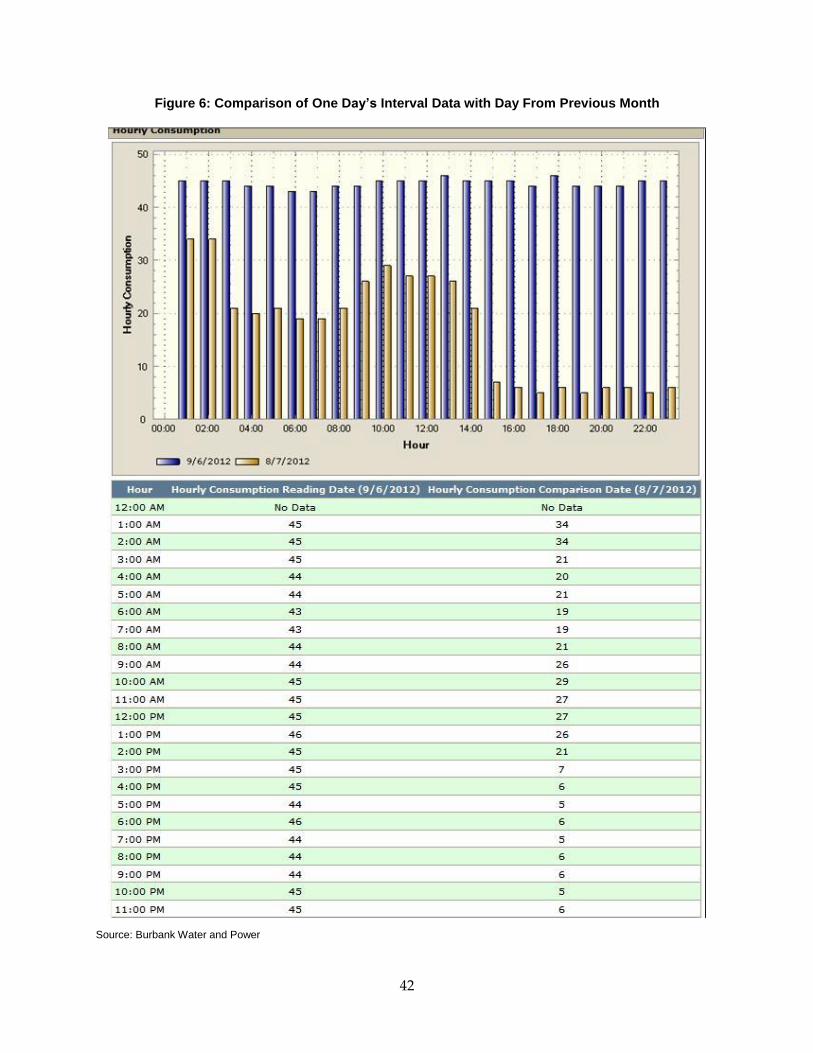
42
Figure 6: Comparison of One Day’s Interval Data with Day From Previous Month
Source: Burbank Water and Power
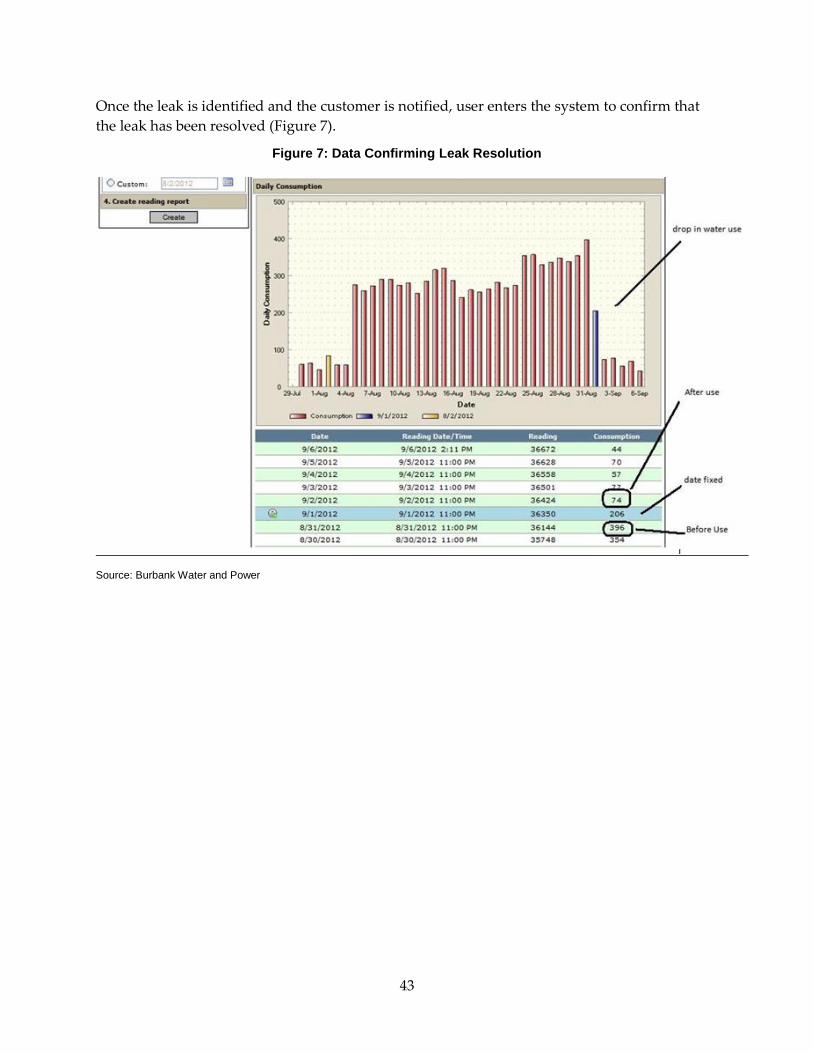
43
Once the leak is identified and the customer is notified, user enters the system to confirm that
the leak has been resolved (Figure 7).
Figure 7: Data Confirming Leak Resolution
Source: Burbank Water and Power

44
CHAPTER 6: Electric Vehicles
6.1 Electric Utilities’ Role in Supporting Plug-in Electric Vehicles (PEVs)
The PEV opportunity presents utilities with several near and mid-term benefits that offset costs
and justify active participation in the market. Beyond PEVs, the wider range of opportunities
provided by transportation electrification may be addressed secondarily as resources and
funding become available.
The following is a list of PEV- focused actions taken by BWP which may be useful to utilities
considering their participation in the PEV market:
1. Establish city policy in support of PEVs – The City of Burbank, working through its City
Council- supported working committees, developed and approved sustainability goals that
include support for alternative-fueled vehicles. This established governing policy which
encouraged BWP to promote PEVs.
2. Promote PEVs via website and external communications - BWP updated its website to
include useful information on PEV support services, and marketed BWP’s EV Charge
program that provides PEV charging service. PEV information was also included in
newsletters targeted to utility customers.
3. Develop a PEV Home Charger Incentive – BWP offers a PEV Home Charger incentive
that provides customers a $100 bill credit if they install a Level 1 or 2 AC charger at their
home.
4. Offer rate options for PEV charging – New Smart Grid program-funded Advanced
Metering Infrastructure (AMI) meters allow a transition to time-of-use (TOU) pricing. BWP
offers a TOU rate to residential customers who operate a PEV.
5. Create an EV Charge Demonstration Program – BWP deployed 11 PEV Level 1 and 2
charging stations at six locations in Burbank as part of the Smart Grid program. This service,
described below, began operation in late 2011. BWP’s approach was to provide utility
owned and powered PEV charging service with pricing that was approved by the City
Council.
6. Participate in utility groups which focus on PEV advocacy and share best practices.
As the PEV market continues to unfold, BWP is considering the following potential next steps:
1. Expand the EV Charge program to provide public additional access PEV chargers.
2. Develop a Commercial Customer PEV Fleet Charger Program. This potential program
supports PEV charging at commercial businesses for fleet or employee use.

45
3. Develop a Multi-Unit Dwelling PEV Charger Program. This potential program supports
PEV charging at multi-unit dwellings.
6.2 BWP PEV Programs
BWP chose early on to be proactive in support of the current generation of PEVs. The
opportunity was evaluated and steps taken to clarify city policy and then to create incentives
and programs to promote PEVs. More recently, staff recognized that electrification provides an
opportunity to better utilize the electric grid’s surplus capacity, and to create new revenues that
will offset load reductions resulting from energy efficiency programs and customer owned
distributed solar generation.
In a sense, PEV chargers are distributed retail electric service dispensers providing point of
delivery sales to any customer who plugs in. Promoting the use of PEVs is good for the air
basin, promotes economic development, and helps customers lower their transportation costs.
And, with thoughtful management, PEV charging may be very helpful in integrating renewable
energy resources.
6.3 Electric Retail Sales Policy Issue
The authority to provide retail sale of electric energy to end users has been a contentious issue
that played out in the 1990s when the electric utility industry contemplated retail competition.
For California, in 1996, Assembly Bill 1890 established retail electric service competition for
Investor Owned Utilities (IOUs), and required Publicly Owned Utilities (POUs) to determine on
a case-by-case basis if retail competition was to be permitted. Poor implementation of
competition led to failure for California IOUs, driving one into bankruptcy, and resulting in the
Enron debacle. Retail competition was then prohibited in California, however, some other states
have adopted retail electric markets with various degrees of success. The retail sales of PEV
charging service presents this issue again.
With the new PEV market, publicly accessible battery charging services are needed to
encourage customers to purchase EVs, so that they will not be stranded on the road without a
means to charge their battery. The California Public Utilities Commission (CPUC) conducted
proceedings in 2009 and 2010 which established that IOUs are prohibited from providing PEV
charging services, and the charging is not to be regulated. This decision was intended to
promote a competitive market for charging service. For POUs in California, the issue of retail
sales of electric service has seen a low awareness level, and action has been slow in addressing
it.
In Burbank, this issue was presented and discussed in the utility Board and City Council. In the
Spring 2014, the City Council adopted Municipal Code language with the following
requirements (paraphrased):
1. Retail sale of electric energy is prohibited except by the City.
2. Resale of City-provided electric energy for PEV charging is permitted, so long as the
price does not exceed the price of PEV charging service established by the City.

46
3. Self-generated solar energy may be used for PEV charging service (with the same price
restrictions).
6.4 EV Charge Program Objectives
In 2011 BWP staff identified grant opportunities to install publicly accessible PEV charging
stations. The Charge Point America program with Coulomb Technologies was engaged to
provide 11 Level 2 AC charging stations at no cost, and the BWP Smart Grid program provided
funding for installation. The 11 stations were installed at six locations in the city, with 9 in the
downtown area and 2 in the southwest corner of the city. Stations are located on three privately
owned parking lots and three city owned lots.
The objectives of this Program are to promote the use of electric transportation, and to evaluate
the use of charging stations installed in the City and operated by BWP. Several aspects of the
program are to be evaluated, including charger load characteristics, charger pricing options,
customer response to pricing, and charger demand response capabilities. Impact on utility
operations and reliability are also to be assessed.
Deployment of publicly accessible charging stations is expected to promote the use of PEVs in
the BWP service area while offering a number of benefits and business opportunities:
• Promote using PEVs in Burbank by reducing customer “Range Anxiety”
• Develop a better understanding of PEV charger operating characteristics and potential
impact on grid operations
• Support the City of Burbank Sustainability Goals
• Zero or ultra-low emission vehicle use will reduce pollution levels in BWPs air basin
• Reduction in greenhouse gas emissions
• Lower operating costs for vehicle transportation
• Reduced dependence on imported oil
• New power sales and revenue opportunities
• Potential to achieve better electric system utilization with off-peak charging
• Provides a new business opportunity to sell PEV charging service
6.5 Host Right of Entry Agreements
Early in the program staff developed Right of Entry agreements with the private property
owners who provided parking spaces for the charging stations. The Right of Entry agreements
establish that the property owners will, at no charge, provide the parking spaces with striping
and access, and BWP will, at no charge, provide the charging station equipment and
installation, separate dedicated electrical service, and all associated equipment operations and
maintenance. BWP sets pricing subject to City Council approval, and BWP retains all charging

47
revenues. The property owners receive the benefit of PEV drivers using their respective
business establishments.
6.6 Station Construction and Operation
The 11 charging stations were installed in summer and fall 2011, and began service December 1,
2011. Design was performed by Clean Fuels Connection, a consulting firm, and construction
was by contract. It was decided that each station would have a power service independent from
the host property owner’s electric service. Each station’s electric service was outfitted with a
new BWP smart meter that measures energy use on a 15-minute interval basis.
Charge Point provided 11 CT2100 charge stations that provide both Level 1 AC 120 volt and
Level 2 AC 240 volt charging services. The stations are linked to the Charge Point head end via
data cell phone. Charge Point provides back office services including billing, collections,
advertising via smart phone app and internet map, and a host of data and related services.
Customers may pay for each service with a Charge Point account card or a credit card with
radio frequency (RF) chip. The Charge Point website offers BWP a very extensive collection of
data and controls for the stations. Charge Point’s service fee and transaction fee is deducted
from revenues, and the balance is remitted to BWP. The real time availability of all Charge Point
stations, including the 11 BWP stations, is displayed on an Internet map
(https://na.chargepoint.com/charge_point) and smart phone application. These services have
been very convenient and are the source of data shown below.
6.7 EV Charge Program Service Results
This section provides sales results for the first 31 months of operations. Data is obtained from
the Charge Point website which provides restricted access to BWP’s charger data. Using the
stations is significantly impacted by the service pricing, which included a free charging rate
holiday from December 2011 to June 30, 2012, and then $2 per hour starting July 1, 2012.
6.7.1 Energy Delivery
In the 31 months since service commenced, the program has delivered 57,000 MWh of energy.
There was a steady growth of service until the end of free service, when energy use dropped by
approximately 65 percent at the start of the $2 per hour rate in July 2012. Since then, energy
delivered has grown more than 400percent in 24 months (Figure 8). Future growth is uncertain
and subject to a wide range of factors.
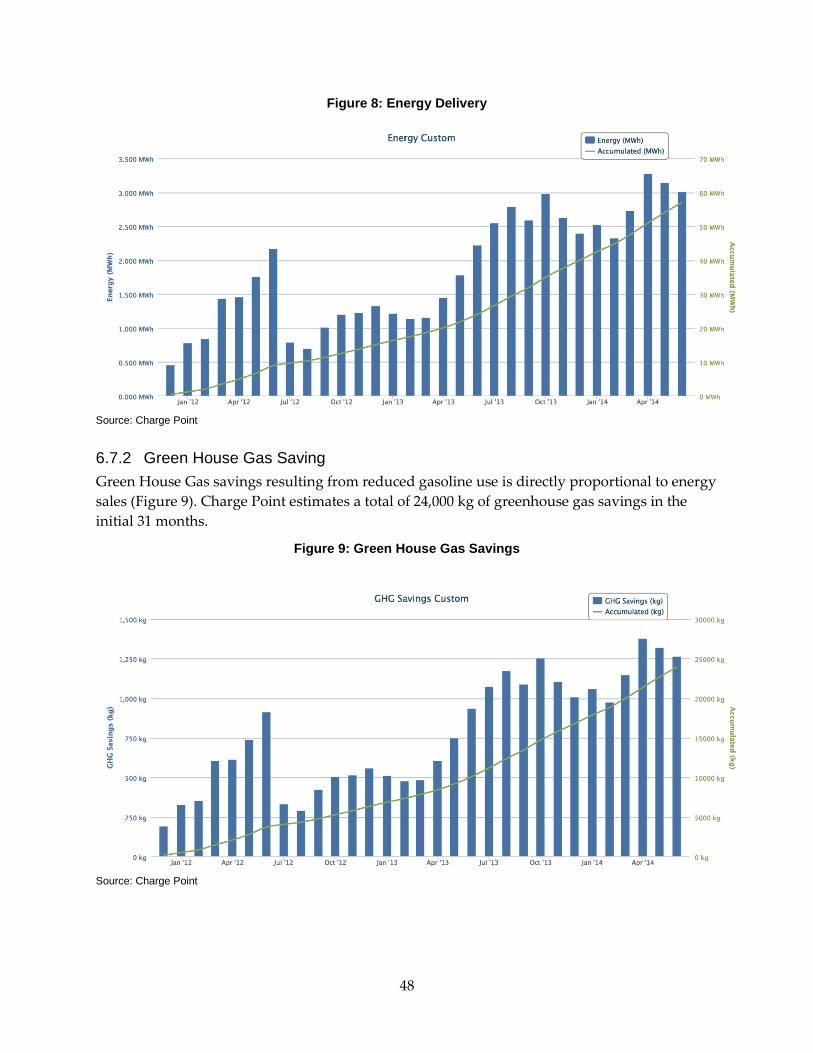
48
Figure 8: Energy Delivery
Source: Charge Point
6.7.2 Green House Gas Saving
Green House Gas savings resulting from reduced gasoline use is directly proportional to energy
sales (Figure 9). Charge Point estimates a total of 24,000 kg of greenhouse gas savings in the
initial 31 months.
Figure 9: Green House Gas Savings
Source: Charge Point

49
6.7.3 Sessions
The Charge Point system keeps very detailed session data, including start time, stop time, kwh,
location, etc. A session is recorded each time a customer initiates service with a Charge Point
card or credit card (Figure 10). The number of sessions has generally increased since July 2012,
with the most recent quarter (Q1 2014) averaging 640 sessions per month. Use tends to drop off
in the first quarter and grow substantially in the second and third quarters of each year.
Evaluation of session data shows the rate of battery charge varies with each session, which is a
function of the EV’s charger size1, the level of battery charge when the session is initiated, and
whether the car remained plugged in after the battery was fully charged. Charge rates are
shown to vary from highs generally of 6 kw per hour to less than 1 kw per hour.
Figure 10: Sessions
Source: Charge Point
6.7.4 Session Length
Figure 11 shows the average session length over the past 365 days is about 1 hour and 15
minutes, but it is common to see durations of 30 minutes to 3 hours. Few sessions exceed 4
hours. A significant number of sessions are only a few minutes long, indicating some form of
dysfunction in establishing the session.
1 Nissan Leaf EVs have 3.3 or 6.6 kw chargers; Teslas have 10 kw chargers, etc.
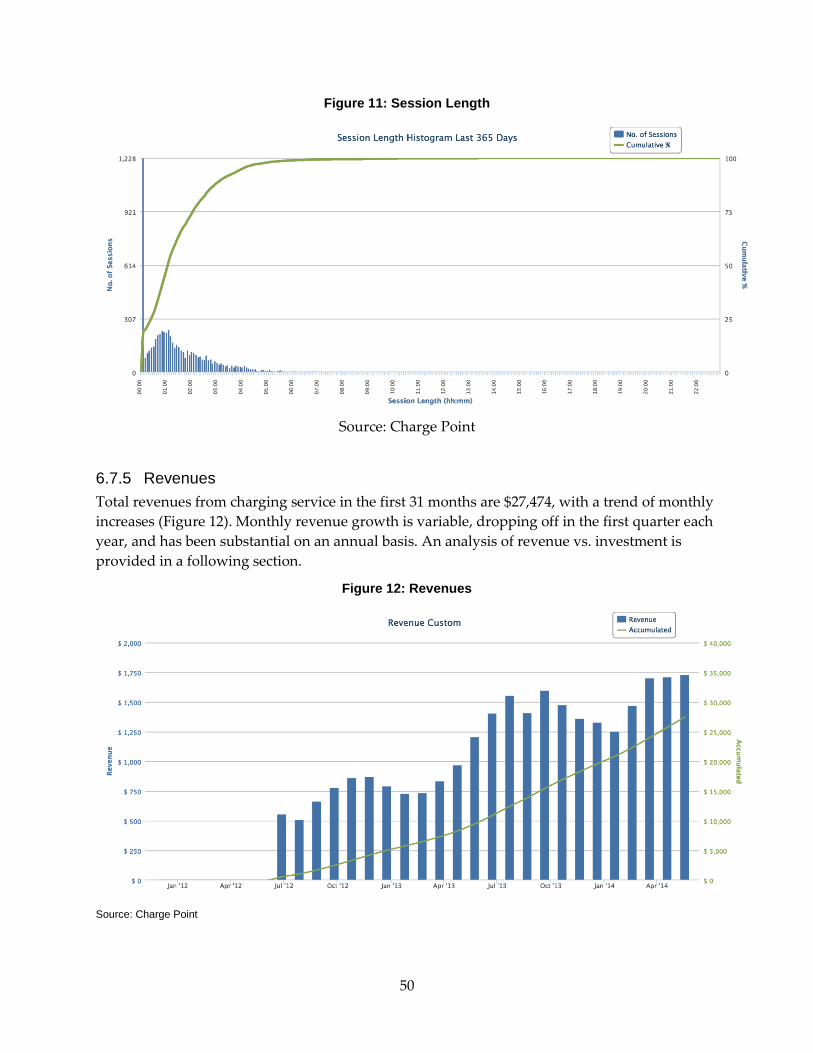
50
Figure 11: Session Length
Source: Charge Point
6.7.5 Revenues
Total revenues from charging service in the first 31 months are $27,474, with a trend of monthly
increases (Figure 12). Monthly revenue growth is variable, dropping off in the first quarter each
year, and has been substantial on an annual basis. An analysis of revenue vs. investment is
provided in a following section.
Figure 12: Revenues
Source: Charge Point

51
6.7.6 Station Utilization
Figure 13 shows total revenues over the initial 31 months for each respective station. The most
utilized station is the 327 N Pass Avenue No. 2 station, which has four times the sales volume of
the slowest station which is located in the parking structure behind the Islands restaurant at 120
Orange Grove.
Figure 13: Station Utilization
Source: Charge Point

52
6.8 EV Charge Program Financial Analysis
The EV Charge program is a demonstration of EV charger technology and was planned in part
to evaluate pricing methodologies. As a business principal, BWP believes customers should pay
for PEV charging service to avoid cross subsidization among electric customers. However,
given that it is very early in the current generation of PEVs and that there are abundant
government sponsored grants and promotional programs, the charger market currently has a
large number of free charging stations. Accordingly, BWP started the program with a 7-month
rate holiday offering free service, and then began charging $2 per hour on July 1, 2012.
In 2011 a rate study was conducted to develop the $2/hour pricing. Staff prepared capital and
operational cost estimates and forecasts of charging service utilization. A “per hour pricing as
long as the car is plugged in” methodology was chosen because it provides an incentive to
move the car once charging is completed. Pricing is intended to recover energy costs, Charge
Point fees, operation and maintenance, utility user tax, public benefits charge, and a
contribution to the capital installation costs. Generally, there is no charge for parking in
Burbank, so there is no pricing component for parking fee.
A summary of investment vs. revenues and payback period is as follows:
• Total installation costs for the 11 stations were $144,000, of which $46,000 was provided
by the US DOE Smart Grid Investment Grant. Equipment was provided at no charge from
the Charge Point program, thus BWP’s total capital outlay was $98,000.
• Total revenues for 31 months of service were $27,474. Costs deducted from this were
Charge Point fees at $0.50 per session plus 5% of revenues.
• Payback of the capital investment is largely based on estimated growth of charging
service revenues. Monthly revenues increased 175% during the past 12 months, and are
likely to continue to increase due to the rapidly increasing number of PEVs on the road.
Revenue modeling suggests that with a 25% revenue growth per year, the initial investment
would be recovered in 7 years, and with a 50% revenue growth per year, payback would be
achieved in 5.5 years. Considering that PEV charging infrastructure is a utility asset with a
20-plus year life, and that utility assets are typically depreciated over a longer time frame,
the charging infrastructure investment fits within standard utility infrastructure investment
practice.
6.9 Moving From Demonstration to Standard Service Offering
As of Summer 2014, BWP believes the EV Charge demonstration program has been a success
and is on a sustainable course. Given the wide range of benefits and governmental support,
BWP recently received approval to expand the charger program and move it into a standard
service offering status. The following next steps are planned:
1. Implement revised charger pricing to a volumetric rate ($/kwh) for Level 1 and Level 2
AC charging, and a separate price for DC Fast Charging service. Volumetric pricing is more
equitable for BEVs and PHEVs, and is expected to attract more PHEVs. (Note, other pricing

53
mechanisms are available that may be suitable for different use cases and charger
ownership scenarios.)
2. Deploy three DC Fast Charge stations in publicly accessible locations and establish a 1
hour parking limit for DC Fast Charger parking.
3. Install additional Level 2 AC charge stations where justified. Seek grant funding when
available.
4. Deploy the “EV Charge N Go” demonstration, funded in part by a California Energy
Commission grant, for up to 8 Level 2 AC charging stations located on city streets near
MUDs, employers, retail, libraries etc. This is intended to demonstrate curbside charging
service on city streets, and to target the underserved MUD market sector.
5. Continue to promote PEVs and expand into TE as opportunities present themselves.

54
CHAPTER 7: Smart Grid Program Benefits
The BWP Smart Grid Program provides a wide range of benefits that cross many functional
areas of the utility. Some benefits have been available immediately upon completion of the
respective project, and many benefits are enabled in the future. Also it is important to note that
many Smart Grid components work together as a system with a wide range of direct and
indirect benefits. The following is a summary of both direct and indirect benefits, and an
overview of some Smart Grid Success Stories. Benefits are grouped by supporting subsystem.
7.1 Fiber Optic and Wireless Communication Systems
1. Expands the reach and redundancy of BWP’s fiber optic network
2. Upgraded Ethernet Switched Services Network (ESSN) strengthens BWP and City data
networks
3. Enables provision of wide area network service, Internet service, enhanced Voice over
Internet service to BWP and City agencies
4. Creates surplus communication capacity to support the One Burbank Program which is
providing valuable services to customers and new net revenues to BWP. Services include
Metro Ethernet, direct Internet access, Data transport, Dark fiber, and Video Transport. This
program supports City economic development goals, and provides high-speed data and
Internet services to BWP, City agencies, City schools and Burbank businesses. Net revenues
have offset costs for Smart Grid projects and helped avoid rate increases.
5. Tropos Wireless network supports AMI, Distribution Automation and other new
services. Includes wide area network for electric and water meters, redundant
communication path for SCADA, optional wireless services to City Departments
6. Mobile workforce communications: Electric services, Water services, Customer services
field personnel have secure access to utility networks and information systems from any
field location in the City
7. Provides high quality, high speed and secure communications to equipment and
systems in electric and water stations, field installed equipment and sensors, and distributed
generation and energy storage
8. Enables improved security for physical plant and cyber assets
7.2 Advanced Metering Infrastructure (AMI) and Billing Systems
1. Replaced and upgraded customer meters that were near end of life cycle and losing
accuracy
2. Provides better accuracy of meter data by eliminating visual meter reading errors

55
3. Enables advanced time based rate structures.
a. Time of Use rate for Electric Vehicle owners
b. Time of Use rate for commercial customers
c. Future Time of Use rate for residential customers
d. Future billing structures such as prepay, real-time pricing, etc.
4. Remote meter reading and on/off service switches improve Call Center ability to address
customer questions, troubleshoot concerns, speed special meter reads, and speed service
order implementation. Service can be turned on or off virtually within minutes of issuing
the command. Customer questions or complaints are resolved during the initial phone call
without requiring a follow up call or need to dispatch field personnel.
5. Reduces Meter Operations costs for meter reading and Field Service Requests (service
on/off)
a. Better staff productivity and work coverage
b. Reduces Field Service Reps by 7 positions
c. Reduces vehicle miles and costs
d. Reduces vehicle emissions
6. Eliminates complaints regarding meter reader intrusion of privacy, meter reader dog
bites, and exposure to industrial accidents when reading meters.
7. Provides far better electric service theft detection, and reduces revenue loss from theft.
AMI meters send a disruption of service flag indicating a meter flip or bypass, so staff is
automatically notified of meter removal. During AMI deployment, staff identified ten
services that had been tampered with, resulting in recovering approximately $12,000 in lost
energy and fees. Staff believes that a larger number of services had tamper modifications,
however because of AMI installation notifications, the tamper conditions were corrected by
the customer before AMI installation.
8. When customers move out of their residence, service can be disconnected promptly ,
reducing energy theft. Also when customers request new service, it can be started promptly.
9. Minimizes lost revenues by reducing the time to implement on/off field orders.
10. Identifies water leaks and reduces losses. With water AMI, leaks can be identified and
customers notified, often before the customer is aware of the problem.
11. Advanced Customer Care and Billing System supports data feeds from multiple sources,
time of use and real time pricing rate structures, demand response programs, net metering,
and customer interaction with consumption data via web portals, social media and mobile
computing devices, support for various energy efficiency and conservation programs

56
12. Provides far better feeder circuit voltage and loading information for managing and
improving reliability and power quality
7.3 Secondary AMI Benefits
1. Improves information available to customers, empowering customers to use energy
wisely and to participate in energy efficiency and conservation programs, demand response
programs, and respond to energy emergencies. The system has enabled Opower Energy
Reports that have an estimated 2% energy efficiency improvement.
2. Provides far better information for system assessment and planning. Improves
information available to evaluate energy use patterns, grid loading, and grid reliability.
3. Supports integration of renewable resources and can help mitigate impacts on reliability
and reduce air emissions. Can monitor voltage and loading impacts of distributed solar
generation, and helps mitigate adverse impacts on power quality. Helps monitor impact of
increased electric vehicle charging infrastructure to avoid any reliability impacts.
4. Increased communications with customers via web portal and social media increases
customer satisfaction, and creates new options for energy conservation and efficiency.
5. Enables demand response programs that can reduce peak demand, reduce demand
during energy emergencies, and provide ancillary services to respond to intermittent
renewable energy resources and keep power supply costs low.
6. New rate structures with improved price signals to customers can reduce peak electric
system load to reduce energy costs and emissions.
7. Reducing peak load requirements can reduce procurement of expensive peak hour
resources, reduce peak hour air emissions, and reduce investments in new generation
capacity.
8. Transformer optimization by analyzing AMI system load data will lower equipment
costs and reduce failure rates.
7.4 Distribution Automation
1. Improved system reliability by reducing the duration and frequency of outages caused
by Mylar balloons, palm fronds, birds and rodents. SAIDI and SAIFI indices show reduced
outages and durations in the past three years. Since deployment of the digital relays and
automatic reclosing on feeder circuit breakers, between 2010 and 2013, Customer outage
minutes have been reduced by over 1,000,000 customer outage minutes per year.
2. Improved power quality and reduced operational costs through managing voltage and
reactive power on system. Can manage voltage proactively to provide better customer
service.
3. Peak shaving and energy efficiency can delay the need to add a new substation or
upgrade feeder capacity.
57
4. Voltage optimization with AMI and remote sensor data can improve management of
system load, saving energy and capacity.
5. Reduced system losses from better reactive power management.
6. Better voltage and load data can enable better phase balancing, reducing losses. Better
data enables analytics based decision making, including planning to prioritize system
replacements, upgrades, and expansion to circuits based on more granular and accurate
voltage and loading data.
7. AMI voltage and loading data enables better transformer loading and life cycle analysis
and equipment design. This helps optimize capital investments.
7.5 Security
1. Greater focus and management of physical and cyber security. This results in improved
security for information systems, data and physical assets, a safer work environment and
lower theft.
2. Increased video monitoring of electric and water facilities.
3. Far greater monitoring and control of data networks, and cyber security.
7.6 Updated Information Systems
7.6.1 GIS (Geospatial Information System)
1. Updated GIS showing all linear grid assets, including station circuit logic supports
several information systems, including SCADA, OMS, Work and Asset Management, IADS,
and future DMS
2. Enables work process integration of grid design, construction, as-builts, operations and
maintenance. This reduces costs and speeds service delivery throughout the work process.
3. Enables better asset management with an accurate inventory and location of distribution
system assets.
7.6.2 ESB (Enterprise Service Bus)
1. Reduces costs of Information Systems through standardization and easier
interconnection.
2. Enables growth into expanded use of data and Information System integration.
3. Provides a centralized integration platform that allows standard linkage to multiple
applications with a high degree of flexibility.
4. Can tie together disparate systems with common reports.

58
7.6.3 OMS (Outage Management System) and AMI System
1. Maintains and improves system reliability through reduced outage duration, better
outage management, and faster load restoration. In some cases,BWP may identify outages
that otherwise would not have known to exist.
2. Improves customer satisfaction due to faster outage response
3. Remote fault detection reduces restoration time and repair costs
4. Provides auditable network performance documentation for regulators
5. Enables identification of system weaknesses to help plan capital investments.
6. Reduces night time searching to locate and resolve outage problems.
7.6.4 SCADA (Supervisory Control and Data Acquisition)
1. Updated SCADA enables increased visibility of the status of the electric system, and
better security and control of the electric system.
2. Updated asset addressing increased network segmentation, simplified interconnections,
provide better asset visibility and can lower operating risks.
3. Revisions to SCADA provided a DMZ (Demilitarized Zone) that improves security by
exchanging SCADA data with business applications outside the access controlled
environment.
4. Having better information on the status of the electric system is helpful in supporting
reliable operations with expanded use of distributed renewable generation.
7.6.5 IADS (Integrated Automatic Dispatch System)
1. Enables ability to manage and optimize a vastly increased range of energy supply
resources, distributed generation, energy storage and new demand response resources.
2. Improves the economics and reliability of power supply and grid operations through
optimizing supply options, demand response and use of distributed resources.
3. Enables more profitable market transactions using a larger portfolio of supply and
demand-side resources.
4. Can enable deferral of distribution system investments by optimizing distributed
generation and storage resources.
5. Better load forecasts and control of supply and demand resources will reduce
inadvertent interchange with external grid operator and reduce resulting costs.
6. Will enable optimal use of load shifting, peak demand management and load reduction,
provision of ancillary services from distributed demand side resources, deferral of
generation investments due to peak reduction.

59
7. Unquantifiable benefits include improved power quality, improved reliability,
improved environmental benefits and customer satisfaction.
8. Greater use of distributed resources will reduce capital requirements in generation,
transmission, and distribution.
7.6.6 Distribution System Model
1. Model allows engineering evaluation and assessment of load growth, overloaded
circuits, power quality problems, and other grid engineering requirements.
2. Enables engineering to evaluate alternative system configurations to optimize capital
investments and provide maximum system benefit.
7.7 New Technologies
7.7.1 Electric Vehicle Charging Stations
BWP’s 11 Charge Point America public access electric vehicle charging stations provide the
following benefits:
1. Promote Electric Vehicle use in the City in support of City Sustainability goals.
2. Provide economic development benefits to downtown Burbank.
3. Reduce air pollution and greenhouse gas emissions.
4. Reduce dependence on imported oil.
5. Help customers reduce transportation costs.
7.7.2 Ice Energy Thermal Energy Storage
Ice Bear Thermal Energy Storage units (29) are installed at various BWP and City buildings,
providing a technology demonstration with the following benefits:
1. Collectively reduce peak system demand by approximately 230 kW
2. Shifts approximately 1400 kWh per day from on peak to off peak
3. Reduces building cooling energy consumption by approximately 5%
4. May be used to create regulation service for ancillary services.
7.8 Smart Grid Success Stories
The following examples of benefits demonstrate how Smart Grid systems integrate to provide
improved customer services and operational efficiencies.
7.8.1 Call Center Customer Troubleshooting
BWP’s Customer Call Center receives on average 7,000 customer calls per month (from 52,000
electric and 27,000 water customers). These numbers vary seasonally, and tend to be higher in
the summer months. Customers call to start electric or water service, disconnect service, inquire
about billing issues, submit high bill complaints, ask about programs, and to address numerous

60
other issues. In 2010 an Integrated Voice Recorder (IVR) system was upgraded to help
customers get the information they seek in as short amount of time as possible. BWP’s Smart
Grid program also provided several features to help the Call Center be as responsive as
reasonably possible to customer calls. The AMI project placed Smart Meters at all customer
sites, and along with the new Meter Data Management System (MDMS) and new Customer
Information System (CIS) provides to Call Center staff 5 or 15 minute interval energy usage data
and 60 minute interval data for water meters. Electric meter data is updated every day between
midnight and 9 am, and water meter data is updated on a continuous basis. The electric meter
data is also presented to Customers via BWP’s website and meter data portal.
The Call Center can now look at the MDMS data or the AMI control system to understand and
then explain why bills may be higher or lower over a given period. Staff can help customers
understand why a rise in temperatures may have resulted in higher energy bills for space
cooling. BWP’s water AMI meters are also recorded in the MDMS, and similar troubleshooting
can be provided for high water bills. During a call, staff can get a special meter read while
asking the customer to look at the meter at the customer’s house. Correlating these two helps
instill confidence in meter reading accuracy. Greater availability and granularity of meter data
has helped troubleshoot customer inquiries and improve customer satisfaction.
Call Center managers are seeing that having timely access to more detailed information results
in greater confidence in what is occurring with the customer’s service, thus enabling faster
decision making and quicker problem resolution. This results in a higher incidence of resolving
the customer’s issue on the first call. Additionally, the new CIS helps staff track calls from
specific customers, resulting in better and more customized customer service. Better
information supports the growing “Learning Organization” culture that managers are seeing
staff embrace. And lastly, the growing interdependence between the Call Center staff and the
Billing staff is resulting in improved organizational cooperation.
7.8.2 Meter Reading and Electric Service Requests
AMI has had a dramatic beneficial impact on reducing meter reading costs and the number of
Field Service Requests. Prior to the AMI installation, the Customer Services staff issued an
average of 2,500 Field Service Requests per month. These were to instruct Field Service
Representatives (FSRs) to travel to customer sites to turn on service, turn off service, read
electric or water meters, or perform other field related tasks. With the new Smart Meters in
place, meter reading is performed over the wireless network automatically or on command, and
BWP’s meter reading staff has been reduced by seven positions, reducing operational costs.
All residential Smart Meters include a remote operated on/off service switch. This allows office
staff to remotely turn an electric service on or off. With the new meters in place, Field Service
Requests have been reduced 87% to approximately 300 per month. Stated differently, during the
period March 2013 to February 2014 a total of approximately 13,200 field trips were avoided by
using the AMI systems. Also, the new wireless communication system supporting AMI
reporting also provides network connections to field forces providing a virtual office while in
the field to get assignments, check records, etc. All of these new capabilities result in reduced
staffing costs, reduced vehicle travel and emissions, and much faster customer service.

61
When a customer calls in to request a new service or to make payment of late bills, staff can
remotely turn service on in 15 minutes or less. Previously this task would have required a field
trip and 8 to 24 hours to complete the requested task. Expanding on this benefit, previously
when customers would call in during non-business hours and weekends to make late payment
or have special service requests, they had to wait until the next business day for response to
their request. With AMI, BWP’s 24x7 security staff can respond to these calls and turn on service
within minutes. When such events occur on a Friday evening, customers can now get service
restored within minutes, and not wait until Monday. Additionally the new billing system
records late payment receipts, and will automatically order service restoration.
These benefits are reflected in improved customer satisfaction. A random survey of Call Center
callers is showing a doubling of positive survey responses. BWP’s customers are benefiting
from reduced field staffing costs, lower vehicle transportation costs, and resulting lower vehicle
emissions. Lower service costs are expected to offset other rising business costs.
7.8.3 BWP’s ONE Burbank Program
BWP’s fiber optic network started in the mid-1980s has grown to connect all BWP and most City
facilities, over 150 key businesses in the City, and interconnections to key telecommunication
hub buildings. Recent investments in the fiber optic system were funded by the Smart Grid
program to support connections to the wireless network. As the fiber optic network was built,
surplus fiber strands were installed at nominal cost with a long term strategy to use surplus
capacity to provide beneficial uses and revenue generation. In the past few years, redundant
fiber circuits connecting to the largest telecom hubs in downtown Los Angeles have been
leased, essentially interconnecting BWP’s networks to the worldwide telecom carriers. And, the
Ethernet Switched Services Network (ESSN) was built with great capacity with relatively low
cost options to add capacity for future demand.
The ONE Burbank (Optical Network Enterprise) program began service in 2010, and represents
BWP’s strategy to use surplus communications capacity to sell services to businesses in
Burbank. Customers enjoy a highly reliable fiber based service at reasonable prices. ONE
Burbank services include:
• Dark Fiber – Point-to-point fiber circuits connecting buildings in Burbank without BWP
network equipment
• Dedicated Internet Access – Internet service on secure, fully redundant, fiber-to-the-
business, IP/MPLS network, with port speeds of 20 Mbps to 1 Gbps, and symmetrical
uploads and downloads.
• Virtual Private LAN Services (VPLS) – Layer 2 Ethernet-based services provide multi-
location business the ability to operate as part of a single meshed network at speeds from 10
Mbps to 1 Gbps. VPLS is a preferred technology to connect geographically dispersed
locations securely and reliably.
62
• Wave Services – Secure, fully monitored high capacity point-to-point connections
delivered over a secure, low-latency Wave Division (DWDM) network, scalable up to 10 G
capacity.
• All services are monitored 24 x 7 x 365 with management and customer support services.
This program has been very well received by businesses and sales have grown steadily. The
service supports the City’s economic development goals by encouraging high tech and
entertainment industry businesses to move to Burbank and take advantage of low cost high
capacity and reliable network services. Importantly, net revenues from the ONE Burbank
program provide significant funding for the overall Smart Grid program, and have helped
avoid rate increases for program funding.
7.8.4 Outage Management
BWP’s Smart Grid program includes several elements to enhance management of electric
system outages. The Geospatial Information System (GIS) was version upgraded and all electric
grid assets were accurately added to the database. The Outage Management System (OMS) was
also version upgraded and integrated with the GIS. The last steps were to integrate the OMS
with the AMI Meter Management system and the new Customer Information System (CIS).
The OMS provides grid operators and Customer Call center staff a map of the grid showing the
location of meters without power. This information is updated in near real time, and is used to
direct and manage field crews to restore power, and enables the Call Center to communicate
outage location and estimated return to service information to customers. Field personnel also
use OMS to get restoration assignments and to report status.
When an outage event is occurring, the outage information is provided in a greeting message
for all incoming customer calls. The message explains outage locations, estimated restoration
times and gives customers a call back option to notify of service restoration.
Integrating the OMS to the meter system proved challenging and required much
troubleshooting. Problems were encountered to smoothly integrate meter flag transfer to OMS.
AMI meters send a “Last Gasp” flag or message just after losing power. This message is
received by the meter management system and relayed to OMS two minutes after receipt. This
delay is inserted to allow circuit reclosers to restore power if the outage is caused by a
momentary fault like a falling palm frond or Mylar balloon. Meters also send a “Power Restore”
flag when they start to receive power following an outage. This flag is received by OMS which
updates its outage map. The system also allows grid operators to test any meter to verify it has
power.
OMS is still in its early adoption phase and staff is learning how to use the system beneficially.
Standardized outage reporting is an expected benefit of the system.
7.8.5 System Voltage Data
The electric AMI meters are providing an enormous wealth of data on energy usage, system
voltage and other technical data. Prior to the AMI, system operators only had this data at
electric stations, grid intertie points and at very few number of field devices. With AMI, this

63
technical data is now available at virtually every customer service location. Voltage sag and
swell events are reported daily as well as time interval voltages. In initial operations the data is
reported by the meters and retained in the MDMS. Operators and engineering staff are just
beginning to extract this system data for operational assessments and engineering studies. A
few examples of benefits of this new capability are as follows:
One of the first uses of AMI meter data was to aid in troubleshooting a voltage problem in the
field. A residential customer called in stating his sensitive equipment was picking up very high
voltage. No other calls on this problem had been received. A field crew was dispatched to
investigate. At the same time, engineering pulled up meter voltage data on the MDMS and
immediately identified the high voltage issue. A review of the electric circuit and voltage data
indicated the cause was probably at a nearby voltage regulator. The field crew went directly to
the voltage regulator and found it stuck in the maximum voltage setting. The problem was
resolved within an hour of discovery. This quick problem resolution helped mitigate a
potentially hazardous situation and avoided potential damage to equipment and property.
Figure 14 shows voltage profile data in the MDMS for this incident, and the drop in voltage
when the corrective action was taken. Engineering staff is evaluating ways to use voltage data
proactively to avoid such problems in the future.
Figure 14: AMI Meter Voltage Data
Source: Burbank Water and Power
As a second benefit example, staff is using AMI load data to evaluate and optimize equipment
sizing. Prior to AMI, engineers had one meter read per month per customer. To size distribution
transformers and circuit size, engineers would assume the worst case scenario and use the
highest meter read per customer per year to get peak loading on the circuit. This approach
resulted in oversizing equipment, resulting in higher energy losses and higher capital costs. By
using AMI data with 15 minute interval loading data, engineers now can determine actual peak
coincident loading on transformers. This results in confidently specifying transformers 1 to 2
sizes smaller than previous design, resulting in lower capital and operating costs.
Now that engineers have good granular data on energy use, voltage and real power, they are
better able to assess power quality issues on all electrical circuits throughout the city. In a recent
system planning study, engineers were able to survey meter data for all meters on the entire

64
distribution system and identify meters with voltage in the low end of the acceptable range.
This produced results that were unexpected, and caused a shift in funding priorities for system
upgrade projects for the coming several years. The net benefit is improved power quality for
BWP’s customers.
7.8.6 GRIDview Software Data Analytics
In early 2014, BWP deployed advanced grid analysis and management software from Gridiant,
a software company with new products that analyze and present Smart Grid developed data.
BWP’s initial deployment was Gridiant’s GRIDview software.
This software is very attractive to engineers and system planners because it provides very rapid
and effective presentation of AMI system data for analysis of grid loading and voltage
performance. The application includes a browser-based, rich, and dynamic User Interface, with
interactive geospatial layouts using Google Maps®, charts, graphs, tables, and exportable
reports. The GRIDview™ dashboard and visualization application combines Gridiant’s
Dynamic Connectivity Model, static data from GIS, and dynamic data from MDM or AMI,
SCADA, and OMS systems to provide full geospatial visualization into the distribution
network. Using detailed calculations and monitored data, network health, asset performance,
technical and non-technical losses, and peak load contributors are identified, monitored, and
displayed with very easy access and specification. Advanced algorithms provide asset
information such as feeder loading and transformer stresses. System-wide voltage violations
both above and below nominal voltage are identified using either calculated or measured data.
This tool provides engineers with data for improved strategies for asset management and
optimization, revenue protection, and demand response programs. It is ideal for predictive
maintenance and planning for all components on the distribution system including all lines,
feeders, transformers, switches, capacitors and Distribution Automation equipment. It enables
engineers to evaluate the impact on voltage and system loading from distributed rooftop solar
installations and electric vehicle charging systems. It will also be useful in developing predictive
maintenance strategies and prioritizing locations to instrument the grid. BWP expects in the
future to evaluate additional Gridiant applications that analyze Smart Grid developed data.
The sample screen shot (Figure 15) of the GRIDview software shows transformer loading,
including a GIS based map showing transformers exceeding design loading, transformer
loading profile and load duration curve, summary loading data for all transformers, and a
graphic showing loading on a specific transformer per hour and per day of a seven month
period. The program also provides more loading and voltage data analysis.
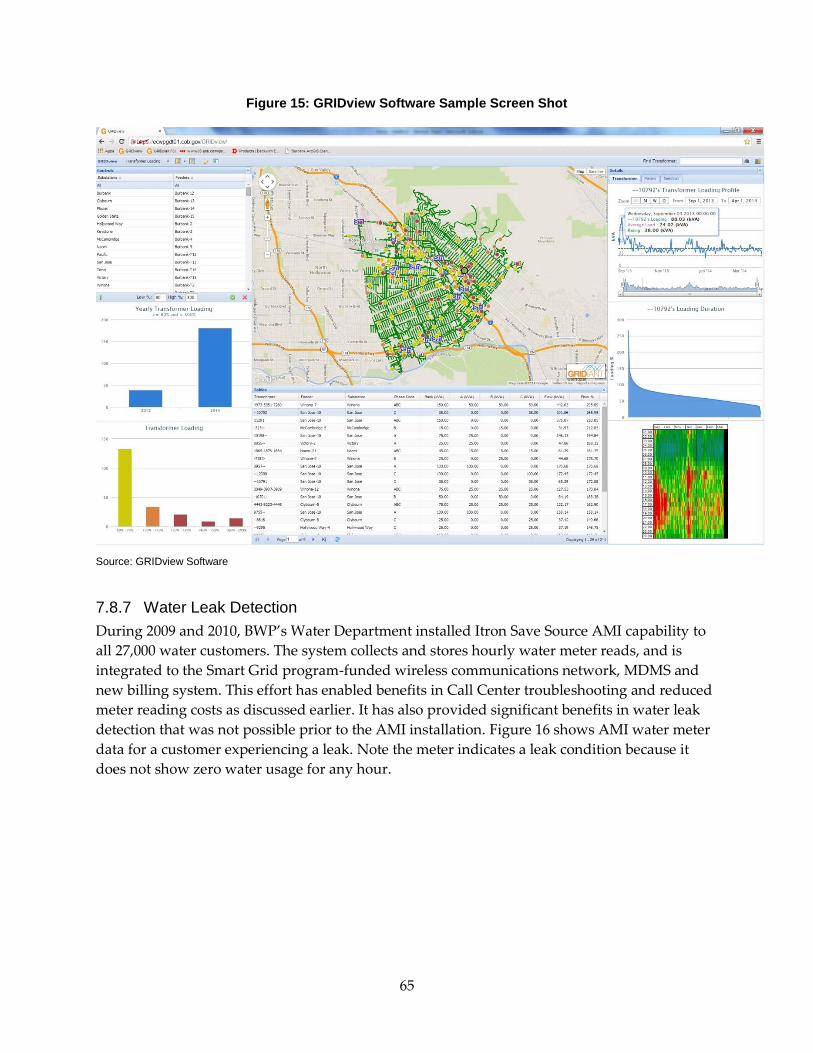
65
Figure 15: GRIDview Software Sample Screen Shot
Source: GRIDview Software
7.8.7 Water Leak Detection
During 2009 and 2010, BWP’s Water Department installed Itron Save Source AMI capability to
all 27,000 water customers. The system collects and stores hourly water meter reads, and is
integrated to the Smart Grid program-funded wireless communications network, MDMS and
new billing system. This effort has enabled benefits in Call Center troubleshooting and reduced
meter reading costs as discussed earlier. It has also provided significant benefits in water leak
detection that was not possible prior to the AMI installation. Figure 16 shows AMI water meter
data for a customer experiencing a leak. Note the meter indicates a leak condition because it
does not show zero water usage for any hour.

66
Figure 16: Water Meter with Apparent Water Leak
Source: Burbank Water and Power
BWP’s Customer Service has assigned staff to periodically review meter data and notify
customers of potential water leaks. The survey is based on the premise that a household water
service should show zero usage for some hours of the day. The effort includes the following
steps.
Weekly or every other week the following three queries are run on water AMI meter data:
1. Customer meters using 5 units (1 Unit = 7.58 gal.) every hour for seven days
2. Customer meters using 10 units every hour for seven days
3. Customer meters using 20 units every hour for three days
This query commonly identifies 10 to 20 customers with possible water leaks. Customers with
suspected water leaks are notified by letter or phone call that they have “non-stop water usage”.
This communication also includes tips on how to locate the leak, how to fix it, and how to
search for irrigation system leaks. The majority of the suspected water leaks are identified and
corrected. During September 2013 to February 2014, 29 leaks were corrected resulting in saving
approximately 3,000 gallons of water per year. This is approximately 0.5 % of water sales.
67
CHAPTER 8: Smart Grid Program Lessons Learned
The following lessons learned were identified during the BWP Smart Grid program.
8.1 General Program Lessons
1. Conduct a data architecture analysis and study early on to identify the overall scope of
information systems, interfaces, and provide a roadmap for development. Get
management team support for the roadmap to enforce decisions during the course of the
program, and afterwards.
2. Deploy Virtual Machine Servers and Enterprise Service Bus early to support system
deployments. Realize that migration to the ESB will play out over time and will require
reinforcement and continual support by the management team. Note the urge to
continue to make point to point connections will work against ESB implementation.
3. Seek opportunities to leverage investments for new revenues, e.g. Fiber Optics
4. Modernization benefits from evolving the business organization to include staffing for
Operational Technology (OT) in addition to Information Technology(IT). OT plays an
important role to bridge the gap between IT and the operating units that are focused on
business functions, grid operations and reliability. OT also helps the line organizations
identify, implement and maintain complex new network and information systems. It is
helpful to establish a division of responsibility to clarify job requirements, authorities
and who does what.
5. Modernization requires transitioning construction, operation and maintenance
personnel to greater technical knowledge and skills to utilize new digital information
based systems. Provide required training, and involve these personnel in the
development and deployment of new systems to provide ownership and understanding.
6. Be aware of software version risk. Software vendors are continually evolving their
systems in response to customer feedback, etc. Version upgrades are expensive and
challenging if they are required relatively shortly after completing initial deployments.
Identify version upgrade roadmaps before committing to software procurement.
7. Make physical and cyber security a central element in planning all information and
communication deployments.

68
8. Organizational resistance to change and failure to revise and update work processes are
two common obstacles to achieving the full benefits of modernization project
investments. Actions that can mitigate these challenges include:
• Create ownership and anticipation by requiring end user groups to participate in
project scoping, deployment and start up.
• Early in the program establish organizational plans (Resource, Data Architecture,
Security, etc.) that clarify organizational goals, objectives and policy. Ongoing
management support for the organizational plans helps focus priorities and
decision making.
• During scoping, perform Use Case analysis that helps the end user group
understand how the respective system or asset that is under development will be
used and the expected benefits.
• During project scoping, engage the project team to brainstorm potential work
process re-engineering opportunities. Develop these during the implementation
phase of the project. Identify work process reengineering tasks and personnel
resources in the project plan.
• Create a “Learning Organization” culture that provides a safe environment for
idea creation and evaluation, and encourages staff to leverage Smart Grid
investments to develop and implement new ways and processes to meet
organizational goals.
8.2 Project Management Lessons
1. Use Project Management concepts to manage performance and expectations
• Have a Smart Grid program manager to organize and coordinate overall
program
• Have project managers for each respective project
• Have an Executive Steering Committee that meets weekly to navigate decisions,
provide oversight, and ensure coordination among work divisions
2. Use written Project Charter process for project scoping and authority
• Include scope, project team, schedule, budget, business justification, etc.
• Aside from concept studies, do not spend funds prior to Charter approval

69
3. Project teams should take ownership of economic justification requirement for
respective projects and ensure control of project costs and achievement of anticipated
benefits.
4. Take time to do good project scoping and planning
• Involve in-house experts, third party experts, vendors to evaluate and select
technology options
• Include end user group, and construction and maintenance personnel in project
scoping, scheduling and planning
• Get demonstrations of systems before selection
5. Manage scope creep. During project deployment, requests to change scope threaten
schedule and cost management. Focus on completing the original scope, limit changes to
small scope adjustments, and involve management in scope change decisions. Have a
formal scope change process requiring management approval.
6. In the project planning phase, perform a Use Case analysis. Think through and outline
several obvious scenarios of how the system will be used when in-service. Use this to
verify work scope, operation and maintenance staffing, work process reengineering
opportunities, etc. Ideally, identify how and when to perform work process
reengineering to gain the greatest value from the completed system.
7. Also in project planning, identify vendor integration points and develop plans on how
to make integration go smoothly. If possible include integration point information in
bidding documents to advise vendors about their required cooperation.
8. Follow contract administration basics: Do not pre-pay vendors for equipment; Avoid
verbal work scope agreements
9. When appropriate, use third-party subject matter experts as project advisors to avoid pit
falls, etc.
10. Two project management truths: Transparency is the project’s friend, and teams make
better decisions. Project Managers and teams should share information, establish
effective project coordination meetings, and develop simple tools to track work
activities.
11. Provide sufficient staff or contract support for system integration. Integration is a time
consuming requirement that should be planned for.

70
12. Prior to system commissioning, prepare good “Go-Live” plans that address potential
contingencies.
8.3 Communications and Smart Grid Core Systems (Wireless, AMI)
1. Communication systems and data networks are a key foundation to modernization. Plan
communication systems to support a wide range of applications/systems; be forward
looking. Fiber optics are a future proof solution that has exceptional capacity.
2. Place the basic communication network in service prior to starting AMI meter
deployments. This allows verification that the newly deployed AMI meters are
functioning properly as they are installed.
3. When building fiber optic systems include extra fiber strands at nominal cost for future
growth and expanded beneficial use.
4. Leverage fiber and wireless networks for maximum benefits to the utility, customers,
and city departments, including revenue generation provided by surplus capacity.
5. If possible construct networks with staff that will operate and maintain the completed
equipment.
6. Prior to completing construction, prepare Commissioning Plans including the process to
migrate from the old to new system. Be realistic in scheduling testing time, reliability
and quality control measures, and when to go-live.
7. Capacity of a hybrid fiber and wireless network can be increased in the future by adding
additional fiber/wireless gateways that are points where back haul enters the fiber
network. This helps future proof this solution.
8. Dealing with technology evolution: Do thorough technology evaluation before
procurement of equipment. Communicate with vendors and learn their development
plans. Create or participate in User Groups that bring together multiple users of systems
to share lessons learned and collectively drive vendor development plans.
9. Training: It is common to provide training of completed equipment/systems as they are
brought on line. Ideally provide ongoing training that is included with maintenance and
support.
10. Plan AMI customer education and engagement and develop a customer opt-out policy
early in the program.
11. Sophisticated AMI networks require sophisticated management tools. In early planning
for an AMI program, effort should be put into determining system requirements and
71
data expectations, and then in the vendor selection process verify the functionality
offered, including system management tools.
12. Allow plenty of time to plan out the AMI meter deployment including logistics, asset
management, record management, staffing, integration with communications and
MDMS, test and start up protocols, troubleshooting, etc.
13. Data can be a blessing and a curse. As the industry becomes more dependent on interval
metering data, it is crucial that this data be timely and accurate and requires a dedicated
set of vigilant resources to monitor data quality and take corrective actions when
anomalies appear.
14. Much of the benefit derived from an AMI system is based on operational improvements
that result from intelligent use of AMI meter data. These applications are the result of
both integration and development activities that must be strategically planned and
implemented.
8.4 Command and Control Systems (SCADA, OMS, IADS)
1. Define system requirements up front and select equipment and vendors that support the
requirements.
2. Require using test environments for all critical information system implementations (e.g.
command and control, financial, etc.). This redundancy is very valuable once the system
is in service by allowing testing and development to be performed outside the online
operational critical system.
3. Document testing process requirements and results.
4. Before, during and after project implementation, establish an ongoing feedback loop
from user groups to support personnel.
5. For key information systems, clarify Owner/User and System engineer assignments and
responsibilities.
6. Obtain Project Manager and user group manager acceptance sign off before final
acceptance from the vendor.
8.5 Distribution Automation
1. Carefully evaluate relay function and data requirements before selecting vendor
equipment.
2. Include the end users including operations, test and maintenance personnel to
participate in system selection.

72
8.6 Business Systems (GIS, ESB, CIS)
1. GIS: Prioritize the placing of all assets in GIS early. This is essential to support multiple
applications that are dependent on reliable records of the electric distribution system.
Revise work processes to assure GIS is a foundational system that is integrated with
design, construction and operations work processes.
2. Select high-quality and experienced professionals and experts to guide and advise
information system deployments. Include consultant support as appropriate.
3. CIS: Flexibility of in-house Subject Matter Experts to participate when the need arose
was a crucial element to the CIS project’s success.
4. ESB: Migration to an Enterprise Service Bus (ESB) architecture is a disruptive
technology. Prior to having an ESB, common practice is to implement information
systems with complex point to point integrations. Getting staff to buy-in to using a
common information module and standardized ESB integration is difficult. Integration
of new and updated systems to the ESB requires ongoing management support and an
ESB support group that makes integration as easy as possible. ESB training is essential to
building understanding of the value of this investment.
5. The OT organization provides important services, including how to get information,
management of data and information, and application design support, all with a focus
on making the “User Experience” as effective and efficient as possible. It is helpful for
management to define up front the OT role and authorities to govern technology
selection, implementation and management.
6. Data inventory and management is an ongoing organizational challenge. Smart Grid
provides a whole new catalog of data and information that collectively provides a great
number of data issues to analyze and manage. Common issues are what data do you
have, how is it organized and sorted, how can it be accessed, who maintains it? Classify
data as it is received to help access the data later. Getting information on the ESB for
management and optimum access is the goal, along with ensuring the User Experience
is effective.
7. Define a communication plan early in the project. During implementation, project
leadership should focus on disseminating information downwards throughout the
project organization. The Project Manager should ensure good communications among
team members.

73
8. CIS: The appropriate identification of “system users” and their varying system needs
early in the project aided in development of a successful training program that solidified
system adoption at go-live.
9. CIS: By spending the necessary time during the request for proposal process, BWP was
able to secure hardware and produce a high-level design for the overall architecture of
the solution. This allowed the project to focus immediately on mobilization of the
appropriate environments and not have to spend time going through procurement.
10. CIS: Early knowledge of integration points between key systems was lacking and
required extra time to define requirements and caused some level of late phase scope
creep. The experience and knowledge gained throughout project deployment should be
documented clearly and shared with the organization for future needs.
11. CIS: Understanding the complexity of an MDMS upgrade as part of the overall CIS
project was underestimated and ultimately had to be scratched. More focus on interface
requirements should be given prior to kicking off the project.
12. Change management during deployment is critical to avoiding delays and interruptions
in testing due to incorrect versions of code.
13. There is now a vast amount of data available for the utility, but it is very difficult to
access the information because the data sources are scattered. Earlier discussion on data
access should be revisited to expose the wealth of information both horizontally and
vertically throughout the organization.
14. CIS: Recognizing the need for experienced system support post go-live provided the
ability for immediate triage for issues post go-live, resulting in practically zero
customers facing impact.
8.7 Retail Customer Services Lessons
1. Management established a policy early in the Smart Grid program that Demand
Response (DR) programs must create sufficient benefits to offset costs, thus avoiding
cross subsidy by non-participating customers. Limited exceptions to this rule were
possible to pilot or demonstrate promising technologies. Because of this requirement no
DR programs have been implemented to date.
2. Demand Response program benefits can be viewed as economic only or reliability
based. Customers are much more receptive to reliability based programs.
3. Customers will choose products providing convenience to them, with less support for
programs that benefit only the utility. Again, it is the User Experience that is important.

74
4. Energy Efficiency and Demand Response program benefits can be measured/deemed, or
estimated. Examples are deemed power savings from energy efficient refrigerators, vs.
estimated savings from Home Energy reports that provide recommendations to save
energy. Both approaches have merit. Best practice in developing retail programs is to 1)
Segment and understand the customer base, 2) Evaluate what the customers want, and
3) Select a portfolio of programs accordingly. This is likely to attract a wider range of
adopters.
5. Smart Grid and Utility modernization provides a substantial amount of information for
analysis and beneficial use. The industry is currently in the process of developing and
evaluating the best means to use that data. Sharing of data with customers is rapidly
evolving through the following options: Written newsletters and bill inserts; social
media (Facebook, Twitter, etc.) in-home displays; web portals; programmable
thermostats; mobile Smart Phone applications; and more to come. It is too early to
determine which method of communication with customers is cost most effective and
productive.
6. It is preferable that DR programs create energy efficiency or energy savings which are
shared with the customer. Avoid DR programs that simply pay customers to use less
energy. These are not sustainable.
7. Network access to devices in the home or business is best achieved through the
customer’s broadband, on an opt-in basis. This is more practical and secure than access
via the utility AMI system. In addition, very few customers want real-time data from the
AMI system/meter.
8. The customer web portal is most effective if you also offer on-line strategies and tips for
energy savings or peak shifting, providing information rather than data. This empowers
customers to take action to reduce bills while monitoring savings on the web portal.
Also, promotion of the web portal through digital means (email marketing, social media,
etc.) rather than print is essential to achieving wider customer use.

75
GLOSSARY
Term Definition
AMI Advanced Metering Infrastructure
CIS Customer Information System
DA Distribution Automation
DIS Distribution Management System
EMS Enterprise Message Service
EPIC Electric Program Investment Charge
ESB Entrprise Service Bus
ESSN Ethernet Switched Services Network
GIS Geospatial Information System
IADS Integrated Automatic Dispatch System
MDMS Meter Data Management System
OMS Outage Management System
RTU Remote Terminal Unit
SCADA Supervisory Control and Data Acquisition
Smart Grid Smart Grid is the thoughtful integration of intelligent technologies and
innovative services that produce a more efficient, sustainable,
economic, and secure electrical supply for California communities.
TIBCO The Information Bus Company