Embed Size (px)
Citation preview

Title: Wave impacts on structures with rectangular geometries: Part 1 Seawalls
(note: Part 2 will give results for wave impacts on baffles and baffled structures)
Authors: Nor Aida Zuraimi Md Noar and Martin GreenhowAffiliation: Department of Mathematical Sciences, Brunel University, Uxbridge, UB8 3PH, UK. Corresponding author: Martin Greenhow, Department of Mathematical Sciences, Brunel University, Uxbridge, UB8 3PH, UK. [email protected], +44 1895-265622
HighlightsA simplified analytical model allows easy exploration of the effect of wave impact on seawalls with different rectangular geometries.A berm (ditch) is generally beneficial (detrimental) for the slamming loads.Global impulse and impulse moments are presented.A simple post-impact model of spray jets is developed and exploited.The effect of a damaged seawall that is missing a block is presented.
Wave impacts on structures with rectangular geometries: Part 1 Seawalls
Nor Aida Zuraimi Md Noar1 and Martin GreenhowDepartment of Mathematical Sciences, Brunel University, Uxbridge, UB8 3PH, UK.
[email protected] & [email protected]
Abstract This paper considers steep wave impact on seawalls of various geometries. A simple analytical model for the pressure impulse due to a wave of idealized geometry and dynamics is developed and applied to the following geometries:a) a vertical seawall with a berm,b) a vertical seawall with a ditch at its base andc) a vertical seawall with a block missing (damaged condition).The method uses eigenfunction expansions in each of the rectangular regions that satisfy some of the rigid surface conditions and a simplified free-surface condition. Their unknown coefficients are determined from the impact boundary condition, rigid wall conditions and by matching the values and the horizontal derivatives of the solutions in each rectangular region at their mutual boundary. The method yields the pressure impulse throughout the entire region. The overall impulse and moment impulse on the seawall and a simple model for the uprush of the spray jet after the impact are also presented. The effects of different impact regions and different geometries can therefore be quickly estimated and used to show trends in the results. It is shown that berms generally have a beneficial effect on reducing the impulse, moment impulse and uprush, but not the maximum pressure impulse on the seawall, whereas ditches are generally and sometimes strongly detrimental for all effects except uprush. A missing block in the seawall gives an almost constant or linearly-decreasing value inside the gap (depending on the boundary condition applied at the rear of the gap being hard or soft respectively); the soft case can affect the pressure impulse on the front face of the seawall, thereby affecting the impulse and moment impulse.
Keywords: wave impact, pressure impulse, total impulse, impulse moment, seawalls, slamming, spray jet.
1. Introduction
The engineering importance and intrinsic interest of wave impact on coastal structures has attracted researchers and experimenters for many years. Among the earliest is Bagnold (1939) who discovered that the shock pressure exerted on the vertical seawall when a steep wave strikes it can have its maximum value some distance above the seabed. This research then evolved theoretically and experimentally, both at model and full scale and generally confirmed Bagnold’s observations. The results of laboratory (e.g. Bagnold, 1939; Chan
1 Funded by research grant RDU140108 from Ministry of Higher Education of Malaysia
and Research and Innovation Department of Universiti Malaysia Pahang (UMP).
Present address: Fakulti Sains dan Teknologi Industri, Universiti Malaysia Pahang,
Lebuhraya Tun Razak, 26300 Gambang, Kuantan, Pahang, MALAYSIA.

and Melville, 1988; Kirkgöz, 1991; Chan, 1994; Hattori et al., 1994) and full-scale experiments (e.g. Blackmore and Hewson, 1984; Bullock et al., 2001, 2007; Hofland et al., 2010) have made further contributions to the knowledge of pressures occurring during wave impact and its effects on coastal structures. This is important for improving the design of coastal structures.
This paper considers violent wave impact characterized by a substantial portion of the front of a steep wave interacting with a vertical portion of a seawall and throwing up a jet of fluid, or spray, which can reach a height of several times the water depth. The impact model considered here does not need to specify the precise nature of this interaction which could be direct wave impact or comprise a fast-closing air pocket closing from below (i.e. without air entrapment), known as ‘flip through’. Both mechanisms are modelled in the same way by considering the horizontal water velocity in the impact region to be reduced to zero during the duration of the impact and both can cause large pressure impacts. These phenomena, reviewed by Peregrine, 2003, contrast with uprush of low-freeboard seawalls and explains why uprush at lower tides can exceed that at higher tides, see HR Wallingford, 2005. Whilst both types of wave-structure interaction are important, violent impact is generally assumed to be crucial for the structural integrity of the seawall (crack initiation and propagation, and possible displacement of the wall). For such waves, impact velocities will approximately equal the phase velocity of the wave, as given by shallow water theory. The impact is generally of short duration (typically 10-2s or less) and high peak pressure (typically 4x10⁵ Nm-2).
In reality there are considerable uncertainties in all of the above; in particular, peak pressure is highly variable and difficult to measure. It is also affected by water aeration which also dramatically affects the sound speed and hence the maximum acoustic pressure. In addition, the wave input parameters for any sophisticated and fully-nonlinear numerical model, such as that of Cooker and Peregrine, 1990, are not well known, still less the statistical distribution, such as the joint probability distribution of wave steepness and wave height. However, as a simplifying feature, it is assumed that the most violent impacts occur when the wave fronts are closely aligned with the seawall, so that the fluid motion predominantly occurs in the two-dimensional vertical plane. Given this, it seems sensible to utilise the simple pressure-impulse model of Lamb, 1932, as used by Cooker and Peregrine, 1990, especially to understand the possible effects of different seawall geometries and wave parameters. It is hoped that such an investigation will stimulate related experimental studies. However, it should be stressed that we are here comparing the effect of geometry with the same impact; the geometry, most noticeably for the berm, will affect the impacting wave. An experimenter would therefore need to adjust the wave in order to achieve the same impact as that without a berm, so that a valid comparison can be made with our results.
1.1 Impact on a seawallLamb, 1932, considers the pressure impulse, defined as the integral of the pressure at any point from just before impact (at t = tb) to just after (at t = ta).

)(yUxP
02 P0
xP
Hy
0P
Hy
0P
0
yP
x0y B
P ( x , y )=∫tb
t a
p ( x , y , t ) dt ≈Δt p peak
2. [1]
The approximate equality in Eq. [1] assumes a triangular rise to and fall from the pressure peak during the short impact time, ∆ t=t a−tb. Cooker and Peregrine, 1990, show that for short duration impacts, P satisfies Laplace’s equation and that its gradient is simply related to the difference of the fluid velocity before and after impact. The resulting boundary-value problem is summarized in Fig. 1 and can be solved using eigenfunction expansions; for the problems considered here, and in part II where we consider wave impact on structures with baffles, we use the form given by Cox and Cooker, 1999. The geometry of the wave is also idealized, the fluid filling a rectangular region.
Fig. 1. Dimensional boundary-value problem for the pressure impulse for impact over the upper part of a seawall. The impact region is denoted schematically by the sloping line but applies at x = 0. All quantities are dimensional, but we have dropped primes for clarity.
For the problem given in Fig. 1, is we assume the impact velocity profile U(y) over the impact region (parameterized by µ) is assumed constant (=U0), we have the nondimensional pressure as:
P ( x , y ,μ )=∑n=1
∞
{−2λn
2 [1−cos ( λn μ )]}sin (λn y )sinh [ λn ( x−B )]
cosh (λn B) [2]
where λn=(n−1/2 ) π . In Eq. [2] all spatial dimensions are nondimensionalised by the depth H (so in Fig. 1, H = 1) and the pressure impulse by division by ρ U 0 H so that ∂ P∂ x
=−1 for 0> y>−μH . The terms in braces here are Fourier coefficients, an , obtained
using orthogonality of the sine terms in y (in contrast to the problems considered later where one has to solve a matrix equation). It should be noted that each term in the summation of Eq. [2] satisfies all boundary conditions for the problem shown in Fig. 1

apart from the seawall; satisfaction of this condition gives the coefficients in braces. The series converges rapidly since an ~ O(n-2). Tests varying B in Eq. 2 showed that a value of 2 is sufficient for this boundary to be ‘distant’, having no discernable effect on the pressures near the seawall and so this value (denoted B2 later) is used throughout.
Fig. 2 shows the dimensionless pressure impulse for a vertical seawall for comparison with the cases presented later for different geometries. The (actual) maximum pressure impulse shown in the left-hand figure is approximately P'=P ρ U 0 H ≈ 0.2 ρ U 0 H . Assuming that the breaking wave front is moving with the phase speed of the wave and assuming shallow water theory, U 0 ≈√gH , we have a scaling law for peak pressure as
Ppeak' ≈ 1.2 ρ H 3 /2
Δt [3]
As mentioned in the Introduction, the impacting waves are stochastic and so ranges of values of the impact duration and wave impact region (i.e. value of µ) would need to be considered in practical calculations. These would also need to cap any pressures beyond the acoustic pressure of the aerated, and hence compressible, wave front region.
Fig. 2. Non-dimensional pressure impulse (plotted vertically) for impact over the upper part of a seawall, µ = 0.4 (left) and µ = 0.8 (right). This viewpoint shows pressure impulse on the seawall on the left and the seabed towards the reader; the free surface is a line of zero pressure (and hence zero pressure impulse) whilst the distant boundary (B = 2) on the right also has zero pressure impulse.
Naturally the pressure impulse on the seawall will be of engineering interest; less obviously, that on the seabed will also be pertinent since it may cause erosion when a large pressure instantaneously liquefies any sand by forcing water into it. This may then destabilize the seawall. Cox and Cooker, 1999, also use the gradient of the pressure impulse along the seabed to evaluate the impulse on stones resting on the seabed, which may then move, potentially causing another type of damage to the seabed foundations.
Cooker and Peregrine, 1990, give the landward impulse on the entire wall and the anticlockwise moment impulse about the foot of the seawall as:

I w=∫−H
0
P (0 , y )dy=ρU 0 H2∑n=1
∞
2 {1−cos (μ λn)}/λn3 [4]
M w=−∫−H
0
( y+H ) P (0 , y )dy=ρU 0 H3∑n=1
∞
2 {1−cos (μ λn¿)}{1−(−1 )n/ λn}/ λn3 ¿
[5]The terms under the summations give the dimensionless forms of the impulse and moment impulse and are plotted in Fig. 3.
Fig. 3. Dimensionless impulse (solid) and moment impulse (dashed) on a seawall versus µ.
1.2 Uprush modelNone of the above results are new but are included for later comparisons. However, we can use this model to give a simplified model of wave uprush in front of a vertical seawall arising from wave impact. Here freeboard refers to the vertical distance between still water level and top of the seawall. The wave uprush discharge is defined as the uprush volume [
∂P1
∂ y( x ,0 )=0] per time [s] and structure width [m]. The model gives an estimate of
the maximum quantity of water that reaches a height greater than the freeboard and hence could possibly move over the seawall, perhaps under the action of onshore wind. The frequency and severity of impact and the action of wind are exogenous to the present model. These would have to be measured or estimated (see below) before our model could be used to estimate seawall overtopping and possibly replace existing empirical formula with more rationally-based formulae. However, the uprush itself could be of interest in internal sloshing where it might slam onto the roof of a tank.
y
bF mbtt Particle at top
Free surface

Fig. 4. Definition sketch for uprush model.
Near to the seawall the jet of fluid is thin and the pressure gradients are low in this jet, so we assume the jet particles move as free projectiles. Hence the maximum height achieved by any free-surface particle is given by its vertical projection velocity after the impact. (Note: since this height is attained at different times for different values of horizontal coordinate x, this is not the free-surface profile but rather that vertical region which gets wet at some time.) Before impact the vertical velocity is zero so the projection velocity is simply the y derivative of P giving:
ymax
H=1
2F r¿¿ [6]
where F r=U0
2
gH is the Froude number and the Fourier coefficients are those of Eq. [1].
Since we are interested in when this value exceeds the freeboard height Fb, we find Fb in terms of a parameter xb, the distance at which Fb is achieved. For large n, terms in Eq. [6]
are of the form e−λn x
λn so the series for diverges at x = 0 but converges for x > 0. Within the
rather sweeping assumptions of the model (which are valid only close to the wall i.e. for large Fb and hence small xb), we can then estimate the uprush discharge, V , as
V ≈∫0
xb
( ymax−Fb ) dx [7]

Fig. 5. Dimensionless uprush versus dimensionless freeboard Fb/H for µ = 0.1, 0.2, … 1.0 (bottom to top curves respectively). V is volume of uprush per unit length of seawall divided by ∑
n=1
∞cos( γ n y ){ α n
cosh (γ n b1) }+ μb1+C=∑n=1
∞cn sin ( λn y)
sinh ( λn( b1−b2 ))cosh (λn b2)
Fig. 5 shows that the volume of uprush decreases as the freeboard increases, but note that the free-projectile model used here is only valid for large freeboard. The free-projectile model used above will not be valid for small values of Fb.
It is instructive to translate this result for engineering purposes. Firstly we need to convert the freeboard and volume of uprush per unit seawall length to dimensional quantities by multiplying by the length scale C=−μb1−∑
n=1
∞cn
1λ n
sinh ( λn ( b1−b2 ))cosh ( λnb2 ) and ∑
n=1
∞α n
cos (γ n y )cosh (γ n b1)
−∑n=1
∞cn
sinh ( λn (b1−b2))cosh (λnb2 ) [ 1
λn+sin ( λn y )]=0 respectively. With µ = 0.1, H = 2m and Fb=
2m, we have volume of uprush of about 0.01H2 = 0.04m2. As stated above, to convert this into an estimate of seawall overtopping requires further assumptions that are not part of this model. However, to underline what further assumptions would be needed in more realistic (stochastic) models, we arbitrarily assume that one 10s wave in every 10 waves impacts onto the wall, giving V = 4×10⁻⁴ m3 s-1 = 0.4 l s-1 per metre frontage. Depending on the wind direction and strength, not all of this water will overtop, but this figure is compatible with the value of 0.3 l s-1 for impacting waves with crest-to-trough height of 0.5m given by the deterministic choice on the online calculator http://www.overtopping-manual.com/EmpVertWall_Simple.aspx, see HR Wallingford (2005) Eq. 7.6, itself based on Besley’s (1999) empirical formulae for this type of overtopping caused by wave impact.
2. Seawall with a berm
The wave impact on a wall with a porous (rubble-mound) berm has been studied by Wood (1997) and Wood and Peregrine (2000) who found that having a porous berm can reduce the pressure impulse by up to 20%. However, it should be noted that these authors

only considered the equivalent of region 1 in Fig. 6 with P = 0 at x=B1 so their impermeable case is not the same as that considered here.This paper considers a non-porous berm of finite length extending seawards from the foot of the breakwater, extending the work of Greenhow (2006), see Fig. 6.
Fig. 6. Non-dimensional boundary conditions for the pressure impulse for wave impact on vertical wall with a berm.
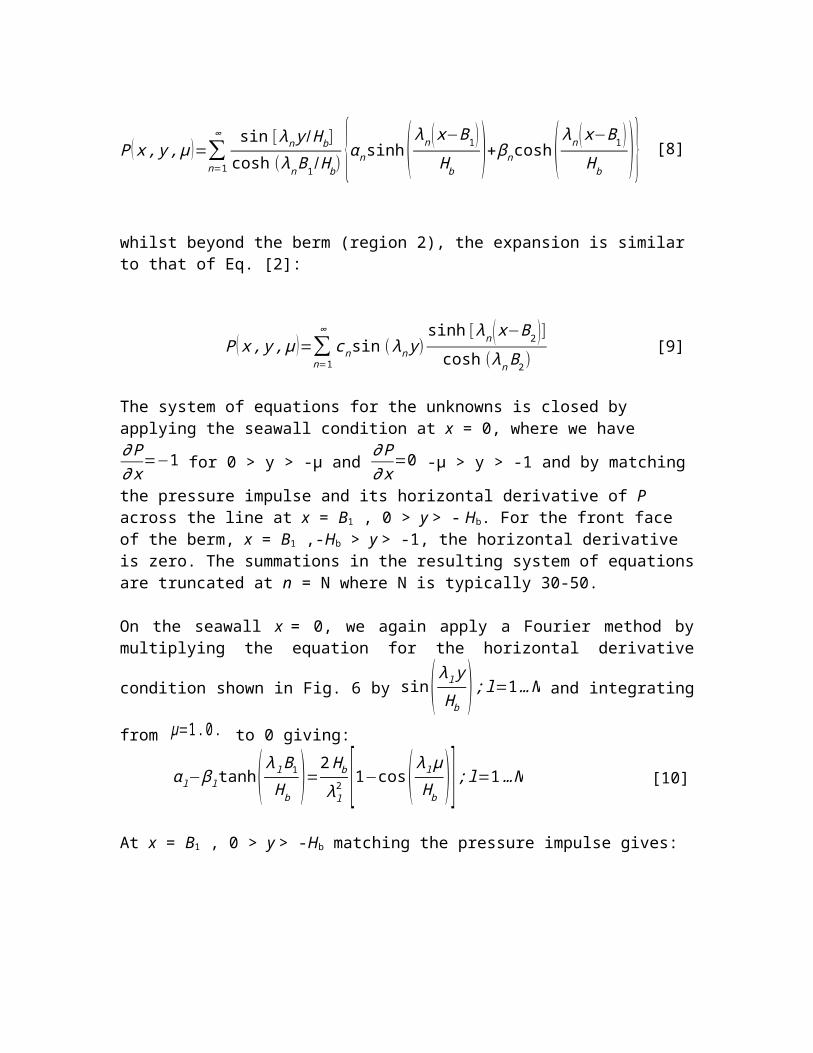
2.1 Solution methodThe eigenfunctions needed in each region are directly analogous to that given in the Introduction, but the addition of a berm at the foot of the seawall requires the fluid region to be split by a vertical line at x = B1 from the berm edge to the free surface; thus region 1 has, effectively, a smaller depth, Hb < 1, and does not need to satisfy a far-field condition at x = B2. Using the dimensionless parameters of Fig. 6, this gives the following expansion:
P ( x , y ,μ )=∑n=1
∞ sin [ λn y /H b]cosh (λn B1/ Hb) {αn sinh( λn ( x−B1 )
Hb )+βn cosh ( λn ( x−B1 )H b )} [8]
whilst beyond the berm (region 2), the expansion is similar to that of Eq. [2]:
P ( x , y ,μ )=∑n=1
∞
cn sin ( λn y)sinh [ λn ( x−B2 )]
cosh (λn B2)[9]
y
bHy
01
xP
11
xP
01
yP
1Bx 2Bx
02 P
02
xP
02
yP
0yx
y
0x 1y
Region 2Region 1
P = 0

The system of equations for the unknowns is closed by applying the seawall condition at
x = 0, where we have ∂ P∂ x
=−1 for 0 > y > -µ and ∂ P∂ x
=0 -µ > y > -1 and by matching the
pressure impulse and its horizontal derivative of P across the line at x = B1 , 0 > y > - Hb. For the front face of the berm, x = B1 ,-Hb > y > -1, the horizontal derivative is zero. The summations in the resulting system of equations are truncated at n = N where N is typically 30-50.
On the seawall x = 0, we again apply a Fourier method by multiplying the equation for
the horizontal derivative condition shown in Fig. 6 by sin( λ l yH b
); l=1 … N and integrating
from μ=1.0 . to 0 giving:
α l−β l tanh( λ l B1
Hb )=2 Hb
λl2 [1−cos( λ l μ
H b ) ]; l=1… N [10]
At x = B1 , 0 > y > -Hb matching the pressure impulse gives:
∑n=1
N
βn
sin (λn yH b
)
cosh (λn B1
Hb)−∑
n=1
N
cn
sin ( λn y )cosh ( λn B2 )
sinh ¿¿ [11]
At x = B1 , 0 > y > -Hb matching the horizontal derivative of the pressure impulse gives:
∑n=1
N
αnλn
H b
sin (λn yH b
)
cosh (λn B1
Hb)−∑
n=1
N
cn λn
sin ( λn y )cosh ( λn B2)
cosh¿¿ [12]
and for x = B1 , -Hb > y > -1 applying the fixed wall condition gives:
∑n=1
N
cn λn
sin ( λn y )cosh ( λn B2)
cosh [ λn(B1−B2) ]=0 [13]
Greenhow (2006) used a basis function method (similar to Cooker and Peregrine’s Fourier method but without orthogonality) but this fails to produce realistic results for longer berms (B1 > 0.4) or for larger impact regions (µ > 0.5). This is due to the exponential increase with x of the eigenfunctions in region 1, especially for larger values of n in the summation, which results in a poorly-conditioned matrix. To avoid this problem but still take enough terms in the summation to satisfy the seawall condition, Eq. [11-13] are applied pointwise at M collocation points equally spaced in 0 > y > -1. To get a square system M = N and the resulting 3N×3N system is solved by Matlab. Results show that N = 30 is adequate for the peak pressure to converge to within 1%.
2.3 Results
Fig. 7. Non-dimensional pressure impulses (plotted vertically) for impact over the upper part of a seawall with a berm Hb = 0.8, B1 = 0.2 (top) and 0.4 (bottom), µ = 0.4 (left) and µ = 0.8 (right).
Fig. 7 shows the effect of a berm with Hb = 0.8 and different values of B1 and µ. Comparison with Fig. 2 shows that the berm has only a small effect on the pressure impulse on the seawall, especially for smaller values of µ, with an increase of about 10-15% for µ = 0.8. On the other hand, the impulse and moment impulse on the seawall with berm is significantly reduced due to the pressure impulse on the front of the berm being reduced from that of the bermless seawall in the region -µ > y > -1, see Figs 8 and 9. Both Figs have two lines close together (top curves): these are the total impulse or anticlockwise moment impulse due to the wall and the front of the berm, and due to the wall only, showing that the front of the berm contributes little. There is also a downwards impulse and clockwise moment acting on the top of the berm, which may be of significance to the integrity of the berm foundations. For the wider berms, the clockwise moment impulse reduces the overall anticlockwise moment impulse on the entire structure (wall plus berm). These quantities are calculated in a similar way to Eq. [4] and [5], the moment impulse being taken about the point (0,-1) for comparison with the seawall only case shown in Fig. 3. Explicit formula are given in Md Noar, 2012.

Fig. 8. Impulse on seawall and berm (solid), on wall only (dotted) and downwards on top of berm (dashed) versus µ. Left Fig. Hb = 0.8, B1 = 0.2; right Fig. Hb = 0.8, B1 = 0.4.
Fig. 9. Moment impulse on wall only (chain), on the wall and front of berm (dotted), seawall and berm (solid), and on top of berm (dashed) versus µ. Left Fig. Hb = 0.8, B1 = 0.2; right Fig. Hb = 0.8, B1 = 0.4.
Fig. 10. Dimensionless uprush volume V versus dimensionless freeboard Fb/H for µ = 0.1, 0.4 and 0.8. for a seawall (solid) and seawall with berm (chain) Hb = 0.8, B1 = 0.2 (left) and B1 = 0.4 (right). V is volume of uprush per unit length of seawall divided by ∑n=1
∞cos( γ n y ){ α n
cosh (γ n b1) }+ μb1+C=∑n=1
∞cn sin ( λn y)
sinh ( λn( b1−b2 ))cosh (λn b2)
The wave uprush is dependent on the y-derivative of P at the free surface, making the effect of the berm difficult to anticipate. Fig. 10 shows that this effect is rather small, with a reduction in uprush for higher freeboards in general. This is perhaps counter-intuitive given that close to the wall, the high pressure impulses have ‘less room to expand into’, especially for the longer berm (B1 = 0.4), and one might therefore have expected more uprush on the seawall. However, the berm also has an effect on the pressure impulse near the wall. The effect is usually not great and these results will probably need experimental or theoretical verification before engineers can use them with confidence.
3. Seawall with a ditch
The motivation for this section is to study the effect of a ditch at the base of the seawall. The boundary-value problem is given in Fig. 11.
Fig. 11. Non-dimensional boundary conditions for the pressure impulse for wave impact on vertical wall with a ditch.
The eigenfunctions for regions 1 and 2 are as before (Eq. [8] and [9]), whilst the matching of P and its horizontal derivative takes place on the dotted line between the two regions in Fig. 11. For x = B1 and -1 < y < -Hb the horizontal derivative is zero. These conditions are solved by collocation with points equally spaced in 0 > y > -Hb, whilst the seawall condition is again implemented using a Fourier method.
y
bHy
01
xP
11
xP
01
yP 1Bx
2Bx
02 P02 P
01
xP
02
yP
y
x
1y
0y
0x
Region 2Region 1
P = 0

Fig. 12. Non-dimensional pressure impulses (plotted vertically) for impact over the upper part of a seawall with a ditch, Hb = 1.2, B1 = 0.2, µ = 0.4 (left) and µ = 0.8 (right).
Results are given in Fig. 12 for the pressure impulse. We see that these are comparable with the previous cases, but note the almost constant and high value of pressure impulse throughout the ditch. This means within the ditch, repeated pressure impulses may liquefy the seabed there and this may destabilise the entire wall. An extreme case would be where the entire seawall is impacted, see Fig. 13, where the pressure impulses have more than doubled.
Fig. 13. Non-dimensional pressure impulse (plotted vertically) for impact over the entire seawall with a ditch, µ = 1.2. Hb = 1.2, B1 = 0.2. In contrast to earlier figures, the free surface y = 0 and far-field x = B2 are towards the reader.
The fact that the ditch can have an extremely detrimental effect on the integrity of the seawall is further underlined by the increase in impulse and moment impulse, see Fig. 14. The moment impulse is taken about the base of the seawall i.e. at x = 0, y = -Hb. Given that the seawall depth is now 1.2, these parameters might be expected to increase by that factor over the values given in Fig. 3. In fact, for µ = 1, the values exceed this estimate, especially for the moment impulse. The width of the ditch (0 < B1 < 0.6) has very little influence on the values given in Fig. 14, whereas the depth of the ditch has a strong influence. For example with Hb = 1.4, B1 = 0.2 and µ = 1.4, the impulse is about 1.4 and

the moment impulse about 0.65; this might be possible if the front face of the wave falls into the ditch causing a vertical wall of water to strike the whole of the seawall surface, although experiments or a fully non-linear wave model would be needed to explore this possibility.
Fig. 14. Dimensionless impulse (solid) and moment impulse (dashed) on a seawall with ditch. Hb = 1.2, B1 = 0.2
Fig. 15. Dimensionless uprush discharge versus dimensionless freeboard Fb/H for µ = 0.1, 0.4 and 0.8 for a seawall (solid) and seawall with ditch (chain) Hb = 1.2, B1 = 0.2 (left) and B1 = 0.4 (right). V is volume of uprush per unit length of seawall divided by ∑n=1
∞cos( γ n y ){ α n
cosh (γ n b1) }+ μb1+C=∑n=1
∞cn sin ( λn y)
sinh ( λn( b1−b2 ))cosh (λn b2)
As for the berm, the ditch’s effect on uprush is not easy to anticipate. Again experimental and/or numerical confirmation of these results is needed before their engineering use.
4. Seawall with a missing block

In her thesis, Md Noar (2012) also considered the case of a rectangular gap in the seawall between –H1 and –H2 (H2 > H1 > µH) and of horizontal extent from x = 0 to x = B1
where the vertical seawall is located. The gap is therefore always filled with water in this model (although an air-filled gap would also be an interesting case for future analysis). This can be taken as a model of a crack (if H2 only slightly exceeds H1) or missing block if their values are significantly different. In this gap region, the eigenfunctions satisfy the solid wall conditions on the top, bottom and rear of the gap:
P ( x , y )=∑n=1
∞
αn
cos [ γn (2 y+H 1+H 2 )H2−H 1 ]
cosh (γ n B1)/(H2−H 1)¿cosh( 2γ n x
H 2−H1 )+βn
sin [ λn (2 y+H 1+H2 )H2−H1 ]
cosh ( λn B1)/(H2−H 1)¿¿cosh ( 2 λn x
H2−H1 )¿+ A
[14]
where γn=nπ . The cosine (sine) terms are symmetric (antisymmetric) about the centerline of the gap. Note the presence of the constant (‘secular’) term A; in earlier cases this was precluded because of the free surface condition P = 0. These eigenfunctions are matched to those of the outer region (given in Eq. [9]) across the mouth of the gap. This outer region satisfies the wall condition above and below the gap region, including the impact condition above the gap (i.e. µ < H1). Cox and Cooker, 2001, treat the more general case of a crack of varying width, but assume that since the crack width is small compared to the water depth, the pressure at the crack mouth is given from the impact on a crackless seawall, Eq. [2], or equivalent. For larger crack widths, this is questionable and the present model makes no such assumption: the pressure at the crack mouth is calculated from our model, and this makes a significant difference for the pressure-relieving gap discussed below.Given the additional geometric parameters involved, it is fortuitous for designers of seawalls that the pressure impulse values on the seawall, and hence the (rather complicated) impulse and moment impulse, are not significantly affected by a gap with a closed end for the parameters given in Fig. 16 (when comparing with Fig. 2, note the perspective effect). The impulse arises only from the three vertical surfaces and is almost identical to that of the seawall, see Fig. 18, whilst the moment impulse has contributions also from top and bottom of the gap which exactly cancel for terms symmetric about the gap centerline and give a small contribution for the antisymmetric terms. Overall the moment impulse is reduced by some 5-10% when the entire upper part of the seawall above the gap is impacted, but the correction is otherwise very much smaller. Thus no special considerations need to be made of these values in ‘failure mode’ when the seawall loses an amour block. Of more engineering interest is the pressure impulse in the gap, where Fig. 16 confirms Müller’s (1997) general conclusion that high pressures can propagate via gaps in the seawall into the central, but still impervious, part of a breakwater.

Fig. 16. Non-dimensional pressure impulses (plotted vertically) for impact over the upper part of a seawall, µ = 0.4 with gap B1 = 0.2, H1 = 0.45 and H2 = 0.55 (left) and µ = 0.8 with gap B1 = 0.2, H1 = 0.85 and H2 = 0.95 (right).
The eigenfunctions of Eq. [14] satisfy ∂ P/∂ x=0 on the rear of the gap (a Neumann or ‘hard’ condition). Another case can be considered relatively easily, namely having P = 0 on the vertical back wall of the gap (a Dirichlet or ‘soft’ condition). This might then be considered as a limiting case for an amour block missing from a breakwater with a porous rubble interior where the pressure (and hence pressure impulse) is completely relieved. The outer eigenfunctions are unaffected but in Eq. [14], we replace the cosh terms with x dependence by sinh terms with the same x dependence and the secular term by Ax. This introduces minor changes to the matching of pressure impulses and their x derivatives. The results are again rather uninteresting for a gap of limited vertical extent: in the gap region there is an almost linear dependence in the x direction and almost no y dependence, whilst the outer region 2 is largely unaffected except at the mouth of the gap, see Fig. 17 (left). On the other hand, if the gap is very large, the high pressure impulse region is unsupported from below where its value is very low, and this reduces the peak value on the seawall from about 0.22 to about 0.18, see Fig. 17 (right). For the same case as shown in Fig. 16 (right) with µ = 0.8 with gap B1 = 0.2, H1 = 0.85 and H2 = 0.95, the peak pressure impulse is also reduced quite dramatically, from 0.51 to 0.33. Even disregarding this reduction in pressure impulse on the seawall, the impulse and moment impulse will also be reduced since the rear surface of the gap, where a non-zero pressure impulse acts in Fig. 16, is now zero. For example, for the cases shown in Fig. 16, the impulse (moment impulse) is reduced by about 25% (35%) for all values of µ < H1, see also Fig. 18.

Fig. 17. Non-dimensional pressure impulses (plotted vertically) for impact over the upper part of a seawall with µ = 0.4 and a pressure-relieving gap: B1 = 0.2, H1 = 0.45 and H2 = 0.55 (left) and B1 = 0.2, H1 = 0.45 and H2 = 0.65 (right).
Fig. 18. Dimensionless impulse (solid) and moment impulse (dashed) versus µ on a seawall (upper curves) and seawall with a pressure-relieving gap (lower curves ending at µ = 0.85 when the entire seawall above the gap is impacted) with B1 = 0.2, H1 = 0.85 and H2 = 0.95. Results for the same gap but with a closed end are indistinguishable from the seawall results for this choice of geometric parameters and hence are not shown here.
5 Conclusions
A simplified, but rational, model of vertical wave impact on seawalls of various geometries has been presented and compared with earlier results of Cooker and Peregrine (1990). Since the theory relies on simply-defined eigenfunctions, Matlab code allows very rapid solution and hence exploration of the effect on the local pressure impulse and global impulse and moment impulse of the geometry of berms, ditches and missing blocks. The berm is generally found to be beneficial in all three above-mentioned aspects,

whereas the ditch is nearly always detrimental, sometimes significantly so. For the berm, these global loads are presented for the combined structure and for its components (wall and berm) separately; the downwards impulse and clockwise moment impulse may be of significance to the structural integrity of the structure and its foundations. A rational model of uprush is presented and extended to the berm and ditch situations. The berm can preserve, or even slightly increase, the uprush whilst the ditch generally decreases it. Two models of a wall in failure mode with a missing block are given to examine how the pressure impulse might propagate into the gap. The pressure in front of the seawall is largely unaffected for the cases studied with a solid rear wall to the gap, but this is not true for the pressure-relieving gap, where the impulse and moment impulse on the wall are also significantly reduced.
References
Bagnold, R.A. (1939). Interim report on wave-pressure research. Journal of the Institute of Civil Engineers. 12: 202-226.
Besley, P. (1999). Overtopping of seawalls - design and assessment manual. R&D Technical Report W 178. Environment Agency, Bristol.
Blackmore, P.A and Hewson, P.J. (1984). Experiments on full-scale wave impact pressures. Coastal Eng. 8:331-346.
Bullock, G.N., Crawford, A.R., Hewson, P.J., Walkden, M.J.A. and Bird, P.A.D. (2001). The influence of air and scale on wave impact pressures. Coastal Eng. 42: 291-312.
Bullock, G.N., Obhrai, C., Peregrine, D.H. and Bredmose, H. (2007). Violent breaking wave impacts. Part 1: Results from large-scale regular wave test on vertical and sloping walls. Coastal Eng. 54: 602-617.
Chan, E.S. (1994). Mechanics of deep water plunging-wave impacts on vertical structures. Coastal Eng. 22: 115-133.
Chan, E.S. and Melville, W.K. (1988). Deep-water plunging wave pressures on a vertical plane wall. Proc. R. Soc. Lon. A. 417: 95-131.
Cooker, M.J. (1990). The interaction between steep water waves and coastal structures. Ph.D Thesis University of Bristol.
Cooker, M.J. and Peregrine, D.H. (1990). A model for breaking wave impact pressures. Proc. 22nd Intl. Conf. Coastal Eng. : 1473-1486.
Cox, S.J and Cooker, M.J. (1999). The motion of a rigid body impelled by sea-wave impact. Applied Ocean Research. 21:113-125.

Cox, S.J and Cooker, M.J. (2001). The pressure impulse in a fluid saturated crack in a sea wall. Coastal Engng. 42 : 241-256.
Greenhow, M. (2006). Wave impact on seawalls of various geometries. CoastalLab06 Proceedings. 517-524.
Hattori, M., Arami, A. and Yui, T.(1994). Wave impact pressure on vertical walls under breaking waves of various types. Coastal Eng. 22: 79-114.
HR Wallingford (2005) Wave Overtopping, website http://www.overtopping-manual.com/ (accessed Aug 2014)
Hofland, B., Kaminski, M.L., and Wolters, G. (2010). Large scale wave impacts on a vertical wall. Proceedings of the 32th International Conference on Coastal Engng .: 1-15.
Kirkgöz, M. S. (1991). Impact pressure of breaking waves on vertical and sloping walls. Ocean Engineering. 18: 45-59.
Lamb H. (1932) “Hydrodynamics” 6th ed. CUP.
Md Noar N. A. Z. (2012) Wave impacts on rectangular structures. PhD thesis, Brunel University.
Müller, G. (1997). Wave impact pressure propagation into cracks. Proc. Inst. Civil Eng. Water Marit.& Energy. 124:79-85
Peregrine, D.H. (2003). Water-wave impact on walls. Annual Review Fluid Mech.35:23-43.
Wood, D.J. (1997). Pressure-impulse impact problems and plunging wave jet impact. PhD Thesis University of Bristol.
Wood, D.J. and Peregrine, D.H. (2000). Wave impact on a wall using pressure-impulse theory. II: Porous berm. Journal of Waterway, Port, Coastal, and Ocean Engineering.191-195.