Embed Size (px)
Citation preview

19 July 2017
Analysis of security of payment reform for thebuilding and construction industry – addendumreportPrepared for the Queensland Department of Housingand Public Works

Analysis of security of payment reform for the building and construction industry – addendum report | Contents
01
Contents
Contents 1
Glossary 2
1 Executive summary 4
2 Introduction 9
3 Evaluation framework 10
4 PBA models 16
5 Residential building and construction 32
6 Scope and limitations of our work 35

Analysis of security of payment reform for the building and construction industry – addendum report | Glossary
02
GlossaryAbbreviation Definition
ASIC Australian Securities and Investments Commission
Bank The financial institution operating the PBA
BCIPA Building and Construction Industry Payments Act 2004
BCR Benefit to cost ratio
bn Billions
CBA Cost-Benefit Analysis
CGE Computable General Equilibrium
(The) Department The Department of Housing and Public Works
FTE Full-time Equivalent
(The) Government The State Government of Queensland
Government-only Scenario Scenario analysed whereby Model 1 or Model 2 is applied only toGovernment construction contracts of $1m-$10m in value (excludinginfrastructure and residential contracts)
GRP Gross Regional Product
GSP Gross State Product
Head contractor Party that contracts with the Principal to carry out construction work orsupply related goods and services for the Principal under a constructioncontract
Industry-wide Scenario Scenario analysed whereby Model 1 or Model 2 is applied to bothGovernment and private sector construction contracts over $1m in value(excluding infrastructure and residential contracts)
IRR Internal Rate of Return
k Thousands
m Millions
Model 1 A PBA scheme where the Principal is trustee and administrator of the PBA
Model 2 A PBA scheme where the Head contractor is trustee and administrator ofthe PBA, and there is a level of oversight by the Principal to the PBA
NPV Net Present Value
NSW New South Wales
PBA Project Bank Account
PPSA Personal Property Securities Act 2009
PPSR The Personal Property Securities Register, which is an Australian nationalonline register that provides details of security interests in personalproperty
Previous report Deloitte report prepared for the Queensland Department of Housing andPublic Works titled ‘Analysis of security of payment reform for the buildingand construction industry’, dated 8 November 2016
Principal Party that commissions building and construction work
QBCC Queensland Building and Construction Commission
QLD Queensland

Analysis of security of payment reform for the building and construction industry – addendum report | Glossary
03
Abbreviation Definition
RoQ Rest of Queensland (not SEQ)
RTA Residential Tenancies Authority
Senate Committee The Commonwealth Senate Standing Committee on Economics
SEQ South-East Queensland
Subcontractor Person who is to carry out construction work or supply related goods andservices under a construction contract, aside from the Head contractor
WA Western Australia

Analysis of security of payment reform for the building and construction industry – addendum report | Executive summary
04
1 Executive summary1.1 Background
The challenge of achieving security of payment for subcontractors in the Queensland building and constructionindustry was examined in our previous report. In that report we evaluated a number of options to address theissue, including the implementation of Project Bank Accounts (PBAs) or Retention Trust Funds (RTFs).
The evaluation had three components:
· A cost-benefit analysis quantifying the benefits and costs accruing to the Government (as principal and asregulator), head contractors and subcontractors
· A multi-criteria analysis assessing impacts that could not be quantified in the cost-benefit analysis· An economic impact analysis measuring the economy-wide effects of improved risk allocation and therefore
efficiency in the construction industry.
In summary, our analysis suggested that the benefits of introducing PBAs would outweigh the costs of doing so.Our analysis also suggested that this was not the case for RTFs, i.e. that the benefits of introducing RTFs wouldbe outweighed by the costs.
The Department of Housing and Public Works (the Department) undertook further industry consultation after thefindings of our work were made available to the public, in the form of consultation sessions held throughoutQueensland, acceptance of written submissions and online feedback responses. As a result of this feedback andfurther detailed analysis of implementation considerations by the Department, two models for the introduction ofPBAs are being considered. This report, an addendum to our previous report, contains the results of our analysisof these two models.
1.2 PBA administration models and evaluation methods
Model 1 and Model 2
Broadly, the two models differ in which party is responsible for establishing the PBA, verifying bank details of thesubcontractors and providing the final Progress Payment Instruction (PPI) to the Bank administering the PBA.
Under Model 1 the Principal would establish the PBA, ensure the Subcontractor bank details in the PPI are correctand provide the final version of the PPI to the Bank to authorise payment.
Model 2 is similar to the model contemplated in our previous report, where the Head contractor would beresponsible for establishing the PBA, ensuring subcontractor bank details are correct and providing the finalversion of the PPI to the bank to authorise payment. However the current Model 2 provides for more oversight ofthe PBA by the Principal compared to the model discussed in our previous report. Both Model 1 and 2 assumethat in the Government-only Scenario, the Government can enforce compliance with PBAs through contractualmeans. Once applied to the private sector, the Queensland Building and Construction Commission (QBCC), as theindustry regulator, will act in this compliance/oversight role. Note that this oversight is in addition to thatprovided by the Principal in Models 1 and 2.
Evaluation methods
The evaluation has two components:
· A cost-benefit analysis (CBA) quantifying the benefits and costs accruing to the Government (in its roles bothas Principal and as regulator), head contractors and subcontractors
· An economic impact analysis measuring the economy-wide effects of improved risk allocation and thereforeefficiency in the construction industry

Analysis of security of payment reform for the building and construction industry – addendum report | Executive summary
05
The analysis in this addendum report is an update of our previous CBA and economic impact analysis. We havealso considered and commented on possible stakeholder impacts if a PBA scheme were to be introduced to theresidential construction sector. Due to lack of data this analysis is qualitative and based on our experience.
As limited data is available, our work includes a number of assumptions that have either been provided by orreviewed and endorsed by the Department. The scope of work agreed with the Department is set out in ourcontract for work. This scope and the limitations of our work are set out in our previous report and Section 6 ofthis addendum report. This addendum report should be read in conjunction with our previous report.
Scenarios
We have assessed the costs and benefits of both Model 1 and Model 2 under two scenarios. The Government-onlyScenario examines a progressive rollout of the PBA scheme, applied to Government construction projects with acontract value of $1m-10m, excluding infrastructure and residential projects. The Industry-wide Scenarioexamines the impact of an extension of the PBA arrangements across Government and the private sector for allprojects above $1m, excluding residential construction and infrastructure projects. The modelling in thisaddendum report is based on updated data provided by the Department, including historical and forecast projectnumbers, which drive the project cost saving benefits discussed below. Accordingly, the modelling in thisaddendum report is not directly comparable to our previous report.
1.3 Evaluation results
Model 1 - Evaluation results
At the highest level, the CBA evaluation shows that Model 1 in the Government-only Scenario returns a netbenefit to society of $101m, leading to a Benefit Cost Ratio (BCR) of 1.50. The net benefits to stakeholders areshown below.
Figure 1: CBA evaluation results, Model 1 in the Government-only Scenario
When Model 1 is applied to the entire industry under the Industry-wide Scenario, it returns a net benefit tosociety of $4.1bn, leading to a BCR of 2.35. The net benefits to stakeholders are shown below.
100.59
91.87
-164.69
173.41
-$200
-$150
-$100
-$50
$0
$50
$100
$150
$200
Net benefit to society Government
Head contractors Subcontractors
BCR = 1.50
$m

Analysis of security of payment reform for the building and construction industry – addendum report | Executive summary
06
Figure 2: CBA evaluation results, Model 1 in the Industry-wide Scenario
The cost-benefit analysis identified the following significant benefits under Model 1 for both the Government-onlyScenario and the Industry-wide Scenario:
· A reduction in project costs. This is based primarily on analysis of other jurisdictions where similarschemes have been implemented. This identified that subcontractors reduced their pricing to reflect areduced risk of delayed or non-payment, which led to a reduction in overall project costs.
· An improvement in working capital for subcontractors. This is a result of improving speed of payment tosubcontractors under a PBA scheme.
The cost-benefit analysis identified the following significant costs for this Model 1:
· A reduction in working capital for head contractors.· On-going administration and compliance costs. There are additional costs to the Government as Principal
and private sector Principals in acting as trustees for PBAs. The assumptions used to calculate these costsare discussed in Section 3.4.
In this addendum report, the economy wide impacts have only been estimated for the Model 2 Industry-wideScenario that displays the highest net benefit and benefit cost ratio. The impacts would be broadly similar if theflow on effects of the net benefits for Model 1 in the same scenario were simulated in our CGE modelling. This isbecause the net benefits to society in both Model 1 and Model 2 are very similar on an economy-wide scale.
Model 2 – Evaluation results
At the highest level, the CBA evaluation results show that Model 2 in the Government-only Scenario returns a netbenefit to society of $108m, leading to a BCR of 1.56. The net benefits to stakeholders are shown below.
4.14
0.12
3.73
-3 .96
4.24
-$5
-$4
-$3
-$2
-$1
$0
$1
$2
$3
$4
$5
$bn
Net benefit to society GovernmentPrivate sector principals Head contractorsSubcontractors
BCR = 2.35

Analysis of security of payment reform for the building and construction industry – addendum report | Executive summary
07
Figure 3: CBA evaluation results, Model 2 in the Government-only Scenario
When Model 2 is applied to the broader industry under the Industry-wide Scenario, it returns a net benefit tosociety of $4.2b, leading to a BCR of 2.40. The net benefits to stakeholders are shown below.
Figure 4: CBA evaluation results, Model 2 in the Industry-wide Scenario
The benefits for Model 2 under both the Government-only Scenario and the Industry-wide Scenario were similarto those identified for Model 1.
107.55
225.64
-291.50
173.41
-$400
-$300
-$200
-$100
$0
$100
$200
$300
Net benefit to society Government
Head contractors Subcontractors
BCR = 1.56
$m
4.21
0.34
5.24
-5.61
4.24
-$8
-$6
-$4
-$2
$0
$2
$4
$6
$bn
Net benefit to society GovernmentPrivate sector principals Head contractorsSubcontractors
BCR = 2.40

Analysis of security of payment reform for the building and construction industry – addendum report | Executive summary
08
Similarly, the costs for Model 2 under both the Government-only Scenario and the Industry-wide Scenario weresimilar to those identified for Model 1, although there are ongoing administrative costs under this model forPrincipals in performing an oversight role for the PBA and Head contractors in acting as trustees for PBAs.
Our CGE modelling suggests that for Model 2 in the Industry-wide Scenario the estimated economic impact of thepolicy change could lead to an increase of real GRP of $9.4bn in SEQ in net present value terms using a 5 percent real discount rate out to 2036-37. For the RoQ region, this is estimated to increase real GRP by $3.2bn overthe same timeframe. In total, Queensland real Gross State Product (GSP) increases by an estimated $12.6bnover the same time-frame in NPV terms.
The modelling indicates that employment could increase by up to 3,195 FTEs in Queensland by 2036-37comprising of 1,822 FTEs in SEQ and 1,373 FTEs in RoQ. In average annual terms, the net increase inemployment is expected to be 1,576 FTEs in SEQ and 2,373 in Queensland as a whole. The distribution of thisemployment increase is expected to increase employment primarily in the construction, other services andfinancial and business services sectors.
Residential construction
We understand the Department is not proposing to extend the PBA scheme to private single dwelling residentialprojects over $1m, but intends to cover Government residential construction projects and private multipledwelling projects over $1m. The residential projects to be covered by the PBA scheme are essentially commercialin nature, with a similar structure and sophistication as commercial building and construction projects.Accordingly, the costs and benefits of the PBA models may apply in a similar manner to stakeholders engaged inthese projects. Some exceptions are likely to exist if the PBA scheme inadvertently covers individuals or“unsophisticated” Principals, such as individuals engaged in small scale split-block developments.
Broadly, a net benefit would be expected from the introduction of a PBA scheme on the same basis as ouranalysis of the introduction of PBA scheme for commercial projects based on the same costs and benefits outlinedabove.
Summary of results
Evaluation tool Model 1 Model 2
Cost-benefitanalysis
BCR of 1.50 for the Government-only Scenario.Sensitised range 0.74 to 2.26 based on
sensitised project cost savings of 1% to 4%.
BCR of 2.35 for the Industry-wide Scenario.Sensitised range 1.16 to 3.53 based on
sensitised project cost savings of 1% to 4%.
BCR of 1.56 for the Government-only Scenario.Sensitised range 0.77 to 2.34 based on
sensitised project cost savings of 1% to 4%.
BCR of 2.4 for the Industry-wide Scenario.Sensitised range 1.19 to 3.61 based on
sensitised project cost savings of 1% to 4%.Economicimpact (CGE)model
For the Industry-wide Scenario: Gross State Product impact of $12.6bn (in NPV terms at 5%real discount rate over the period 2017-18 to 2036-37). The GRP impact in SEQ is $9.4bn and
$3.2bn in the rest of Queensland.
The annual average employment impact for Queensland is 2,373 FTEs(1,576, SEQ and 797 rest of QLD)
Overallcomments
Based on our analysis, Model 2 provides a marginally higher net benefit to society.However there are inherent uncertainties, assumptions and limitations that exist withmodelling of this nature. Accordingly it is difficult to clearly distinguish between thenet benefits to society between Model 1 and Model 2.

Analysis of security of payment reform for the building and construction industry – addendum report | Introduction
09
2 Introduction2.1 Background
The challenge of achieving security of payment for subcontractors in the Queensland building and constructionindustry was examined in our previous report. In that report we evaluated a number of options to address theissue, including the implementation of Project Bank Accounts (PBAs) or Retention Trust Funds (RTFs).
The evaluation had three components:
· A cost-benefit analysis quantifying the benefits and costs accruing to the Government (as principal and asregulator), head contractors and subcontractors
· A multi-criteria analysis assessing impacts that could not be quantified in the cost-benefit analysis· An economic impact analysis measuring the economy-wide effects of improved risk allocation and therefore
efficiency in the construction industry.
In summary, our analysis suggested that the benefits of introducing PBAs would outweigh the costs of doing so.Our analysis also suggested that this was not the case for RTFs, i.e. that the benefits of introducing RTFs wouldbe outweighed by the costs. The Department undertook further industry consultation after the findings of ourwork were made available to the public, in the form of consultation sessions held throughout Queensland,acceptance of written submissions and online feedback responses. As a result of this feedback and furtherdetailed analysis of implementation considerations by the Department, two models for the introduction of PBAsare being considered. This report, an addendum to our previous report, contains the results of our analysis ofthese two models.
2.2 Model 1 and Model 2
Broadly, the two models differ in which party is responsible for establishing the PBA, verifying bank details of thesubcontractors and providing the final Progress Payment Instruction (PPI) to the Bank administering the PBA.
Under Model 1 the Principal would establish the PBA, ensure the Subcontractors’ bank details in the PPI arecorrect and provide the final version of the PPI to the Bank to authorise payment.
Model 2 is similar to the model contemplated in our previous report, where the Head contractor would beresponsible for establishing the PBA, ensuring subcontractor bank details are correct and providing the finalversion of the PPI to the Bank to authorise payment. However the current Model 2 provides for more oversight ofthe PBA by the Principal compared to the model discussed in our previous report. Both Model 1 and 2 assumethat in the Government-only Scenario, the Government can enforce compliance with PBAs through contractualmeans. Once applied to the private sector, the QBCC, as the industry regulator, will act in thiscompliance/oversight role. Note that this oversight is in addition to that provided by the Principal in Models 1 and2.
We discuss Model 1 and Model 2 in more detail in Section 4 of this report.
2.3 Our role
We have been engaged by the Department to evaluate the costs and benefits of the two PBA implementationmodels discussed above and to consider the impacts on stakeholders of applying the PBA scheme to theresidential construction sector. Due to data limitations, our evaluation of the impact on the residentialconstruction sector is restricted to qualitative comments based on our experience.
The scope of work agreed with the Department is set out in our contract for work. This scope and the limitationsof our work are set out in our previous report and Section 6 of this addendum report. This addendum reportshould be read in conjunction with our previous report.
Analysis of security of payment reform for the building and construction industry – addendum report | Evaluation framework
10
3 Evaluation framework3.1 Background
The evaluation has two quantitative components:
· A cost-benefit analysis (CBA) quantifying the benefits and costs accruing to the Government (as principal andas regulator), head contractors and subcontractors
· An economic impact analysis measuring the economy-wide effects of improved risk allocation and thereforeefficiency in the construction industry
The analysis in this addendum report is an update of our previous CBA and economic impact analysis. We haveset out the methodology for each of the components in more detail below.
3.2 Cost-Benefit Analysis (CBA) methodology
Cost-Benefit Analysis (CBA) compares the costs and benefits of a proposed action to a base case or ‘do nothing’alternative. In this case the purpose of the CBA is to test the economic viability of implementing the proposedreforms under different policy options. The results of the CBA can inform both the economic viability of eachoption and the comparison across different options.
3.3.1 Steps in methodology
The methodology for the CBA involves the following steps:
· Defining the base case and project case (in this instance, policy options)· Identifying and agreeing on the core parameters of the evaluation (e.g. modelling time period, base year for
prices to calculate present dollar values, discount rate)· Identifying the costs and benefits that might be expected in moving from the base case under a variety of
different policy options (i.e. PBA Model 1 and 2)· Where possible, quantifying the costs and benefits over the expected lifecycle and discounting future values
to express them in current equivalent values· Generating performance measures including the net present value (NPV), benefit-cost ratio (BCR) and
internal rate of return (IRR) using discounted cash flow techniques over the evaluation period· Testing the sensitivity of these performance measures to changes in the underlying assumptions.
Each step in the cost-benefit analysis approach is discussed in further detail in the following sections.
3.3.2 Evaluation parameters and assumptions
The CBA model parameters are similar to those detailed in our previous report, however there are some minorvariations which are detailed below in Table 1.
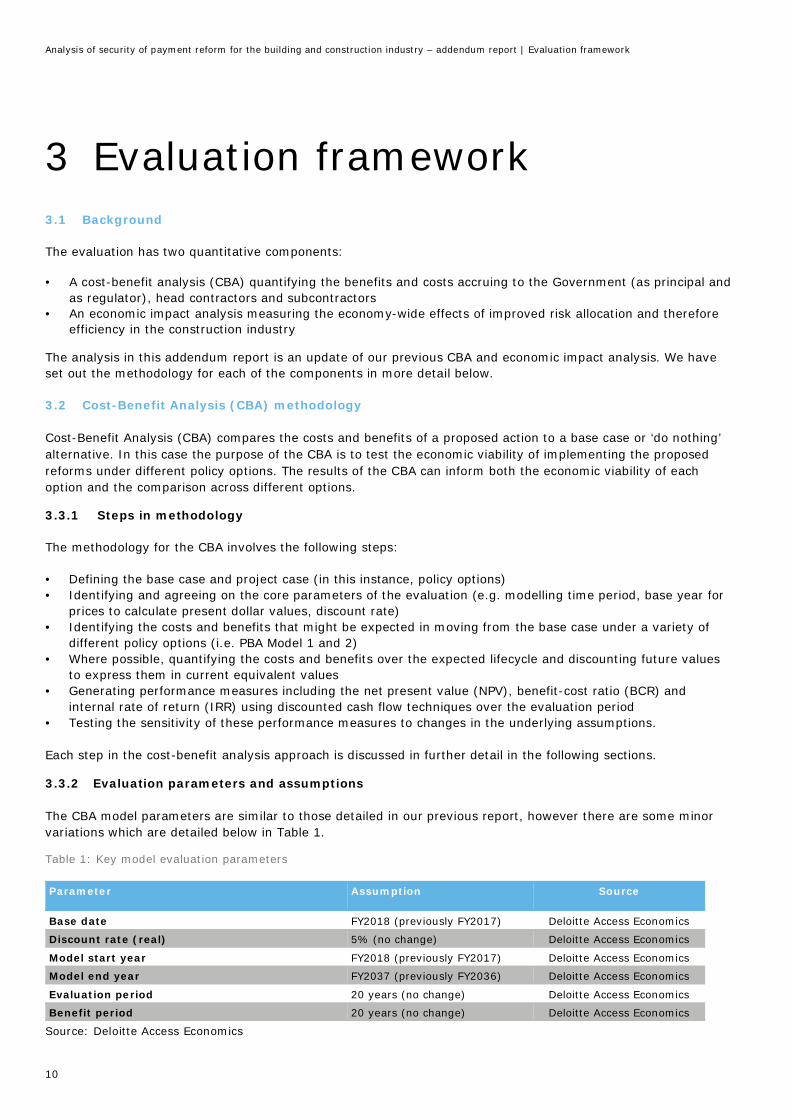
Table 1: Key model evaluation parameters
Parameter Assumption Source
Base date FY2018 (previously FY2017) Deloitte Access Economics
Discount rate (real) 5% (no change) Deloitte Access Economics
Model start year FY2018 (previously FY2017) Deloitte Access Economics
Model end year FY2037 (previously FY2036) Deloitte Access Economics
Evaluation period 20 years (no change) Deloitte Access Economics
Benefit period 20 years (no change) Deloitte Access Economics
Source: Deloitte Access Economics
Analysis of security of payment reform for the building and construction industry – addendum report | Evaluation framework
11
3.3 Economic Impact Analysis (CGE) methodology
The second element of the evaluation framework is the use of our in-house computable general equilibrium (CGE)model to understand the broader impacts of the reform on Queensland’s Gross State Product and employment.This model measures results by comparing a ‘business as usual’ scenario with the policy scenarios, where thepotential cost savings derived from improved security of payment in the CBA, are realised over 20 years to 2036-37. This model focuses on two major Queensland regions: South East Queensland1 (SEQ) and the rest ofQueensland2 (RoQ). Together they comprise the state as a whole and modelling results are presented for bothmajor regional areas.
The results of CGE modelling should be considered as a complement (but not a substitute) to the CBA. This isbecause in this case the CBA tells us whether this is a good policy change or not from a societal welfareperspective. CGE modelling is a broader analysis which considers the impact on the overall level of output fromthe economy as a whole. Specifically, in this report CGE modelling is used to evaluate the change in economicactivity resulting from implementing the proposed policy change on a subset of building and constructioncontracts.
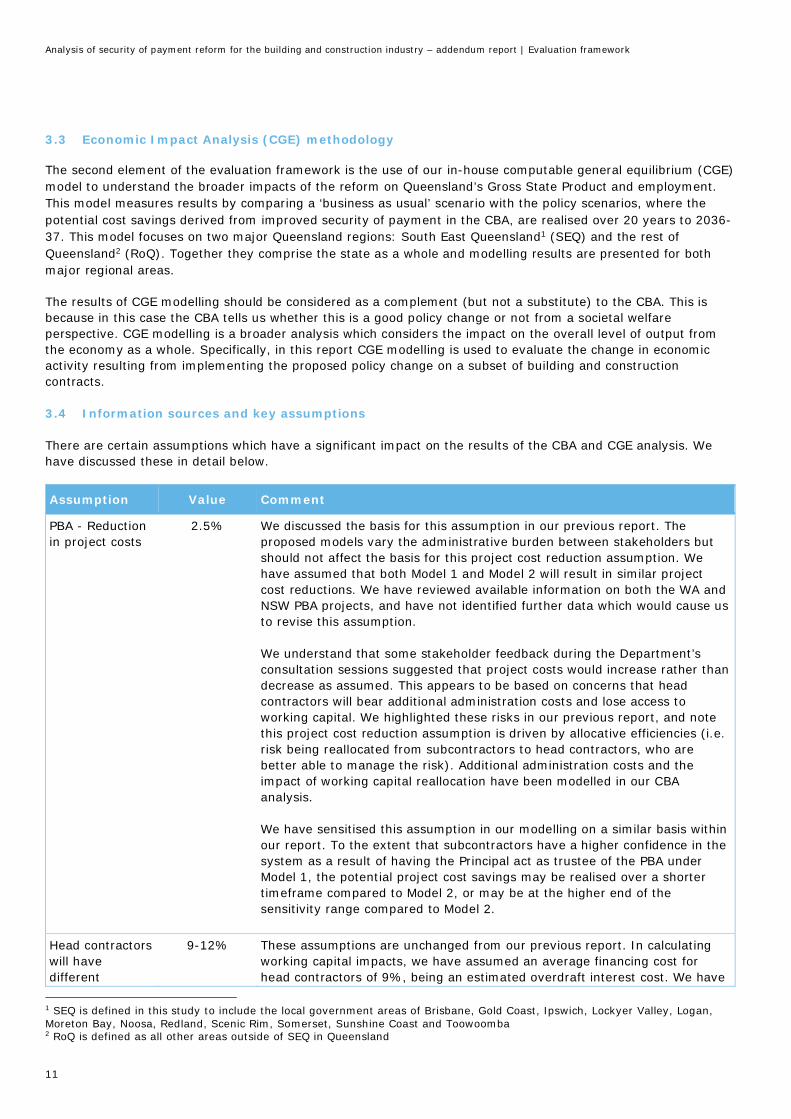
3.4 Information sources and key assumptions
There are certain assumptions which have a significant impact on the results of the CBA and CGE analysis. Wehave discussed these in detail below.
Assumption Value Comment
PBA - Reductionin project costs
2.5% We discussed the basis for this assumption in our previous report. Theproposed models vary the administrative burden between stakeholders butshould not affect the basis for this project cost reduction assumption. Wehave assumed that both Model 1 and Model 2 will result in similar projectcost reductions. We have reviewed available information on both the WA andNSW PBA projects, and have not identified further data which would cause usto revise this assumption.
We understand that some stakeholder feedback during the Department’sconsultation sessions suggested that project costs would increase rather thandecrease as assumed. This appears to be based on concerns that headcontractors will bear additional administration costs and lose access toworking capital. We highlighted these risks in our previous report, and notethis project cost reduction assumption is driven by allocative efficiencies (i.e.risk being reallocated from subcontractors to head contractors, who arebetter able to manage the risk). Additional administration costs and theimpact of working capital reallocation have been modelled in our CBAanalysis.
We have sensitised this assumption in our modelling on a similar basis withinour report. To the extent that subcontractors have a higher confidence in thesystem as a result of having the Principal act as trustee of the PBA underModel 1, the potential project cost savings may be realised over a shortertimeframe compared to Model 2, or may be at the higher end of thesensitivity range compared to Model 2.
Head contractorswill havedifferent
9-12% These assumptions are unchanged from our previous report. In calculatingworking capital impacts, we have assumed an average financing cost forhead contractors of 9%, being an estimated overdraft interest cost. We have
1 SEQ is defined in this study to include the local government areas of Brisbane, Gold Coast, Ipswich, Lockyer Valley, Logan,Moreton Bay, Noosa, Redland, Scenic Rim, Somerset, Sunshine Coast and Toowoomba2 RoQ is defined as all other areas outside of SEQ in Queensland
Analysis of security of payment reform for the building and construction industry – addendum report | Evaluation framework
12
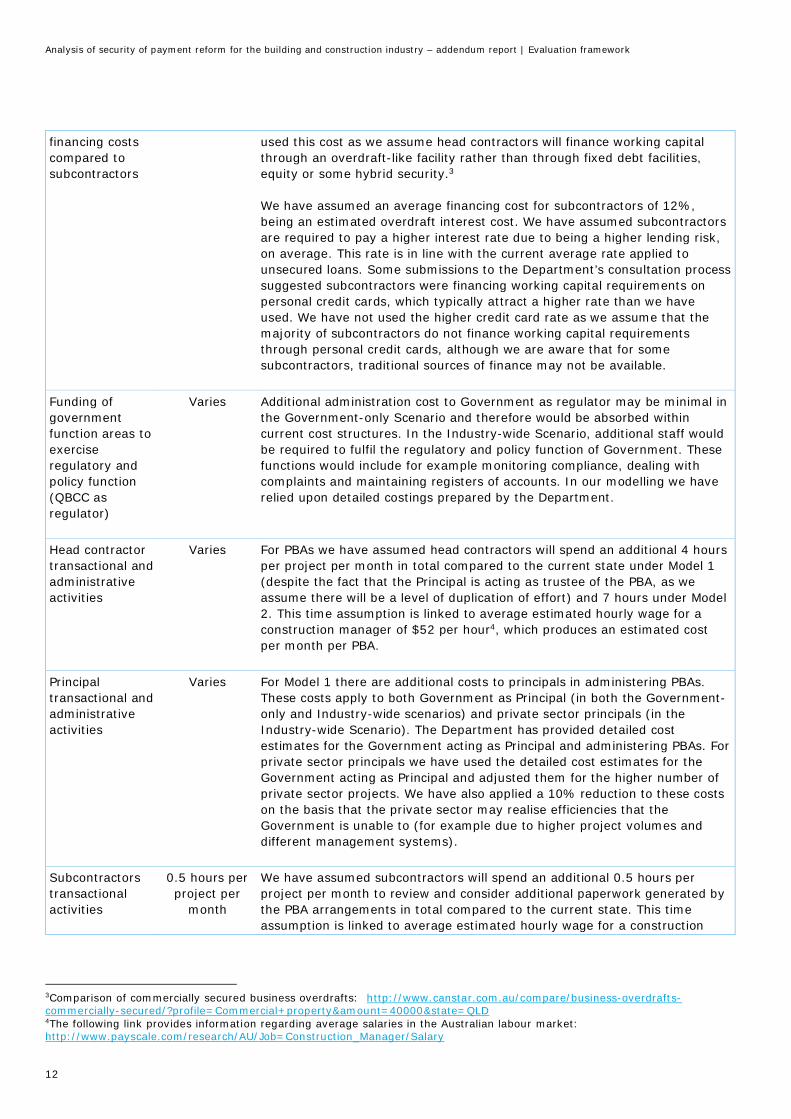
financing costscompared tosubcontractors
used this cost as we assume head contractors will finance working capitalthrough an overdraft-like facility rather than through fixed debt facilities,equity or some hybrid security.3
We have assumed an average financing cost for subcontractors of 12%,being an estimated overdraft interest cost. We have assumed subcontractorsare required to pay a higher interest rate due to being a higher lending risk,on average. This rate is in line with the current average rate applied tounsecured loans. Some submissions to the Department’s consultation processsuggested subcontractors were financing working capital requirements onpersonal credit cards, which typically attract a higher rate than we haveused. We have not used the higher credit card rate as we assume that themajority of subcontractors do not finance working capital requirementsthrough personal credit cards, although we are aware that for somesubcontractors, traditional sources of finance may not be available.
Funding ofgovernmentfunction areas toexerciseregulatory andpolicy function(QBCC asregulator)
Varies Additional administration cost to Government as regulator may be minimal inthe Government-only Scenario and therefore would be absorbed withincurrent cost structures. In the Industry-wide Scenario, additional staff wouldbe required to fulfil the regulatory and policy function of Government. Thesefunctions would include for example monitoring compliance, dealing withcomplaints and maintaining registers of accounts. In our modelling we haverelied upon detailed costings prepared by the Department.
Head contractortransactional andadministrativeactivities
Varies For PBAs we have assumed head contractors will spend an additional 4 hoursper project per month in total compared to the current state under Model 1(despite the fact that the Principal is acting as trustee of the PBA, as weassume there will be a level of duplication of effort) and 7 hours under Model2. This time assumption is linked to average estimated hourly wage for aconstruction manager of $52 per hour4, which produces an estimated costper month per PBA.
Principaltransactional andadministrativeactivities
Varies For Model 1 there are additional costs to principals in administering PBAs.These costs apply to both Government as Principal (in both the Government-only and Industry-wide scenarios) and private sector principals (in theIndustry-wide Scenario). The Department has provided detailed costestimates for the Government acting as Principal and administering PBAs. Forprivate sector principals we have used the detailed cost estimates for theGovernment acting as Principal and adjusted them for the higher number ofprivate sector projects. We have also applied a 10% reduction to these costson the basis that the private sector may realise efficiencies that theGovernment is unable to (for example due to higher project volumes anddifferent management systems).
Subcontractorstransactionalactivities
0.5 hours perproject per
month
We have assumed subcontractors will spend an additional 0.5 hours perproject per month to review and consider additional paperwork generated bythe PBA arrangements in total compared to the current state. This timeassumption is linked to average estimated hourly wage for a construction
3Comparison of commercially secured business overdrafts: http://www.canstar.com.au/compare/business-overdrafts-commercially-secured/?profile=Commercial+property&amount=40000&state=QLD4The following link provides information regarding average salaries in the Australian labour market:http://www.payscale.com/research/AU/Job=Construction_Manager/Salary

Analysis of security of payment reform for the building and construction industry – addendum report | Evaluation framework
13
manager of $52 per hour, which produces an estimated cost per month perPBA.
Contracting tiersanalysed
Tier oneSubcontractors
This assumption is unchanged from our previous report. Due to datalimitations, our analysis assumes a three layer structure of principal, headcontractor and subcontractors for each project. We have varied the assumednumber of contractors based on contract value, with projects of higher valueinvolving contractors over the life of the project compared to lower valueprojects. The extent to which the project procurement cost savingassumptions discussed above are realised may be affected by the number ofcontracting tiers covered by the proposed reforms.
Retention funds Cash only This assumption is unchanged from our previous report. We have assumedthat all retentions are cash retentions, as we have been unable to obtain dataon the proportion of cash retentions versus non-cash retentions (for examplebank guarantees or insurance bonds).
We have assumed that interest on retention funds held flows to the headcontractor under both Model 1 and Model 2.
Paymenttimeframes
60 days This assumption is unchanged from our previous report. We have assumedthat on average head contractors delay payment to subcontractors by 60days/2 months. This period of time was based on evidence provided to theSenate Committee which suggested that head contractors generally seek toextend payments to subcontractors for a period ranging from 30 to 90 days.5
3.5 Other jurisdictions and stakeholder consultation feedback
3.5.1 Updates from other jurisdictions
We have reviewed information available from other jurisdictions since issuing our previous report, and havediscussed any relevant updates or issues below.
Western Australia (WA)
WA has recently completed a PBA trial. The WA PBA model involves the head contractor establishing andmaintaining the PBA.6 The key findings of the trial were that PBAs can be successfully used on WA BuildingManagement and Works construction projects, can improve the transparency of the payment process and mayimprove the speed of payment for subcontractors7. The key drawbacks findings were that PBAs can bechallenging to establish (based on administrative effort) and required demanding administration of the monthlypayment process.8
5 Parliamentary review into insolvency in the Australian building and construction industry:http://www.aph.gov.au/Parliamentary_Business/Committees/Senate/Economics/Insolvency_construction/Report/c02
6The following link provides details about the roll-out of PBAs in WA:http://www.finance.wa.gov.au/cms/Building_Management_and_Works/New_Buildings/Project_bank_accounts.aspx
7 The following link provides information regarding the results from WA’s PBA trial:https://audit.wa.gov.au/wp-content/uploads/2016/12/report2016_31-PaymentSubcontractors.pdf
8See above

Analysis of security of payment reform for the building and construction industry – addendum report | Evaluation framework
14
Ultimately, the trial was deemed successful. A roll-out is underway with the PBA scheme being applied to themajority of projects tendered by WA’s Department of Finance Building Management and Works from 30September 2016. The PBA scheme will apply to projects with a construction value between $1.5m and $100m(including GST), involving one or more subcontractors. By 30 June 2017, it is expected that up to 30 contractsincorporating the use of PBAs will have been awarded with a combined value of approximately $220 million.
New South Wales (NSW)
The NSW Procurement Board trialled the use of PBAs on 10 NSW Government construction projects fromNovember 2013 to December 2015. In July 2015 it published an interim report which confirmed that PBAs werean option to use where an agency considered it supported the delivery of the project.
The trial is now complete and the NSW policy position is for the use of PBAs to continue on a case by casedecision for agencies to determine. For applicable contracts, the head contractor will establish and maintain thePBA. No further information is available at this time in relation to trial results or the future roll-out of PBAs.9
Victoria (VIC) and Northern Territory (NT)
Both Victoria and Northern Territory have run or are in the process of running PBA trials. We have been unable tolocate further information on the results of the trials to date.
United Kingdom (UK)
In our previous report we discussed a report published by Highways England regarding the introduction of PBAs.At the time of writing this addendum there has been no further information released by Highways England on theeffectiveness of its PBA scheme. The UK model involves the head contractor establishing and administering thePBA.
The Highways England report dated 2015 notes that although PBAs have been used since 2012, it has beendifficult to verify the quantum of the project cost savings, but that anecdotal evidence suggests that initialsavings are in the region of 1%, and will increase in the future as subcontracting tiers reflect acceleratedpayment as part of their price structure. This is consistent with a Textura Europe survey of UK subcontractorsthat identified that late payment risks led them to add 4% to bid costs, while they would discount 2.3% for earlypayment. Although we note that this is a stated preference and not a revealed preference it is consistent withother research that suggests subcontractors add a 5-10% premium to quotes to compensate for the extra risk ofnon-payment. The Highways England report notes that one of the key advantages of PBAs is the protectionafforded to subcontractors in the event of head contractor insolvency. To date Highways England has not had totest the effectiveness of this.
As at April 2015 there were in excess of 35 PBAs in operation across a suite of Highways England major schemesand maintenance contracts. A review of these PBAs found that the average time Highways England took to fundthe accounts was 12 days on average and a further 7 days on average for payments to be made to the supplychain. As a result the payment cycle down to the Tier 3 level on average was completed 19 days after theassessment date. The report notes that this compares favourably to a UK Cabinet Office study that stated lowerlevels of the supply chain were waiting up to 100 days to be paid.
The 2015 report on introduction of PBAs across Highways England projects suggests that the payment cycle downto the Tier 3 level can be rapidly accelerated. It notes that further work was required to improve the number ofsubcontractors that signed up to the PBA to ensure the benefits are applied to the fullest extent possible. The
9The following link provides details about the trial and roll-out of PBAs in NSW:https://www.procurepoint.nsw.gov.au/before-you-buy/construction/project-bank-accounts

Analysis of security of payment reform for the building and construction industry – addendum report | Evaluation framework
15
report suggests that no other initiative has been able to comprehensively reduce the payment cycle as much asthe PBA scheme.10
10Implementation of Project Bank Accounts across Highways England review:http://www.secgroup.org.uk/pdfs/2015/Implementation%20of%20Project%20Bank%20Accounts%20across%20Highways%20England.pdf

Analysis of security of payment reform for the building and construction industry – addendum report | PBA models
16
4 PBA models4.1 Background
In Section 4 of our previous report we discussed the components of a PBA scheme and some of the keyassumptions regarding how such a scheme would operate. These assumptions have changed as a result ofstakeholder consultation feedback and further detailed analysis of implementation issues by the Department.
We discuss the two models i.e. Model 1 and Model 2 and the key assumptions in detail below. This summarisesthe key differences and the typical process flow.
4.1.1 Model 1 – Principal controls PBA
This model involves the Principal and Head Contractor executing a trust deed to establish a trust with thePrincipal as trustee and Head Contractor and Subcontractors as beneficiaries. A PBA agreement is entered intobetween the bank, the Principal and the Head Contractor with the Principal establishing and maintaining the PBA.
Subcontractors make monthly payment claims to the Head Contractor, who in turn submits a payment claim tothe Principal. The Superintendent (an independent party engaged by the Principal) then assesses the paymentclaim in relation to work carried out. Based on this assessment the Principal issues a payment schedule to theHead Contractor. The Head Contractor then prepares a Progress Payment Instruction (PPI) including all amountscertified as payable to each Subcontractor. This PPI is provided to the Principal and a copy of the relevant extractprovided to each Subcontractor. The Principal verifies the PPI has the correct details (i.e. company / individualname and bank account details) for each proposed payment recipient and that the amounts are in line with thepayment schedule provided by the Superintendent. If the PPI is correct, the Principal deposits the payment intothe PBA and provides the Bank with the PPI, authorising the bank to disburse funds in accordance with the PPI.The bank then pays the Head Contractor and Subcontractors from the PBA as per the PPI.
In the above model, mid-cycle payments (i.e. payments to subcontractors that may be on short credit terms andtherefore out of sync with the progress payment timing agreed between the Principal and Head Contractor) arestill able to be processed. This would require Head Contractors to follow the same process as above, but top upthe PBA themselves to ensure there are funds to disburse to Subcontractors. In the next progress payment fromthe Principal the amount certified for that particular piece of work would flow to the Head Contractor, as the mid-cycle Subcontractors have already been paid.
This is a high level summary of the process for Model 1. There are a number of issues that we understand theDepartment is considering which may impact on the final design of this model, such as the process for paymentof disputed amounts into a disputed funds account, the issue of head contractors with related partysubcontractors and the risks to the Principal in acting as trustee but being reliant on the Head Contractor tocollect and provide information which we have not discussed as they are outside the scope of this addendumreport.
4.1.2 Model 2 – Head Contractor controls PBA
This model involves the Principal and Head Contractor executing a trust deed to establish a trust with the HeadContractor as trustee and naming the Head Contractor and Subcontractors as beneficiaries. A PBA agreement isentered between the bank, the Principal and the Head Contractor with the Head Contractor establishing andmaintaining the PBA.
Subcontractors make monthly payment claims to the Head Contractor who in turn submits a payment claim tothe Principal. The Superintendent then assesses the payment claim in relation to work carried out and based onthis assessment, issues a payment schedule to the Head Contractor. The Head Contractor then prepares theProgress Payment Instruction (PPI) including all amounts certified as payable to each Subcontractor. A copy ofthe relevant extracts of the PPI is provided to each Subcontractor but, unlike Model 1, the PPI is provided directly

Analysis of security of payment reform for the building and construction industry – addendum report | PBA models
17
to the bank by the Head Contractor, with a copy provided to the Principal. The Principal verifies the PPI has thecorrect details (i.e. company / individual name and bank account details) for each proposed payment recipientand again unlike Model 1, the Principal does not confirm the accuracy of each individual payment amount. ThePrincipal provides the Subcontractor with a copy of the relevant portion of the final PPI. The Principal deposits theprogress payment into the PBA. The Bank then pays the Head Contractor and Subcontractors from the PBA in linewith the PPI. Similar to Model 1, mid-cycle payments are possible.
This is a high level summary of the process for Model 2. There are a number of issues that we understand theDepartment is considering which may impact on the final design of this model, such as the process for paymentof disputed amounts into a disputed funds account, the issue of head contractors with related partysubcontractors and the risks to the Principal in having an oversight role in the process which we have notdiscussed as they are outside the scope of this addendum report.
4.1.3 Summary of differences between Model 1 and Model 2
Proposedmodel Defining features Benefits Issues
Model 1.Principal astrustee of PBA
Principal is trustee andestablishes and
maintains the PBA.
Principal reviewsProgress PaymentInstruction (PPI) to
check beneficiaries anddetails are correct.
All project payments areprocessed through PBA.
PBA is excluded fromPPSA.
Principal has greater oversightand control over operation of
the PBA account. This would bea benefit where there areconcerns regarding Head
Contractor conduct.
Principal as trustee providesgreater level of oversight in
the system.
For Government projects, itwill ensure only beneficiaries of
the trust are paid from thePBA. For private sector
projects there may still be arisk that Principals and HeadContractors collude to avoid
payments to Subcontractors orpush out the timing of
payments.
Principal assumes moreresponsibility and risk as trustee
e.g. potential involvement inlawsuits.
More resource intensive forPrincipals across both Government
and private sector. It is afundamental shift in the
relationship and risk allocationsbetween Principal and HeadContractor compared to thecurrent state. There will be
additional costs to Principals andlikely some level of duplication of
effort between Principals and HeadContractors.
For both Government and privatesector projects, there may be aperception that government or
private sector Principals areresponsible for any non-payment
of Subcontractors.
In some cases Principals may actdishonestly and may use theirposition as trustee as leverage
against the Head Contractors. Thiscould be in the form of delaying
payments to or from the PBA, andalso in relation to having greater
transparency into the HeadContractor’s pricing and profitmargins which can be used as
leverage in commercialnegotiations or disputes.

Analysis of security of payment reform for the building and construction industry – addendum report | PBA models
18
Proposedmodel Defining features Benefits Issues
Model 2. HeadContractor astrustee of PBA
Head Contractorestablishes and
maintains the PBA.
Principal reviewsProgress PaymentInstruction (PPI) to
check beneficiaries arecorrect.
All project payments areprocessed through PBA.
PBA is excluded fromPPSA.
The additional step (comparedto the model considered in ourprevious report) of having the
Principal review the PPIprovides greater level ofoversight in the system.
For Government projects, itwill ensure only beneficiaries of
the trust are paid from thePBA. For private sector
projects there may still be arisk that Principals and HeadContractors collude to avoid
payments to Subcontractors orpush out the timing of
payments.
Additional costs to HeadContractors compared to the
current state.
Principal assumes some risk inchecking PPI and incurs additional
costs compared to the currentstate.
Principals may use the greatertransparency into the Head
Contractor’s pricing and profitmargins as leverage in commercial
negotiations or disputes.
4.2 Model 1 – Principal as PBA administrator (across both the Government-only Scenario and theIndustry-wide Scenario)
4.2.1 Summary of CBA results
At the highest level, the CBA evaluation results show that Model 1 under the Government-only Scenario returns anet benefit to society, of $101m, leading to a Benefit Cost Ratio (BCR) of 1.50. The net benefits to stakeholdersare shown below.
Figure 5: CBA evaluation results, Model 1 in the Government-only Scenario
When Model 1 is applied to the entire industry under the Industry-wide Scenario, it returns a net benefit tosociety of $4.1bn, leading to a BCR of 2.35. The net benefits to stakeholders are shown below.
100.59
91.87
-164.69
173.41
-$200
-$150
-$100
-$50
$0
$50
$100
$150
$200
Net benefit to society Government
Head contractors Subcontractors
BCR = 1.50
$m

Analysis of security of payment reform for the building and construction industry – addendum report | PBA models
19
Figure 6: CBA evaluation results, Model 1 in the Industry-wide Scenario
4.2.1.1 Benefits and costs to Government as Principal and Regulator
Benefits
For the Government, benefits are expected to arise from savings in project procurement costs. The rationale forthis benefit is that anecdotal evidence suggests that currently subcontractors price in a risk contingency premiumfor late or unpaid payment claims when quoting prices for undertaking contracts. It is expected that theimplementation of a PBA scheme will ensure more timely payment to subcontractors, which will over timeeliminate the risk factor for subcontractors resulting from late payments/non-payments. The reduction in projectpricing following the implementation of PBAs has been estimated to range from 1% to 4%. A mid-point of 2.5%has been adopted for the PBA option. The basis for this assumed reduction is that head contractors are betterplaced to manage project risk. This is discussed in detail in Section 8 of our previous report.
For Model 1, under the Government-only Scenario, a forecast total contract value for government procured non-infrastructure projects between $1-10m in Queensland has been developed based on data provided by theDepartment. For Model 1 under the Industry-wide Scenario, a forecast total contract value for whole ofGovernment building and construction procurement above $1m and private sector building and constructionabove $1m, (excluding infrastructure projects and residential building and construction) has also been developedbased on data provided by the Department.
Applying a 2.5% price reduction to the projected total contract values, an NPV benefit saving of approximately$253m has been estimated for the Government over a 20 year evaluation period under the Government-onlyScenario and $452m under the Industry-wide Scenario.
Costs
Initial implementation cost
Under Model 1, Government will incur initial one-off consulting and legal costs of $0.4m in both the Government-only Scenario and the Industry-wide Scenario.
4.14
0.12
3.73
-3 .96
4.24
-$5
-$4
-$3
-$2
-$1
$0
$1
$2
$3
$4
$5
$bn
Net benefit to society GovernmentPrivate sector principals Head contractorsSubcontractors
BCR = 2.35
Benefits: Savings in project procurement costs as Principal
Cost: Initial implementation cost, ongoing administration cost, regulatory cost

Analysis of security of payment reform for the building and construction industry – addendum report | PBA models
20
Ongoing administration costs
Government will incur ongoing administration relating to compliance requirements of a PBA scheme includingadditional FTEs, necessary I.T. and facilities upgrades in addition to bank fees due to Government’s role as PBAadministrator and trustee. Evaluation and education costs over the initial few years are also included. These total$161m under the Government-only Scenario and $260m under the Industry-wide Scenario on an NPV basis.
Regulatory cost
It is assumed that there are no additional costs to Government as regulator in the Government-only Scenario asthe Government can enforce the PBA scheme through contractual means. However under the Industry-wideScenario, the Government will also incur costs relating to its role as a regulator (QBCC) of the private sector of$73m (this excludes regulatory I.T. costs which are currently unknown).
4.2.1.2 Benefits and costs to private sector Principals
Benefits
There will be no impact on private sector Principals under the Government-only Scenario as only Governmentcontracts are included.
Private sector Principals will obtain a benefit in the Industry-wide Scenario where whole of Government buildingand construction procurement above $1m and private sector building and construction above $1m (excludinginfrastructure projects and residential building and construction) are included. The expected benefits are similarto those highlighted earlier for the Government acting as Principal i.e. savings in overall project procurementcosts due to eliminating the risk factor for subcontractors resulting from late payments/non-payments.
Applying a 2.5% price reduction to the projected total contract values, an NPV benefit saving has been estimatedfor private sector Principals of $5.6bn under the Industry-wide Scenario.
Costs
There will be no impact on private sector Principals under the Government-only Scenario as only Governmentcontracts are included.
In the Industry-wide Scenario, costs to private sector Principals are estimated to be proportionally similar to theGovernment’s costs of acting as Principal (and PBA administrator), adjusted for the higher number of privatesector projects. We have also applied a private sector efficiency gain of 10%, on the basis there may beefficiencies from the larger number of projects and different management systems in the private sector. We haveestimated total discounted costs for private sector Principals of $1.9bn.
4.2.1.3 Benefits and costs to Head contractors
Benefits: Savings in project procurement costs (only applies under the Industry-wide Scenario)
Cost: Initial implementation cost, ongoing administration cost (only applies under the Industry-wide Scenario)
Benefits: Interest earned on retention funds held in PBA, reduced costs from payment disputes
Costs: Reduced working capital, cost of ongoing compliance

Analysis of security of payment reform for the building and construction industry – addendum report | PBA models
21
Benefits
Interest earned on retention funds held in PBA
For head contractors, the benefits under the PBA are minor. One of the benefits to the head contractors is theinterest earned from retention money deposited into the account (In the base case it is assumed this benefit willnot be realised as funds are used for general working capital by head contractors). Retention money is deductedfrom the monthly progress claims. We have assumed that for every monthly progress claim submitted bysubcontractors, 5% is held as retention money, with half of the 5% (i.e. 2.5%) being released upon projectcompletion, while the remaining 2.5% will be released upon a 12 month defect liability period, in accordance withcommon industry practice. Consequently the amount of interest earned is determined by the following threeparameters: length of the project, interest rate and contract value. The longer the project, the greater period oftime retention funds will accrue interest. Similarly, the higher the interest rate, the more interest that will accrueon these funds. Finally, higher project values result in increased retention monies deposited into the account. Thishas been modelled as having a benefit of $3.5m over a 20 year evaluation period under the Government-onlyScenario, and $98m under the Industry-wide Scenario.
Reduced costs from payment disputes
There is an additional benefit to the head contractor under the PBA scheme, relating to reduction in potentialpayment disputes. The current payment scheme is prone to payment disputes resulting from delayed payments.The payment dispute process may involve legal, court and administrative costs which is an inefficient use ofresources in addition to a source of delay for project completions.
The PBA scheme is expected to improve speed of payments to subcontractors, as progress payments are nolonger held by the head contractor. Therefore, it is expected that dispute costs relating to late payment will bereduced under this policy option.
The benefits from reduced costs in payment disputes have been calculated to be approximately $0.06m over a 20year evaluation period under the Government-only Scenario and $1.5m under the Industry-wide Scenario. This isbased on historical adjudication fees occurred under BCIPA from 2011-16 provided by the Department assumingthat 10% of the disputes under BCIPA are in relation to late payment and there will be a 5% reduction in latepayment related disputes upon the implementation of the PBA scheme.
Overall benefits amount to approximately $4m over the 20 year evaluation period under Model 1 Government-only Scenario and $100m under Model 1 Industry-wide Scenario.
Costs
A number of costs have been identified for head contractors. The key costs attributable to the PBA Model 1 are:
· Reduced working capital from loss of access to retention money held in PBA;· Reduced working capital from loss of access to progress payments; and· Cost of ongoing compliance.
Reduced working capital from loss of access to retention money held in PBA
The reduced working capital from the loss of access to retention money (compared to the Base Case where headcontractors are able to utilise the retention money as working capital) is estimated to be approximately $20mover the 20 year evaluation period under the Government-only Scenario and $553m under the Industry-wideScenario. This loss is calculated using the same methodology discussed above, but using a financing cost of 9%(as opposed to 1.6% that can be earned as interest). As a result, the cost to head contractors of losing access toretention money (financing cost to obtain working capital which was previously funded by the Head contractorholding on to retention money) compares unfavourably with the benefit (interest income that can be earned onthe trust account as discussed above).

Analysis of security of payment reform for the building and construction industry – addendum report | PBA models
22
Reduced working capital from loss of access to progress payments
The most significant cost to head contractors under both the Government-only Scenario and the Industry-wideScenario is the reduced working capital from the loss of access to progress payments (which under the Base Casecan be utilised by the Head contractor as working capital), which amounts to a cost of $143m under theGovernment-only Scenario and $3.4bn under the Industry-wide Scenario.
The working capital cost to head contractors from loss of access to progress payments is based upon thefollowing parameters:
· Subcontractor percentage of project value (assumed to be 5%, provided by the Department)· Progress payment percentage (assumed to be 95%, based on industry standard practice)· Project duration (assumed to be 6 months for projects between $1-5m, 12 months for projects between
$5-20m and 24 months for projects above $20m, based on industry standard practice)· Delay in payment (assumed to be 2 months, based on anecdotal evidence)· Financing cost of head contractor (assumed to be 9%)
Ongoing compliance
There is also an additional cost of PBA compliance for head contractors on an ongoing basis, notwithstanding thatunder Model 1, principals are acting as trustee of the PBA. This cost amounts to $6m under the Government-onlyScenario and $74m under the Industry-wide Scenario and has been estimated based on activity levels.
4.2.1.4 Benefits and costs to Subcontractors
Benefits
Improved working capital
Benefits to subcontractors mainly arise from improved working capital from progress payments being made intime.
The section above noted that under both the Government-only and the Industry-wide Scenarios for Model 1, headcontractors lose access to interest free cash held under the Base Case and are now required to finance theiractivities at an assumed 9% financing cost. This working capital is transferred to subcontractors, assubcontractors are now being paid on time and therefore avoid additional financing cost at an assumed 12%financing cost. For further detail regarding the financing cost assumptions, please refer to Section 3.4. Theavoided 12% financing cost amounts to a saving of approximately $191m in present value terms (over 20 yearevaluation period) under the Government-only Scenario and $4.6bn under the Industry-wide Scenario.
Reduced costs from payment disputes
Similar to head contractors, there is an additional benefit to subcontractors under the PBA scheme, relating toreduction in potential payment disputes of $0.02m over 20 years under the Government-only Scenario and$0.5m under the Industry-wide Scenario.
Costs
The primary cost that has been identified and modelled for subcontractors is the administrative cost of ongoingcompliance arising from being a beneficiary to a trust account and additional documentation that entails. Thiscost has been estimated at $17m under the Government-only Scenario and $334m under the Industry-wide
Benefits: Improved working capital, reduced costs from payment disputes
Costs: Costs of ongoing compliance
Analysis of security of payment reform for the building and construction industry – addendum report | PBA models
23
Scenario. The cost has been estimated based on estimated activity levels, assumed to be 0.5 hours per projectper month.
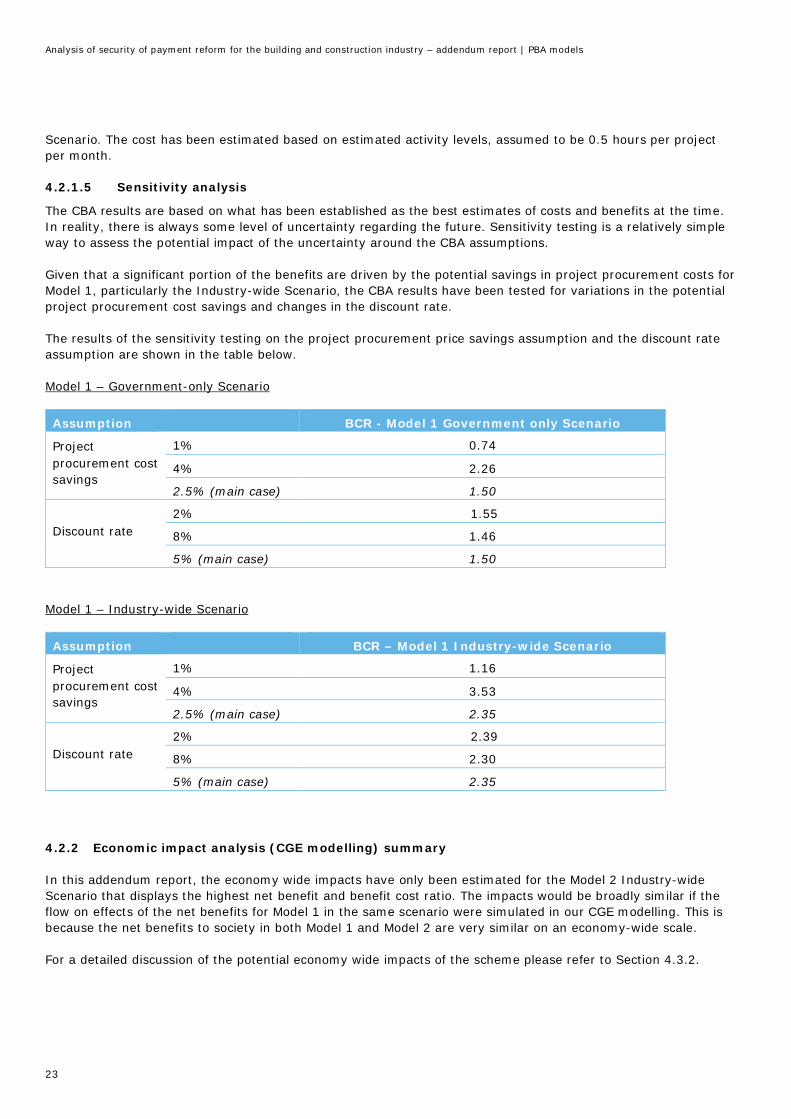
4.2.1.5 Sensitivity analysis
The CBA results are based on what has been established as the best estimates of costs and benefits at the time.In reality, there is always some level of uncertainty regarding the future. Sensitivity testing is a relatively simpleway to assess the potential impact of the uncertainty around the CBA assumptions.
Given that a significant portion of the benefits are driven by the potential savings in project procurement costs forModel 1, particularly the Industry-wide Scenario, the CBA results have been tested for variations in the potentialproject procurement cost savings and changes in the discount rate.
The results of the sensitivity testing on the project procurement price savings assumption and the discount rateassumption are shown in the table below.
Model 1 – Government-only Scenario
Assumption BCR - Model 1 Government only Scenario
Projectprocurement costsavings
1% 0.74
4% 2.26
2.5% (main case) 1.50
Discount rate2% 1.55
8% 1.46
5% (main case) 1.50
Model 1 – Industry-wide Scenario
Assumption BCR – Model 1 Industry-wide Scenario
Projectprocurement costsavings
1% 1.16
4% 3.53
2.5% (main case) 2.35
Discount rate2% 2.39
8% 2.30
5% (main case) 2.35
4.2.2 Economic impact analysis (CGE modelling) summary
In this addendum report, the economy wide impacts have only been estimated for the Model 2 Industry-wideScenario that displays the highest net benefit and benefit cost ratio. The impacts would be broadly similar if theflow on effects of the net benefits for Model 1 in the same scenario were simulated in our CGE modelling. This isbecause the net benefits to society in both Model 1 and Model 2 are very similar on an economy-wide scale.
For a detailed discussion of the potential economy wide impacts of the scheme please refer to Section 4.3.2.
Analysis of security of payment reform for the building and construction industry – addendum report | PBA models
24
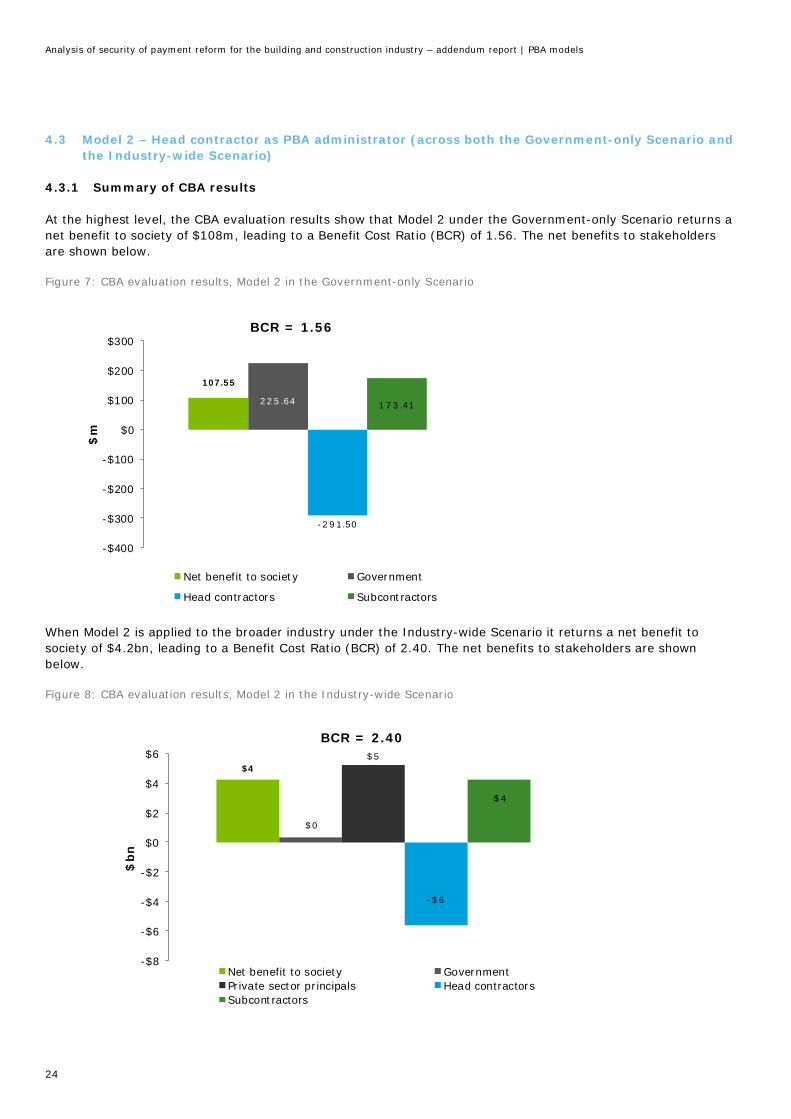
4.3 Model 2 – Head contractor as PBA administrator (across both the Government-only Scenario andthe Industry-wide Scenario)
4.3.1 Summary of CBA results
At the highest level, the CBA evaluation results show that Model 2 under the Government-only Scenario returns anet benefit to society of $108m, leading to a Benefit Cost Ratio (BCR) of 1.56. The net benefits to stakeholdersare shown below.
Figure 7: CBA evaluation results, Model 2 in the Government-only Scenario
When Model 2 is applied to the broader industry under the Industry-wide Scenario it returns a net benefit tosociety of $4.2bn, leading to a Benefit Cost Ratio (BCR) of 2.40. The net benefits to stakeholders are shownbelow.
Figure 8: CBA evaluation results, Model 2 in the Industry-wide Scenario
107.55
225.64
-291.50
173.41
-$400
-$300
-$200
-$100
$0
$100
$200
$300
Net benefit to society Government
Head contractors Subcontractors
BCR = 1.56
$m
$4
$0
$5
-$6
$4
-$8
-$6
-$4
-$2
$0
$2
$4
$6
$bn
Net benefit to society GovernmentPrivate sector principals Head contractorsSubcontractors
BCR = 2.40

Analysis of security of payment reform for the building and construction industry – addendum report | PBA models
25
4.3.1.1 Benefits and costs to Government as Principal and Regulator
Benefits
Under Model 2, the benefits for Government as Principal mirror the benefits outlined under the results of Model 1,across both the Government-only Scenario and the Industry-wide Scenario i.e. a benefit of $253m under theGovernment-only Scenario and $452m under the Industry-wide Scenario.
Costs
Initial implementation cost
Similar to Model 1, Government will incur initial one-off consulting and legal costs of $0.4m in both theGovernment-only Scenario and the Industry-wide Scenario.
Ongoing administration cost
Under Model 2, the costs for Government as Principal are of a similar nature to the costs outlined under Model 1,across both the Government-only Scenario and the Industry-wide Scenario. However there is a key differenceunder Model 2 as the Principal is no longer the PBA administrator (the Head contractor assumes that role) andthus the Government incurs less costs in relation to PBA compliance under Model 2 due to the lack of the PBAadministrator-related costs. Total ongoing administration costs equate to $27m under the Government-onlyScenario and $44m under the Industry-wide Scenario on an NPV basis.
Regulatory cost
No regulatory cost is assumed in Model 2 under the Government-only Scenario, consistent with Model 1 under theGovernment-only Scenario. However there are costs applicable to Government in its role as regulator (QBCC) ofthe private sector in Model 2 in the Industry-wide Scenario. These costs total $73m on an NPV basis (excludingregulatory I.T. costs which are currently unknown). This figure is calculated over the 20 year evaluation period.We understand that the assumptions driving these costs will be further refined as part of the evaluation of theGovernment-only Scenario implementation, and could be reduced if the industry education program is effective inminimising the number of queries and compliance issues that the Government is required to address. As theevaluation period is lengthy, a change in the assumptions could have a significant impact on the total cost.
The cost to Government as Principal and regulator totals $27m under Model 2 in the Government-only Scenarioand $117m under Model 2 in the Industry-wide Scenario on an NPV basis.
4.3.1.2 Benefits and costs to private sector Principals
Benefits
There will be no impact on private sector Principals under the Government-only Scenario as only Governmentcontracts are included.
Benefits: Savings in project procurement costs as Principal
Cost: Initial implementation cost, ongoing administration cost, regulatory cost
Benefits: Savings in project procurement costs as Principal (only applies under the Industry-wideScenario)
Cost: Initial implementation cost, ongoing administration cost (only applies under the Industry-wide Scenario)

Analysis of security of payment reform for the building and construction industry – addendum report | PBA models
26
Private sector Principals will obtain a benefit in the Industry-wide Scenario where whole of Government buildingand construction procurement above $1m and private sector building and construction above $1m (excludinginfrastructure projects and residential building and construction) are included. The expected benefits are similarto those highlighted earlier for the Government acting as Principal i.e. savings in overall project procurementcosts due to eliminating the risk factor for subcontractors resulting from late payments/non-payments.
For Model 1 in the Industry-wide Scenario, a forecast total contract value for whole of Government building andconstruction procurement above $1m and private sector building and construction above $1m, (excludinginfrastructure projects and residential building and construction) has been developed based on data provided bythe Department.
Applying a 2.5% price reduction to the projected total contract values, a discounted benefit saving has beenestimated for private sector Principals at $5.6bn under the Industry-wide Scenario.
Costs
Initial implementation cost
There will be no impact on private sector Principals under the Government-only Scenario as only Governmentcontracts are included. In the Industry-wide Scenario, no initial implementation costs are estimated.
Ongoing administration cost
There will be no impact on private sector Principals under the Government-only Scenario as only Governmentcontracts are included. In the Industry-wide Scenario, costs to private sector Principals are estimated to beproportionally similar to the Government’s costs of acting as Principal, adjusted for the higher number of privatesector projects. We have also applied a private sector efficiency gain of 10%, on the basis there may beefficiencies from the larger number of projects and different management systems in the private sector. Costs areestimated at $375m.
4.3.1.3 Benefits and costs to Head contractors
Benefits
Interest earned on retention funds held in PBA
Under Model 2, the benefits for head contractors from interest earned on retention funds held in the PBA mirrorthe benefits for Model 1, across both the Government-only Scenario and the Industry-wide Scenario i.e. $3.5mand $98m respectively.
Reduced costs from payment disputes
Similarly, the benefits from the reduced costs from payment disputes under Model 2 mirror Model 1 under boththe Government-only Scenario and Industry-wide Scenario i.e. $0.06m and $1.5m respectively.
Costs
Reduced working capital from loss of access to retention money held in PBA
Costs under Model 2 are similar to those under Model 1 for the reduced working capital from loss of access toretention money held in PBA. These costs remain constant from Model 1 to Model 2, at $20m under the
Benefits: Interest earned on retention funds held in PBA, reduced costs from payment disputes
Costs: Reduced working capital, cost of ongoing compliance

Analysis of security of payment reform for the building and construction industry – addendum report | PBA models
27
Government-only Scenario and $553m under the Industry-wide Scenario. This is calculated from themethodology described previously under Model 1.
Reduced working capital from loss of access to progress payments
Costs under Model 2 are similar to those under Model 1 for the reduced working capital from loss of access toprogress payments. These costs remain constant from Model 1 to Model 2, at $143m under the Government-onlyScenario and $3.4bn under the Industry-wide Scenario. This is calculated from the methodology describedpreviously under Model 1.
Ongoing compliance
Ongoing compliance costs differ under Model 2 compared to Model 1, as the Head contractor administers the PBA,and therefore there are additional ongoing compliance and administration costs associated with taking on thisrole. For instance additional FTEs needed to complete the required administrative burden and additional costssuch as bank fees.
These non-working capital costs total $132m under Model 2 in the Government-only Scenario and $1.7bn underthe Industry-wide Scenario.
4.3.1.4 Benefits and costs to Subcontractors
Benefits
Improved working capital
Benefits to subcontractors are the same under both Model 1 and Model 2 totaling $191m under the Government-only Scenario and $4.6bn under the Industry-wide Scenario.
Reduced costs from payment disputes
Benefits to subcontractors are the same under both Model 1 and Model 2 totaling $0.02m under the Government-only Scenario and $0.5m under the Industry-wide Scenario.
Costs
Similar to Model 1, under Model 2 the primary cost that has been identified and modelled for subcontractors isthe administrative cost of ongoing compliance arising from being a beneficiary to a trust account and additionaldocumentation that this entails. This cost has been estimated at $17m under the Government-only Scenario and$334m under the Industry-wide Scenario.
4.3.1.5 Sensitivity analysis
We have sensitised the project procurement cost savings and discount rate assumptions for Model 2 for both theGovernment-only Scenario and the Industry-wide Scenario on a similar basis to that discussed for Model 1. Theresults of the sensitivity testing are shown in the table below.
Model 2 – Government-only Scenario
Assumption BCR - Model 2 Government-only Scenario
1% 0.77
Benefits: Improved working capital, reduced costs from payment disputes
Costs: Costs of ongoing compliance

Analysis of security of payment reform for the building and construction industry – addendum report | PBA models
28
Projectprocurement costsavings
4% 2.34
2.5% (main case) 1.56
Discount rate2% 1.61
8% 1.51
5% (main case) 1.56
Model 2 – Scenario 2
Assumption BCR – Model 2 Industry-wide Scenario
Projectprocurement costsavings
1% 1.19
4% 3.61
2.5% (main case) 2.40
Discount rate2% 2.45
8% 2.36
5% (main case) 2.40
4.3.2 Economic impact analysis (CGE modelling) summary
This section presents the findings of CGE modelling, including impacts on gross regional product (GRP) andemployment for Model 2 Industry-wide Scenario. As stated earlier, this scenario was found to be the mostefficient from the perspective of society having the highest net benefit and benefit cost ratio. There is also somediscussion of the results including industry and regional findings as well as discussion on total Queensland levelimpacts. Impacts are reported for two regional areas including South East Queensland (SEQ) and Rest ofQueensland (RoQ).
In summary, for the Model 2 Industry-wide Scenario, it has been estimated that the economic impact of thepolicy change could lead to an increase of real GRP of $9.4bn in SEQ in net present value terms using a 5 percent real discount rate out to 2036-37. For the RoQ region, this is estimated to increase real GRP by $3.2bn overthe same timeframe. In total, Queensland real Gross State Product (GSP) increases by an estimated $12.6bnover the same time-frame in NPV terms.
The modelling indicates that employment could increase by up to 3,195 FTEs in Queensland by 2036-37comprising of 1,822 FTEs in SEQ and 1,373 FTEs in RoQ. In average annual terms, the net increase inemployment is expected to be 1,576 FTEs in SEQ and 2,373 in Queensland as a whole. The distribution of thisemployment increase is expected to increase employment primarily in the construction, other services andfinancial and business services sectors.
4.3.2.1 CGE Modelling Results – Model 2 Industry-wide Scenario
Gross Regional Product
It has been estimated that the economic impact of the policy change could lead to an increase of real GRP of$9.4bn in SEQ in net present value terms using a 5 per cent real discount rate over the evaluation period. For theRoQ region, this is estimated to increase real GRP by $3.2bn over the same timeframe. In total, Queensland realGross State Product (GSP) increases by an estimated $12.6bn over the same time-frame in NPV terms.
The profile of real GSP is shown in the following charts both in terms of level changes and % point deviations.

Analysis of security of payment reform for the building and construction industry – addendum report | PBA models
29
Figure 11: Impacts on Gross Regional Product ($ millions real, $2017-18), 2017-18 to 2036-37, Model 2 Industry-wideScenario
Source: Deloitte Access Economics
Figure 9: Impacts on Real Gross Regional Product (% point deviation), 2017-18 to 2036-37, Model 2 Industry-wideScenario
Source: Deloitte Access Economics
Employment
The modelling indicates that employment could increase by up to 3,195 FTEs in Queensland by 2036-37comprising of 1,822 FTEs in SEQ and 1,373 FTEs in RoQ. In average annual terms, the net increase inemployment is expected to be 1,576 FTEs in SEQ and 2,373 FTEs in Queensland as a whole. The distribution ofthis employment increase is expected to increase employment primarily in the construction, financial andbusiness services sectors and other services. In Queensland, the total jobs impacts increase each year after thepolicy is implemented as the cost savings of the policy change flow through the broader economy.

Analysis of security of payment reform for the building and construction industry – addendum report | PBA models
30
Figure13: Impacts on employment, 2017-18 to 2036-37, Model 2 Industry-wide Scenario
Source: Deloitte Access Economics
The breakdown of the potential employment increase is provided in more detail in the following subsection.
Sectoral results and discussion
A summary of the GRP/GSP, employment and industry impacts is reported in Table 6 below.
The significant impacts predicted in employment and industry output are a function of the costs savings thatresult primarily to the construction industry as a result of the policy change. The impacts at the industry level aremagnified as the improvement in productivity in the construction sector (that translates to a price reduction inthe construction industry) has beneficial flow-effects to industries that use construction and supply toconstruction. The productivity improvement also leads indirectly to additional investment in the economy and inincome growth that supports services industry output.
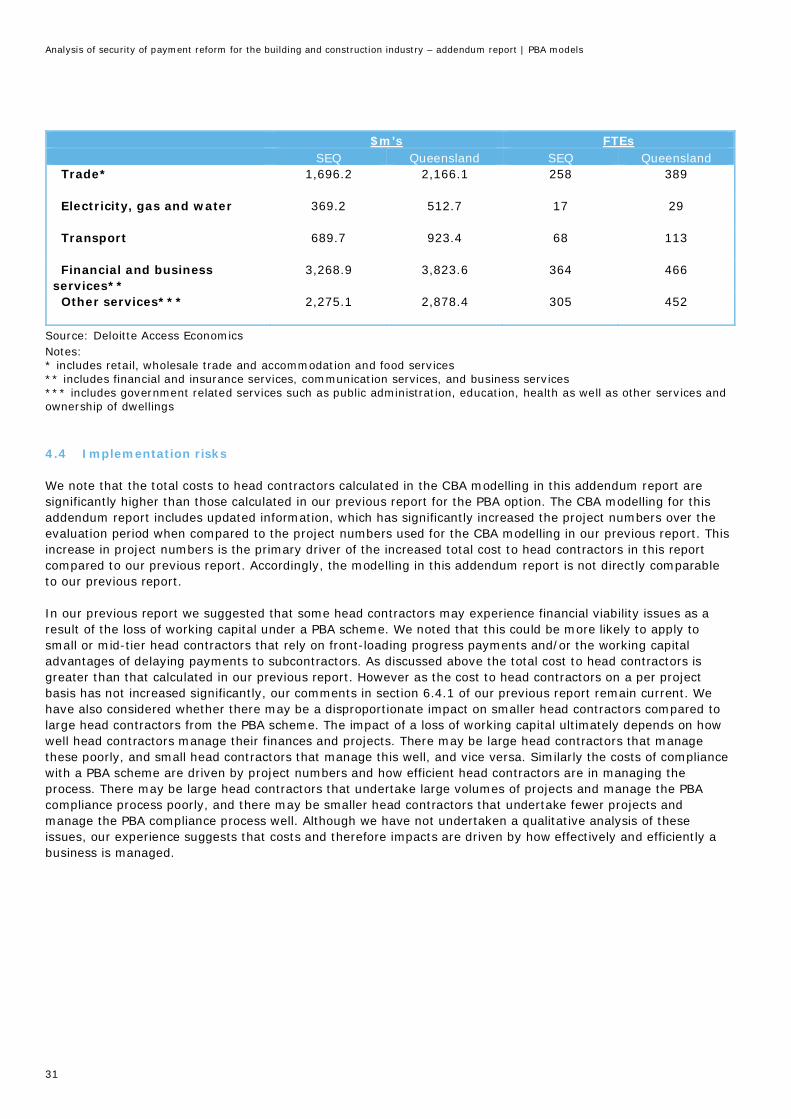
Table 6: Sectoral impacts, ($m, NPV, $2017-18 and FTE, annual average), Model 2 Industry-wide Scenario
$m’s FTEsSEQ Queensland SEQ Queensland
GRP/GSP deviation ($m) 9,447 12,611
Employment (FTE, annualaverage)
1,576 2,373
Employment (FTE, 2036-37) 1,822 3,195
Sectoral gross output ($m)
Agriculture 69.3 273.0 7 49
Mining 255.9 1,009.9 10 68
Manufacturing 1,890.0 2,473.8 119 194
Construction 4,582.5 5,797.6 427 613
Analysis of security of payment reform for the building and construction industry – addendum report | PBA models
31
$m’s FTEsSEQ Queensland SEQ Queensland
Trade* 1,696.2 2,166.1 258 389
Electricity, gas and water 369.2 512.7 17 29
Transport 689.7 923.4 68 113
Financial and businessservices**
3,268.9 3,823.6 364 466
Other services*** 2,275.1 2,878.4 305 452
Source: Deloitte Access EconomicsNotes:* includes retail, wholesale trade and accommodation and food services** includes financial and insurance services, communication services, and business services*** includes government related services such as public administration, education, health as well as other services andownership of dwellings
4.4 Implementation risks
We note that the total costs to head contractors calculated in the CBA modelling in this addendum report aresignificantly higher than those calculated in our previous report for the PBA option. The CBA modelling for thisaddendum report includes updated information, which has significantly increased the project numbers over theevaluation period when compared to the project numbers used for the CBA modelling in our previous report. Thisincrease in project numbers is the primary driver of the increased total cost to head contractors in this reportcompared to our previous report. Accordingly, the modelling in this addendum report is not directly comparableto our previous report.
In our previous report we suggested that some head contractors may experience financial viability issues as aresult of the loss of working capital under a PBA scheme. We noted that this could be more likely to apply tosmall or mid-tier head contractors that rely on front-loading progress payments and/or the working capitaladvantages of delaying payments to subcontractors. As discussed above the total cost to head contractors isgreater than that calculated in our previous report. However as the cost to head contractors on a per projectbasis has not increased significantly, our comments in section 6.4.1 of our previous report remain current. Wehave also considered whether there may be a disproportionate impact on smaller head contractors compared tolarge head contractors from the PBA scheme. The impact of a loss of working capital ultimately depends on howwell head contractors manage their finances and projects. There may be large head contractors that managethese poorly, and small head contractors that manage this well, and vice versa. Similarly the costs of compliancewith a PBA scheme are driven by project numbers and how efficient head contractors are in managing theprocess. There may be large head contractors that undertake large volumes of projects and manage the PBAcompliance process poorly, and there may be smaller head contractors that undertake fewer projects andmanage the PBA compliance process well. Although we have not undertaken a qualitative analysis of theseissues, our experience suggests that costs and therefore impacts are driven by how effectively and efficiently abusiness is managed.

Analysis of security of payment reform for the building and construction industry – addendum report | Residential building and construction
32
5 Residential building andconstruction5.1 Background
We have been asked to provide a high level qualitative review of the likely effects of introducing a PBA scheme onresidential building and construction projects. There are three broader groups within the residential constructionsector which should be considered.
Group 1: Government related residential projects with a value over $1mGroup 2: Private multiple dwelling projects with a value over $1mGroup 3: Private single residential projects with a value over $1m.
Group 1 and Group 2 share very similar characteristics in terms of likely level of sophistication and expertise ofboth principals and contractors. We understand from discussions with the Department that the introduction of aPBA scheme for projects commissioned by Group 1 and 2 would mirror the characteristics of the PBA schemediscussed earlier in this report. The reason for this is that these projects are essentially commercial in nature,with a similar structure and sophistication as commercial building and construction projects. Accordingly, thecosts and benefits discussed in Section 4 of this report would apply in a similar manner to stakeholders engagedin projects commissioned by Group 1 and 2. A net benefit would be expected from the introduction of a PBAscheme on the same basis as our analysis of the introduction of PBA scheme for commercial projects.
This is not the case for projects commissioned by Group 3. Principals in this group are usually individuals (“mumand dad” owners) who are commissioning a single dwelling residential build. We understand that it is not theDepartment’s intention that this group is captured in the PBA scheme. It is unlikely that there would be a netbenefit in including these projects in a PBA scheme given the increased administrative burden that will beimposed on individuals, which will not be spread across multiple projects given the single project nature of thework. In addition the majority of these projects would not involve a superintendent or quantity surveyorproviding an independent check of the builders’ claims. Although the $1m threshold should exclude the majorityof the single dwelling construction projects (ABS data suggests that the average single dwelling constructionworks is around $0.3m-$0.5m in value), it still may unintentionally capture some construction works on high-value residential properties. Therefore a specific exclusion may need to be included in in the PBA schemelegislation.
5.1.1 Single dwelling residential builds
Consultation feedback to the Department suggested there are concerns regarding non-payment and delayedpayment in the single dwelling residential construction sector. As discussed above, a PBA scheme similar toModels 1 and 2 considered for commercial and multiple dwelling residential projects may not be cost-effective forthe single dwelling residential construction sector. An alternative to imposing a PBA solution dependent on projectsize could be to instead impose the requirement on builders who have a certain level of turnover, in line with thebands used for licensing requirements. This could extend security of payment measures to larger builders whoundertake a significant number of projects, but are contracting with individuals.
Another alternative to the PBA models currently being considered could be a centralised trust account operatedby an independent body. This could operate in a similar manner to the RTA rental bond account model, but wouldbe on a far larger scale if covering all progress payments and retentions. It would involve owners (or theirfinanciers) making progress payments into the centrally administered account, with builders and theirsubcontractors lodging their claim to the funds at the same time. There could be a period of say 2 business daysfor parties to object to the amounts being released, after which time the funds are paid. This may increase thetransparency of the process, although it would significantly increase the administrative resources required for the

Analysis of security of payment reform for the building and construction industry – addendum report | Residential building and construction
33
Government body administering the scheme and impose additional administration costs on builders andSubcontractors.
It is important to note that the above suggestions have not yet been subject to an evaluation process and inorder to put forward a viable potential solution, further analysis and evaluation would need to be conducted tounderstand potential costs and benefits.
5.2 Stakeholder costs and benefits
5.2.1 Background
Although we have been asked to provide a high level qualitative review of the likely effects of introducing a PBAscheme on residential building and construction projects, in order to provide a sense of scale of the potentialimpact we have analysed ABS data from FY12 to FY16 to compare the residential construction sector against thecommercial construction sector. Over the period the value of residential construction averaged $11bn per annumcompared to $6.8bn per annum for non-residential construction. However, removing the value of residentialhouse construction and additions, alterations and conversions (as projects in these categories are not intended tobe captured by the PBA scheme) provides an average per annum value of $4.1bn for “other residential”construction work.
Accordingly this high level comparison suggests the non-residential (i.e. commercial) sector is approximately 1.65times larger than the residential construction sector that is intended to be covered by the PBA scheme. Thisanalysis is limited however, as the data does not include project numbers and does not separate projects above$1m from those below that amount.
5.2.2 Benefits and costs to Government and private sector principals
Benefits
The assumed reduction in project costs discussed in Sections 3 and 4 of this report are likely to apply in a similarmanner and to a similar extent if applied to Government and private sector multiple unit residential constructionprojects over $1m.
Costs
As in the commercial stream, the major costs will be initial implementation costs including consulting, legal andeducation costs, and ongoing compliance costs which will largely consist of ongoing administrative costs involvedwith a PBA scheme. The ongoing costs to Government and private principals would be greater under the proposedmodel 1 and lower under model 2.
5.2.3 Benefits and costs to Head Contractors
Benefits: Potential savings in project procurement costs (for Government and private sectorprincipals)
Costs: Initial implementation cost, ongoing administration costs
Benefits: Interest earned on retention funds held in PBA, reduced costs from payment disputes
Costs: Reduced working capital, cost of ongoing compliance

Analysis of security of payment reform for the building and construction industry – addendum report | Residential building and construction
34
Benefits
As outlined previously in Section 4, the benefits to Head Contractors are likely to be minimal and derived frominterest earned on retentions held in the PBA, as well as a potential reduction in payment disputes and costsassociated with these.
Costs
The costs applicable to Head Contractors would be similar to those on commercial construction projects, i.e.reduced working capital from loss of access to both retention monies and progress payments relating tosubcontractors and ongoing compliance costs relating to the administration of the PBA. These costs would behigher under model 2 compared to model 1. We expect there will be some level of duplication of effort betweenHead Contractors and Principals under model 1 (for example both parties will need to perform checks ofSubcontractor details).
5.2.4 Benefits and costs to subcontractors
Benefits
As outlined previously under the commercial PBA scheme, the benefits to subcontractors are improved workingcapital from progress payments being made on time, and reduced costs from payment disputes. These benefitswould be similar under both Model 1 and Model 2.
Costs
The only costs of note that subcontractors will likely face under such a PBA scheme is the ongoing costs ofcompliance with PBA commitments. These costs would be similar under both Model 1 and Model 2.
Benefits: Improved working capital, reduced costs from payment disputes
Costs: Costs of ongoing compliance

Analysis of security of payment reform for the building and construction industry – addendum report | Scope and limitations of our work
35
6 Scope and limitations of ourworkScope
We have been engaged to provide modelling and financial advisory services to assist in the modelling andanalysis of proposed security of payment reforms for Queensland. We have not provided legal advice regardingany aspect of the proposed reforms. Our services do not include the provision of advice regarding taxation oraccounting issues. This in an addendum report which should be read in conjunction with our previous report.
Limitations
As is usual with our work, our analysis has been restricted by the time and information available. In particular,we have made a number of assumptions in our report which, where possible, are based on information providedby the Department, publicly available research reports or other information, or our own professional judgement.We have set out significant assumptions and the rationale behind these in our report. If these assumptions wereto change, the analysis and conclusions in this report may be different.
The majority of our analysis relates to future events, and actual costs and benefits may be affected by thestructure and implementation process of any reform, as well as unforeseen economic or other events occurringafter the date of this report. Achievement of the forecast benefits to a large extent relies on the effectiveness ofthe Government in implementing the proposed reforms and enforcing compliance with the reforms.
General use restriction
This report is prepared solely for the use of the Department of Housing and Public Works. This report is notintended to and should not be used or relied upon by anyone else and we accept no duty of care to any otherperson or entity. The report has been prepared for the purpose set out in our contract dated 22 June 2017. Youshould not refer to or use our name or the advice for any other purpose.

36
Deloitte Access Economics is Australia’s pre-eminent economicsadvisory practice and a member of Deloitte's global economics group.For more information, please visit our websitewww.deloitteaccesseconomics.com.au
About DeloitteDeloitte refers to one or more of Deloitte Touche Tohmatsu Limited, aUK private company limited by guarantee, and its network of memberfirms, each of which is a legally separate and independent entity. Pleasesee www.deloitte.com/au/about for a detailed description of the legalstructure of Deloitte Touche Tohmatsu Limited and its member firms.Deloitte provides audit, tax, consulting, and financial advisory services topublic and private clients spanning multiple industries. With a globallyconnected network of member firms in more than 150 countries, Deloittebrings world-class capabilities and deep local expertise to help clientssucceed wherever they operate. Deloitte's approximately 200,000professionals are committed to becoming the standard of excellence.
About Deloitte AustraliaIn Australia, the member firm is the Australian partnership of DeloitteTouche Tohmatsu. As one of Australia’s leading professional servicesfirms. Deloitte Touche Tohmatsu and its affiliates provide audit, tax,consulting, and financial advisory services through approximately 6,000people across the country. Focused on the creation of value and growth,and known as an employer of choice for innovative human resourcesprograms, we are dedicated to helping our clients and our people excel.For more information, please visit our web site at www.deloitte.com.au.
Liability limited by a scheme approved under Professional StandardsLegislation.
© 2017 Deloitte Access Economics Pty Ltd
Deloitte Access Economics Pty LtdACN 149 633 116
Riverside CentreLevel 25123 Eagle StreetBrisbane QLD 4000GPO Box 1463Brisbane QLD 4001 Australia
Tel: +61 7 3308 7000Fax: +61 7 3308 3002www.deloitte.com.au