Embed Size (px)
Citation preview
MoodScope: Building a Mood Sensor from Smartphone Usage Patterns
Robert LiKamWa†‡, Yunxin Liu‡, Nicholas D. Lane‡, Lin Zhong†
†Rice University, Houston, TX ‡Microsoft Research Asia, Beijing, China
ABSTRACT We report a first-of-its-kind smartphone software system, MoodScope, which infers the mood of its user based on how the smartphone is used. Compared to smartphone sensors that measure acceleration, light, and other physical properties, MoodScope is a “sensor” that measures the mental state of the user and provides mood as an important input to context-aware computing.
We run a formative statistical mood study with smartphone-logged data collected from 32 participants over two months. Through the study, we find that by analyzing communication histo-ry and application usage patterns, we can statistically infer a user’s daily mood average with an initial accuracy of 66%, which gradu-ally improves to an accuracy of 93% after a two-month personal-ized training period. Motivated by these results, we build a service, MoodScope, which analyzes usage history to act as a sensor of the user’s mood. We provide a MoodScope API for developers to use our system to create mood-enabled applications. We further create and deploy a mood-sharing social application.
Categories and Subject Descriptors H.1.2 [Models and Principles]: User/Machine Systems - human factors; J.4 [Social and Behavioral Sciences] – Psychology; I.5.2 [Pattern Recognition] – Design Methodology - Classifier design and evaluation, Feature evaluation and selection, Pattern analysis.
General Terms
Design, Experimentation, Human Factors. Keywords Smartphone usage; mood; machine learning; affective computing; mobile systems
1. Introduction Mood is an affective state that plays a significant role in our lives, influencing our behavior, driving social communication, and shift-ing our consumer preferences. But in the digital realm of mobile
devices, there is a distinct lack of knowledge about mood unless manually provided. While devices have many sensors to under-stand the physical world around them, they are unable to develop insight about the object that matters the most: the user. We consid-er the implementation of a mood sensor as a vital next step in en-hancing the context-awareness of mobile devices.
There are numerous ways to employ mood information. Video and music recommender systems such as Netflix or Spotify would benefit from using mood as an input to their recommendation algo-rithms. By knowing the user’s mood and building preferences based on previously selected items, these providers could recom-mend different media to match the user’s current mood. While the system can ask the user to supply their mood, an automatic mood sensor will significantly improve the system’s usability.
More importantly, mood sensing can build an interesting digital social ecosystem as users’ devices automatically share their moods with close friends and family. Privacy concerns aside, these moods would enhance social networks by allowing users to share mood states automatically. Users would be able to know better how and when to communicate with others. For example, parents of a son in a bad mood could decide to call to cheer him up. When text mes-saging an upset boss, a user could be cautious of speaking brashly. Mood sensing can enable users to digitally communicate closer to the way they would in real life. For mood sharing, an automatic mood sensor will not only improve the usability but also more importantly, lower the social barrier for a user to share their mood: we do not directly tell others our mood very often, but we do not try to conceal our mood very often either.
To enable these scenarios, we consider a system that recognizes users’ mood from their smartphone usage patterns. We call the system MoodScope for its ability to peer into usage data and infer a user’s mood. Common observations inspire our approach. Our smartphones have rich information about us: where we have been, with whom we communicate, what applications we use, and even more. Furthermore, people use their smartphone differently when they are in different mood states. MoodScope attempts to leverage these patterns by learning about its user and associating smartphone usage patterns with certain moods.
MoodScope’s approach is not invasive to users; it does not re-quire users to carry any extra hardware sensors or rely on the use of the microphone or camera. Instead, MoodScope passively runs in the background, monitoring traces of users’ smartphone usage. Because of this, MoodScope is also lightweight and power effi-cient; it does not rely on computationally intensive or power ex-pensive data processing of video, audio or physiological signals. Furthermore, MoodScope works with the general patterns of smartphone usage, making it application-independent. Consequent-
Permission to make digital or hard copies of all or part of this work for personal or classroom use is granted without fee provided that copies are not made or distributed for profit or commercial advantage and that copies bear this notice and the full citation on the first page. To copy otherwise, to republish, to post on servers or to redistribute to lists, requires prior specific permission and/or a fee. MobiSys’13, June 25–28, 2013, Taipei, Taiwan. Copyright 2013 ACM 978-1-4503-1672-9/13/06...$15.00.

ly, MoodScope is easy to deploy on existing smartphones without any modification to the OS and applications.
To validate the approach of MoodScope, we conducted user studies with 32 participants. We carried out focus group discus-sions to learn how mood plays a role in device interactions, and finished a two-month field study to collect daily smartphone usage logs and self-reported mood data from the participants. Based on the collected users’ data, we build statistical mood models to infer the participants’ mood states from their smartphone usage patterns.
In this paper, we find that smartphone usage correlates well with our users’ moods. Users use different applications and communi-cate with different people depending on their mood. Using only six pieces of usage information, namely, SMS, email, phone call, ap-plication usage, web browsing, and location, we can build statisti-cal usage models to estimate mood.
We build a general mood model to infer all participants’ daily-average mood with 66% accuracy. However, when we personalize the system, building and testing a model only on a single partici-pant’s data, we report 93% accuracy on average after two months of training. This result suggests that a mood inference classifier should be trained on personal data. We also use a hybrid model that allows a user to gradually incorporate their personal data with a model instantiated from others’ training data. This allows the model to attain higher accuracies faster than by using personalized models alone. After only 10 days of personal training, while per-sonalized model training only performs with 40% accuracy, the hybrid model performs with 72% accuracy.
We provide an implementation of MoodScope as a system back-ground service on both iPhone and Android and describe an API to be used by mood-enabled applications. We also develop an exam-ple of such an applications to show how to provide mood-sharing services. Our implementation operates with only 3.5 milliWatt-hours over a day, which roughly equates to 20 minutes of lost standby time and does not affect the performance of other applica-tions.
Overall, our experience suggests that it is possible to build a mood sensor from smartphone usage patterns. Our main contribu-tions of this paper are as follows:
• We demonstrate the feasibility of inferring mood from
smartphone usage, paving the way for energy-efficient, priva-cy-preserving systems that automatically infer user mood. Validated with a two-month dataset collected from 32 users, our system, MoodScope, estimates users’ daily mood averag-es with an accuracy of 66% which gradually grows to 93% over two months of training.
• The data from 32 users also allows us to make novel discover-ies regarding mood and mood inference: We show that how mood affects smartphone usage is personal; a general model performs significantly worse than personalized models. We show that categorized application usage and phone calls are strong indicators of mood for our participants.
• We design a user-friendly mood journaling tool to effectively collect user mood data. Beyond data collection, it provides useful functions for users to review their mood history and thus encourages them to provide accurate ground truth.
• We describe a lightweight, power-efficient, and easy-to-deploy realization of MoodScope, consuming only 3.5 milli-Watt-hours over a day. We also include an API for developers
to interface with mood, which we use to develop and deploy a sample mood-sharing application.
The rest of the paper is organized as follows. In Section 2, we provide background on how mood is measured in psychology re-search and describe motivational applications. In Section 3, we survey the related work. In Section 4, we describe and evaluate our user studies and how we collect field data. In Section 5, we present the design of MoodScope and how we build mood models for us-ers. We demonstrate how to build a mood inference engine and provide a mood API in Section 6 and showcase a mood-based application in Section 7. We discuss limitations of the paper and future work in Section 8 and conclude in Section 9.
2. Background and Motivational Applications In this section, we provide background regarding how mood is measured in psychology research and describe motivational appli-cations that can be enabled or enhanced by inferring the mental state of a human user.
2.1 The Science of Mood Mood is an affective state and has been extensively studied in psy-chology [2, 31]. Mood is related but different from another im-portant affective state, emotion, in several important aspects [31]. First, mood is typically less intensely felt by an individual and tends to last longer than emotion, e.g., persisting for days or hours instead of minutes or seconds. Second, mood is normally a reaction to a cumulative sequence of events while emotion is a more spon-taneous reaction or feeling caused by a specific event. Finally, mood is more internal, while emotion is more visible to others. Due to its long-lasting and private nature, mood reflects the under-lying feelings of people.
Psychology research has proposed and extensively validated sev-eral models to describe and measure affect. For our goal, we have considered three popular approaches, described below, and eventu-ally employ the Circumplex mood model [1].
The Circumplex mood model employs a small number of dimen-sions to describe and measure mood. As shown in Figure 1, the model consists of two dimensions: the pleasure dimension and the activeness dimension. The pleasure dimension measures how posi-tive or negative one feels. The activeness dimension measures whether one is likely to take an action under the mood state, from active to passive. As demonstrated in [1], users are able to accu-rately and consistently place discrete affects in the two-
Figure 1: The circumplex mood model
Pleasure
Activeness
Excited Tense
Calm
Relaxed
Happy
Stressed
Upset
Bored

dimensional space. The Circumplex model has also been well vali-dated and widely used in other studies [5-9].
Another common approach to describe affect is through the use of discrete categories [3, 4]. For example, a very popular example is Ekman’s six basic categories: happiness, sadness, fear, anger, disgust, and surprise [3]. This approach is intuitive and matches people’s daily experience well. However, basic categories fail to cover a full range of people’s affect displays and it is hard to de-cide on a common set of independent discrete mood categories. It is also difficult to quantify affect with discrete categories.
Yet another approach used in psychology is the Positive and Negative Affect Schedule (PANAS) [10, 11] model. The PANAS model is based on the idea that it is possible to feel good and bad at the same time [12]. Thus, PANAS tracks positive and negative affect separately. To perform a measurement, the PANAS model uses a checklist to measure affect from various aspects. A typical checklist often consists of more than 20 items [10]. The PANAS model’s complexity makes it difficult for participants to provide frequent mood inputs in field studies and in practical deployment.
We choose to utilize the Circumplex model because it is simple, quick to administer, and describes a wide range of mood states. This makes it suitable for our extensive field study, where the par-ticipants are asked to input their moods multiple times a day.
2.2 Motivational Applications Automatic mood sensing can enable various new applications and enhance many existing ones. Next we describe some example ap-plications that have motivated us to conduct the work of this paper.
Mood logger and browser. With automatic mood sensing, a new application can be built to log user moods and browse mood history. For example, users can view past mood states, filtered by location or time, e.g., daily, weekly, and monthly. This application could increase user awareness of mood changes and help users recall valuable moments in their life. Possible extensions of this application could allow users to understand the influence of vari-ous factors on their mood, detect abnormal mood states, and help improve mental health.
Mood sharing. Many users share their mood with friends via so-cial networks but need to manually input mood states. With mood sensing, one can build a mood sharing application to automatically share a user’s mood with friends. This application could convert mood states into a single sentence describing how users feel and automatically post single sentences on social networks, such as “I’m excited!” or “A bit upset today…”. Similarly, an instant mes-sage application or video-chat application could also allow users to passively share their mood during a chat or voice call conversation, e.g. through a colored icon.
Mood-enhanced applications. Many existing applications could be enhanced with mood as a context to provide personalized ser-vices. For example, music players could automatically create mood-based playlists for users, matching how they feel. Smartphones could change their theme, wallpaper or ringtone set-tings according to user mood. Web, image, and/or video search could filter results to best match the user’s current mood.
3. Related Work In this section we survey existing automated approaches for affect recognition. These methods are mostly sensor-based techniques, often relying on mining speech or facial expressions.
Recognizing emotions from voice and video. Existing work in affect recognition focuses primarily on the recognition of emotions [13, 14], and does so largely by leveraging the visual [15-17] and acoustic [18, 19] signals found in the speech, actions, and faces of people. While the authors sometimes use emotion and mood inter-changeably, they almost always measure transient affective states, not moods. For example, Mood Meter [32] detects smiles using campus video cameras. But momentary smiles tell us little about long-term mood states unless the larger temporal dynamics of such signals are considered. Moreover, the facial or spoken expressions of people may not reflect their true feelings due to professional or social reasons, e.g., to be polite. Finally, video and audio are not suited to the objectives of MoodScope due to the sensing and com-putational burden they place on a smartphone. Even monitoring and classifying audio alone can consume around 335 mW continu-ously, comparable to continuously sampling raw GPS data [40].
Alternative physiological signals. Physiological indicators offer a more direct signal of how we feel. For example, skin conduct-ance, heart rate, breath rate, blood pressure, and skin temperature all offer difficult-to-fake indications of our affective states. A vari-ety of prototypes have been developed that leverage such signals, e.g., [21-22]. The key limitation in this approach is that it requires additional hardware. This limits the range of applications to only those that users believe are high utility, such as medical applica-tions, to compensate for the burden.
Leveraging signals from smartphones. Smartphones offer a rich set of user signals that only recently are beginning to be ex-plored for affect recognition. For example, EmotionSense [23] proposes a complete end-to-end smartphone platform by perform-ing audio-based emotion recognition. However, to the best of our knowledge, no existing smartphone system leverages a broad set of features based on user/smartphone interaction to recognize affec-tive states. The most closely related systems to MoodScope thus far are [24, 33, 39]. The authors of [24] classify users emotions based on their typing characteristics. However, the relationships identified in the typing study have not been clearly validated as only a single user is studied. The authors of [33] use smartphone usage patterns to model personality. While we exploit the same source of data, MoodScope infers completely different user charac-teristics with different modeling challenges – unlike personality, which is constant for each user, moods change frequently. In [39], we present early results on inferring users’ mood from smartphone interactions. MoodScope goes significantly further in its method-ologies, realization, and evaluation.
The bulk of existing smartphone affect-related research uses the phone as a data collection tool. A variety of applications have been developed and released as part of large-scale projects to better understand affect in non-laboratory settings. For example, re-searchers in the UK are investigating user geospatial happiness with the “mappiness” application, released for Apple iPhones [25]. Another iPhone application, “gottaFeeling”, allows users to track and share their feeling to improve their relationships [26]. These and other emotion-related smartphone applications do not study automated mood or emotion inference. However, they do provide considerable motivation for MoodScope as they highlight the will-ingness and interest of the public to track and share their affective states.
Comparison to MoodScope. Rather than sampling new high-density signals and/or requiring additional equipment, MoodScope exploits pre-existing usage patterns of an individual. By avoiding invasive image and audio data we are able to design a mood recog-

nition engine on current smartphone OSes; this also allows us to run continuously in the background without compromising phone battery life.
4. User Study and Field Data Collection In order to distill the design requirements of MoodScope and to collect user data under realistic settings, we conducted a longitudi-nal user study with 32 jailbroken iPhone users from China and the USA. The user study consisted of one field study and two focus group discussions. The field study lasted more than two months in which we collected the users’ moods and their smartphone usage patterns. Two focus group discussions, before and after the study, were conducted to gain subjective insights.
4.1 Participants We recruited 32 participants for our user study. All are existing iPhone users. 24 of the users are college and graduate students but the rest covers a diverse set of occupations including two software engineers, one web editor, one salesman, and one teacher. They aged between 18 and 29 with 11 females. 25 of the participants were recruited in Beijing, China with advertisements on online forums. The remaining seven participants were recruited at a US university. Only the participants from Beijing took part in the two focus group discussions. Every participant was compensated with RMB500 or $75 USD and became eligible for an iPad 2 raffle after completion of the study.
4.2 Pre-Study Focus Group We designed a two-part pre-study focus group to gain motivation and intuition of automatic mood inference and to gather insight into what data we should collect from the phones. The first part dealt with the impact of mood changes on smartphone usage hab-its. To this end, we asked the participants whether they use differ-ent applications or communicate with different people depending on their mood.
The second part of the focus group asked for the participants’ opinions on mood sharing. We asked how they would publish their mood, with whom they would share their mood, when they would like others to see their mood, whose moods they would be interest-ed in seeing, how they would like their phone to automatically adapt to their mood, and how sharing mood would affect their life.
4.2.1 Results: Mood Changes/Mood Sharing Results from the pre-study focus group show that users believe that smartphone usage patterns change with mood changes. All but one
of the participants told us that they use different applications and/or communicate with different sets of people depending on their mood. They also reported several mood-driven smartphone usage changes that were not logged in our field study, such as al-tering ringtones and wallpapers. All but one of the participants indicated that they would like their smartphone to automatically change with their moods, e.g., changing the color scheme, reorder-ing the applications, and notifying them when their mood changes.
The focus group also showed that most of the participants thought that mood sharing would be valuable. All but one of the participants responded that they would like to publish their mood through micro-blogs, instant messenger, or other applications. All of the participants indicated that they would like to share their mood within certain social circles, e.g., friends or co-workers. All participants were interested in seeing others’ mood, particularly the mood of their friends. One participant even responded that he would like to know everyone’s mood, including the mood of strangers around him. Most participants mentioned that sharing mood would have very positive impacts on their lives, e.g., sharing happiness with friends or getting rid of bad moods with help from friends.
The results are highly motivational for automatic mood infer-ence, using usage data already available in smartphones. Because smartphone usage patterns fluctuate as mood changes, it should be feasible to infer users’ mood changes by observing their smartphone interaction patterns. The results also highlight that users do want to use their mood information in various ways, such as sharing mood with friends and changing smartphone settings based on mood. Therefore, it is valuable if our system can auto-matically infer users’ mood so that users do not need to manually share their mood or change the settings of their smartphone.
4.3 Field Study The field study collected real-world data from all 32 participants for over two months so that we could study the correlation between mood and smartphone interactions in order to build MoodScope. The study involves two pieces of custom developed software: a mood journaling application and a background logger.
4.3.1 Mood Journaling Application We developed an iPhone application that allows users to report their mood conveniently. Figure 2 shows the primary GUI of the Mood Journaling Application. Two input bars allow the user to set their mood along the previously described Circumplex pleasure and activeness dimensions. For sake of simplicity, each bar limits the users to one of five options; and to prevent confusion, we in-
Figure 3: Mood calendar application view
Figure 2: Mood journaling application view
Daily Mood Average
Month Selector
View Selector Single Day
Mood History
Interactive Bouncing Face
Star Achievement System
Input Slider
Happiness Selector Boxes
Activeness Selector Boxes
tentionally omit showing numbers. The bar is also intentionally unselected at the beginning so as to prevent users from over-selecting a default value. As the user inputs a mood, it is represent-ed as a bouncing cartoon face in the center of the screen. As the pleasure bar is changed, the facial expression and color of the face changes. As the activeness bar is changed, the speed of the bounc-ing movement changes. We allow users to see their previous inputs through a calendar mode, shown in Figure 3, and also through a chart mode. To minimize the influence of previous inputs on users’ mood, the input history is shown in a different GUI and not pro-vided to users when they input their mood.
Users are asked to input their mood at least four times a day, with at least three hours between each input. This is motivated with a star achievement system, which gives a user a star for an input if their last star was given more than three hours prior. The user can gather up to four stars per day and is notified through smartphone alerts when a star is available. This star system enables us to regu-larly capture a user’s self-reported mood.
4.3.2 Smartphone Interaction Logger We created a logger to collect a participant’s smartphone interac-tion to link with the collected moods. Our logger is based on the one reported in [27]; it captures user behavior by using daemons operating in the background, requiring no user interaction. The data is archived nightly to a server over a cell data or Wi-Fi con-nection.
Using this tool, we gather relevant information with the intention of creating feature tables for our mood models. Application usage, phone calls, email messages, SMSes, web browsing histories, and location changes are collected as user behavior features. We ensure that user privacy is properly protected, hashing all private user data, e.g., contact identifiers used in phone calls and SMSes.
4.4 Post-Study Focus Group After the field study, we conducted another focus group discussion with the Beijing participants to ask for their opinions regarding the usability and effectiveness of our mood journaling application. We asked them whether the application is easy to use, whether four mood inputs per day is too frequent, and how likely they immedi-ately input their mood upon receiving an input reminder.
In the focus group we received positive user feedback, which demonstrated the effectiveness of our field study in collecting us-ers’ daily mood data. Overall, participants found our mood jour-naling application to be user-friendly. All but one of the partici-pants told us that the mood journal application is easy to use. The
other participant had suffered a bug of our application, which we fixed once it was reported. Users felt that the mood journaling application imposed very little burden and felt they were able to provide accurate and timely mood data. Only three of the partici-pants reported that prompting for four mood inputs per day was too frequent. Two of them explained that their mood didn’t change quickly and preferred fewer inputs per day. These participants suggested other approaches, such as inputting mood only when the system thinks the mood has changed. All but one of the partici-pants stated that they entered their mood immediately after receiv-ing a reminder at least 50% of the time. The main reasons for non-immediate inputs were that the participants were busy or that it was not convenient to input their mood when they received a re-minder.
We observed one significant limitation of our mood journaling application. Some participants reported that entering mood with our system could not cover their affective changes; sometimes their affective state could change faster than every three hours. While we realized that some users might occasionally have such rapid affective changes, we chose the three-hour mood input inter-val because our primary focuses were to minimize participant bur-den of entry and capture long-lasting mood states. From the focus group consensus, our mood journaling tool was highly effective at achieving these specific goals.
4.5 Characteristics of User Mood Entries Although the user response to our mood journaling system was highly positive, we wanted to quantitatively understand the user response to our mood journaling system. This would further prove the effectiveness of our collection as well as motivate the design of our mood modeling. We investigate various aspects of the self-reported mood system, including the response rate of the users and the distribution of the moods entered.
As shown in the user interface of Figure 2, users indicate their mood states with two five-level scores representing the two mood dimensions. For the pleasure dimension, scores of 1-5 indicate very displeased (P1), displeased (P2), neutral (P3), pleased (P4), and very pleased (P5). For the activeness dimension, scores of 1-5 indicate very inactive (A1), inactive (A2), neutral (A3), active (A4), and very active (A5).
Although our participants are from two very different countries, we do not observe any culture difference among their mood entries and smartphone usage data. Thus, unless otherwise stated, we pre-sent the aggregated results from all the participants in this paper.
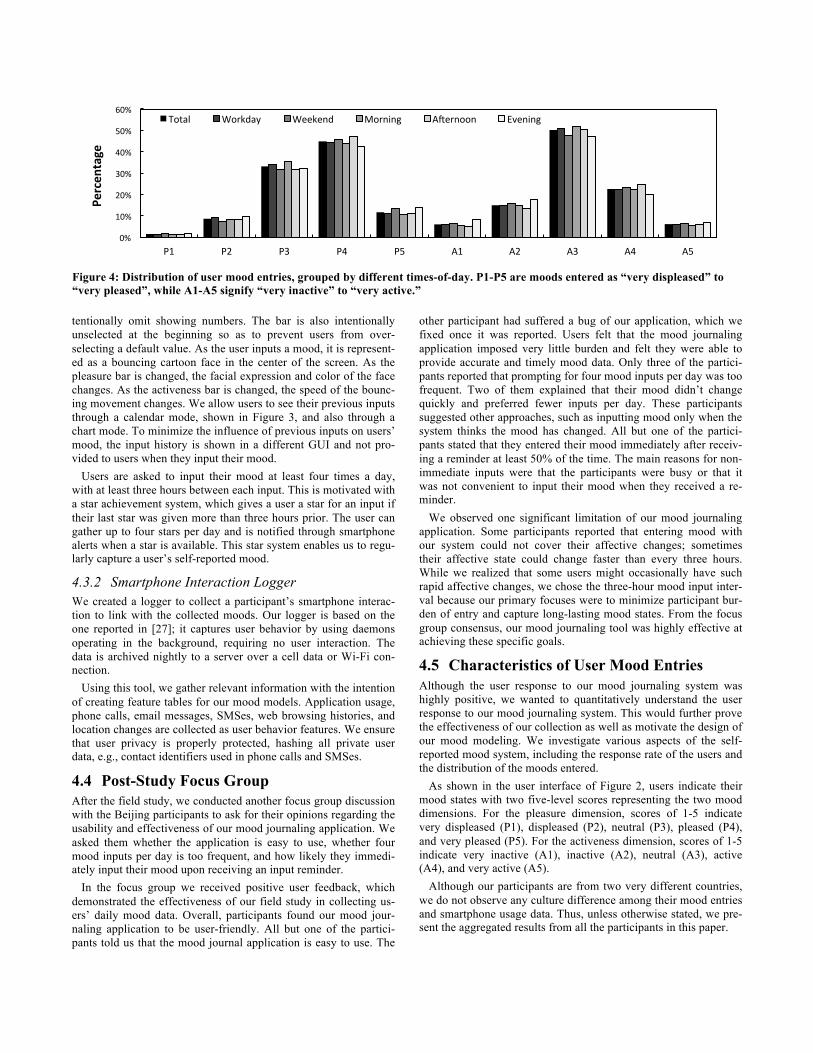
Figure 4: Distribution of user mood entries, grouped by different times-of-day. P1-P5 are moods entered as “very displeased” to “very pleased”, while A1-A5 signify “very inactive” to “very active.”
0%
10%
20%
30%
40%
50%
60%
P1 P2 P3 P4 P5 A1 A2 A3 A4 A5
Percen
tage
Total Workday Weekend Morning A;ernoon Evening

Table 1: Feature table of usage histograms (and previous mood averages)
Data Type Histogram by: Dimensions
Email contacts # Messages 10 # Characters 10
SMS contacts # Messages 10 # Characters 10
Phone call contacts # Calls 10 Call Duration 10
Website domains # Visits 10 Location Clusters # Visits 10
Apps # App launches 10 App Duration 10
Categories of Apps # App launches 12 App Duration 12
Previous 2 Pleasure and Activeness Averages N/A 4
4.5.1 Response Rate We first calculated the response rate of the overall mood input, confirming the reliability of user input into our journaling system. Although we asked users to enter their mood four times a day, we expected some absence of mood entry due to the extensive nature of our study. We calculated the daily response rate of our users and found that over all of the user’s days, 6.6% had only one mood entry, 8.2% had two entries, 10.2% had three entries, and 75% had four or more entries. We consider this response rate to be accepta-ble for our study. This again demonstrates the effectiveness of our mood journaling application.
4.5.2 Daily Mood Persistence We next study the persistence of daily user mood to validate the background research in Section 2, which defines mood as a slowly changing affect. We consider the standard deviation of a user’s mood entries within each day of our dataset. The average standard deviation of 0.41 within a single day supports the existence of an underlying mood, as it indicates that the mood typically does not heavily waver between any two adjacent mood levels. That said, we found the maximum standard deviation within a day to be 1.73, indicating that there are days when large mood swings do occur. For the most part, however, our persistence finding is consistent with the background psychology research that states that mood is fairly constant and slow-to-change.
4.5.3 Mood Distribution We also analyze the distribution of moods that users enter into the system to analyze the variation our system would be challenged with estimating. As we expected, neutral mood states (P3 and A3) occupy a significant percentage of our dataset. 33.2% of mood entries reported neutral pleasure (P3), and 50.2% of the mood en-tries are neutral activeness (A3). Users were generally happy rather than sad. 44.8% of the total mood entries are pleased (P4) and 11.7% of total mood entries are very pleased (P5), while only 8.7% and 1.6% of the total mood entries are displeased (P2) and very displeased (P1).
When considering mood as a two-dimensional vector with 25 possible values, i.e., (P#, A#), we find that a plurality of 25.6% of reported moods are neutral at (P3, A3). The next two most com-mon moods are (P4, A3), and (P4, A4) at 18.5% and 13.9% respec-tively. It was approximately twice as common for pleasure and activeness to be positively correlated; (P4-5, A4-5) and (P1-2, A1-2) occurred 20.1% and 4.4% of the time, while (P4-5, A1-2) and (P1-2, A4-5) occurred 8.3% and 2.4% of the time respectively.
The mood distributions were fairly consistent during different times, seemingly unaffected by whether the entry was during workdays, weekends, mornings, afternoons or evenings. Users were slightly happier during the weekend than on workdays. The full distribution of moods is presented in Figure 4. The response rate, mood persistence, and distribution of the entered moods show MoodScope’s efficacy in collecting a wide variety of moods from the users, and provide insight into the design of MoodScope.
4.6 Smartphone Usage Data In total we have collected 15,683 phone calls, 36,989 SMSes, 13,476 emails, 142,633 instances of application usage, 27,411 Web visits, and 1,146 unique clustered location records from all the participants. 1,678 unique applications were used during the whole field study. We use these smartphone usage data and the self-reported mood entries to train mood models in MoodScope.
5. The Design of MoodScope Models The crux of MoodScope is in its ability to estimate a user’s mood, which we discuss in this section. The data collected from the field study and analysis results presented in Section 3 provide a founda-tion for us to explore the design of MoodScope’s models. We use various supervised machine learning techniques to investigate how a user’s mood can be inferred from usage log analysis. We discuss the construction of daily mood samples and a usage log feature table. We then construct and evaluate various mood inference models from our collected mood journals and usage logs.
5.1 Daily Averages as MoodScope Output As explained in Section 2, we wish to estimate mood as an under-lying affect, changing slowly over long periods of times. Thus, rather than directly using single mood inputs, we first separate the mood inputs into their two dimensions and average all inputs in a
(a) Pleasure averages and estimations
(b) Activeness averages and estimations
Figure 5: Daily mood averages and model estimations
1
2
3
4
5
0 10 20 30 40 50 60
Daily M
ood
Days
Mood (Pleasure) EsBmated Mood
1
2
3
4
5
0 10 20 30 40 50 60
Daily M
ood
Days
Mood (AcBveness) EsBmated Mood

calendar day. The resulting average moods for each of the sixty days of training act as sixty pairs of labels for our mood model.
These daily mood averages, if predictable, can serve a number of purposes. In addition to simply indicating the current mood of a user, a trend of sliding daily mood averages can indicate when a user’s mood is shifting from normal. A robust estimation of daily mood averages serves as the output of MoodScope’s Mood Infer-ence Engine.
5.2 Usage Records as MoodScope Input We build MoodScope’s inference feature table on the usage rec-ords collected by our logger. Literature suggests that mood is strongly correlated with the social interactions [28] and daily activ-ities [29] of an individual. In our feature table, we focus on these two categories of mood-sensitive behavior: social interaction and routine activity. Our collected data allows us to indirectly observe these patterns through a variety of social interaction and routine activity relative frequency histograms.
5.2.1 Social Interaction Records Collectively, phone calls, text messages (SMS) and emails signal changes in social interactions. We treat these three types of data separately, but identically, counting the number of exchanges the user has with their ten most frequently interacted contacts. For each day, we form a histogram of the exchanges over a 3-day his-
tory window and use the normalized frequency count as samples in the feature table. In addition to counting the number of exchanges, we also use the length of time of phone calls and number of words used in text messages and emails to form an additional histogram for each data type. Thus, we create 6 social interaction 10-dimensional histograms in the feature table.
5.2.2 Routine Activity Records Similarly, we use patterns in browser history, application usage and location history as coarse indicators of routine activity. Appli-cations are monitored based on the usage of the ten most frequent-ly used applications, while browser activities are grouped by unique URL domains. We cluster our time-series of location esti-mates using the DBSCAN [30] clustering algorithm, which allows us to count user visits to each approximate location. We form three-day normalized histograms for the top ten used applications, website domains, and location clusters on the frequency of usage/ visitation. We also form histograms based on the duration of time an application was used. These four routine activity histograms are each entered as 10-dimensional vectors in the feature table.
We also group applications by type, categorizing them as one of {Built-in, Communication, Entertainment, Finance, Game, Office, Social, Travel, Utilities, Weather, Other, or “cannot categorize”}. This allows us to use a larger set of applications, as many users will use applications beyond their top ten. To label the applications
Figure 7: Cumulative distribution functions of Mean Squared Error of pleasure and activeness in both the personalized (1-User) and generalized (All-User) models
Figure 8: Decrease of Mean Squared Error of pleasure model as features are added. Each line represents a different user. A user’s line ends when SFS terminates.
(a) Squared error for pleasure model training (b) Squared error for activeness model training
Figure 6: Distributions of squared error in training. Each stack represents a user’s percentile distribution of errors.
0
0.2
0.4
0.6
0.8
1
0 0.2 0.4 0.6 0.8 1
CDF Prop
or5o
n
Mean Squared Error
1-‐User AcBve
1-‐User Pleasure
All-‐User AcBve
All-‐User Pleasure 0
0.1
0.2
0.3
0.4
0.5
0.6
0.7
0.8
1 6 11 16 21 26 31
Mean Squa
red Error
Number of Features Used
0.0001
0.001
0.01
0.1
1
Squa
red Error 90%ile
75%ile
50%ile
25%ile
10%ile
0.0001
0.001
0.01
0.1
1
Squa
red Error
90%ile
75%ile
50%ile
25%ile
10%ile

in our dataset, we executed a categorization task on Amazon Me-chanical Turk. We create two application histograms grouped by the 12 categories; one histogram is a normalized count of catego-rized application usage instances, while the other is the proportion of time spent in applications of a specific category. These become 12-dimensional vectors in the feature table.
We also add a time-series component to our feature set by in-cluding the two most recent pleasure-activeness pairs of previous mood averages as features. With 6 social interaction histograms, 6 routine activity histograms, and 2 pairs of time-series components, our initial feature table has a total of 128 dimensions, as shown in Table 1.
5.3 Internal Model of MoodScope With our daily mood averages as labels and usage records as a feature table, we apply a regression algorithm to our data on each dimension of mood to discern an inference model. We also use Sequential Forward Selection (SFS) to choose relevant features, reducing the dimensionality of our feature table. We evaluate the performance of our training of personalized mood models and a one-size-fits-all mood model on each dimension of mood. Unless otherwise indicated, our results are listed for the pleasure dimension. In all cases, model training for the activeness dimension is done identically, and performs similarly, within 1% of the pleasure model training.
5.3.1 Multi-Linear Regression Because the daily averages of mood are non-integer numerical values, performing a regression along each mood dimension is a natural choice. In particular, we use a least-squares multiple linear regression to perform the modeling. This form of analysis requires no additional preparation for our data; we simply apply the regres-sion to our usage feature table, labeled by the daily averages of mood.
A cross-validation of our regression assesses the robustness of the algorithm. Because we only have 60 samples per user, we use Leave-One-Out-Cross-Validation (LOOCV). LOOCV trains the model on all but one of the samples and validates the model on the remaining sample. As a result, each sample from the original data set is used for validation once. During any iteration of LOOCV, the cross-validation trains the model on 59 samples, allowing for robust model training on our study’s small dataset.
5.3.2 Sequential Forward Selection of Features Because of the large dimensionality of features compared to the number of samples, we choose a subset of relevant features to ac-celerate the learning process. For this task, we use Sequential For-ward Selection (SFS) [36].
In SFS, our system attempts to pick a subset Y of the feature ta-ble that will give the best regression. In the SFS algorithm, Y starts out as an empty set. SFS then iterates, finding the feature x which is not already in Y that provides the best fit to the data, minimizing the mean error of the fit. It then adds x to Y and continues to iter-ate. SFS will stop running when it reaches a local minimum; at this point, adding any of the remaining features will increase the error. Through this process, SFS appropriately selects the data’s most representative features, reducing the dimensionality of our table.
5.3.3 Personalized Mood Model We create a personalized model for each user by performing multi-linear regression on each user’s data individually. Using individu-
alized multi-linear regression to train the pleasure dimension of the models, we report an average mean squared error (MSE) of 0.075 across all users, with a standard deviation of 0.050, a minimum MSE of 0.002, and a maximum MSE of 0.176. We received simi-lar numbers when training the activeness dimension: 0.085, 0.062, 0.001, and 0.215 respectively. The standard deviation reveals that mood modeling works better for some users than others, but the MSE numbers are low enough to suggest that mood can be accu-rately inferred from smartphone interactions in our dataset; it takes a squared error of 0.25 to move from the center of one mood label halfway towards another label. On average, 93.1% of the daily pleasure averages and 92.7% of the activeness averages have a squared error under 0.25. The distribution of error for each user is shown in Figure 6. The CDFs in Figure 7 show the distribution of mean-squared-error across all users.
On average, SFS chose 16.3 features per user. Some users used as few as 5 features, while others used 32 features to strengthen the model. Figure 8 shows how SFS improves the robustness of our algorithm as it adds more features.
5.3.4 All-User Mood Model While personalized models report high accuracy, they require indi-vidual training over a long period of time. We attempt to reduce the amount of training required by the training by forming a “one-size-fits-all” mood model created from an aggregate of all of the users’ data. If successful, this model can be used as an initial mod-el for a new user, bootstrapping the training procedure.
To test the feasibility of an all-user mood model, we remove a user’s data from our dataset and perform a multi-linear regression on the remaining data to create a model. We then apply the model to the user’s data and compute the mean-squared-error of the com-puted mood.
After training, we found that the general model performed sur-prisingly well for some users. On pleasure model training the min-imum mean-squared-error across our users is 0.069. However, for many users, the mean-squared-error is quite high, as our dataset had an average mean-squared-error of 0.296, with standard devia-tion of 0.175. The maximum mean-squared-error from our dataset is 0.79. On average, only 66% of pleasure estimates are off by less than 0.25 squared-error. Activeness estimation performs similarly, with average mean-squared error of 0.289. 67% of activeness esti-mates are off by less than 0.25 squared-error. The CDFs in Figure 7 show the distribution of accuracy across all users.
Figure 9: Pleasure training accuracy vs. training data size
0%
20%
40%
60%
80%
100%
10 20 30 40 50 59
Mod
el Accuracy
Training Days
Using personal data only
StarBng from all-‐user model
Accuracy of personalized model
Accuracy of all-‐user model

Table 2: Strawman model performance comparison
Model Pleas. MSE
Pleas. Acc.
Activ. MSE
Activ. Acc
Model A: average mood 0.242 73% 0.229 74% Model B: slow-varying mood 0.354 61% 0.318 65% Model C: no phone features 0.258 70% 0.277 71% All-user Model 0.296 66% 0.289 67% Personalized Model 0.075 93% 0.085 93%
5.3.5 Hybrid Mood Model Approaches An ideal mood model would blend together the respective strengths of the personalized (high accuracy) and all-user (no user training) modeling approaches. We investigate hybrid mood model design choices that combine a small amount of user-specific train-ing data with larger amounts of training data collected from the general user population. To test a hybrid approach, we fit a multi-linear regression model with a modified objective function that prioritizes reducing residual errors related to personalized training data above errors related to training data sourced from the rest of the population. As a result, the hybrid model is able to incorporate unique characteristics in how an individual user's smartphone data relate to their mood while also capturing the coarse-grain patterns that are common across all people. Through our experiments we find the accuracy of the hybrid model is naturally sensitive to the weighting, i.e., prioritization, placed on personalized data residual errors relative to data from the general population; we determine this weighting term empirically by per forming a conventional grid parameter search that minimizes MSE error.
Figure 9 examines the MSE accuracy of our hybrid model when incrementally trained with increasing amounts of user-specific training data. In this figure, we compare the hybrid approach with user training data to an incrementally trained personalized model with no prior training data. We also represent the accuracy of the all-user model (66%) and personalized model (93%) as reference points. We find that even with only 10 days of personalized train-ing data, the hybrid model has higher MSE accuracy than the in-cremental personalized by 31% and the all-user model by 6%. After 30 days, the personalized model outperforms the hybrid model and can be used with greater than 75% accuracy.
5.3.6 Comparison to Strawman Models As shown in Section 4.5.3, P4 and A3 are the most common moods. However, guessing those as the mood would only result in 44.8% or 50.2% accuracy, respectively. Thus, simply using the overall most common mood as an estimate would not perform well. Instead, we compare our models with three simplistic straw-man models that assume prior knowledge of a user’s personal us-age patterns. This reinforces the necessity to perform complicated model training and collect smartphone usage feature tables.
Model A, an average mood model, assumes that the mood never deviates from the average mood of the user. Model B, a slowly varying mood model, assumes that the mood is the same as the last-entered mood. Model C, the no-features model, performs leave-one-out multi-linear regression with the previous two mood pairs as input features alone.
The average MSE and accuracy of the strawman models are shown in Table 2. Of these methods, the average mood method works best, with an average MSE of 0.242 and accuracy of 73%, performing only slightly better than our all-user model. Thus, even with the full set of two months’ training data, these simple straw-man models compare unfavorably against personalized mood models and are insufficient for use in long-term mood estimation. Note that the hybrid model described in 5.3.5 achieves 72% accu-racy but with much less personal training data, i.e., 10 days. While the strawman models leverage prior knowledge about each indi-vidual user, the hybrid model exploits prior knowledge about gen-eral users.
5.3.7 Predicting Two-Dimensional Mood Our training process predicts mood along each dimension individ-ually. We find that with two months of personalized training data, each dimension is within 0.25 squared error for 93% of the days. After predicting each dimension, we found that 85% of the esti-mated two-dimensional daily moods are within 0.25 squared error. This performs significantly better than random guessing, at 4% accuracy, or choosing the most common mood (P4, A3), at 25.4% accuracy.
5.4 Feature Table Characteristics In this section, we explore characteristics of our feature table in mood model training. In particular, we discuss the relative im-portance of feature categories in discriminating mood. We also track the correlations of the feature types with pleasure and active-ness. These characteristics allow us to draw several key insights into the efficacy of the data types we collect.
5.4.1 Discriminative Features While SFS’s primary function is to reduce the feature table to a reasonable dimension, it comes with the side benefit of highlight-ing which features are useful in detecting mood. There are several ways to determine which features are useful for discrimination. We consider a few of these approaches with our personalized models.
Count number of occurrences in reduced feature table: After SFS reduces the feature table, we count the number of features of each type of data that appear in all reduced tables. Figure 10 shows the results. Phone calls, Calls, and categorized applications, Apps (Cat.), are the two most used features after SFS completes the feature selection.
Count number of statistically significant features: With the fea-tures used in the SFS, we perform Pearson Product-Moment Corre-lation on the data to obtain p-values. We used p-values less than 0.05 to indicate statistically significant features and present this data as the solid bars in Figure 10. Phone calls and categorized applications, which are the most commonly selected features, also show up as among the most common significant features. Howev-er, they are joined by significant features from emails, SMS, and ungrouped applications.
Count number of most discriminative features: Sequential Fea-ture Selection selects features in order of how much they help the training. We look at the first chosen as the most discriminative feature and count the number of times they occur in Figure 11. For Activeness model training, phone calls and categorized applica-tions again appear on top, in addition to SMS features, and fol-lowed closely by email features. However, for pleasure model training, email and SMS features are the common most-discriminative features, followed closely by phone calls. Amongst our users, categorized applications are only selected once for Pleasure model training.

Overall, phone calls invariably appear as a discriminative feature for determining mood. Categorized applications also appear very frequently and significantly. Emails and SMS follow closely as the next most discriminative features. Thus, while all features are used in varying combinations to predict mood, communication history and categorized application usage logs are the discriminative fea-tures that are most linked to mood.
5.4.2 Positively and Negatively Correlated Features In addition to seeing which selected features are the most helpful, we also track which types of features’ coefficients appear positive-ly or negatively more often than other features. We count the per-centage of positive coefficients for each type in our personalized multi-linear regression models and display the results in Figure 12. Previous Mood is frequently negative for both Pleasure (55% negative) and Activeness (67% negative). This is likely because many users have a strong tendency towards neutral. In other words, a highly negative mood is often followed by a more-positive mood towards neutral and vice versa.
During pleasure model training, phone calls, categorized applica-tions, and locations are often positive indicators of pleasure, ap-pearing 55% of the time as positive. In activeness model training, Phone call features again appear for positive activeness, appearing 59% of the time as positive. A high value in many selected email features tended to indicate lower activeness, as only 44% of email coefficients were positive when used in activeness model training.
5.5 Summary of MoodScope Design To predict the daily average of mood from histograms of interac-tions, we use multi-linear regression, tuned by a Sequential For-ward Feature Selection. Personalized models report high accuracy for most users, while generalized all-user models perform worse. However, MoodScope can use the all-user model to predict moods until it collects enough training data from a new user.
We also used our model training to discriminate which features were more aligned with mood. Categorized application usage and communication history, especially phone calls, were the most use-ful features in determining a user’s mood. However, amongst all the users, all features were significantly used to determine mood.
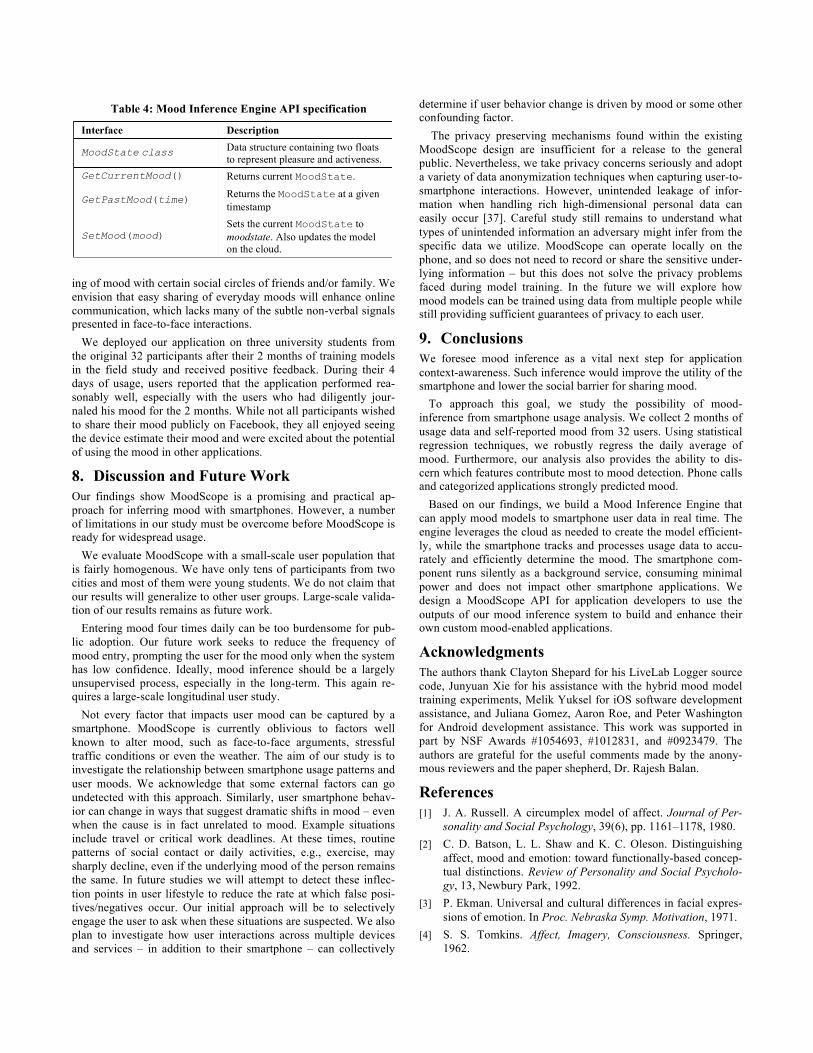
6. Mood Inference Engine Guided by our mood modeling study, we design and implement a Mood Inference Engine capable of inferring the mood of a user based on their smartphone usage history. As shown in Figure 13, the mood inference engine consists of two software components, one residing in the phone and the other in the cloud. The phone-side software, written for iPhone and Android systems, collects smartphone usage logs and user mood labels, on behalf of the cloud. The cloud is responsible for training a predictive mood model using these data, which is provided back to the smartphone. By applying this model, the phone is able to locally infer user mood – without aid of the cloud.
In the remainder of this section, we discuss the internal design of the Inference Engine, and provide performance measurements of our prototype implementation. Later, in Section 7, we describe how we build an application that encourages users to input their mood states to bootstrap the mood inference model.
6.1 Training on the Cloud Cloud-side software performs a combination of SFS and multi-linear regression, as described in Section 4, to train models for each user. The server processes usage logs with a collection of Unix bash scripts and Perl scripts. In total, this amounts to 815 lines of code. Models are trained using calls to MATLAB scripts that perform multi-linear regression with feature selection. Our system uses the Hybrid Mood Model from 5.3.5 to bootstrap the training mechanism. On a QuadCore 2.4 GHz Intel i7 processor, these two stages take on average 12 minutes at 100% computation to train a single mood model.
Figure 10: Number of features in SFS-reduced tables. Solid bars represent statistically significant features (p < 0.05).
Figure 11: Number of times a category appears as a most discriminative feature
Figure 12: Percentage of features that positively correlate
0
20
40
60
80
100
120
Num
ber o
f Features
Pleasure AcBveness
0
2
4
6
8
Num
ber o
f App
earances
Pleasure AcBveness
0
50
100
%
Pleasure AcBveness
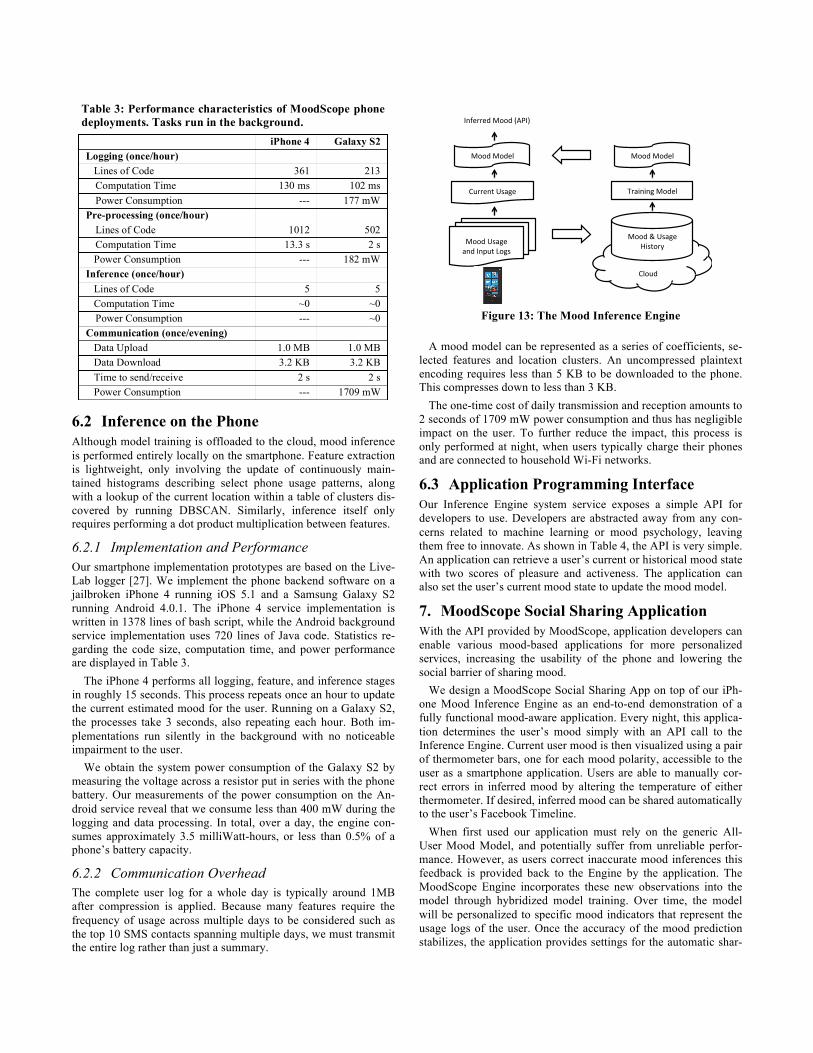
Table 3: Performance characteristics of MoodScope phone deployments. Tasks run in the background.
iPhone 4 Galaxy S2 Logging (once/hour) Lines of Code 361 213
Computation Time 130 ms 102 ms Power Consumption --- 177 mW
Pre-processing (once/hour) Lines of Code 1012 502 Computation Time 13.3 s 2 s
Power Consumption --- 182 mW Inference (once/hour) Lines of Code 5 5 Computation Time ~0 ~0
Power Consumption --- ~0 Communication (once/evening) Data Upload 1.0 MB 1.0 MB Data Download 3.2 KB 3.2 KB Time to send/receive 2 s 2 s Power Consumption --- 1709 mW
6.2 Inference on the Phone Although model training is offloaded to the cloud, mood inference is performed entirely locally on the smartphone. Feature extraction is lightweight, only involving the update of continuously main-tained histograms describing select phone usage patterns, along with a lookup of the current location within a table of clusters dis-covered by running DBSCAN. Similarly, inference itself only requires performing a dot product multiplication between features.
6.2.1 Implementation and Performance Our smartphone implementation prototypes are based on the Live-Lab logger [27]. We implement the phone backend software on a jailbroken iPhone 4 running iOS 5.1 and a Samsung Galaxy S2 running Android 4.0.1. The iPhone 4 service implementation is written in 1378 lines of bash script, while the Android background service implementation uses 720 lines of Java code. Statistics re-garding the code size, computation time, and power performance are displayed in Table 3.
The iPhone 4 performs all logging, feature, and inference stages in roughly 15 seconds. This process repeats once an hour to update the current estimated mood for the user. Running on a Galaxy S2, the processes take 3 seconds, also repeating each hour. Both im-plementations run silently in the background with no noticeable impairment to the user.
We obtain the system power consumption of the Galaxy S2 by measuring the voltage across a resistor put in series with the phone battery. Our measurements of the power consumption on the An-droid service reveal that we consume less than 400 mW during the logging and data processing. In total, over a day, the engine con-sumes approximately 3.5 milliWatt-hours, or less than 0.5% of a phone’s battery capacity.
6.2.2 Communication Overhead The complete user log for a whole day is typically around 1MB after compression is applied. Because many features require the frequency of usage across multiple days to be considered such as the top 10 SMS contacts spanning multiple days, we must transmit the entire log rather than just a summary.
A mood model can be represented as a series of coefficients, se-lected features and location clusters. An uncompressed plaintext encoding requires less than 5 KB to be downloaded to the phone. This compresses down to less than 3 KB.
The one-time cost of daily transmission and reception amounts to 2 seconds of 1709 mW power consumption and thus has negligible impact on the user. To further reduce the impact, this process is only performed at night, when users typically charge their phones and are connected to household Wi-Fi networks.
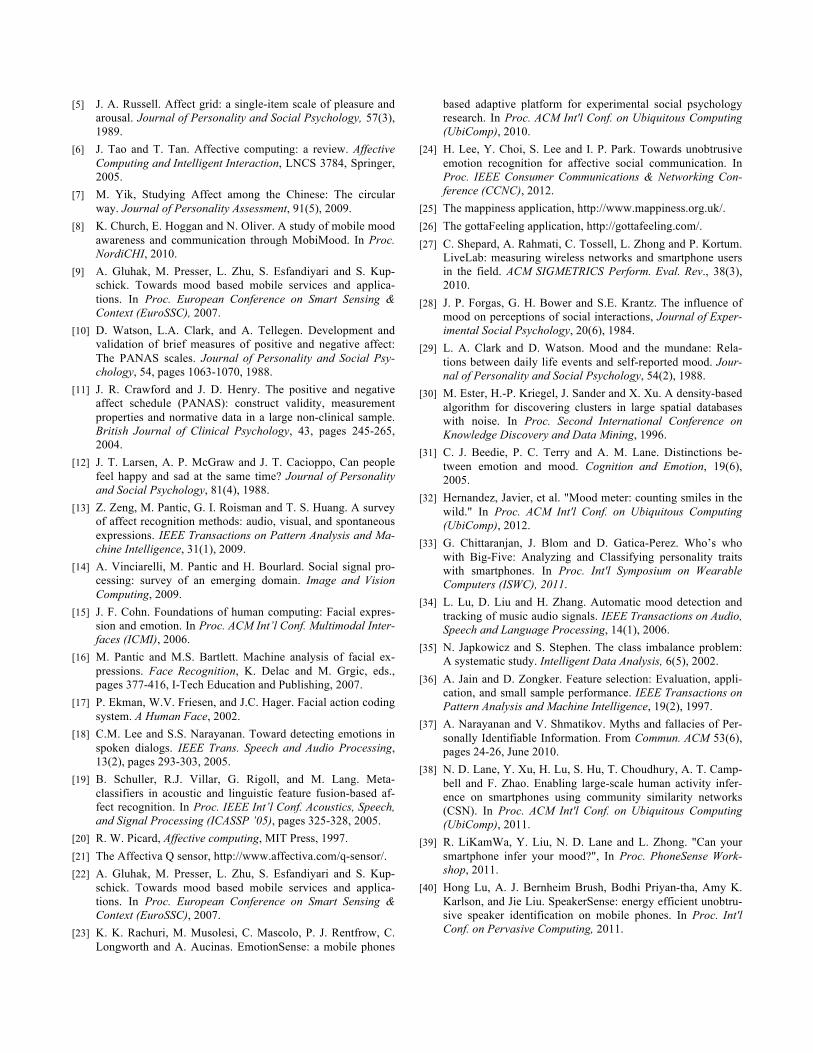
6.3 Application Programming Interface Our Inference Engine system service exposes a simple API for developers to use. Developers are abstracted away from any con-cerns related to machine learning or mood psychology, leaving them free to innovate. As shown in Table 4, the API is very simple. An application can retrieve a user’s current or historical mood state with two scores of pleasure and activeness. The application can also set the user’s current mood state to update the mood model.
7. MoodScope Social Sharing Application With the API provided by MoodScope, application developers can enable various mood-based applications for more personalized services, increasing the usability of the phone and lowering the social barrier of sharing mood.
We design a MoodScope Social Sharing App on top of our iPh-one Mood Inference Engine as an end-to-end demonstration of a fully functional mood-aware application. Every night, this applica-tion determines the user’s mood simply with an API call to the Inference Engine. Current user mood is then visualized using a pair of thermometer bars, one for each mood polarity, accessible to the user as a smartphone application. Users are able to manually cor-rect errors in inferred mood by altering the temperature of either thermometer. If desired, inferred mood can be shared automatically to the user’s Facebook Timeline.
When first used our application must rely on the generic All-User Mood Model, and potentially suffer from unreliable perfor-mance. However, as users correct inaccurate mood inferences this feedback is provided back to the Engine by the application. The MoodScope Engine incorporates these new observations into the model through hybridized model training. Over time, the model will be personalized to specific mood indicators that represent the usage logs of the user. Once the accuracy of the mood prediction stabilizes, the application provides settings for the automatic shar-
Figure 13: The Mood Inference Engine
!!
Cloud!
Mood!Model! Mood!Model!
Training!Model!Current!Usage!
Mood!Usage!!and!Input!Logs!
Mood!&!Usage!!History!
Inferred!Mood!(API)!
ing of mood with certain social circles of friends and/or family. We envision that easy sharing of everyday moods will enhance online communication, which lacks many of the subtle non-verbal signals presented in face-to-face interactions.
We deployed our application on three university students from the original 32 participants after their 2 months of training models in the field study and received positive feedback. During their 4 days of usage, users reported that the application performed rea-sonably well, especially with the users who had diligently jour-naled his mood for the 2 months. While not all participants wished to share their mood publicly on Facebook, they all enjoyed seeing the device estimate their mood and were excited about the potential of using the mood in other applications.
8. Discussion and Future Work Our findings show MoodScope is a promising and practical ap-proach for inferring mood with smartphones. However, a number of limitations in our study must be overcome before MoodScope is ready for widespread usage.
We evaluate MoodScope with a small-scale user population that is fairly homogenous. We have only tens of participants from two cities and most of them were young students. We do not claim that our results will generalize to other user groups. Large-scale valida-tion of our results remains as future work.
Entering mood four times daily can be too burdensome for pub-lic adoption. Our future work seeks to reduce the frequency of mood entry, prompting the user for the mood only when the system has low confidence. Ideally, mood inference should be a largely unsupervised process, especially in the long-term. This again re-quires a large-scale longitudinal user study.
Not every factor that impacts user mood can be captured by a smartphone. MoodScope is currently oblivious to factors well known to alter mood, such as face-to-face arguments, stressful traffic conditions or even the weather. The aim of our study is to investigate the relationship between smartphone usage patterns and user moods. We acknowledge that some external factors can go undetected with this approach. Similarly, user smartphone behav-ior can change in ways that suggest dramatic shifts in mood – even when the cause is in fact unrelated to mood. Example situations include travel or critical work deadlines. At these times, routine patterns of social contact or daily activities, e.g., exercise, may sharply decline, even if the underlying mood of the person remains the same. In future studies we will attempt to detect these inflec-tion points in user lifestyle to reduce the rate at which false posi-tives/negatives occur. Our initial approach will be to selectively engage the user to ask when these situations are suspected. We also plan to investigate how user interactions across multiple devices and services – in addition to their smartphone – can collectively
determine if user behavior change is driven by mood or some other confounding factor.
The privacy preserving mechanisms found within the existing MoodScope design are insufficient for a release to the general public. Nevertheless, we take privacy concerns seriously and adopt a variety of data anonymization techniques when capturing user-to-smartphone interactions. However, unintended leakage of infor-mation when handling rich high-dimensional personal data can easily occur [37]. Careful study still remains to understand what types of unintended information an adversary might infer from the specific data we utilize. MoodScope can operate locally on the phone, and so does not need to record or share the sensitive under-lying information – but this does not solve the privacy problems faced during model training. In the future we will explore how mood models can be trained using data from multiple people while still providing sufficient guarantees of privacy to each user.
9. Conclusions We foresee mood inference as a vital next step for application context-awareness. Such inference would improve the utility of the smartphone and lower the social barrier for sharing mood.
To approach this goal, we study the possibility of mood-inference from smartphone usage analysis. We collect 2 months of usage data and self-reported mood from 32 users. Using statistical regression techniques, we robustly regress the daily average of mood. Furthermore, our analysis also provides the ability to dis-cern which features contribute most to mood detection. Phone calls and categorized applications strongly predicted mood.
Based on our findings, we build a Mood Inference Engine that can apply mood models to smartphone user data in real time. The engine leverages the cloud as needed to create the model efficient-ly, while the smartphone tracks and processes usage data to accu-rately and efficiently determine the mood. The smartphone com-ponent runs silently as a background service, consuming minimal power and does not impact other smartphone applications. We design a MoodScope API for application developers to use the outputs of our mood inference system to build and enhance their own custom mood-enabled applications.
Acknowledgments The authors thank Clayton Shepard for his LiveLab Logger source code, Junyuan Xie for his assistance with the hybrid mood model training experiments, Melik Yuksel for iOS software development assistance, and Juliana Gomez, Aaron Roe, and Peter Washington for Android development assistance. This work was supported in part by NSF Awards #1054693, #1012831, and #0923479. The authors are grateful for the useful comments made by the anony-mous reviewers and the paper shepherd, Dr. Rajesh Balan.
References [1] J. A. Russell. A circumplex model of affect. Journal of Per-
sonality and Social Psychology, 39(6), pp. 1161–1178, 1980. [2] C. D. Batson, L. L. Shaw and K. C. Oleson. Distinguishing
affect, mood and emotion: toward functionally-based concep-tual distinctions. Review of Personality and Social Psycholo-gy, 13, Newbury Park, 1992.
[3] P. Ekman. Universal and cultural differences in facial expres-sions of emotion. In Proc. Nebraska Symp. Motivation, 1971.
[4] S. S. Tomkins. Affect, Imagery, Consciousness. Springer, 1962.
Table 4: Mood Inference Engine API specification
Interface Description
MoodState class Data structure containing two floats to represent pleasure and activeness.
GetCurrentMood() Returns current MoodState.
GetPastMood(time) Returns the MoodState at a given timestamp
SetMood(mood) Sets the current MoodState to moodstate. Also updates the model on the cloud.
[5] J. A. Russell. Affect grid: a single-item scale of pleasure and arousal. Journal of Personality and Social Psychology, 57(3), 1989.
[6] J. Tao and T. Tan. Affective computing: a review. Affective Computing and Intelligent Interaction, LNCS 3784, Springer, 2005.
[7] M. Yik, Studying Affect among the Chinese: The circular way. Journal of Personality Assessment, 91(5), 2009.
[8] K. Church, E. Hoggan and N. Oliver. A study of mobile mood awareness and communication through MobiMood. In Proc. NordiCHI, 2010.
[9] A. Gluhak, M. Presser, L. Zhu, S. Esfandiyari and S. Kup-schick. Towards mood based mobile services and applica-tions. In Proc. European Conference on Smart Sensing & Context (EuroSSC), 2007.
[10] D. Watson, L.A. Clark, and A. Tellegen. Development and validation of brief measures of positive and negative affect: The PANAS scales. Journal of Personality and Social Psy-chology, 54, pages 1063-1070, 1988.
[11] J. R. Crawford and J. D. Henry. The positive and negative affect schedule (PANAS): construct validity, measurement properties and normative data in a large non-clinical sample. British Journal of Clinical Psychology, 43, pages 245-265, 2004.
[12] J. T. Larsen, A. P. McGraw and J. T. Cacioppo, Can people feel happy and sad at the same time? Journal of Personality and Social Psychology, 81(4), 1988.
[13] Z. Zeng, M. Pantic, G. I. Roisman and T. S. Huang. A survey of affect recognition methods: audio, visual, and spontaneous expressions. IEEE Transactions on Pattern Analysis and Ma-chine Intelligence, 31(1), 2009.
[14] A. Vinciarelli, M. Pantic and H. Bourlard. Social signal pro-cessing: survey of an emerging domain. Image and Vision Computing, 2009.
[15] J. F. Cohn. Foundations of human computing: Facial expres-sion and emotion. In Proc. ACM Int’l Conf. Multimodal Inter-faces (ICMI), 2006.
[16] M. Pantic and M.S. Bartlett. Machine analysis of facial ex-pressions. Face Recognition, K. Delac and M. Grgic, eds., pages 377-416, I-Tech Education and Publishing, 2007.
[17] P. Ekman, W.V. Friesen, and J.C. Hager. Facial action coding system. A Human Face, 2002.
[18] C.M. Lee and S.S. Narayanan. Toward detecting emotions in spoken dialogs. IEEE Trans. Speech and Audio Processing, 13(2), pages 293-303, 2005.
[19] B. Schuller, R.J. Villar, G. Rigoll, and M. Lang. Meta-classifiers in acoustic and linguistic feature fusion-based af-fect recognition. In Proc. IEEE Int’l Conf. Acoustics, Speech, and Signal Processing (ICASSP ’05), pages 325-328, 2005.
[20] R. W. Picard, Affective computing, MIT Press, 1997. [21] The Affectiva Q sensor, http://www.affectiva.com/q-sensor/. [22] A. Gluhak, M. Presser, L. Zhu, S. Esfandiyari and S. Kup-
schick. Towards mood based mobile services and applica-tions. In Proc. European Conference on Smart Sensing & Context (EuroSSC), 2007.
[23] K. K. Rachuri, M. Musolesi, C. Mascolo, P. J. Rentfrow, C. Longworth and A. Aucinas. EmotionSense: a mobile phones
based adaptive platform for experimental social psychology research. In Proc. ACM Int'l Conf. on Ubiquitous Computing (UbiComp), 2010.
[24] H. Lee, Y. Choi, S. Lee and I. P. Park. Towards unobtrusive emotion recognition for affective social communication. In Proc. IEEE Consumer Communications & Networking Con-ference (CCNC), 2012.
[25] The mappiness application, http://www.mappiness.org.uk/. [26] The gottaFeeling application, http://gottafeeling.com/. [27] C. Shepard, A. Rahmati, C. Tossell, L. Zhong and P. Kortum.
LiveLab: measuring wireless networks and smartphone users in the field. ACM SIGMETRICS Perform. Eval. Rev., 38(3), 2010.
[28] J. P. Forgas, G. H. Bower and S.E. Krantz. The influence of mood on perceptions of social interactions, Journal of Exper-imental Social Psychology, 20(6), 1984.
[29] L. A. Clark and D. Watson. Mood and the mundane: Rela-tions between daily life events and self-reported mood. Jour-nal of Personality and Social Psychology, 54(2), 1988.
[30] M. Ester, H.-P. Kriegel, J. Sander and X. Xu. A density-based algorithm for discovering clusters in large spatial databases with noise. In Proc. Second International Conference on Knowledge Discovery and Data Mining, 1996.
[31] C. J. Beedie, P. C. Terry and A. M. Lane. Distinctions be-tween emotion and mood. Cognition and Emotion, 19(6), 2005.
[32] Hernandez, Javier, et al. "Mood meter: counting smiles in the wild." In Proc. ACM Int'l Conf. on Ubiquitous Computing (UbiComp), 2012.
[33] G. Chittaranjan, J. Blom and D. Gatica-Perez. Who’s who with Big-Five: Analyzing and Classifying personality traits with smartphones. In Proc. Int'l Symposium on Wearable Computers (ISWC), 2011.
[34] L. Lu, D. Liu and H. Zhang. Automatic mood detection and tracking of music audio signals. IEEE Transactions on Audio, Speech and Language Processing, 14(1), 2006.
[35] N. Japkowicz and S. Stephen. The class imbalance problem: A systematic study. Intelligent Data Analysis, 6(5), 2002.
[36] A. Jain and D. Zongker. Feature selection: Evaluation, appli-cation, and small sample performance. IEEE Transactions on Pattern Analysis and Machine Intelligence, 19(2), 1997.
[37] A. Narayanan and V. Shmatikov. Myths and fallacies of Per-sonally Identifiable Information. From Commun. ACM 53(6), pages 24-26, June 2010.
[38] N. D. Lane, Y. Xu, H. Lu, S. Hu, T. Choudhury, A. T. Camp-bell and F. Zhao. Enabling large-scale human activity infer-ence on smartphones using community similarity networks (CSN). In Proc. ACM Int'l Conf. on Ubiquitous Computing (UbiComp), 2011.
[39] R. LiKamWa, Y. Liu, N. D. Lane and L. Zhong. "Can your smartphone infer your mood?", In Proc. PhoneSense Work-shop, 2011.
[40] Hong Lu, A. J. Bernheim Brush, Bodhi Priyan-tha, Amy K. Karlson, and Jie Liu. SpeakerSense: energy efficient unobtru-sive speaker identification on mobile phones. In Proc. Int'l Conf. on Pervasive Computing, 2011.

![Kantar IMRB & MMA Smartphone Usage and Behaviour Report ... · PDF fileKantar IMRB & MMA Smartphone Usage and Behaviour Report [Overview] – India 2016-17](https://img.dokumen.tips/doc/110x75/5abbc41c7f8b9a76038d1a55/kantar-imrb-mma-smartphone-usage-and-behaviour-report-kantar-imrb-mma-smartphone.jpg)