Embed Size (px)
Citation preview

Building a Council Profile
Using ABS Data
Presenter: Sharon Fielder
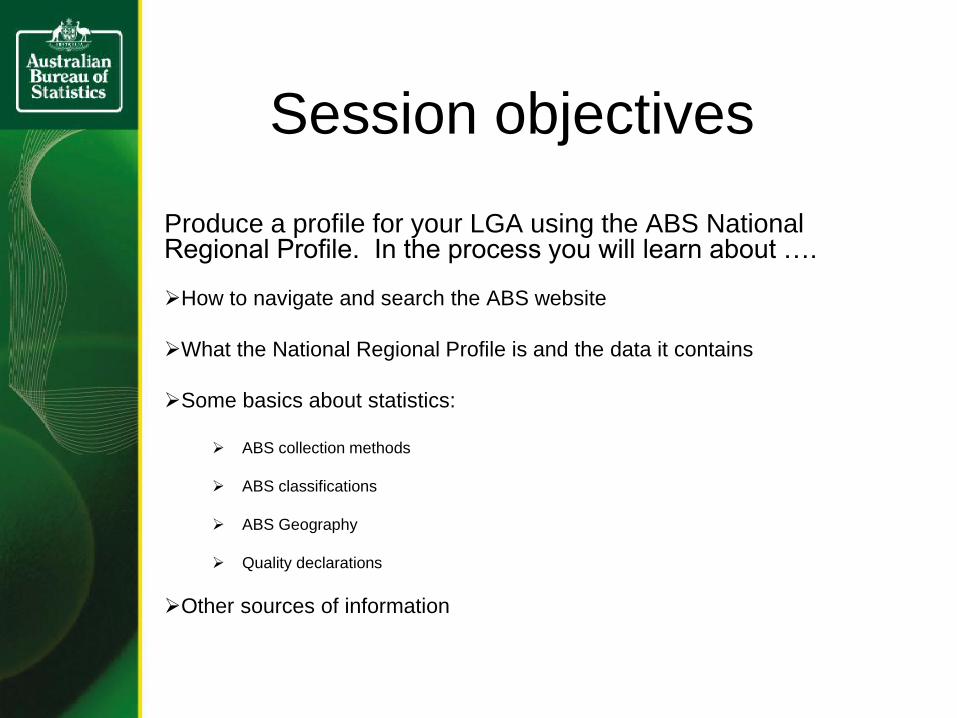
Session objectives
Produce a profile for your LGA using the ABS National Regional Profile. In the process you will learn about ….
How to navigate and search the ABS website
What the National Regional Profile is and the data it contains
Some basics about statistics:
ABS collection methods
ABS classifications
ABS Geography
Quality declarations
Other sources of information

How the ABS operates
• We run a survey
– We collate and analyse the survey
data to produce useful information
• We publish information in publications
and include text, tables, graphs and
downloads
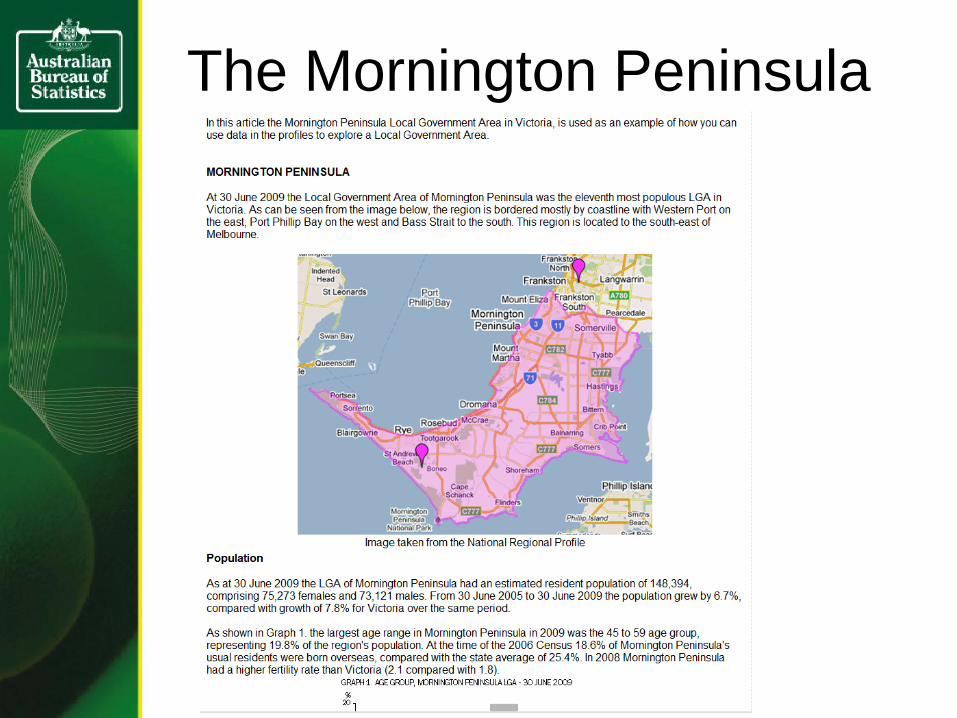
The Mornington Peninsula

abs.gov.au
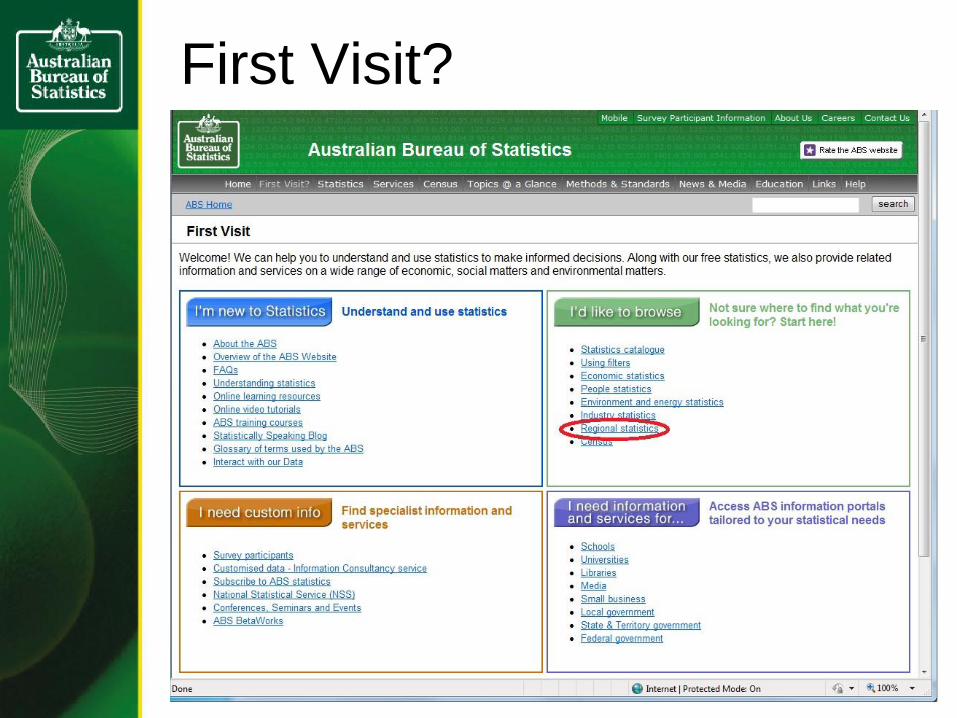
First Visit?

ABS Website
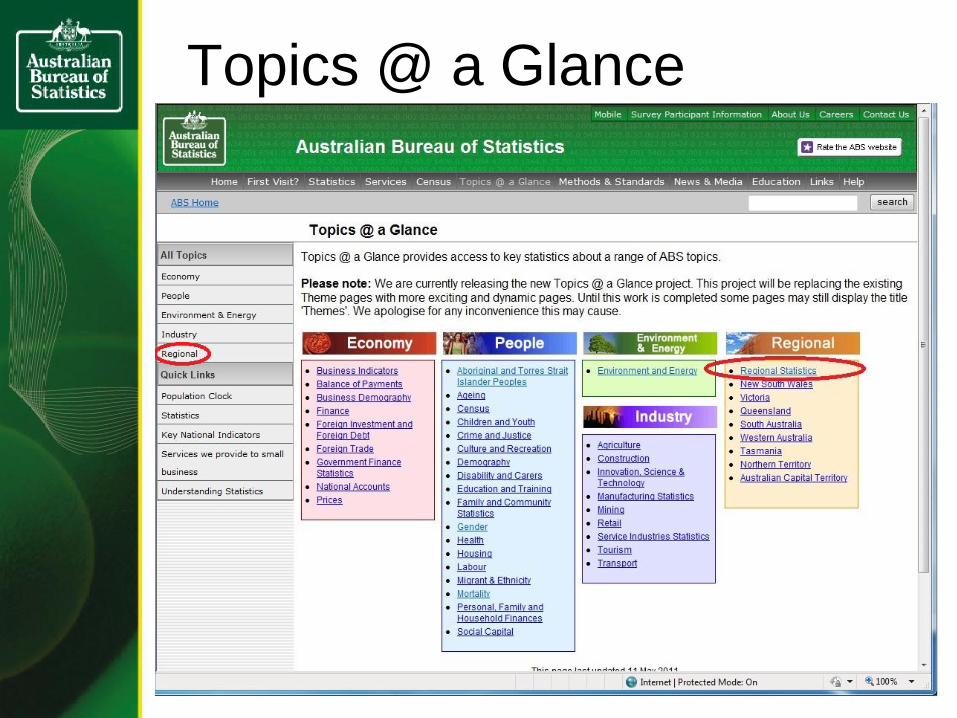
Topics @ a Glance

Regional @ a Glance

Topics @ a Glance - Regional Statistics
Local Government Areas

Search result: regional profile

National Regional Profiles


National Regional Profile 2005-2009

Find by searching for an address

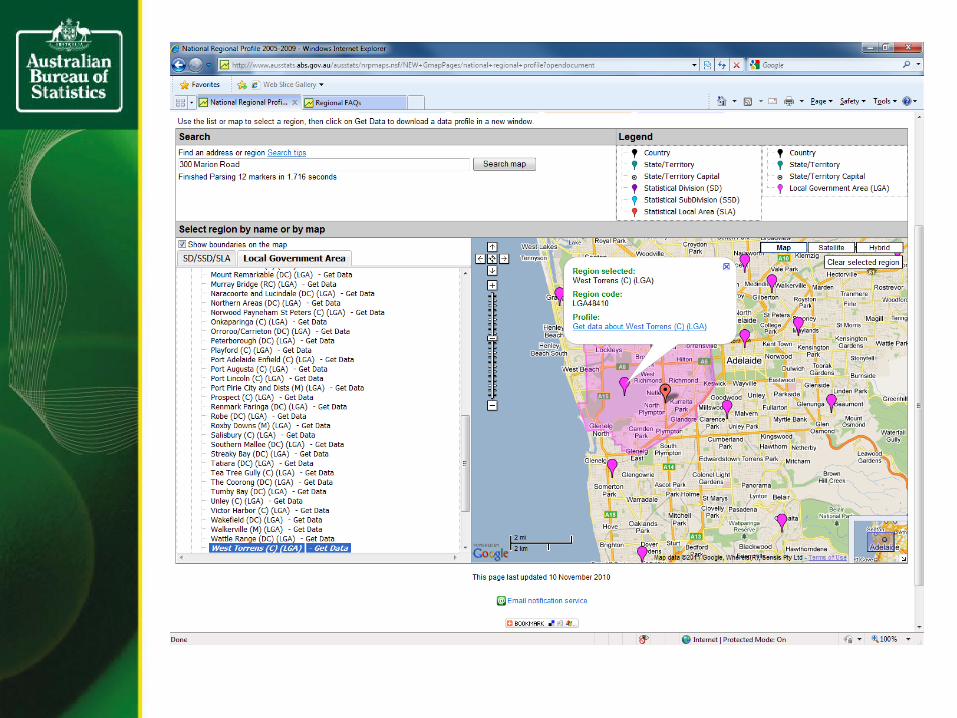

My LGA

Exercise 1 – a map for your area
• Using the National Regional Profile
page, create a map of your LGA for
use in your regional profile article
• Hint: If you have or something similar you can use
it capture a part of the screen
• Hint: If you don’t have a snipping program you can use Alt
PrtScrn to take a snapshot of your entire screen and then use
Paint (or something similar) to paste and then select the part
you want.

Getting some data
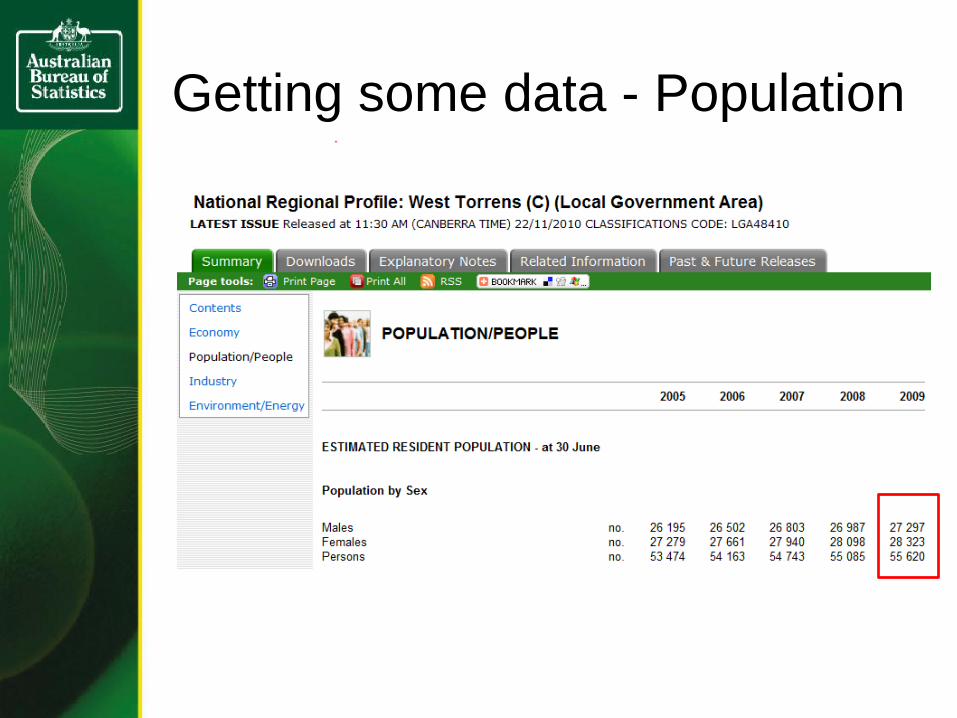
Getting some data - Population

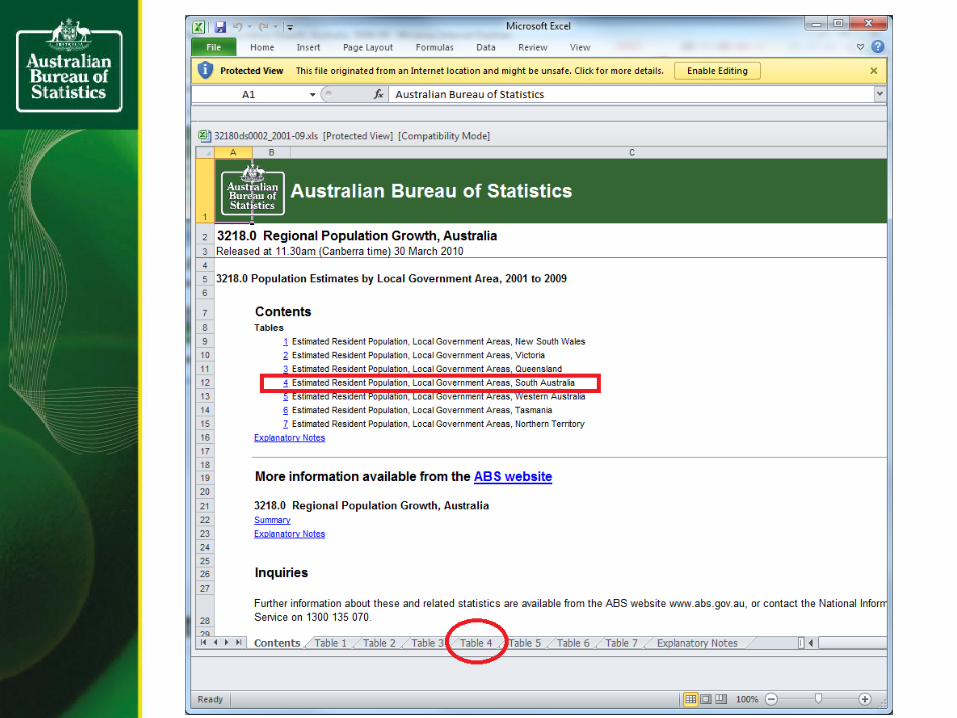
Profile for South Australia

Topics @ a Glance - Regional Statistics
Local Government Areas


= (LGA / Total SA) * 100

Exercise 2: ERP and % of state
• Using the ABS website, find your LGA
ERP figures for 2005 and for 2009
• Using the handout provided, what is your
LGA’s rank.

Getting some data - Population

Exercise 3: Gender and
Population growth
• Using the ABS website, how many
males and females were estimated to be
in your LGA as at June 2009?
• Using the handout provided, how much
has your LGA grown since 2005 and
how does this compare with all of SA?

More population data
My LGA: West Torrens (C)
South Australia

More population data
My LGA: West Torrens (C)
South Australia

More population data

More population data

Exercise 4: age, country of
birth and fertility
• Using the ABS website, for 2009:
– What is the largest age group in your LGA?
– What proportion of your LGA’s residents
were born overseas?
– What was the fertility rate for your LGA?
• How do these values compare with SA as a
whole?
• Extra Task: create an age graph for your LGA
like the one in the Mornington Peninsula article

Data about the Economy


Exercise 5: Economic data
• Using the ABS website, find the
following figures for your LGA – The unemployment rate
– The average wage and salary income
– The two most common occupations
– The number of people on an age pension
from Centrelink and from DVA
– The proportion of people 65 years and over
• How do these compare with figures
for SA?

Data about Industry


Exercise 6a: tourism and
housing • Using the ABS website, find the following figures for your LGA
and compare with SA totals
– Hotel/Motel/Serviced apartments 5 rooms or more
– Caravan parks
– Largest use of agricultural land
– Highest prevalent livestock
– Gross value of livestock
– Gross value of crops
– Average value of private sector house approvals and rate of
increase from 2004-05
– Number of private sector house approvals and rate of
increase from 2004-05
• Extra task: Create a time series graph for building
approvals for your LGA

Exercise 6b: motor
vehicles • Using the ABS website, find the following figures
for your LGA and compare with SA and
Australian totals
– Total registered motor vehicles
– Registered passenger vehicles
– Proportion of total registered vehicles aged 10 years or
more
• Extra task: What proportion of total registered
vehicles are less than 5 years old in your LGA.
Compare with SA and Australian totals

Data about the Environment


Exercise 7: irrigation and
water use • Using the ABS website, what hectares of land
were irrigated in your LGA? What proportion of
all agricultural land is irrigated in your LGA?
How does this compare with SA as a whole?
• What was the total water use on farms in your
LGA? How much of all water used on SA farms
was this?
• Extra task: How does your LGA compare with
% of irrigated agricultural land for Australia as a
whole? How much of all water used on
Australian farms was used in your LGA?

Exercise 8: putting it all
together • Gather all the data from the
previous 7 exercises together to
produce the article for your LGA

Data on counts of
businesses

Exercise 9: businesses
• Using the ABS website, what
proportion of businesses in your
LGA employed 1-4 employees?
• How does this compare to SA as a
whole?
• Extra task: How does it compare
with Australia?

Other data?
• What else do you want to know
about your LGA?

Survey Methodologies
• Census Survey– count of whole
population
• Sample Survey – sample of
population
• Administrative Data – reusing data
collected for another reason


Search for geography in the search bar

ABS Geography
Australian Standard Geographical
Classification (ASGC)
– Cat.no 1216.0

ABS Geography


ABS Data Quality Framework
Data
Quality
Framework
Relevance
Accuracy
Timeliness Accessibility
Interpretability
Coherence
Institutional Environment
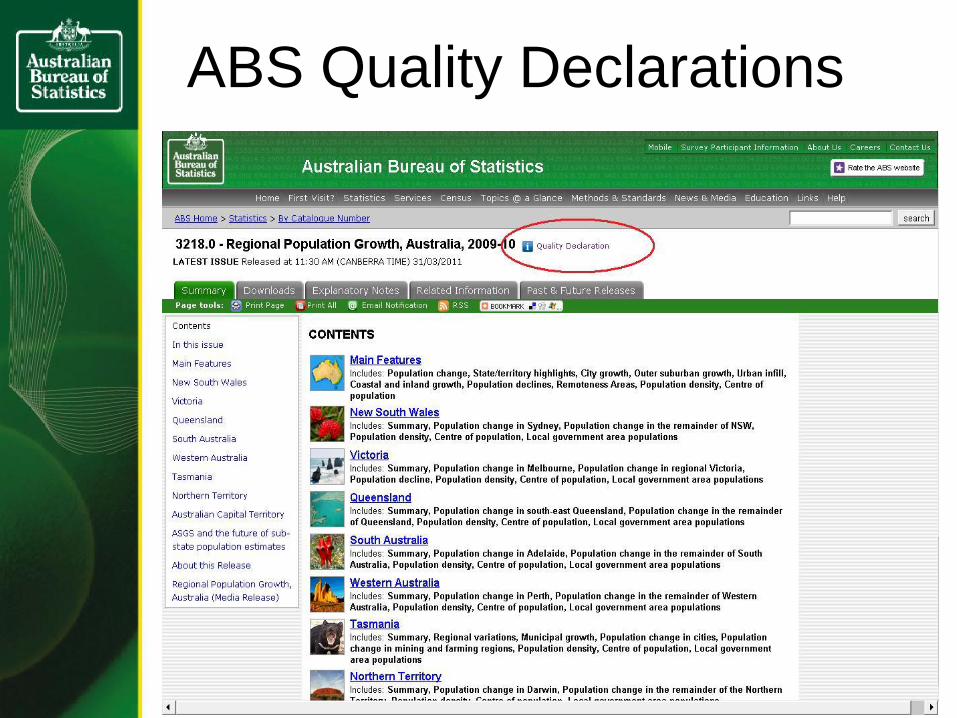
ABS Quality Declarations
Keeping up to date
• Email Notification
• RSS
• Bookmark

Email notification

New subscription

Really Simple Syndication


Bookmark and Share

Where to get help:
National Information Referral Service (NIRS)
Phone: 1300 135 070
(9am–5pm Monday to Friday)
Email: [email protected]
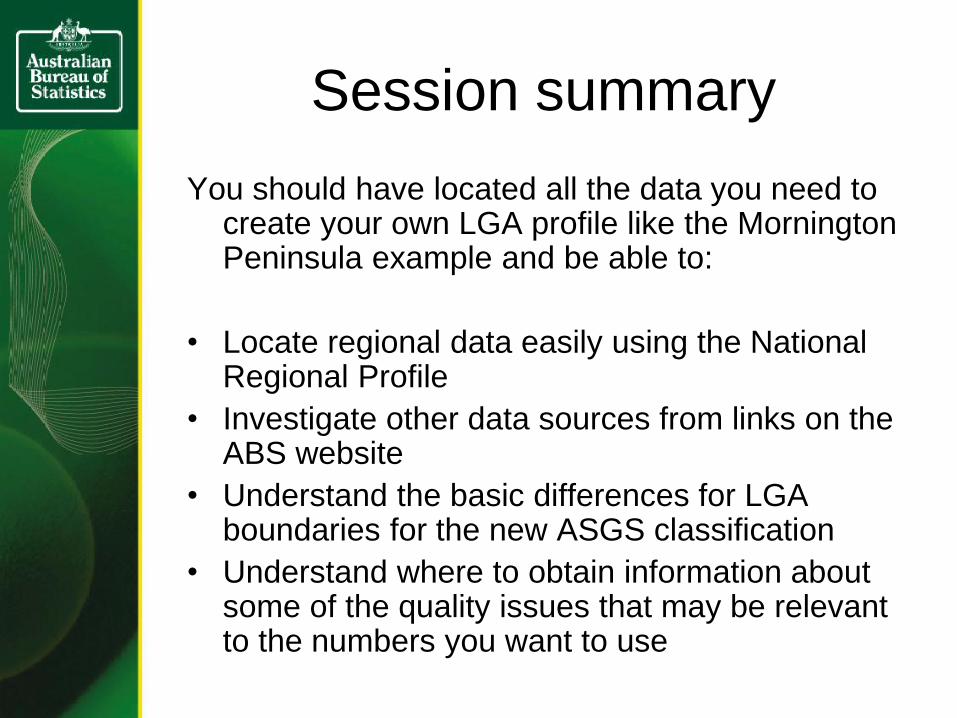
Session summary
You should have located all the data you need to create your own LGA profile like the Mornington Peninsula example and be able to:
• Locate regional data easily using the National Regional Profile
• Investigate other data sources from links on the ABS website
• Understand the basic differences for LGA boundaries for the new ASGS classification
• Understand where to obtain information about some of the quality issues that may be relevant to the numbers you want to use

Questions?
• Thank you!