Embed Size (px)
Citation preview
Q3 2021 presentationOctober 27, 2021
Johan Lindqvist, CEO Marcus Söderberg, CFO

Continued strong growth and profitability
• Continued strong demand continued in Q3 across all segments
– Organic growth up 20%, good underlying demand and improved market share– Weak comparison quarter– No sign of slowdown as yet – instead, order intake continues in excess of sales
• Operationally very challenging quarter; strained supply chains and increased raw material prices
• Despite this; strong improvement in EBITA (+16%) and net profit (+24%)
• Acquisition of Component Solutions Group in the quarter (Jenny I Waltle & Tilka Trading)
• Staffan Pehrson announced new CEO starting in February 2022
1
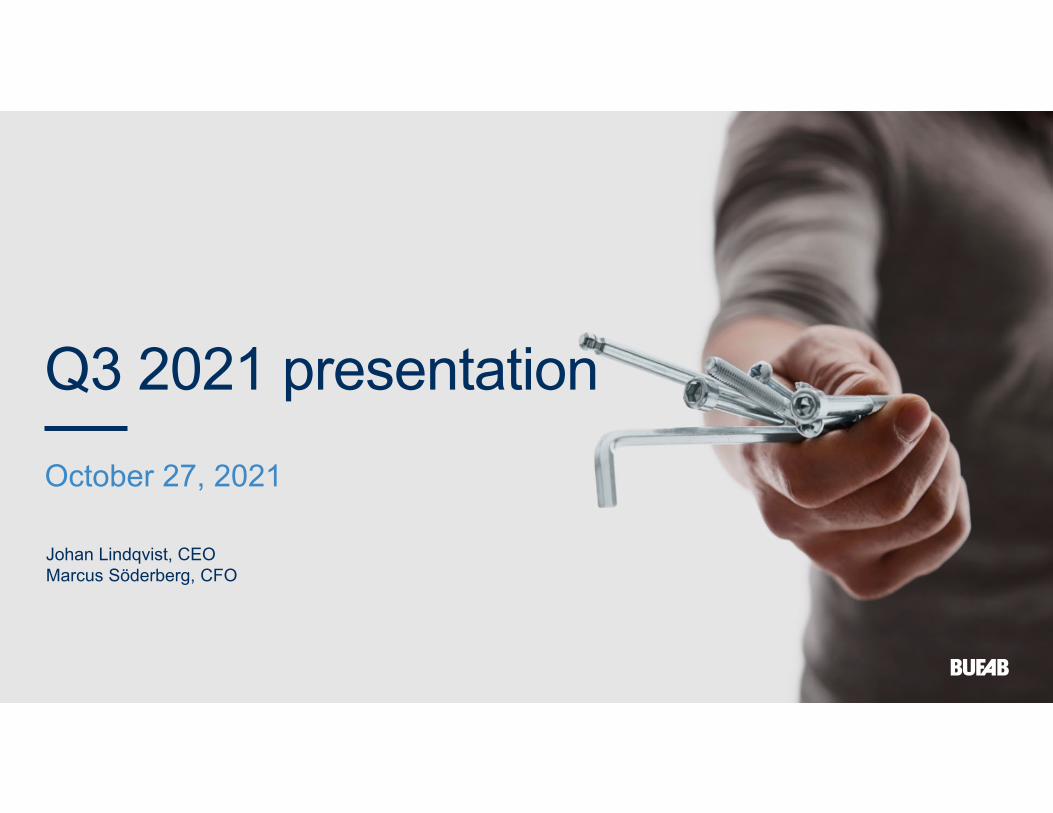
Financial highlights, Group
EBITA Q3 2020 142
Currencies -3
Volume +55
Cost + price/mix/other -12
Acquisitions -18
EBITA Q3 2021 164
Quarter 3 Δ Jan-Sep Δ12-months
rolling Full year
SEK million 2021 2020 % 2021 2020 % 2021/20 2020
Order intake 1,454 1,219 19 4,461 3,528 26 5,760 4,827
Net sales 1,425 1,181 21 4,279 3,518 22 5,517 4,756
Gross profit 405 320 27 1,195 929 29 1,518 1,252
% 28.4 27.1 27.9 26.4 27.5 26.3
Operating expenses -241 -178 35 -669 -568 18 -872 -771
% -16.9 -15.0 -15.6 -16.2 -15.8 -16.2
Operating profit (EBITA)
164 142 16 526 361 46 647 482
% 11.5 12.1 12.3 10.2 11.7 10.1
Operating profit 157 135 16 505 338 49 618 452
% 11.0 11.4 11.8 9.6 11.2 9.5
Profit after tax 113 91 24 355 223 59 431 299
Earnings per share, SEK
2.90 2.46 18 9.40 6.01 56 11.43 8.04
2

Financial development, Group
‐30
‐20
‐10
0
10
20
30
40
50
Percen
t
Quarterly Net Sales growthOrganic growth Total growth
0
150
300
450
600
750
0
1 500
3 000
4 500
6 000
7 500
LTM
EBI
TA, S
EK m
illion
LTM
Net
Sal
es, S
EK m
illion
s
Net sales and EBITA
Net Sales EBITA
3
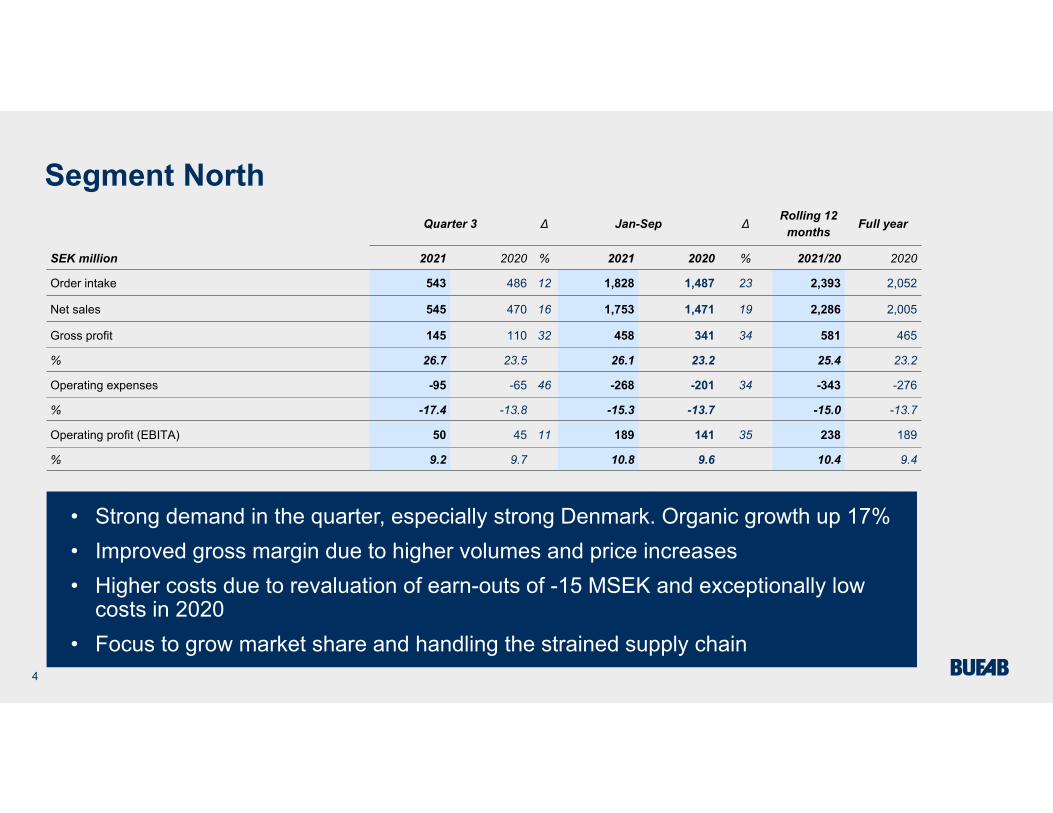
Segment North
• Strong demand in the quarter, especially strong Denmark. Organic growth up 17%• Improved gross margin due to higher volumes and price increases• Higher costs due to revaluation of earn-outs of -15 MSEK and exceptionally low
costs in 2020• Focus to grow market share and handling the strained supply chain
Quarter 3 Δ Jan-Sep ΔRolling 12
months Full year
SEK million 2021 2020 % 2021 2020 % 2021/20 2020
Order intake 543 486 12 1,828 1,487 23 2,393 2,052
Net sales 545 470 16 1,753 1,471 19 2,286 2,005
Gross profit 145 110 32 458 341 34 581 465
% 26.7 23.5 26.1 23.2 25.4 23.2
Operating expenses -95 -65 46 -268 -201 34 -343 -276
% -17.4 -13.8 -15.3 -13.7 -15.0 -13.7
Operating profit (EBITA) 50 45 11 189 141 35 238 189
% 9.2 9.7 10.8 9.6 10.4 9.4
4

Segment West
• Organic growth was +17%, especially strong Netherlands• Lower gross margin due to price pressure and an unfavorable product mix• Unchanged cost level• Focus on price adjustments, handling the strained supply chain and recruitments
Quarter 3 Δ Jan-Sep ΔRolling 12
months Full year
SEK million 2021 2020 % 2021 2020 % 2021/20 2020
Order intake 316 271 17 959 758 26 1,248 1,047
Net sales 289 251 15 910 754 21 1,183 1,028
Gross profit 70 63 11 229 188 22 298 257
% 24.3 25.0 25.2 24.9 25.2 25.0
Operating expenses -46 -40 15 -138 -125 10 -183 -171
% -15.8 -15.9 -15.1 -16.6 -15.5 -16.7
Operating profit (EBITA) 24 23 4 92 62 48 116 86
% 8.5 9.1 10.1 8.2 9.8 8.3
5

Segment East
• Strong demand both in Eastern Europe and Asia. Organic growth up 18%• Lower gross margin due to price pressure• Higher costs due to continued investments in future growth• Focus on sales, handling the strained supply chain and price adjustments to
customers
Quarter 3 Δ Jan-Sep ΔRolling 12
months Full year
SEK million 2021 2020 % 2021 2020 % 2021/20 2020
Order intake 228 188 21 698 542 29 881 725
Net sales 222 187 18 656 538 22 833 715
Gross profit 67 60 12 203 172 18 259 227
% 30.4 32.0 30.9 31.9 31.0 31.8
Operating expenses -33 -26 26 -87 -85 3 -127 -125
% -14.8 -13.9 -13.2 -15.7 -15.2 -17.4
Operating profit (EBITA) 35 34 2 116 87 33 132 103
% 15.6 18.1 17.7 16.2 15.8 14.4
6

Segment UK/North America
• Strong demand in the quarter, especially RV segment in North America.Organic growth up 26%
• Improved gross margin due to higher volumes and purchasing savings• Lower cost – improvement in operating profit and margin• Focus on handling the strained supply chain and taking market share
Quarter 3 Δ Jan-Sep ΔRolling 12
months Full year
SEK million 2021 2020 % 2021 2020 % 2021/20 2020
Order intake 366 275 33 976 740 32 1,238 1,002
Net sales 369 273 35 960 755 27 1,214 1,008
Gross profit 122 88 38 310 238 30 389 317
% 33.0 32.3 32.2 31.5 32.1 31.4
Operating expenses -60 -46 29 -153 -147 4 -194 -189
% -16.2 -16.9 -15.9 -19.5 -16.0 -18.7
Operating profit (EBITA) 62 42 49 157 91 73 195 128
% 16.9 15.4 16.4 12.0 16.1 12.7
7
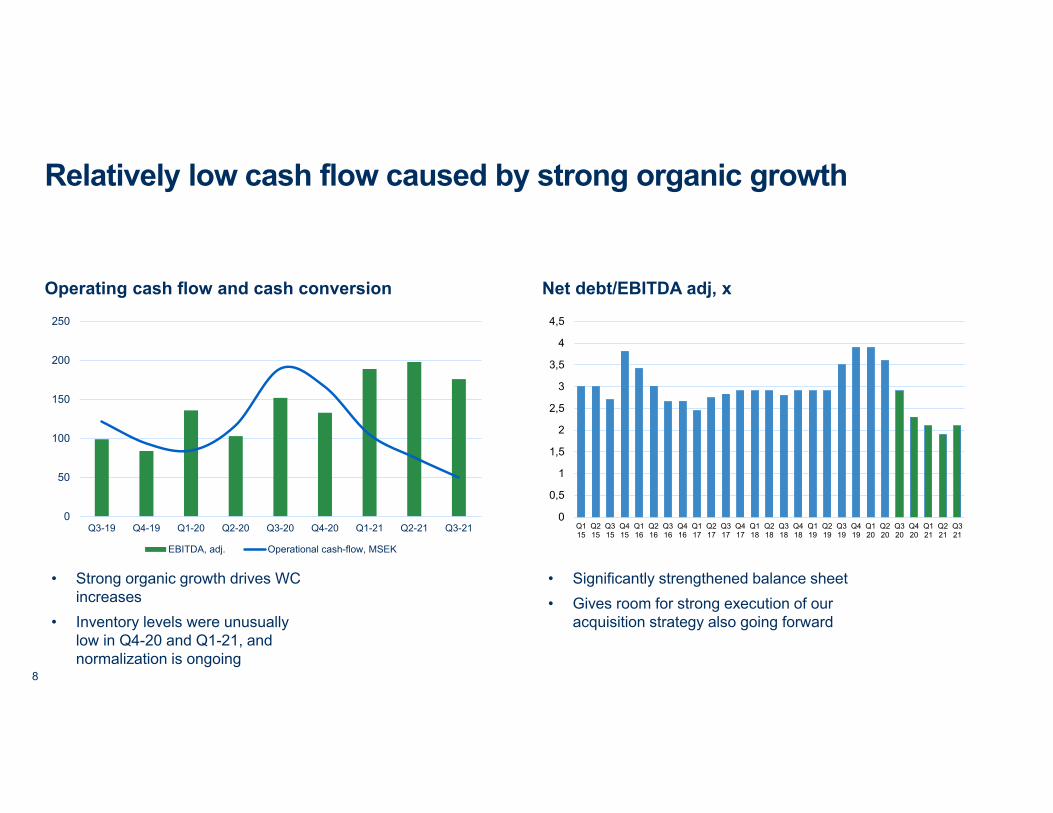
Relatively low cash flow caused by strong organic growth
Operating cash flow and cash conversion Net debt/EBITDA adj, x
0
0,5
1
1,5
2
2,5
3
3,5
4
4,5
Q115
Q215
Q315
Q415
Q116
Q216
Q316
Q416
Q117
Q217
Q317
Q417
Q118
Q218
Q318
Q418
Q119
Q219
Q319
Q419
Q120
Q220
Q320
Q420
Q121
Q221
Q321
• Strong organic growth drives WCincreases
• Inventory levels were unusuallylow in Q4-20 and Q1-21, andnormalization is ongoing
• Significantly strengthened balance sheet• Gives room for strong execution of our
acquisition strategy also going forward
0
50
100
150
200
250
Q3-19 Q4-19 Q1-20 Q2-20 Q3-20 Q4-20 Q1-21 Q2-21 Q3-21
EBITDA, adj. Operational cash-flow, MSEK
8

EBITA Bridge
EBITA Q3 2020 142
Currencies -3
Volume +55
Cost + price/mix/other -12
Acquisitions -18
EBITA Q3 2021 164
EBITA Q3 2020 142
North 5
West 1
East 1
UK/North America 20
Other -5
EBITA Q3 2021 164
9

+50acquisitions since 1977
12acquisitions since 2014
700employees
2,400 MSEK
Consolidator in a fragmented market
10
Summary and Outlook• Third quarter
• Operationally challenging quarter, but strong sales and profit. Demand improvement in all segments and increased market share
• Continued supply chain disruptions, and increasing component and freight cost
• Outlook
• Good demand looks to continue in Q4, still strong order intake, but large uncertainty
• Supply chain disruptions, increasing raw material costs and shipping costs will remain and putpressure on operations and margin
• Priorities
• Recruitments to meet the current high level of activity
• Handling the strained supply chain
• Keep steady gross margin
• Productivity increases to meet the normalization of the cost level
11

Q&A