Embed Size (px)
Citation preview
April 28, 2015
FIRST QUARTER
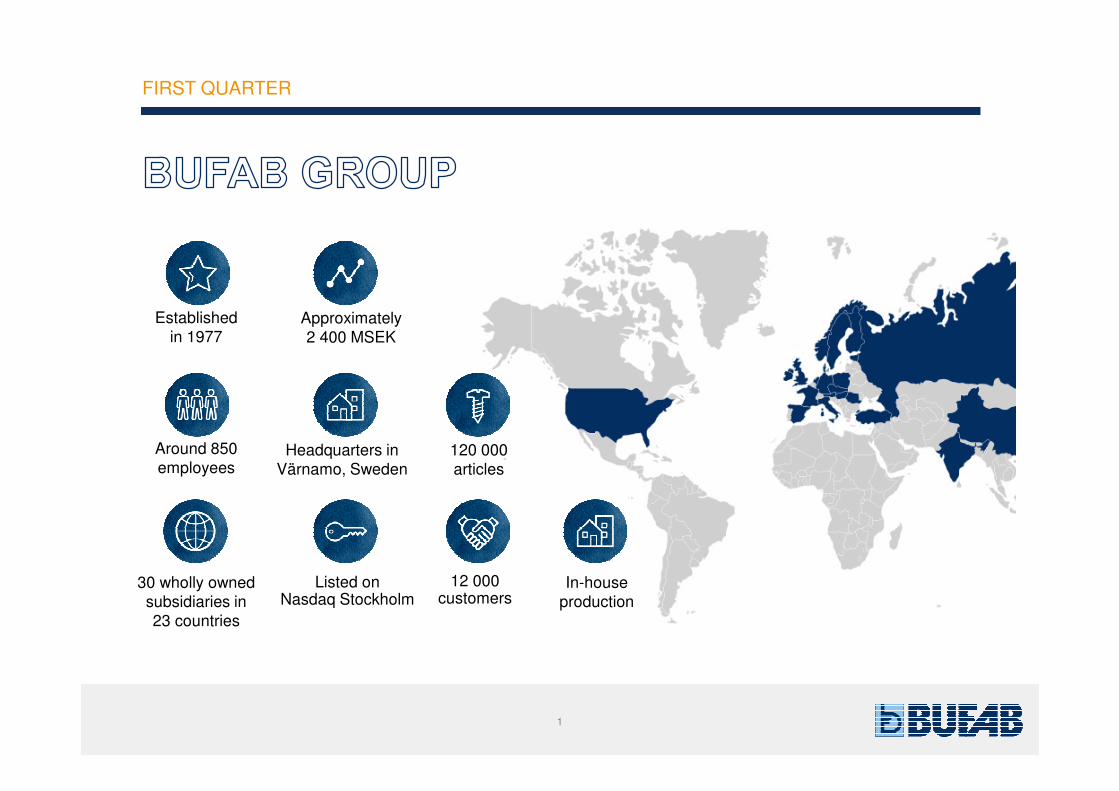
Established
in 1977
Around 850
employees
30 wholly owned
subsidiaries in
23 countries
Headquarters in
Värnamo, Sweden
120 000
articles
12 000customers
In-house
production
1
Approximately
2 400 MSEK
Listed on Nasdaq Stockholm
FIRST QUARTER
2
FIRST QUARTER
2
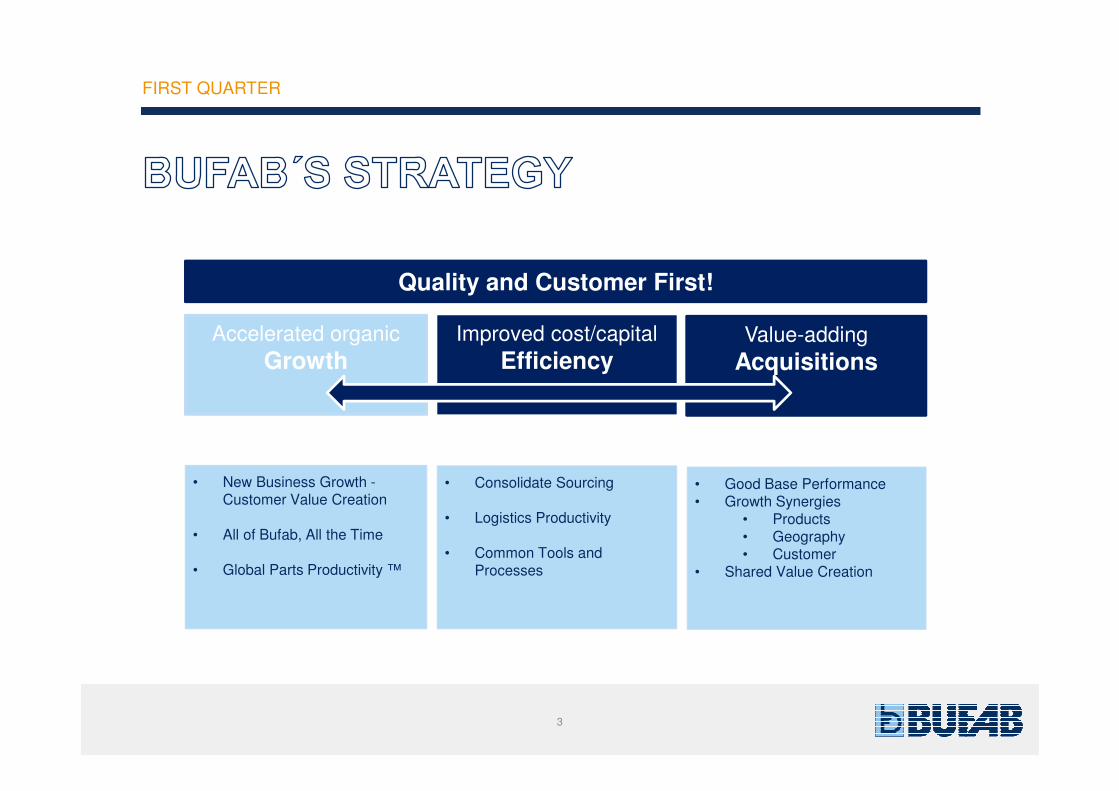
Quality and Customer First!
Accelerated organic
GrowthImproved cost/capital
EfficiencyValue-adding
Acquisitions
• New Business Growth -Customer Value Creation
• All of Bufab, All the Time
• Global Parts Productivity ™
• Consolidate Sourcing
• Logistics Productivity
• Common Tools and Processes
• Good Base Performance • Growth Synergies
• Products• Geography• Customer
• Shared Value Creation
3
FIRST QUARTER
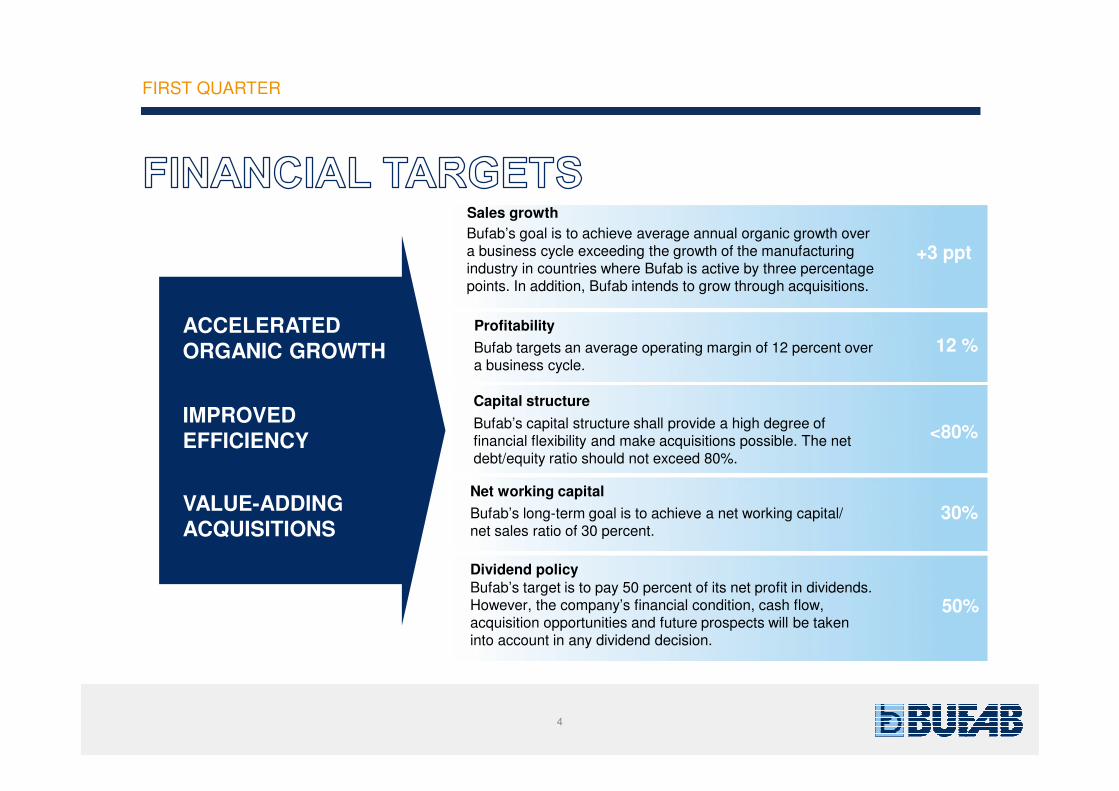
Sales growth
Bufab’s goal is to achieve average annual organic growth over a business cycle exceeding the growth of the manufacturing industry in countries where Bufab is active by three percentage points. In addition, Bufab intends to grow through acquisitions.
+3 ppt
Profitability
Bufab targets an average operating margin of 12 percent over a business cycle.
12 %
Capital structure
Bufab’s capital structure shall provide a high degree of financial flexibility and make acquisitions possible. The net debt/equity ratio should not exceed 80%.
<80%
Net working capital
Bufab’s long-term goal is to achieve a net working capital/ net sales ratio of 30 percent.
30%
Dividend policy
Bufab’s target is to pay 50 percent of its net profit in dividends. However, the company’s financial condition, cash flow, acquisition opportunities and future prospects will be taken into account in any dividend decision.
50%
ACCELERATED
ORGANIC GROWTH
IMPROVED
EFFICIENCY
VALUE-ADDING
ACQUISITIONS
4
FIRST QUARTER
� Stable result despite currency pressure
� Growth strategy continues to deliver - increased market shares
� Margins under pressure from currencies primarily in Sweden - actions to offset beginning to show result
� Good growth in International
� Acquisition of Flos BV
5
FIRST QUARTER
12 month rollingQuarter 1 Δ Full year Δ
SEK millions 2015 2014 % 2014/15 2014 %
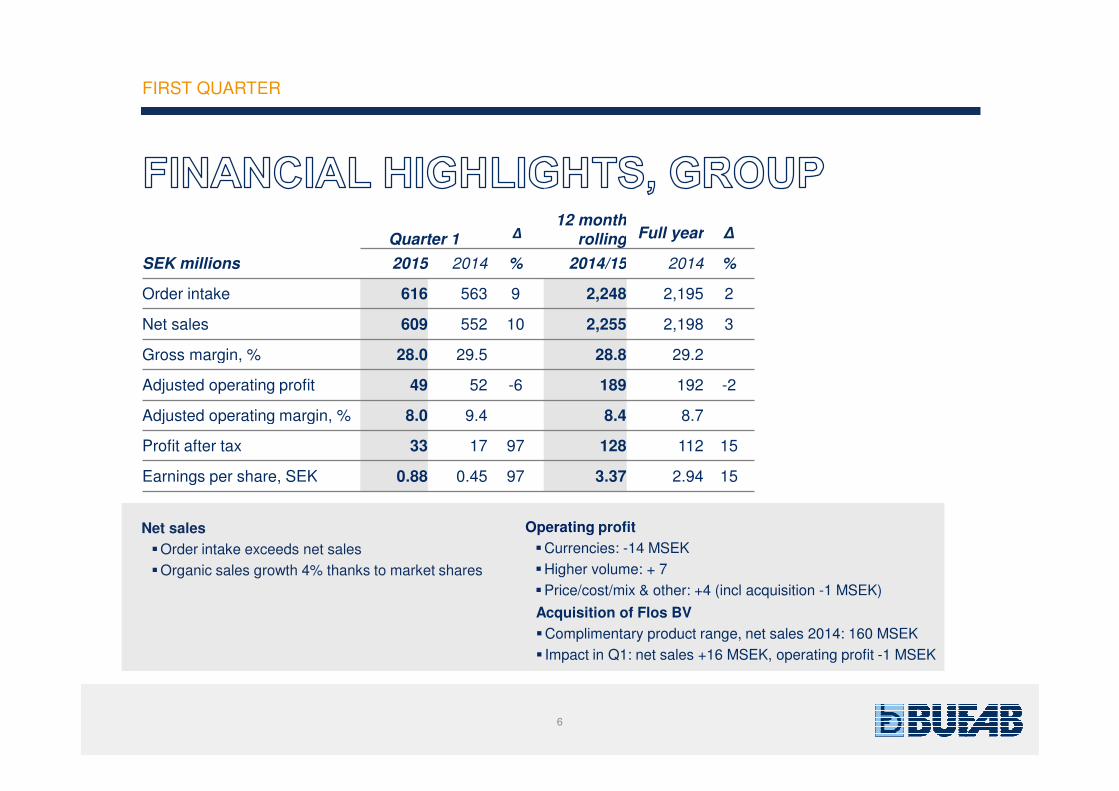
Order intake 616 563 9 2,248 2,195 2
Net sales 609 552 10 2,255 2,198 3
Gross margin, % 28.0 29.5 28.8 29.2
Adjusted operating profit 49 52 -6 189 192 -2
Adjusted operating margin, % 8.0 9.4 8.4 8.7
Profit after tax 33 17 97 128 112 15
Earnings per share, SEK 0.88 0.45 97 3.37 2.94 15
Net sales
�Order intake exceeds net sales
�Organic sales growth 4% thanks to market shares
Operating profit
�Currencies: -14 MSEK
�Higher volume: + 7
�Price/cost/mix & other: +4 (incl acquisition -1 MSEK)
Acquisition of Flos BV
�Complimentary product range, net sales 2014: 160 MSEK
� Impact in Q1: net sales +16 MSEK, operating profit -1 MSEK
6

FIRST QUARTER
-8
-1
6
4
10
8
6
2
4
-10
-5
0
5
10
15
Q12013
Q22013
Q32013
Q42013
Q12014
Q22014
Q32014
Q42014
Q12015
Quarterly organic year-on-year net sales growth, %*
7
*Adjusted for currency translation effects and acquisition
0
50
100
150
200
250
0
500
1000
1500
2000
2500
Q12013
Q22013
Q32013
Q42013
Q12014
Q22014
Q32014
Q42014
Q12015
MS
EK
LT
M N
et
sale
s, S
EK
mill
ions
LTM Net sales 12 M, MSEK LTM Adj Op Res, MSEK
FIRST QUARTER
12 month rolling
Quarter 1 Δ Δ
SEK millions 2015 2014 % 2014/15 2014 %
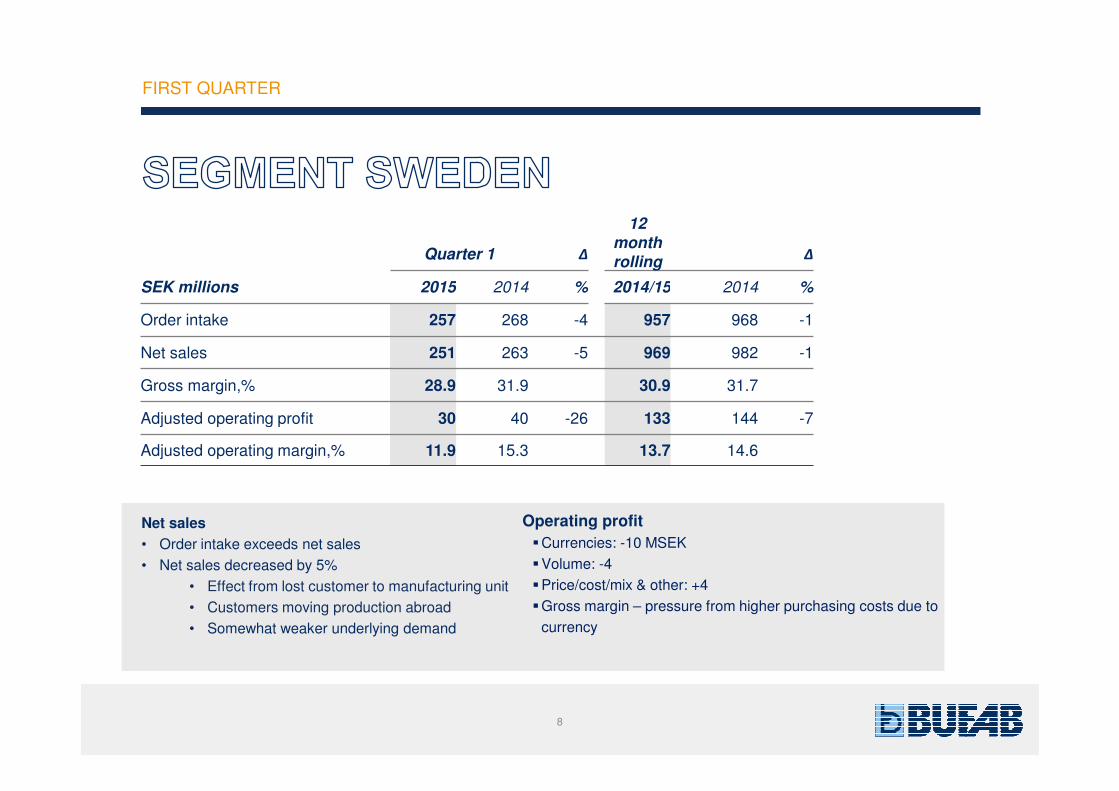
Order intake 257 268 -4 957 968 -1
Net sales 251 263 -5 969 982 -1
Gross margin,% 28.9 31.9 30.9 31.7
Adjusted operating profit 30 40 -26 133 144 -7
Adjusted operating margin,% 11.9 15.3 13.7 14.6
Net sales
• Order intake exceeds net sales
• Net sales decreased by 5%
• Effect from lost customer to manufacturing unit
• Customers moving production abroad
• Somewhat weaker underlying demand
Operating profit
�Currencies: -10 MSEK
�Volume: -4
�Price/cost/mix & other: +4
�Gross margin – pressure from higher purchasing costs due to
currency
8

FIRST QUARTER
-9
-6
-2
3
6
21
-6-5
-10
-5
0
5
10
15
Q12013
Q22013
Q32013
Q42013
Q12014
Q22014
Q32014
Q42014
Q12015
Quarterly year-on-year net sales growth, %
9
0
50
100
150
200
0
500
1000
1500
2000
Q12013
Q22013
Q32013
Q42013
Q12014
Q22014
Q32014
Q42014
Q12015
MS
EK
LT
M N
et
sale
s, S
EK
mill
ions
Net sales LTM, MSEK LTM Adj Op Res, MSEK
FIRST QUARTER
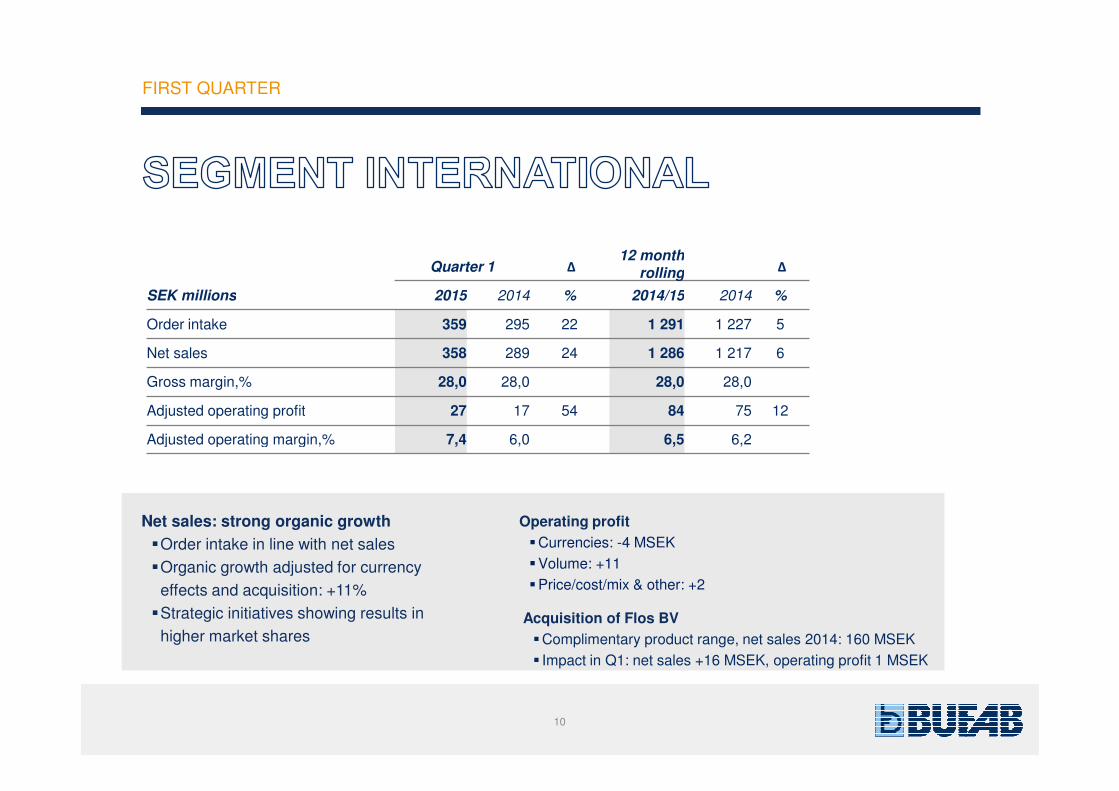
Net sales: strong organic growth
�Order intake in line with net sales
�Organic growth adjusted for currency
effects and acquisition: +11%
�Strategic initiatives showing results in
higher market shares
Operating profit
�Currencies: -4 MSEK
�Volume: +11
�Price/cost/mix & other: +2
Acquisition of Flos BV
�Complimentary product range, net sales 2014: 160 MSEK
� Impact in Q1: net sales +16 MSEK, operating profit 1 MSEK
10
12 month rollingQuarter 1 Δ Δ
SEK millions 2015 2014 % 2014/15 2014 %
Order intake 359 295 22 1 291 1 227 5
Net sales 358 289 24 1 286 1 217 6
Gross margin,% 28,0 28,0 28,0 28,0
Adjusted operating profit 27 17 54 84 75 12
Adjusted operating margin,% 7,4 6,0 6,5 6,2
FIRST QUARTER
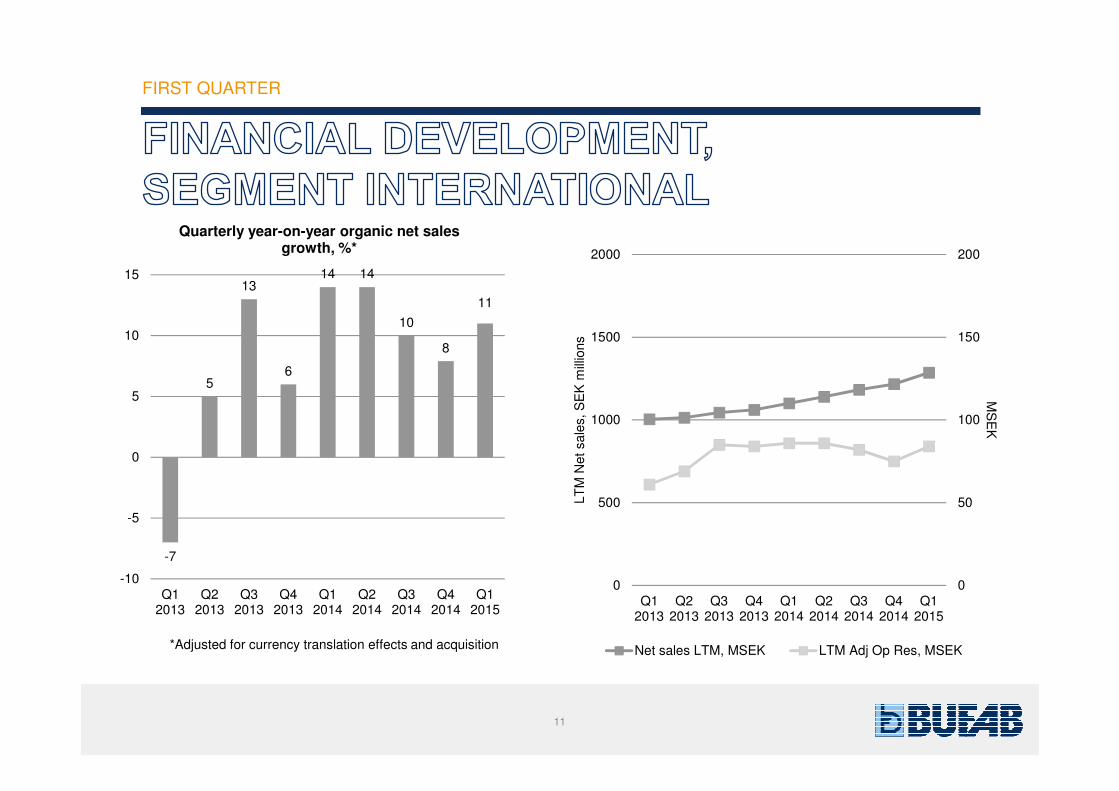
-7
5
13
6
14 14
10
8
11
-10
-5
0
5
10
15
Q12013
Q22013
Q32013
Q42013
Q12014
Q22014
Q32014
Q42014
Q12015
Quarterly year-on-year organic net sales growth, %*
*Adjusted for currency translation effects and acquisition
11
0
50
100
150
200
0
500
1000
1500
2000
Q12013
Q22013
Q32013
Q42013
Q12014
Q22014
Q32014
Q42014
Q12015
MS
EK
LT
M N
et
sale
s, S
EK
mill
ions
Net sales LTM, MSEK LTM Adj Op Res, MSEK
FIRST QUARTER
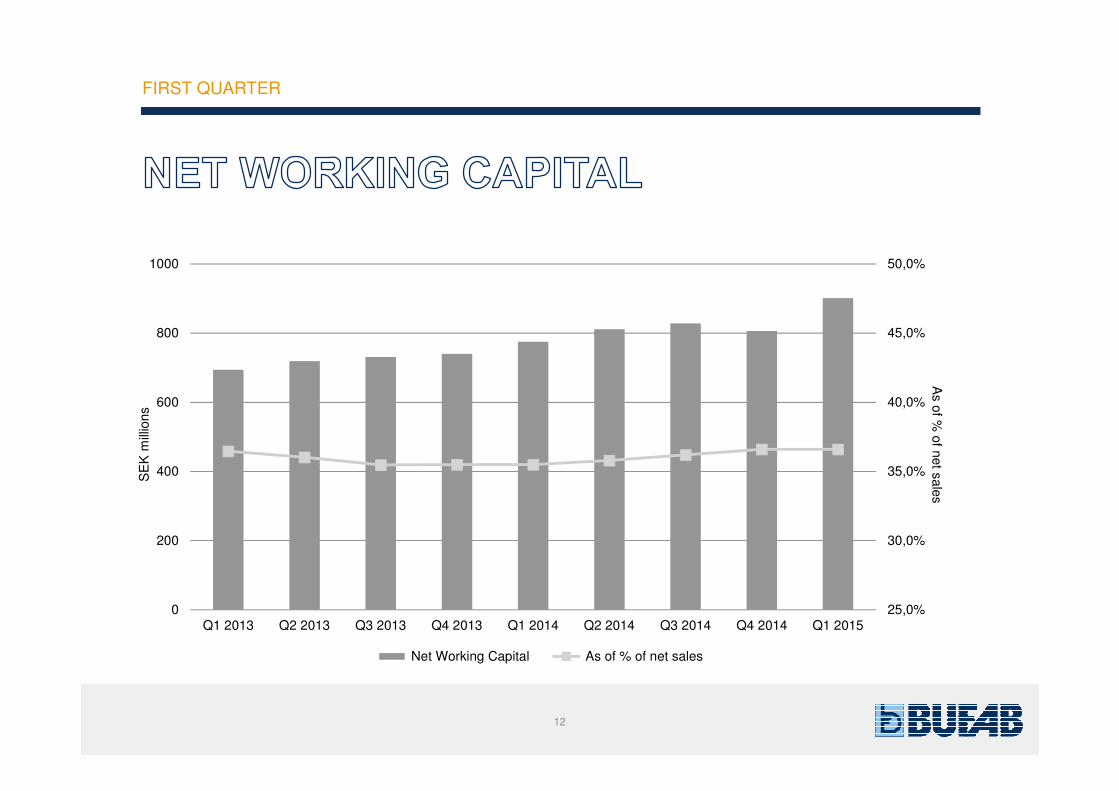
25,0%
30,0%
35,0%
40,0%
45,0%
50,0%
0
200
400
600
800
1000
Q1 2013 Q2 2013 Q3 2013 Q4 2013 Q1 2014 Q2 2014 Q3 2014 Q4 2014 Q1 2015
As o
f%
of
net
sale
s
SE
K m
illio
ns
Net Working Capital As of % of net sales
12
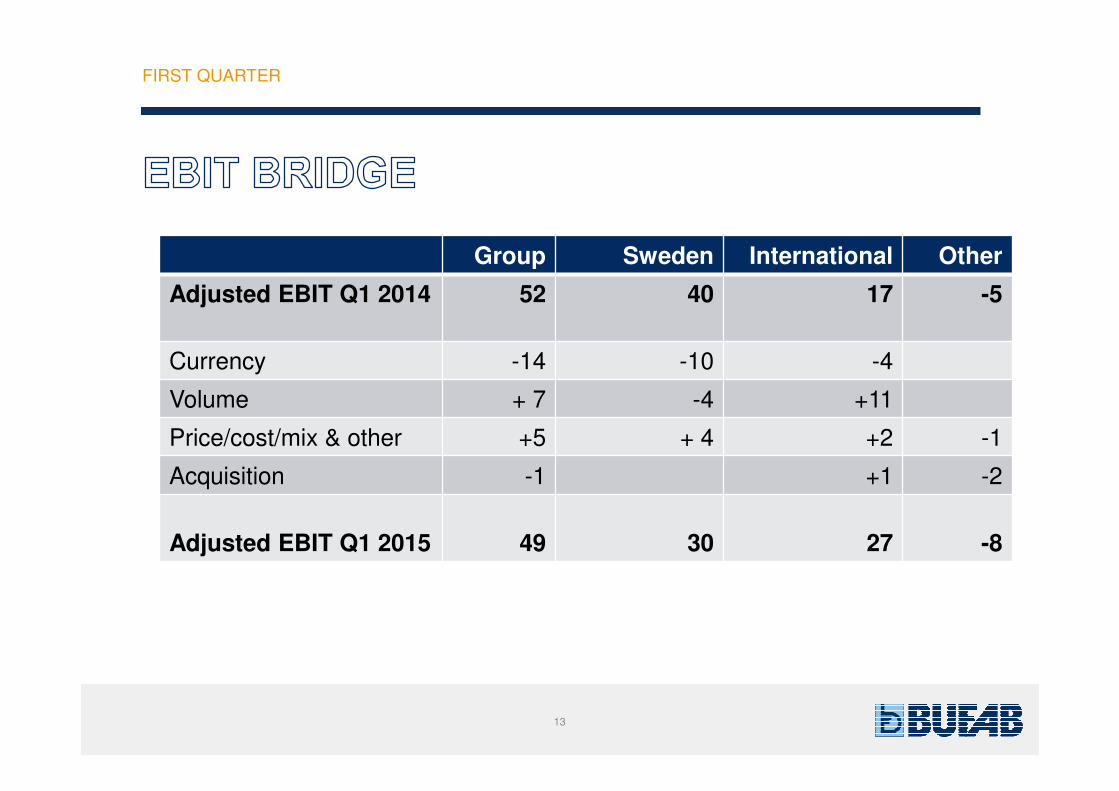
Group Sweden International Other
Adjusted EBIT Q1 2014 52 40 17 -5
Currency -14 -10 -4
Volume + 7 -4 +11
Price/cost/mix & other +5 + 4 +2 -1
Acquisition -1 +1 -2
Adjusted EBIT Q1 2015 49 30 27 -8
FIRST QUARTER
13
FIRST QUARTER
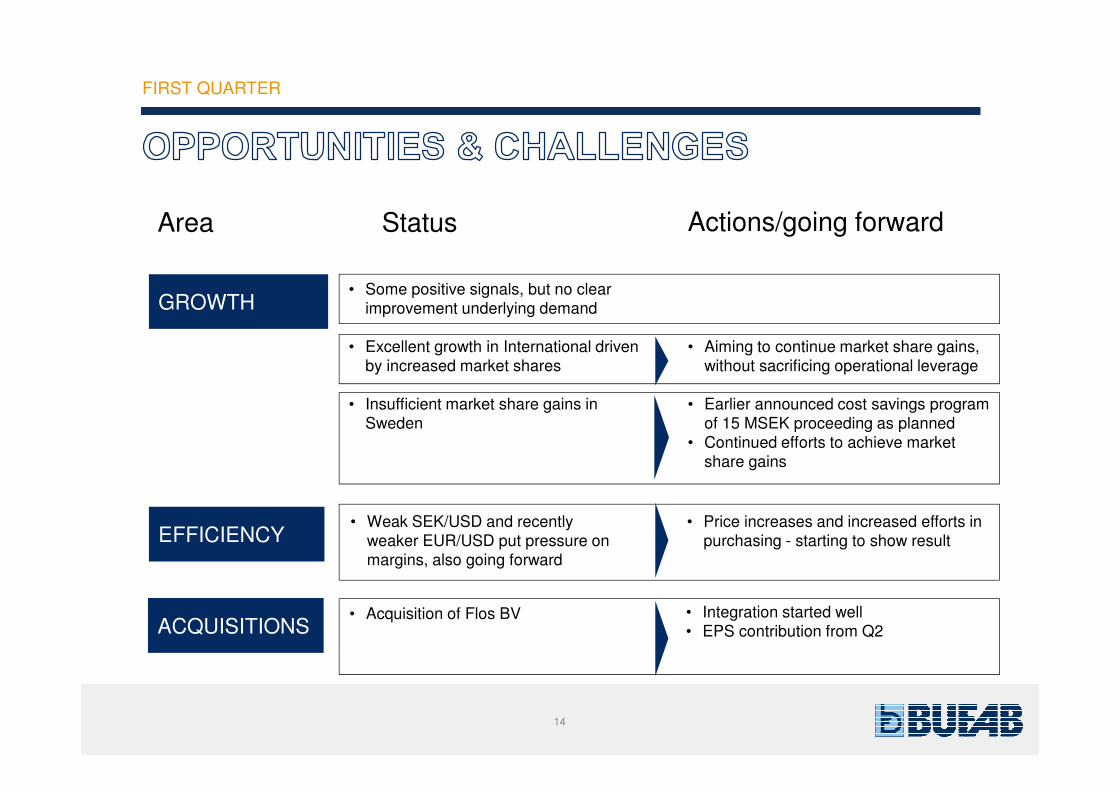
• Some positive signals, but no clear
improvement underlying demand
• Excellent growth in International driven
by increased market shares
• Insufficient market share gains in
Sweden
• Weak SEK/USD and recently
weaker EUR/USD put pressure on
margins, also going forward
• Acquisition of Flos BV
• Aiming to continue market share gains,
without sacrificing operational leverage
• Earlier announced cost savings program
of 15 MSEK proceeding as planned
• Continued efforts to achieve market
share gains
• Price increases and increased efforts in
purchasing - starting to show result
• Integration started well
• EPS contribution from Q2
14
Area Status Actions/going forward
GROWTH
EFFICIENCY
ACQUISITIONS