Embed Size (px)
Citation preview

Budget Briefing:Transportation
William Hamilton, Senior Fiscal Analyst
House Appropriations Subcommittee on Transportation
February 14, 2017

Briefing Topics
o Transportation Budget Overview
o Transportation Revenue Sources
o Transportation Appropriation Areas
o Transportation Revenue History
January 2017House Fiscal Agency 2

Transportation Budget Overview
January 2017House Fiscal Agency 3

FY 2016-17 TRANSPORTATION Budget
Fund Source Funding Description
Gross Appropriations $4,115,753,600 Total spending authority from all revenue sources
Interdepartmental
Grants (IDG) Revenue
4,013,400 Funds received by one state department from another state
department, usually for services provided
Adjusted Gross
Appropriations
$4,111,740,200 Gross appropriations excluding IDGs; avoids double counting
when adding appropriation amounts across budget areas
Federal Revenue 1,314,744,000 Federal grant or matching revenue; generally dedicated to
specific programs or purposes
Local Revenue 50,418,500 Revenue received from local units of government for state
services
Private Revenue 100,000 Revenue from individuals and private entities, including
payments for services, grants, and other contributions
State Restricted
Revenue
2,736,727,700 State revenue restricted by the State Constitution, state
statute, or outside restriction that is available only for
specified purposes; includes most fee revenue
State General
Fund/General Purpose
(GF/GP) Revenue
$9,750,000 Unrestricted revenue from taxes and other sources available
to fund basic state programs and other purposes determined
by the Legislature
January 2017House Fiscal Agency 4

Michigan's Transportation Budget
Michigan's $4.1 billion Transportation budget supports:
o State and local road and bridge programs
• Construction and preservation of the state trunkline highway system
• Funding for local road systems (83 road commissions and 533 cities and villages)
o Public transportation programs:
• Capital and operating assistance to 81 public transit agencies
• Capital and operating assistance for rail passenger service in Michigan
o Aeronautics programs
• Capital assistance to local airports through the federal Airport Improvement Program
o Administration of the Michigan Department of Transportation (MDOT)
January 2017House Fiscal Agency 5

Transportation Share of Total State Budget
Health and Human Services
$24,871,377,600 46%
School Aid$14,161,842,100
26%
Transportation$4,111,740,200
7%
Corrections$2,002,729,000
4%
Higher Education/ Community Colleges
$1,978,566,000 4%
Revenue Sharing$1,228,982,700
2%
Talent & Economic Development
$1,149,114,300 2%
Other Areas$4,715,329,600
9%
January 2017House Fiscal Agency 6
The Transportation budget represents approximately 8% of the $54.2 billion state
budget (adjusted gross) for FY 2016-17.

Transportation Share of Total GF/GP Budget
Health and Human Services
$4,392,732,800 44%
Corrections$1,951,957,900
19%
Higher Education/Community Colleges
$1,379,415,300 14%
State Police$405,162,800
4%
Debt Service/SBA Rent
$383,607,600 4%
School Aid/ Dept of Education
$218,900,000 2%
Transportation$9,750,000
0.1%Other Areas$1,359,972,900
13%
January 2017House Fiscal Agency 7
Transportation represents less than one-tenth of 1% of the state's $10.1 billion GF/GP
budget for FY 2016-17.

Transportation Gross Appropriations
$0
$500
$1,000
$1,500
$2,000
$2,500
$3,000
$3,500
$4,000
$4,500
$5,000
FY1997
FY1998
FY1999
FY2000
FY2001
FY2002
FY2003
FY2004
FY2005
FY2006
FY2007
FY2008
FY2009
FY2010
FY2011
FY2012
FY2013
FY2014
FY2015
FY2016
FY2017
Mill
ion
s
Restricted Federal GF/GP Other
January 2017House Fiscal Agency 8
Excluding temporary federal ARRA "stimulus" funds in FY 2008-09, total transportation
appropriations were relatively flat from FY 1997-98 through FY 2015-16. The increase in FY
2016-17 reflects additional revenue provided through the Road Funding Package passed
November 2015, and effective January 1, 2017, and an anticipated increase in federal aid.

Transportation Revenue Sources
January 2017House Fiscal Agency 9

FY 2016-17 Fund Sources
Federal$1,314,744,000
32%
State GF/GP$9,750,000
0%
State Restricted$2,736,727,700
67%
Private/Local/IDGs$54,531,900
1%
January 2017House Fiscal Agency 10
Roughly two-thirds of the $4.1 billion Transportation budget comes from state restricted
revenue – primarily motor fuel and vehicle registration taxes. Approximately one-third
comes from federal aid. State GF/GP represents less than one percent of this budget.
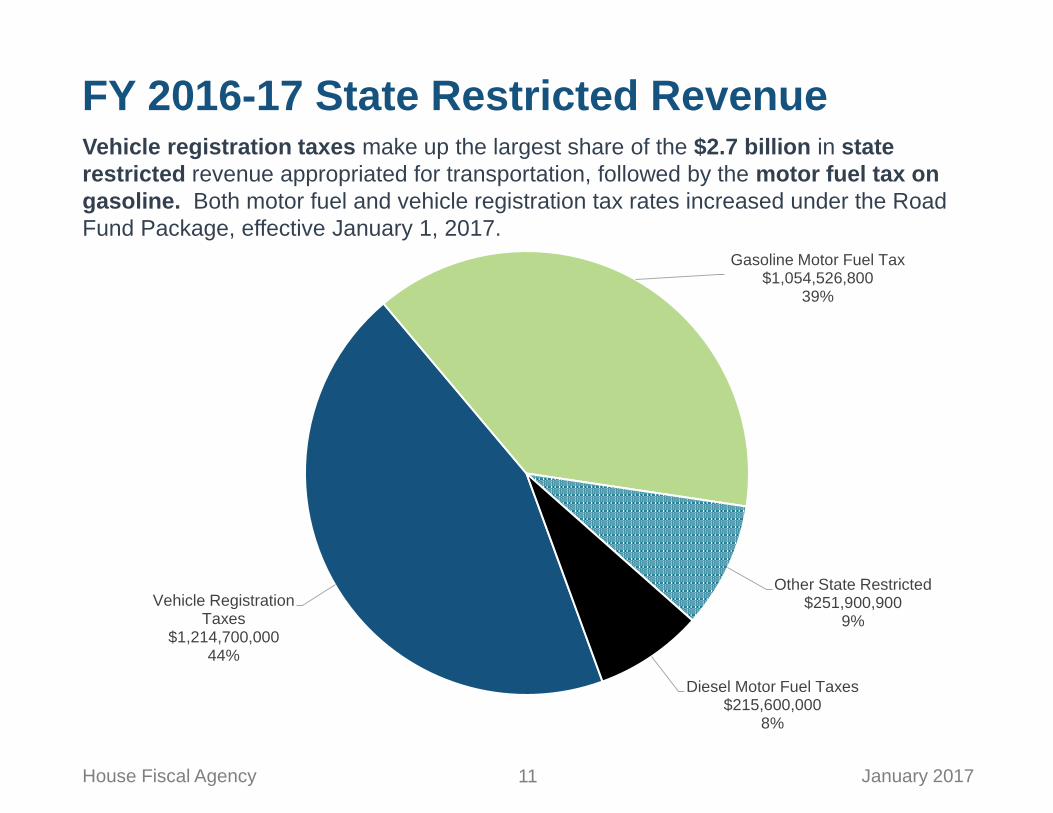
FY 2016-17 State Restricted Revenue
Vehicle Registration Taxes
$1,214,700,000 44%
Gasoline Motor Fuel Tax$1,054,526,800
39%
Other State Restricted$251,900,900
9%
Diesel Motor Fuel Taxes$215,600,000
8%
January 2017House Fiscal Agency 11
Vehicle registration taxes make up the largest share of the $2.7 billion in state
restricted revenue appropriated for transportation, followed by the motor fuel tax on
gasoline. Both motor fuel and vehicle registration tax rates increased under the Road
Fund Package, effective January 1, 2017.

Transportation - State Restricted Revenue
State restricted revenue in the Transportation budget is derived primarily from Motor Fuel and Vehicle Registration taxes. These taxes are constitutionally dedicated for transportation. By statute, Public Act 51 of 1951, they are credited to the Michigan Transportation Fund (MTF) and distributed according to Public Act 51.
o Motor Fuel Taxes
• The motor fuel tax on gasoline is 19 cents per gallon through December 31, 2016, and 26.3 cents per gallon effective January 1, 2017.
• The motor fuel tax on diesel fuel is 15 cents per gallon through December 31, 2016, and 26.3 cents per gallon effective January 1, 2017.
o Vehicle Registration Taxes
• Taxes on passenger car, truck, and trailer registrations are established in the Michigan Vehicle Code; increased effective January 1, 2017.
o The January 1, 2017 motor fuel and vehicle registration tax rate increases are the result of the Road Funding Package passed November, 2015.
January 2017House Fiscal Agency 12

Transportation - Federal Revenue
o Federal funds are made available to states through multi-year federal authorizing legislation; the current federal aid surface transportation program is Fixing America's Surface Transportation Act - the FAST Act.
• Federal motor fuel taxes dedicated to the federal Highway Trust Fund include the 18.4 cent per gallon federal gasoline tax
• Federal-aid available to the state is determined by federal law – there is nothing that state government can do to increase federal revenue to the state
• Federal funds are available for both state trunkline programs and local federal aid road projects.
• FAST Act surface transportation funds also provide capital grants to local public transit agencies and rail passenger programs
• Separate federal authorizing legislation provides funding for federal Airport Improvement Programs.
January 2017House Fiscal Agency 13

Transportation - Other Revenue
o The Transportation budget incudes $54.5 million in other revenue sources (Local, Private, IDGs). Local revenue is the largest of these other sources.
• Local revenue in the Transportation budget totals $50.4 million
• Local revenue shown in the budget recognizes the local cost share of local federal aid projects, the local share required on certain state trunkline projects, and local matching funds for federally funded transit projects and aeronautics capital projects
Note: Local units of government also raise additional local revenue for localtransportation programs – from county or township road millages, from city street millages, from transit millages, and from local agency general fund contributions for road and bridge or public transportation programs. This local revenue is not included in the state transportation budget.
January 2017House Fiscal Agency 14

Transportation - GF/GP Revenue
o Prior to FY 2011-12, GF/GP revenue had not been used in Transportationbudget since FY 2001-02 (as part of the Build Michigan III program).
o During five fiscal years, FY 2011-12 through FY 2015-16, Transportation appropriations included a total of $1.3 billion in direct and indirect GF/GP funding, including $402.0 million in FY 2015-16.
o The FY 2016-17 Transportation budget includes $9.75 million of state GF/GP spending authority – all for one-time designated projects.
January 2017House Fiscal Agency 15

Transportation Appropriation Areas
January 2017House Fiscal Agency 16

Transportation Appropriation Areas
o State and local road and bridge programs
o Public transportation programs:
o Aeronautics programs
January 2017House Fiscal Agency 17

FY 2016-17 Gross Appropriations
January 2017House Fiscal Agency 18
There are three major program areas in the $4.1 billion Transportation budget: Road
and bridge programs – including funds distributed to local road agencies – represent
approximately 86% of the budget; public transportation programs, 11%; and
aeronautics programs, 3%.
Road and Bridge Programs
$3,541,423,500 86%
Public Transportation Programs
$453,808,400 11%
Aeronautics Programs$120,521,700
3%

FY 2016-17 Appropriation Detail
January 2017House Fiscal Agency 19
The three major program areas are shown in more detail below. Note that debt service,
services provided by other state departments, and MDOT administrative/ planning
functions are related to all three major program areas.
Local Road Agencies$1,611,899,500
39%
State Trunkline Capital Construction
$1,080,985,20026%
State Trunkline Maintenance$303,948,000
8%
Administration/Planning$286,787,800
7%
Debt Service$237,925,300
6%
Local Bus Operating$212,277,900
5%
Other Public Transportation$220,111,400
5%
Aeronautics$114,497,800
3%
Other State Depts
$47,320,7001%

Road and Bridge Programs
o $3.5 billion, or 86%, of the FY 2016-17 transportation budget is appropriated for state and local road and bridge programs:
• $1.9 billion for state trunkline programs administered by MDOT
• $1.6 billion for local road agencies (county road commissions, cities, and villages)
o MDOT has jurisdiction over state trunkline highways, including interstate highways – generally the busiest roads and streets with statewide purpose
o Local road agencies have jurisdiction over county roads and municipal streets.
o Road and bridge program funds are distributed according to Public Act 51 of 1951 (Act 51)
January 2017House Fiscal Agency 20
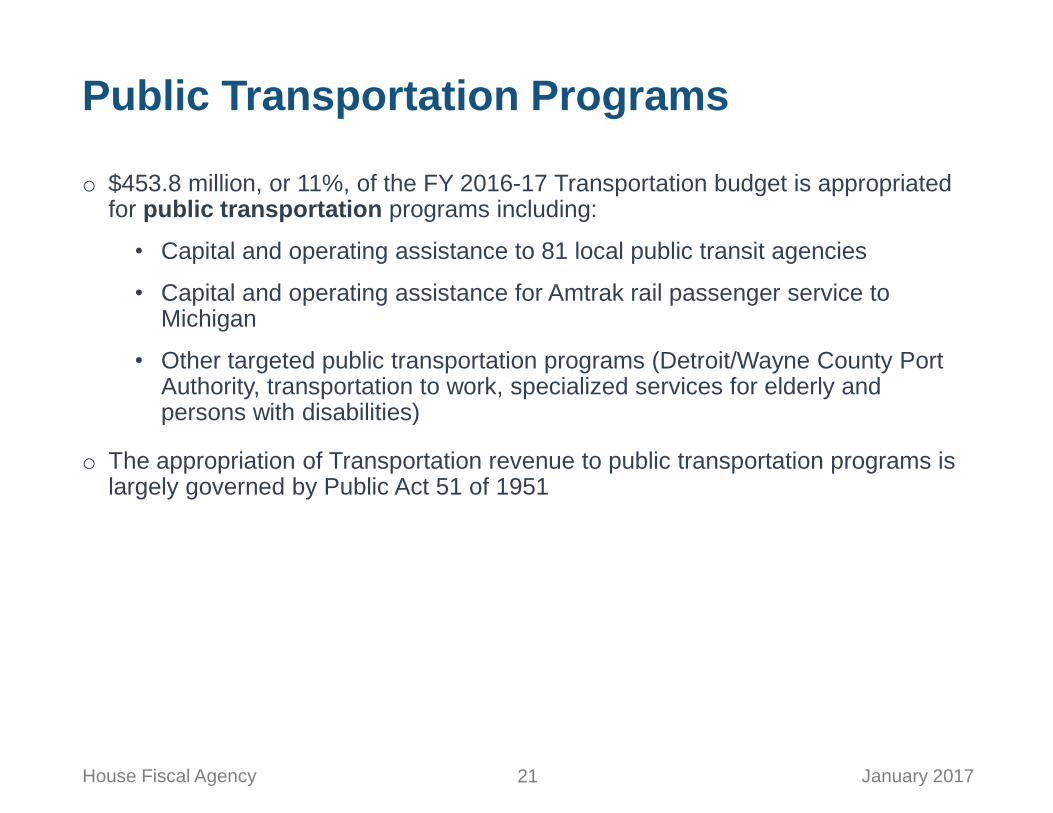
Public Transportation Programs
o $453.8 million, or 11%, of the FY 2016-17 Transportation budget is appropriated for public transportation programs including:
• Capital and operating assistance to 81 local public transit agencies
• Capital and operating assistance for Amtrak rail passenger service to Michigan
• Other targeted public transportation programs (Detroit/Wayne County Port Authority, transportation to work, specialized services for elderly and persons with disabilities)
o The appropriation of Transportation revenue to public transportation programs is largely governed by Public Act 51 of 1951
January 2017House Fiscal Agency 21

Aeronautics Programs
o $120.5 million, or 3%, of the FY 2016-17 budget appropriated for Aeronauticsprograms including $97.8 million federal Airport Improvement Program
• Airport Improvement Program supports capital improvements at locally owned public airports
• Aeronautics programs are governed by the State Aeronautics Code
January 2017House Fiscal Agency 22

FY 2016-17 Gross Appropriations
January 2017House Fiscal Agency 23
Approximately half of the $4.1 billion Transportation budget is appropriated for local
agency programs including funds distributed or made available to local road agencies,
local public transit agencies, or locally owned public airports.
State Programs2,095,417,100
51%
Local Programs2,020,336,500
49%

Transportation Revenue History
January 2017House Fiscal Agency 24
Michigan Transportation Fund (MTF) Revenue/Distribution
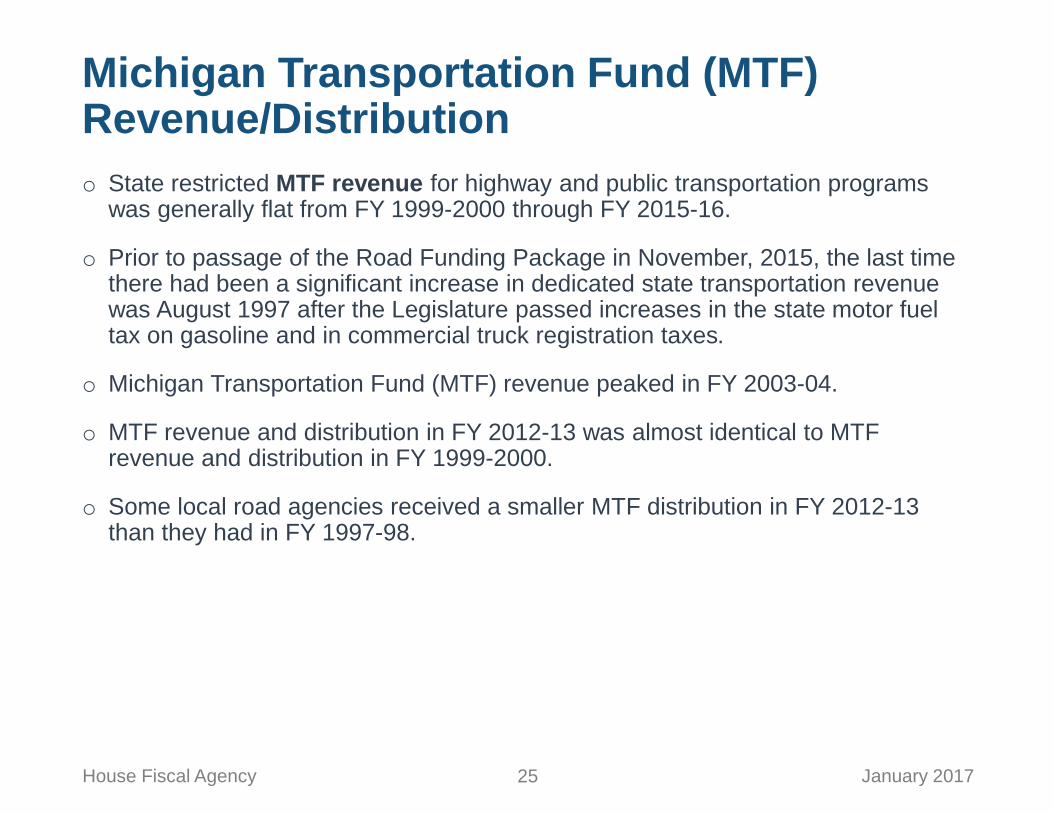
o State restricted MTF revenue for highway and public transportation programs was generally flat from FY 1999-2000 through FY 2015-16.
o Prior to passage of the Road Funding Package in November, 2015, the last time there had been a significant increase in dedicated state transportation revenue was August 1997 after the Legislature passed increases in the state motor fuel tax on gasoline and in commercial truck registration taxes.
o Michigan Transportation Fund (MTF) revenue peaked in FY 2003-04.
o MTF revenue and distribution in FY 2012-13 was almost identical to MTF revenue and distribution in FY 1999-2000.
o Some local road agencies received a smaller MTF distribution in FY 2012-13 than they had in FY 1997-98.
January 2017House Fiscal Agency 25

MTF Revenue History
$1,893 $2,052 $1,894
$0
$500
$1,000
$1,500
$2,000
$2,500
$3,000
FY1997
FY1998
FY1999
FY2000
FY2001
FY2002
FY2003
FY2004
FY2005
FY2006
FY2007
FY2008
FY2009
FY2010
FY2011
FY2012
FY2013
FY2014
FY2015
FY2016
FY2017
Mill
ion
s
MTF Revenue
January 2017House Fiscal Agency 26
Except for a one-time spike in FY 2003-04, MTF revenue was relatively flat from FY
1998-99 through FY 2015-16. The increase in FY 2016-17 reflects the estimated impact
of the Road Funding Plan, effective January 1, 2017.

MTF Revenue Fund Source History
$938.9
$872.9
$157.0 $137.6
$978.5 $972.2
$0
$200
$400
$600
$800
$1,000
$1,200
$1,400
FY1997
FY1998
FY1999
FY2000
FY2001
FY2002
FY2003
FY2004
FY2005
FY2006
FY2007
FY2008
FY2009
FY2010
FY2011
FY2012
FY2013
FY2014
FY2015
FY2016
FY2017
Mill
ion
s
State $.19/gal Gasoline Tax State Diesel Fuel Taxes Vehicle Registration Taxes
January 2017House Fiscal Agency 27
Vehicle registration taxes are the largest source of MTF revenue, followed by the motor
fuel tax on gasoline. The increase in FY 2016-17 in both vehicle registration and motor
fuel taxes reflect estimated impact of the Road Funding Plan, effective January 1, 2017.

MTF Distribution History
0
100
200
300
400
500
600
700
800
900
1,000
FY1997
FY1998
FY1999
FY2000
FY2001
FY2002
FY2003
FY2004
FY2005
FY2006
FY2007
FY2008
FY2009
FY2010
FY2011
FY2012
FY2013
FY2014
FY2015
FY2016
FY2017
Mill
ion
s
STF Counties Cities/Villages CTF
January 2017House Fiscal Agency 28
Except for a one-time spike in FY 2003-04, the MTF distribution to major MTF recipients
- the State Trunkline Fund, local road agencies, the Comprehensive Transportation Fund
(CTF) - was relatively flat from FY 1998-99 through FY 2015-16. The increase in FY
2016-17 reflects the Road Funding Plan, effective January 1, 2017.

Road Funding Package
o In November, 2015, the Legislature passed a 7-bill package of bills, including bills to increase motor fuel and vehicle registration taxes effective January 1, 2017.
o The Road Funding Package is estimated to generate approximately $464.5 million in additional MTF revenue in the first fiscal year of implementation (partial FY 2016-17).
o The Road Funding Package also included a redirection of income tax revenue from the state General Fund to transportation programs beginning in the 2018-19 fiscal year.
o Once fully implemented in FY 2020-21, the Road Funding Package is expected to generate approximately $1.2 billion in additional revenue for transportation programs, of which, $638 million would be new revenue from increases in motor fuel and vehicle registration taxes, and $600 million would be from redirection of state General Fund revenue made in the Income Tax Act.
o Although the Road Funding Package would redirect to the MTF certain income tax revenue currently credited to the state General Fund, direct state GF/GP appropriations for transportation would likely end. The FY 2015-16 Transportation budget included $400.0 million GF/GP. The FY 2016-17 budget includes $9.75 million in GF/GP spending authority.
January 2017House Fiscal Agency 29

Pavement Condition/Revenue
o In 1997, the State Transportation Commission established state trunkline pavement performance goals of 85% of non-freeway pavement and 95% of freeway payment in "good" condition by 2007
o In 1998, the State Transportation Commission established state trunkline bridge performance goals of 85% of non-freeway bridges and 95% of freeway bridges in "good" condition by 2008
o MDOT met these performance goals in 2007 but did not have sufficient revenue to sustain the performance goals
o MDOT has estimated it would require a $15.0 billion total investment in the state trunkline pavement preservation program over 10-year period in order to meet and sustain the 90% good pavement goal – an average of $1.5 billion per year. MDOT’s budgeted investment in its pavement preservation program is only $600 million per year through 2025 – an annual shortfall of $900 million.
o Estimated revenue shortfall is exclusive of other program needs such as bridge preservation program, capacity, safety, and economic development.
January 2017House Fiscal Agency 30

State Trunkline Combined Freeway/Non-FreewayHistoric RSL Pavement Condition
73%71%
75% 75%
79%
82%
86%
89%
92% 92% 91% 91%89%
87% 86% 85% 84%
30%
40%
50%
60%
70%
80%
90%
100%
1999 2000 2001 2002 2003 2004 2005 2006 2007 2008 2009 2010 2011 2012 2013 2014 2015
% G
oo
d/F
air
Historic
Goal
January 2017House Fiscal Agency 31
Source: Michigan Department of Transportation, Bureau of Planning
September 2016

State Trunkline Combined Freeway/Non-FreewayProjected RSL Pavement Condition
84%
80%
74%
67%
60%
54%
50%48% 48% 48%
46%
30%
40%
50%
60%
70%
80%
90%
100%
2015 2016 2017 2018 2019 2020 2021 2022 2023 2024 2025
% G
oo
d/F
air
Projected
January 2017House Fiscal Agency 32
Source: Michigan Department of Transportation, Bureau of Planning
September 2016

Local Road AgencyFederal-aid System Condition
o Local road agencies have experienced similar revenue constraints and pavement
condition deterioration.
o The reported condition of the local road system – the system under the
jurisdiction of county road commissions, cities, and villages – has also been
falling. As reported in annual reports of the Transportation Asset Management
Council, between 2006 and 2013 the number of local road miles in poor condition
increased and the number of local road miles in good or fair condition decreased.
October 2016House Fiscal Agency 33

Michigan Department of TransportationAverage Annual Classified EmployeesFY 1990-91 – FY 2015-16
October 2016House Fiscal Agency 34
3,868
3,708
3,569 3,524 3,551 3,515
3,312
2,960
3,1963,244 3,253
3,185
2,826
2,9562,849 2,880 2,895 2,854 2,892
2,844
2,639 2,6372,570 2,573 2,570 2,600
0
500
1,000
1,500
2,000
2,500
3,000
3,500
4,000
4,500
FY1991
FY1992
FY1993
FY1994
FY1995
FY1996
FY1997
FY1998
FY1999
FY2000
FY2001
FY2002
FY2003
FY2004
FY2005
FY2006
FY2007
FY2008
FY2009
FY2010
FY2011
FY2012
FY2013
FY2014
FY2015
FY2016

For more information about theTransportation budget:
January 2017House Fiscal Agency 35
HFA Resources
http://www.house.mi.gov/hfa/Transportation.asp
Contact Information
William E. Hamilton
Senior Fiscal Analyst
(517) 373-8080