Embed Size (px)
Citation preview

Agency Resourcing Budget Paper No. 4
2015-16
Circulated by
Senator the Honourable Mathias Cormann Minister for Finance of the Commonwealth of Australia
For the information of honourable members on the occasion of the Budget 2015-16
12 May 2015

© Commonwealth of Australia 2015
ISSN 0728 7198 (print)
This publication is available for your use under a Creative Commons BY Attribution 3.0 Australia licence, with the exception of the Commonwealth Coat of Arms, third party content and where otherwise stated. The full licence terms are available from http://creativecommons.org/licenses/by/3.0/au/legalcode.
Use of Commonwealth of Australia material under a Creative Commons BY Attribution 3.0 Australia licence requires you to attribute the work (but not in any way that suggests that the Commonwealth of Australia endorses you or your use of the work).
Commonwealth of Australia material used ‘as supplied’.
Provided you have not modified or transformed Commonwealth of Australia material in any way including, for example, by changing the Commonwealth of Australia text; calculating percentage changes; graphing or charting data; or deriving new statistics from published statistics — then the Commonwealth of Australia prefers the following attribution:
Source: The Commonwealth of Australia.
Derivative material
If you have modified or transformed Commonwealth of Australia material, or derived new material from those of the Commonwealth of Australia in any way, then the Commonwealth of Australia prefers the following attribution:
Based on Commonwealth of Australia data.
Use of the Coat of Arms
The terms under which the Coat of Arms can be used are set out on the It’s an Honour website (see www.itsanhonour.gov.au).
Other uses
Enquiries regarding this licence and any other use of this document are welcome at:
Manager Communications and Public Affairs Department of Finance King Edward Terrace Parkes ACT 2600 Email: [email protected]
Internet
A copy of this document is available on the central Budget website at: www.budget.gov.au.
Printed by CanPrint Communications Pty Ltd.

CONTENTS
PREFACE ............................................................................................................. 1
INTRODUCTION AND GUIDE TO BUDGET PAPER NO. 4 ........................................... 6
PART 1: AGENCY FINANCIAL RESOURCING ......................................................... 13 Overview of the Agency resourcing table ..................................................................... 16 Overview of the Special appropriations table ................................................................ 86 Overview of the Special accounts table ........................................................................ 99
PART 2: STAFFING OF AGENCIES ..................................................................... 127
PART 3: EXPENSES AND NET CAPITAL INVESTMENT ......................................... 143
APPENDIX A: AGENCY OUTCOME STATEMENTS ................................................. 151

iv
ACRONYMS AND DEFINED TERMS
AAO Administrative Arrangements Order
Agency/entity has the same meaning as corporate Commonwealth entity and non-corporate Commonwealth entity within the Public Governance, Performance and Accountability Act 2013
ASL average staffing level
CRF Consolidated Revenue Fund
Finance Minister Minister for Finance
GGS General Government Sector
MoG machinery of government
PGPA Act Public Governance, Performance and Accountability Act 2013

1
PREFACE
In 2015-16 Australian Government agencies will have responsibility for administering approximately $434.5 billion in expenses.
The Government will continue to progress its Smaller Government reform agenda, to ensure those government agencies are the most efficient and effective they can be, by transforming and modernising the public service while eliminating waste and duplication.
Budget Paper No. 4 sets out the funding for agencies, their funding sources and the purposes of that funding under the Outcome statements as agreed for each agency in the General Government Sector.1
Additionally, information is provided on the staffing of agencies delivering services to the Australian community. Taken together, the information in Budget Paper No. 4 shows the way resources are used across government.
While Australia has a long history of innovation in public sector management, the Government has been and continues to pursue a particular reform effort aimed at streamlining our systems of public administration.
This will help ensure Australia is better able to cope with the economic and demographic challenges ahead. Specifically, the Government’s public sector reforms are delivering greater value to taxpayers through better services, delivered faster and at a lower cost. It is a central part of the Government’s plans to put Australia on a stronger foundation for the future.
TRANSFORMING GOVERNMENT
The Government is methodically examining all parts and aspects of the public sector, from the functions of agencies to how they operate and are structured. Further specific reforms in the 2015-16 Budget are making a material contribution to budget repair, while improving the responsiveness and effectiveness of government.
Key elements of the Government’s ongoing Smaller Government reforms include:
• Reducing the size of the Commonwealth public service. In 2015-16, total staffing in the General Government Sector is expected to fall below levels last recorded in 2006-07. Further information on the size of the public sector is covered in Part 2: Staffing of Agencies.
1 Government departments and agencies that provide non-market public services and are
funded mainly through taxes (2015-16 Budget, Budget Paper No. 1, Statement 9, Appendix A).

Preface
2
• Public sector wage restraint. Over the past decade, Commonwealth public servants received annual median wage increases totalling 42 per cent, well above CPI increases of 28 per cent over the same period. This included strong wage rises through the Global Financial Crisis, when private sector wage growth and employment were both lower. Future wage rises will be offset by productivity gains, to ensure that they are affordable, sustainable and in line with community expectations.
• Functional and Efficiency Reviews. In the months preceding the Budget, the Government commissioned two independent reviews to consider the functions and the efficiency of the Departments of Health and Education and Training. These in-depth reviews are the pilots for a rollout of reviews to determine whether the current functions of all departments and large agencies are aligned with the Government’s policy priorities and whether they are working as efficiently as possible. In response to the review of the Department of Health, the Government will achieve net savings of $96 million through efficiencies in contracting, corporate, staff and property costs, which better align departmental functions with the Government’s strategic objectives. Reforms in the Department of Education and Training to implement recommendations from its review will achieve savings of $131 million by ceasing and redesigning programmes which are not sufficiently consistent with the Government’s core priorities and national strategic policy settings for education; $7.6 million of these savings are in the operations of the department. Further recommendations from the Education and Training review will be considered after the Budget, focused on the administrative costs of the department. In 2015-16 further Functional and Efficiency Reviews will be undertaken into the Departments of Agriculture, the Environment, Foreign Affairs and Trade, Treasury, Attorney-General’s and Social Services, as well as the Australian Taxation Office and the Australian Bureau of Statistics.
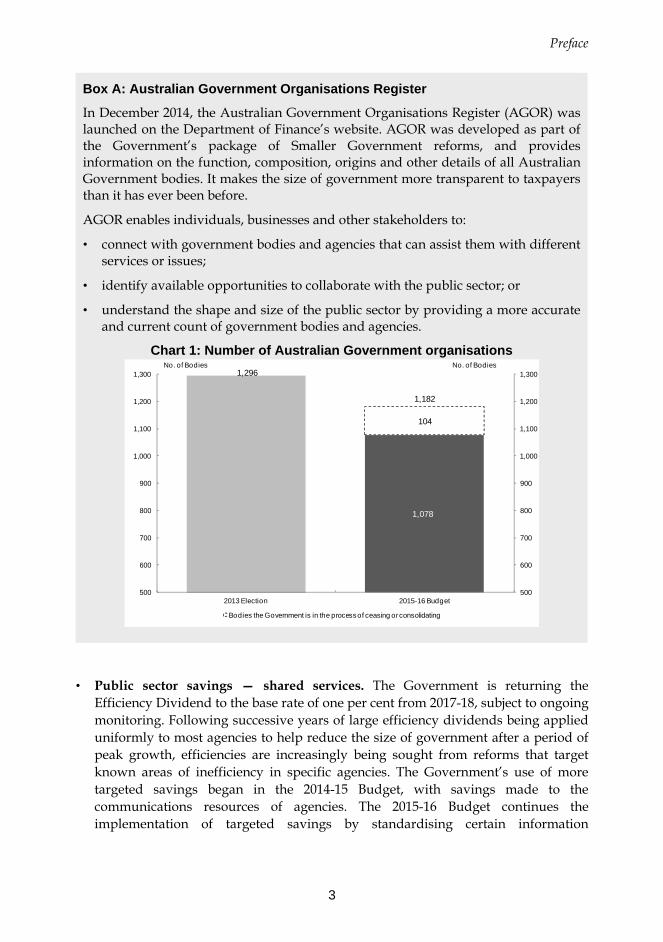
• Streamlining Government bodies. Complementing this examination of public sector functions, the Government is delivering the fourth phase of its Smaller Government reforms to address the shape and size of government. The 2015-16 Budget will reduce the number of government bodies by a further 35, bringing planned reductions to 286 since the 2013 election. Box A shows the impact of all reductions on the number of government bodies that have been implemented as well as anticipated reductions as a result of decisions taken by the Government. A smaller number of government bodies will help clarify lines of accountability, and make the public sector more agile and better able to address changing pressures and Government priorities. The Smaller Government announcements in the 2015-16 Budget will deliver $497.0 million in savings (including savings from the Functional and Efficiency Reviews of the Departments of Health and Education and Training and further efficiencies in the Attorney-General’s Department and the Department of Immigration and Border protection). This will take total savings from the Government’s Smaller Government agenda to $1.4 billion.
Preface
3
Box A: Australian Government Organisations Register
In December 2014, the Australian Government Organisations Register (AGOR) was launched on the Department of Finance’s website. AGOR was developed as part of the Government’s package of Smaller Government reforms, and provides information on the function, composition, origins and other details of all Australian Government bodies. It makes the size of government more transparent to taxpayers than it has ever been before.
AGOR enables individuals, businesses and other stakeholders to:
• connect with government bodies and agencies that can assist them with different services or issues;
• identify available opportunities to collaborate with the public sector; or
• understand the shape and size of the public sector by providing a more accurate and current count of government bodies and agencies.
Chart 1: Number of Australian Government organisations
• Public sector savings — shared services. The Government is returning the Efficiency Dividend to the base rate of one per cent from 2017-18, subject to ongoing monitoring. Following successive years of large efficiency dividends being applied uniformly to most agencies to help reduce the size of government after a period of peak growth, efficiencies are increasingly being sought from reforms that target known areas of inefficiency in specific agencies. The Government’s use of more targeted savings began in the 2014-15 Budget, with savings made to the communications resources of agencies. The 2015-16 Budget continues the implementation of targeted savings by standardising certain information
1,182
104
1,296
500
600
700
800
900
1,000
1,100
1,200
1,300
500
600
700
800
900
1,000
1,100
1,200
1,300
2013 Election 2015-16 Budget
No. of BodiesNo. of Bodies
Bodies the Government is in the process of ceasing or consolidating
1,078

Preface
4
technology and related business processes, known as Enterprise Resource Planning Systems. This saving is apportioned among agencies to take account of the relative opportunity for more efficient arrangements in different agencies. Similarly, software licensing will also be purchased on a more coordinated basis.
• Opening government business activities to fair competition. Consistent with the Smaller Government agenda, scoping studies have been commissioned into the future ownership options of a number of government businesses. Scoping studies provide information and recommendations to assist the Government’s decision-making on how key services are best delivered in future. Scoping studies examine the industries in which agencies operate, and assess the capacity of other providers to offer new technology, innovative service models or new sources of investment. Following a thorough scoping study looking at the Australian Securities and Investments Commission (ASIC) Registry, the Government will undertake a competitive tender process over the next 12 to 18 months, to market test the capacity of a private provider to upgrade and operate the ASIC Registry and offer value-added products.
• A more rational property portfolio. The Government has also announced an approach to market to test investor interest in the long term lease and upgrade of four ageing properties within the parliamentary triangle. The Government’s wider property portfolio will be further rationalised, to ensure that every property the Commonwealth owns is appropriate to its expected needs. Significant public money is currently locked up in surplus Commonwealth property holdings, which includes several blocks and facilities that are no longer used by the public sector and not maintained at an appropriate level. There are significant maintenance and opportunity costs associated with continued ownership of these surplus properties and the Government will continue to progress divestment in an orderly fashion where appropriate.
• Reducing vacant lease holdings. The Government is reviewing its current leases to ensure that those identified as surplus to requirements are promptly filled where they can be. Priority is being given to a strategy to reduce surplus office space in the Australian Capital Territory, with vacancies filled by agencies identified as having similar requirements and upcoming lease expiry dates. Large vacant legacy leases which were previously regarded as problems for individual agencies will be handled through a responsible whole-of-government approach. Initial analysis reveals that there is scope to save up to $200 million over 10 years through this initiative.
• Digital innovation. The Government’s Digital Transformation Agenda will improve the experience of individuals and business when transacting with government. The community expects that the public sector will provide personalised services that offer greater choice in how services are accessed, while removing red tape and inefficiency.

Preface
5
• Streamlined and targeted programme delivery. The Government is eliminating wasteful fragmentation in service delivery and removing unnecessary complexity in rules, which undermine policy effectiveness. In the 2015-16 Budget, the skilled migration and temporary activity visa programme will be simplified by consolidating the number of visa categories. In 2014-15 over 150 Indigenous programmes were streamlined into five broad programme categories, to improve their focus and coordination and to reduce the red tape burden on service delivery organisations that partner with government. Similar reforms in the Social Services portfolio have streamlined 18 grants programmes into seven, thereby reducing reporting burdens for providers. Additionally, grants administration in the Department of Health has been consolidated into a single division, to promote the development of expertise and more efficient delivery across all stages of the grant life cycle.
• Sensible risk management. The Government has implemented a streamlined and risk-based approach to the governance of the public sector by implementing the Public Governance and Performance Act 2013 (PGPA Act) and introducing more consistent practices across approximately 250 Acts that govern Australian Government bodies. The new rules require public officials to sensibly manage risk, rather than over-invest in unrealistic efforts at risk elimination. This will support a shift away from regulatory frameworks which are excessively prescriptive and out of step with commercial reality. Further reforms are underway, focusing on improving the performance, evaluation and transparency of the public sector.
• User pays where appropriate. The Government is also introducing a charging framework from 1 July 2015 which will improve consistency in charging for government activities. The framework will lead to additional revenue to support Budget repair and other policy priorities. It will also assist particular agencies to be more responsive to user demand. The charging framework will promote greater fairness, involving charging those who create demand for certain government services and other activities, while preserving the Government’s central role of delivering quality public-benefit programmes in ways that do not adversely impact disadvantaged groups.
The Government’s Smaller Government reform agenda is already delivering results, with the Commonwealth public sector becoming more efficient and responsive. However there is more work to be done to ensure changing community needs are better met than they have been before. Transforming Government is about making the public dollar go further in creating public value where it is needed and matters most.
Senator the Hon Mathias Cormann Minister for Finance

Introduction and Guide
6
INTRODUCTION AND GUIDE TO BUDGET PAPER NO. 4
The purpose of Budget Paper No. 4 is to provide a whole-of-government view of estimated resourcing managed in the Budget year by agencies in the General Government Sector (GGS). The resources included are financial resources, staff resources, expenses and net capital investment. The Paper is not law and therefore, does not authorise appropriations.
The paper contains three main parts with tables of information as follows:
Part 1 Agency financial resourcing
1.1 Agency resourcing table 1.2 Special appropriations table 1.3 Special accounts table
Part 2 Staffing of agencies
Part 3 Agency expenses and net capital investment
3.1 Departmental expenses table 3.2 Net capital investment table
The tables present information by portfolio and then by agency. Estimated resourcing is shown for the 2015-16 Budget year and previous year (printed in italics). For agencies involved in a machinery of government change, resourcing prior to the change is shown against the agency that managed those amounts and subsequent to the date of effect of the change is shown against the receiving agency. The tables in the paper include only agencies, special appropriations and special accounts that have been established.

Introduction and Guide
7
GUIDE TO BUDGET PAPER NO. 4
Linkages between tables and amounts presented in Budget Paper No. 4 are illustrated in the Figures 1 to 4. A consolidated view of financial resources to be managed by agencies in the GGS is presented in the Agency resourcing table. Amounts in the Agency resourcing table can be matched with information that is in the:
• annual Appropriation Bills;
• Special appropriations table; and
• Special accounts table.

Introduction and Guide
8
Figures 1 and 2 show how amounts in the Agency resourcing table can be matched with amounts in annual Appropriation Bills. The Figures also highlight amounts in these Bills for non-operating expenditure and for Specific Purpose Payments (payments to States, ACT, NT and local governments).
Figure 1: Example of the Agency resourcing table and Appropriation Bill No. 1

Introduction and Guide
9
Figure 2: Example of the Agency resourcing table and Appropriation Bill No. 2

Introduction and Guide
10
Figure 3 shows amounts in the Agency resourcing table that can be matched to the totals in the Special appropriations table.
Figure 3: Example of the Agency resourcing table and Special appropriations table

Introduction and Guide
11
Figure 4 shows amounts in the Agency resourcing table that can be matched to the totals in the Special accounts table.
Figure 4: Example of the Agency resourcing table and Special accounts table


13
Part 1: Agency Financial Resourcing

14
PART 1: AGENCY FINANCIAL RESOURCING APPROPRIATIONS FRAMEWORK
An appropriation is a legal entitlement to spend money from the Consolidated Revenue Fund (CRF). Appropriations can be classified as annual appropriations or special appropriations. Annual appropriations are contained in the annual Appropriation Acts. Special appropriations are contained in other Acts.
The CRF is a concept established in section 81 of the Australian Constitution to represent all Commonwealth money. All revenues or moneys raised or received by the Executive Government of the Commonwealth, or any person or organisation acting on behalf of the Commonwealth, automatically form part of the CRF. This includes, for example, taxes, charges, levies, borrowings, loan repayments and moneys held on behalf of or in trust. Money automatically forms part of the CRF upon receipt, regardless of whether the money is deposited in a bank account.
Section 83 of the Constitution provides that no money shall be drawn from the Treasury of the Commonwealth except under an appropriation made by law (the ‘Treasury’ of the Commonwealth equates to the CRF). Section 81 provides that appropriations from the CRF must be applied for expenditure of the Commonwealth. Together, sections 81 and 83 provide that before money may be spent there must be an appropriation, made by law, for the purposes of the Commonwealth. These requirements for an appropriations framework safeguard the constitutional control by the Parliament over Australian Government spending.
The appropriation and expenditure framework for agencies in all Australian governments is based on the accounting concept of control. Where an agency has substantial control, the related appropriation and expenditure is classified as departmental and where an agency does not have control, expenditure is classified as administered. This classification is unique to government and is not used elsewhere in the Australian economy. It is currently reflected in Australian Accounting Standard AASB 1050. Whether an agency has administered or departmental control over resources is based largely on the level of discretion the agency has in using those resources.
Departmental appropriations are available to meet expenditure over which an agency has substantial control and are typically used for agency operational expenditure, such as for employees and supplier expenses. Administered appropriations are administered by an agency on behalf of government, for the benefit of or payment to parties who are external to the agency and not part of the internal operations of that agency. Administered appropriations are typically used for expenditure such as government grants, subsidies and obligations that arise from legislated eligibility rules and conditions. Further information on the appropriations framework can be found at www.finance.gov.au/resource-management/appropriations/introduction.

Part 1: Agency financial resourcing
15
MACHINERY OF GOVERNMENT CHANGES
The term ‘machinery of government changes’ (MoG changes) is used to describe a variety of organisational or functional changes affecting the Commonwealth. MoG changes often arise from changes to the Administrative Arrangements Order (AAO) following a Prime Ministerial decision to abolish or create a department or to move functional responsibilities between agencies.
The AAO of 23 December 2014 resulted in renaming of the following two Departments of State:
Before 23 December 2014 From 23 December 2014
Department of Education Department of Education and Training
Department of Industry Department of Industry and Science
At the same time, the following transfer of functions occurred:
• The transfer of child care functions from the former Department of Education to the Department of Social Services.
• The transfer of vocational and adult migrant training functions from the former Department of Industry to the Department of Education and Training (bringing all the main training functions into the one portfolio).
• The transfer of small business programme functions from the former Department of Industry to the Department of the Treasury.
The AAO of 23 December 2014 can be found at: www.dpmc.gov.au/parliamentary/index.cfm. For further detail on how the MoG changes impact on portfolios, refer to the relevant 2015-16 Portfolio Budget Statements.

Part 1: Agency financial resourcing
16
AGENCY RESOURCING TABLE
Overview of the Agency resourcing table The Agency resourcing table presents a consolidated view of estimated financial resources to be managed in the Budget year by agencies in the GGS. It is organised by portfolio and agency, and by agency Outcome.1 It differentiates the sources of funding, which are annual Appropriation Bills, Receipts, Special Appropriations and Special Accounts. The amounts are classified into departmental and administered resourcing.
Resourcing amounts in the Agency resourcing table can be matched with amounts in the annual Appropriation Bills, Special appropriations table and Special accounts table. Examples are in Figures 1 to 4 of the section entitled Guide to Budget Paper No. 4.
The Agency resourcing table shows that annual appropriations are expected to fund approximately 25 per cent of all GGS expenditure for the Budget year, with special appropriations accounting for the balance.
The column headed Receipts in the Agency resourcing table shows income received from other government agencies, individuals, or non-government bodies (in the large part such receipts are received for the provision of services).
The column headed Special Accounts in the Agency resourcing table shows estimated amounts to be credited to a special account. This column shows income expected from other government agencies, individuals or non-government bodies. This column is located between the departmental and administered sides of the Agency resourcing table because depending on the legislated purposes of a special account, the resources may be used for departmental and/or administered expenditure.
The total amounts in the Agency resourcing table cannot be used to calculate consolidated Commonwealth financial resources. This is because the Agency resourcing table covers only agencies in the GGS whereas, the Commonwealth also includes agencies that are public corporations operating in the commercial sphere that are not primarily financed by government. Furthermore, the Agency resourcing table has not been adjusted to eliminate inter-governmental transactions. Such transactions occur when one agency in the GGS pays another agency in the GGS for services received. To eliminate inter-governmental transactions would not accurately represent the financial resources managed by a particular agency.
1 The text of the Outcomes applying to each agency is set out at Appendix A Agency outcome
statements.

17
PAR
LIA
MEN
T A
genc
y R
esou
rcin
g—20
15-2
016
Est
imat
ed A
ctua
l—20
14-2
015
D
epar
tmen
tal
Adm
inis
tere
d
D
epar
tmen
t/Out
com
e/N
on-o
pera
ting
Ope
ratin
gN
on-
oper
atin
gR
ecei
pts
(a)
Spe
cial
A
ppro
pria
tion
Spe
cial
A
ccou
nts
(b)
Ope
ratin
gS
PP
sN
on-
oper
atin
gS
peci
al
App
ropr
iatio
nTo
tal
$'
000
$'00
0$'
000
$'00
0$'
000
$'00
0$'
000
$'00
0$'
000
$'00
0D
epar
tmen
t of t
he
Sena
te
Out
com
e 1
21,5
03-
600
--
--
--
22,1
0320
,627
-60
0-
--
--
-21
,227
To
tal
21,5
03-
600
--
--
--
22,1
0320
,627
-60
0-
--
--
-21
,227
D
epar
tmen
t of t
he
Hou
se o
f R
epre
sent
ativ
es
Out
com
e 1
21,8
10-
509
--
324
--
-22
,643
20,8
21-
1,18
9-
-32
5-
--
22,3
35
Tota
l 21
,810
-50
9-
-32
4-
--
22,6
4320
,821
-1,
189
--
325
--
-22
,335
D
epar
tmen
t of
Parli
amen
tary
Se
rvic
es
Out
com
e 1
141,
924
-8,
259
--
6,70
3-
--
156,
886
144,
758
-8,
007
--
4,40
0-
--
157,
165
A
dmin
iste
red
Ass
ets
and
Liab
ilitie
s -
--
--
--
33,7
41-
33,7
41-
--
--
--
122,
212
-12
2,21
2
Tota
l 14
1,92
4-
8,25
9-
-6,
703
-33
,741
-19
0,62
714
4,75
8-
8,00
7-
-4,
400
-12
2,21
2-
279,
377

18
Agency resourcing table
PAR
LIA
MEN
T A
genc
y R
esou
rcin
g—20
15-2
016
Est
imat
ed A
ctua
l—20
14-2
015
D
epar
tmen
tal
Adm
inis
tere
d
D
epar
tmen
t/Out
com
e/N
on-o
pera
ting
Ope
ratin
gN
on-
oper
atin
gR
ecei
pts
(a)
Spe
cial
A
ppro
pria
tion
Spe
cial
A
ccou
nts
(b)
Ope
ratin
gS
PP
sN
on-
oper
atin
gS
peci
al
App
ropr
iatio
nTo
tal
$'
000
$'00
0$'
000
$'00
0$'
000
$'00
0$'
000
$'00
0$'
000
$'00
0Pa
rliam
enta
ry
Bud
get O
ffice
O
utco
me
1 7,
410
--
548
--
--
-7,
958
7,01
3-
--
--
--
-7,
013
To
tal
7,41
0-
-54
8-
--
--
7,95
87,
013
--
--
--
--
7,01
3
TOTA
L 19
2,64
7-
9,36
854
8-
7,02
7-
33,7
41-
243,
331
193,
219
-9,
796
--
4,72
5-
122,
212
-32
9,95
2(a
) R
ecei
pts
that
wer
e no
t app
ropr
iate
d to
the
entit
y by
an
annu
al A
ppro
pria
tion
Act
or a
noth
er A
ct.
(b)
Am
ount
s cr
edite
d to
a s
peci
al a
ccou
nt th
at w
ere
not a
ppro
pria
ted
to th
e en
tity
by a
n an
nual
App
ropr
iatio
n A
ct o
r ano
ther
Act
.

Agency resourcing table
19
AG
RIC
ULT
UR
E A
genc
y R
esou
rcin
g—20
15-2
016
Est
imat
ed A
ctua
l—20
14-2
015
D
epar
tmen
tal
Adm
inis
tere
d
App
ropr
iatio
n B
ill N
o. 2
E
ntity
/Out
com
e/
Non
-ope
ratin
g A
ppro
pria
tion
Bill
No.
1A
ppro
pria
tion
Bill
No.
2R
ecei
pts
(a)
Spe
cial
App
ropr
iatio
nS
peci
al
Acc
ount
s (b
)A
ppro
pria
tion
Bill
No.
1S
PP
sO
ther
(c)
Spe
cial
App
ropr
iatio
nTo
tal
$'
000
$'00
0$'
000
$'00
0$'
000
$'00
0$'
000
$'00
0$'
000
$'00
0D
epar
tmen
t of
Agr
icul
ture
O
utco
me
1 12
4,61
5-
17,6
07-
-10
5,00
1-
-82
3,14
91,
070,
372
115,
648
-22
,303
--
134,
793
--
822,
369
1,09
5,11
3
Out
com
e 2
188,
657
-5,
134
-37
9,40
918
,205
--
11,8
4460
3,24
919
5,07
1-
4,23
8-
377,
688
17,3
99-
-9,
725
604,
121
E
quity
inje
ctio
ns
-1,
283
--
--
--
-1,
283
-80
--
--
--
-80
A
dmin
iste
red
Ass
ets
and
Liab
ilitie
s -
--
--
--
250,
000
-25
0,00
0-
--
--
--
540,
000
-54
0,00
0
Tota
l 31
3,27
21,
283
22,7
41-
379,
409
123,
206
-25
0,00
083
4,99
31,
924,
904
310,
719
8026
,541
-37
7,68
815
2,19
2-
540,
000
832,
094
2,23
9,31
4
Aus
tral
ian
Gra
pe a
nd
Win
e A
utho
rity
Out
com
e 1
--
37,6
57-
--
--
-37
,657
--
34,1
91-
--
--
-34
,191
To
tal
--
37,6
57-
--
--
-37
,657
--
34,1
91-
--
--
-34
,191

20
Agency resourcing table
AG
RIC
ULT
UR
E A
genc
y R
esou
rcin
g—20
15-2
016
Est
imat
ed A
ctua
l—20
14-2
015
D
epar
tmen
tal
Adm
inis
tere
d
App
ropr
iatio
n B
ill N
o. 2
E
ntity
/Out
com
e/
Non
-ope
ratin
g A
ppro
pria
tion
Bill
No.
1A
ppro
pria
tion
Bill
No.
2R
ecei
pts
(a)
Spe
cial
App
ropr
iatio
nS
peci
al
Acc
ount
s (b
)A
ppro
pria
tion
Bill
No.
1S
PP
sO
ther
(c)
Spe
cial
App
ropr
iatio
nTo
tal
$'
000
$'00
0$'
000
$'00
0$'
000
$'00
0$'
000
$'00
0$'
000
$'00
0A
ustr
alia
n Pe
stic
ides
an
d Ve
terin
ary
Med
icin
es A
utho
rity
Out
com
e 1
732
-31
,997
--
--
--
32,7
2974
3-
31,7
59-
--
--
-32
,502
To
tal
732
-31
,997
--
--
--
32,7
2974
3-
31,7
59-
--
--
-32
,502
C
otto
n R
esea
rch
and
Dev
elop
men
t C
orpo
ratio
n O
utco
me
1 -
-10
,979
--
--
--
10,9
79-
-24
,308
--
--
--
24,3
08
Tota
l -
-10
,979
--
--
--
10,9
79-
-24
,308
--
--
--
24,3
08
Fish
erie
s R
esea
rch
and
Dev
elop
men
t C
orpo
ratio
n O
utco
me
1 -
-27
,316
--
--
--
27,3
16-
-27
,803
--
--
--
27,8
03
Tota
l -
-27
,316
--
--
--
27,3
16-
-27
,803
--
--
--
27,8
03

Agency resourcing table
21
AG
RIC
ULT
UR
E A
genc
y R
esou
rcin
g—20
15-2
016
Est
imat
ed A
ctua
l—20
14-2
015
D
epar
tmen
tal
Adm
inis
tere
d
App
ropr
iatio
n B
ill N
o. 2
E
ntity
/Out
com
e/
Non
-ope
ratin
g A
ppro
pria
tion
Bill
No.
1A
ppro
pria
tion
Bill
No.
2R
ecei
pts
(a)
Spe
cial
App
ropr
iatio
nS
peci
al
Acc
ount
s (b
)A
ppro
pria
tion
Bill
No.
1S
PP
sO
ther
(c)
Spe
cial
App
ropr
iatio
nTo
tal
$'
000
$'00
0$'
000
$'00
0$'
000
$'00
0$'
000
$'00
0$'
000
$'00
0G
rain
s R
esea
rch
and
Dev
elop
men
t C
orpo
ratio
n O
utco
me
1 -
-19
9,81
8-
--
--
-19
9,81
8-
-22
0,64
7-
--
--
-22
0,64
7
Tota
l -
-19
9,81
8-
--
--
-19
9,81
8-
-22
0,64
7-
--
--
-22
0,64
7
Rur
al In
dust
ries
Res
earc
h an
d D
evel
opm
ent
Cor
pora
tion
Out
com
e 1
--
18,9
97-
--
--
-18
,997
--
21,1
62-
--
--
-21
,162
Tota
l -
-18
,997
--
--
--
18,9
97-
-21
,162
--
--
--
21,1
62
Aus
tral
ian
Fish
erie
s M
anag
emen
t A
utho
rity
Out
com
e 1
20,9
55-
3,11
5-
18,8
315,
375
--
-48
,276
21,1
99-
3,10
4-
17,1
045,
309
--
-46
,716
Tota
l 20
,955
-3,
115
-18
,831
5,37
5-
--
48,2
7621
,199
-3,
104
-17
,104
5,30
9-
--
46,7
16 P
OR
TFO
LIO
T
OTA
L 33
4,95
91,
283
352,
620
-39
8,24
012
8,58
1-
250,
000
834,
993
2,30
0,67
633
2,66
180
389,
515
-39
4,79
215
7,50
1-
540,
000
832,
094
2,64
6,64
3(a
) R
ecei
pts
that
wer
e no
t app
ropr
iate
d to
the
entit
y by
an
annu
al A
ppro
pria
tion
Act o
r ano
ther
Act
. (b
) Am
ount
s cr
edite
d to
a s
peci
al a
ccou
nt th
at w
ere
not a
ppro
pria
ted
to th
e en
tity
by a
n an
nual
App
ropr
iatio
n Ac
t or a
noth
er A
ct.
(c)
Incl
udes
New
Adm
inis
tere
d O
utco
mes
and
adm
inis
tere
d as
sets
and
liab
ilitie
s ite
m, w
ithin
the
mea
ning
of A
ppro
pria
tion
Bill
No.
2.

22
Agency resourcing table
ATT
OR
NEY
-GEN
ERA
L’S
Age
ncy
Res
ourc
ing—
2015
-201
6 E
stim
ated
Act
ual—
2014
-201
5
Dep
artm
enta
l A
dmin
iste
red
A
ppro
pria
tion
Bill
No.
2
Ent
ity/O
utco
me/
N
on-o
pera
ting
App
ropr
iatio
nB
ill N
o. 1
App
ropr
iatio
nB
ill N
o. 2
Rec
eipt
s (a
)S
peci
alA
ppro
pria
tion
Spe
cial
A
ccou
nts
(b)
App
ropr
iatio
nB
ill N
o. 1
SP
Ps
Oth
er (c
)S
peci
alA
ppro
pria
tion
Tota
l
$'00
0$'
000
$'00
0$'
000
$'00
0$'
000
$'00
0$'
000
$'00
0$'
000
Atto
rney
-Gen
eral
’s
Dep
artm
ent
Out
com
e 1
204,
901
-63
,150
-37
,454
488,
204
7,24
8-
13,9
9281
4,94
921
3,80
9-
124,
960
-43
,442
472,
841
5,71
2-
53,2
5191
4,01
5
Out
com
e 2
24,6
43-
4,21
8-
3,59
221
3,98
1-
-10
246,
444
26,1
85-
4,23
0-
3,96
821
1,16
8-
-10
245,
561
E
quity
inje
ctio
ns
-20
,000
--
--
--
-20
,000
-59
0-
--
--
--
590
A
dmin
iste
red
Ass
ets
and
Liab
ilitie
s -
--
--
--
5,96
4-
5,96
4-
--
--
--
40,8
97-
40,8
97
Tota
l 22
9,54
420
,000
67,3
68-
41,0
4670
2,18
57,
248
5,96
414
,002
1,08
7,35
723
9,99
459
012
9,19
0-
47,4
1068
4,00
95,
712
40,8
9753
,261
1,20
1,06
3
Aus
tral
ia B
usin
ess
Art
s Fo
unda
tion
Lim
ited
Out
com
e 1
--
4,17
6-
--
--
-4,
176
--
4,17
6-
--
--
-4,
176
To
tal
--
4,17
6-
--
--
-4,
176
--
4,17
6-
--
--
-4,
176
A
ustr
alia
Cou
ncil
Out
com
e 1
184,
526
-2,
821
--
--
--
187,
347
211,
764
-4,
950
--
--
--
216,
714
To
tal
184,
526
-2,
821
--
--
--
187,
347
211,
764
-4,
950
--
--
--
216,
714

Agency resourcing table
23
ATT
OR
NEY
-GEN
ERA
L’S
Age
ncy
Res
ourc
ing—
2015
-201
6 E
stim
ated
Act
ual—
2014
-201
5
Dep
artm
enta
l A
dmin
iste
red
A
ppro
pria
tion
Bill
No.
2
Ent
ity/O
utco
me/
N
on-o
pera
ting
App
ropr
iatio
nB
ill N
o. 1
App
ropr
iatio
nB
ill N
o. 2
Rec
eipt
s (a
)S
peci
alA
ppro
pria
tion
Spe
cial
A
ccou
nts
(b)
App
ropr
iatio
nB
ill N
o. 1
SP
Ps
Oth
er (c
)S
peci
alA
ppro
pria
tion
Tota
l
$'00
0$'
000
$'00
0$'
000
$'00
0$'
000
$'00
0$'
000
$'00
0$'
000
Aus
tral
ian
Film
, Te
levi
sion
and
Rad
io
Scho
ol
Out
com
e 1
24,0
58-
6,25
6-
--
--
-30
,314
24,3
35-
5,76
4-
--
--
-30
,099
To
tal
24,0
58-
6,25
6-
--
--
-30
,314
24,3
35-
5,76
4-
--
--
-30
,099
A
ustr
alia
n H
uman
R
ight
s C
omm
issi
on
Out
com
e 1
15,5
15-
6,57
0-
--
--
-22
,085
21,1
05-
6,48
5-
--
--
-27
,590
E
quity
inje
ctio
ns
--
--
--
--
--
-51
--
--
--
-51
To
tal
15,5
15-
6,57
0-
--
--
-22
,085
21,1
0551
6,48
5-
--
--
-27
,641
A
ustr
alia
n N
atio
nal
Mar
itim
e M
useu
m
Out
com
e 1
22,2
11-
10,2
48-
--
--
-32
,459
22,3
09-
9,71
5-
--
--
-32
,024
E
quity
inje
ctio
ns
-1,
709
--
--
--
-1,
709
-1,
729
--
--
--
-1,
729
To
tal
22,2
111,
709
10,2
48-
--
--
-34
,168
22,3
091,
729
9,71
5-
--
--
-33
,753

24
Agency resourcing table
ATT
OR
NEY
-GEN
ERA
L’S
Age
ncy
Res
ourc
ing—
2015
-201
6 E
stim
ated
Act
ual—
2014
-201
5
Dep
artm
enta
l A
dmin
iste
red
A
ppro
pria
tion
Bill
No.
2
Ent
ity/O
utco
me/
N
on-o
pera
ting
App
ropr
iatio
nB
ill N
o. 1
App
ropr
iatio
nB
ill N
o. 2
Rec
eipt
s (a
)S
peci
alA
ppro
pria
tion
Spe
cial
A
ccou
nts
(b)
App
ropr
iatio
nB
ill N
o. 1
SP
Ps
Oth
er (c
)S
peci
alA
ppro
pria
tion
Tota
l
$'00
0$'
000
$'00
0$'
000
$'00
0$'
000
$'00
0$'
000
$'00
0$'
000
Bun
dano
n Tr
ust
Out
com
e 1
--
2,60
3-
--
--
-2,
603
--
2,60
3-
--
--
-2,
603
To
tal
--
2,60
3-
--
--
-2,
603
--
2,60
3-
--
--
-2,
603
N
atio
nal F
ilm a
nd
Soun
d A
rchi
ve o
f A
ustr
alia
O
utco
me
1 25
,795
-1,
718
--
--
--
27,5
1325
,929
-1,
477
--
--
--
27,4
06
Equ
ity in
ject
ions
-
817
--
--
--
-81
7-
824
--
--
--
-82
4
Tota
l 25
,795
817
1,71
8-
--
--
-28
,330
25,9
2982
41,
477
--
--
--
28,2
30
Nat
iona
l Gal
lery
of
Aus
tral
ia
Out
com
e 1
33,0
85-
11,6
85-
--
--
-44
,770
33,8
18-
12,2
85-
--
--
-46
,103
E
quity
inje
ctio
ns
-16
,829
--
--
--
-16
,829
-17
,004
--
--
--
-17
,004
To
tal
33,0
8516
,829
11,6
85-
--
--
-61
,599
33,8
1817
,004
12,2
85-
--
--
-63
,107

Agency resourcing table
25
ATT
OR
NEY
-GEN
ERA
L’S
Age
ncy
Res
ourc
ing—
2015
-201
6 E
stim
ated
Act
ual—
2014
-201
5
Dep
artm
enta
l A
dmin
iste
red
A
ppro
pria
tion
Bill
No.
2
Ent
ity/O
utco
me/
N
on-o
pera
ting
App
ropr
iatio
nB
ill N
o. 1
App
ropr
iatio
nB
ill N
o. 2
Rec
eipt
s (a
)S
peci
alA
ppro
pria
tion
Spe
cial
A
ccou
nts
(b)
App
ropr
iatio
nB
ill N
o. 1
SP
Ps
Oth
er (c
)S
peci
alA
ppro
pria
tion
Tota
l
$'00
0$'
000
$'00
0$'
000
$'00
0$'
000
$'00
0$'
000
$'00
0$'
000
Nat
iona
l Lib
rary
of
Aus
tral
ia
Out
com
e 1
50,2
25-
14,6
39-
--
--
-64
,864
50,3
68-
13,7
01-
--
--
-64
,069
E
quity
inje
ctio
ns
-9,
679
--
--
--
-9,
679
-9,
792
--
--
--
-9,
792
To
tal
50,2
259,
679
14,6
39-
--
--
-74
,543
50,3
689,
792
13,7
01-
--
--
-73
,861
N
atio
nal M
useu
m o
f A
ustr
alia
O
utco
me
1 41
,441
-4,
271
--
--
--
45,7
1241
,590
-4,
690
--
--
--
46,2
80
Equ
ity in
ject
ions
-
1,94
4-
--
--
--
1,94
4-
1,96
4-
--
--
--
1,96
4
Tota
l 41
,441
1,94
44,
271
--
--
--
47,6
5641
,590
1,96
44,
690
--
--
--
48,2
44
Nat
iona
l Por
trai
t G
alle
ry o
f Aus
tral
ia
Out
com
e 1
11,5
05-
2,15
5-
--
--
-13
,660
11,4
87-
3,91
0-
--
--
-15
,397
E
quity
inje
ctio
ns
-19
9-
--
--
--
199
-19
9-
--
--
--
199
To
tal
11,5
0519
92,
155
--
--
--
13,8
5911
,487
199
3,91
0-
--
--
-15
,596

26
Agency resourcing table
ATT
OR
NEY
-GEN
ERA
L’S
Age
ncy
Res
ourc
ing—
2015
-201
6 E
stim
ated
Act
ual—
2014
-201
5
Dep
artm
enta
l A
dmin
iste
red
A
ppro
pria
tion
Bill
No.
2
Ent
ity/O
utco
me/
N
on-o
pera
ting
App
ropr
iatio
nB
ill N
o. 1
App
ropr
iatio
nB
ill N
o. 2
Rec
eipt
s (a
)S
peci
alA
ppro
pria
tion
Spe
cial
A
ccou
nts
(b)
App
ropr
iatio
nB
ill N
o. 1
SP
Ps
Oth
er (c
)S
peci
alA
ppro
pria
tion
Tota
l
$'00
0$'
000
$'00
0$'
000
$'00
0$'
000
$'00
0$'
000
$'00
0$'
000
Scre
en A
ustr
alia
O
utco
me
1 16
,720
-80
,835
--
--
--
97,5
5517
,956
-83
,382
--
--
--
101,
338
To
tal
16,7
20-
80,8
35-
--
--
-97
,555
17,9
56-
83,3
82-
--
--
-10
1,33
8
Adm
inis
trat
ive
App
eals
Trib
unal
O
utco
me
1 13
1,85
6-
--
--
--
6,40
013
8,25
636
,441
--
--
--
-70
037
,141
To
tal
131,
856
--
--
--
-6,
400
138,
256
36,4
41-
--
--
--
700
37,1
41
Aus
tral
ian
Com
mis
sion
for L
aw
Enfo
rcem
ent
Inte
grity
O
utco
me
1 12
,051
-57
5-
--
--
-12
,626
9,61
0-
75-
--
--
-9,
685
E
quity
inje
ctio
ns
-1,
071
--
--
--
-1,
071
--
--
--
--
--
To
tal
12,0
511,
071
575
--
--
--
13,6
979,
610
-75
--
--
--
9,68
5

Agency resourcing table
27
ATT
OR
NEY
-GEN
ERA
L’S
Age
ncy
Res
ourc
ing—
2015
-201
6 E
stim
ated
Act
ual—
2014
-201
5
Dep
artm
enta
l A
dmin
iste
red
A
ppro
pria
tion
Bill
No.
2
Ent
ity/O
utco
me/
N
on-o
pera
ting
App
ropr
iatio
nB
ill N
o. 1
App
ropr
iatio
nB
ill N
o. 2
Rec
eipt
s (a
)S
peci
alA
ppro
pria
tion
Spe
cial
A
ccou
nts
(b)
App
ropr
iatio
nB
ill N
o. 1
SP
Ps
Oth
er (c
)S
peci
alA
ppro
pria
tion
Tota
l
$'00
0$'
000
$'00
0$'
000
$'00
0$'
000
$'00
0$'
000
$'00
0$'
000
Aus
tral
ian
Crim
e C
omm
issi
on
Out
com
e 1
90,8
22-
6,14
8-
--
--
-96
,970
98,1
70-
7,89
3-
--
--
-10
6,06
3
Equ
ity in
ject
ions
-
2,65
0-
--
--
--
2,65
0-
200
--
--
--
-20
0
Tota
l 90
,822
2,65
06,
148
--
--
--
99,6
2098
,170
200
7,89
3-
--
--
-10
6,26
3
Aus
tral
ian
Fede
ral
Polic
e O
utco
me
1 1,
049,
810
-10
6,94
3-
26,2
7317
,145
--
-1,
200,
171
1,09
4,28
7-
116,
545
-26
,273
18,2
75-
--
1,25
5,38
0
Out
com
e 2
--
156,
078
--
--
--
156,
078
--
149,
037
--
--
--
149,
037
E
quity
inje
ctio
ns
-48
,911
--
--
--
-48
,911
-65
,139
--
--
--
-65
,139
To
tal
1,04
9,81
048
,911
263,
021
-26
,273
17,1
45-
--
1,40
5,16
01,
094,
287
65,1
3926
5,58
2-
26,2
7318
,275
--
-1,
469,
556
A
ustr
alia
n Fi
nanc
ial
Secu
rity
Aut
horit
y O
utco
me
1 53
,284
-49
,415
-27
,162
--
-1,
000
130,
861
54,4
99-
54,2
12-
27,2
68-
--
1,00
013
6,97
9
Tota
l 53
,284
-49
,415
-27
,162
--
-1,
000
130,
861
54,4
99-
54,2
12-
27,2
68-
--
1,00
013
6,97
9

28
Agency resourcing table
ATT
OR
NEY
-GEN
ERA
L’S
Age
ncy
Res
ourc
ing—
2015
-201
6 E
stim
ated
Act
ual—
2014
-201
5
Dep
artm
enta
l A
dmin
iste
red
A
ppro
pria
tion
Bill
No.
2
Ent
ity/O
utco
me/
N
on-o
pera
ting
App
ropr
iatio
nB
ill N
o. 1
App
ropr
iatio
nB
ill N
o. 2
Rec
eipt
s (a
)S
peci
alA
ppro
pria
tion
Spe
cial
A
ccou
nts
(b)
App
ropr
iatio
nB
ill N
o. 1
SP
Ps
Oth
er (c
)S
peci
alA
ppro
pria
tion
Tota
l
$'00
0$'
000
$'00
0$'
000
$'00
0$'
000
$'00
0$'
000
$'00
0$'
000
Aus
tral
ian
Inst
itute
of
Crim
inol
ogy
Out
com
e 1
5,29
0-
2,85
6-
--
--
-8,
146
5,34
8-
2,76
5-
--
--
-8,
113
To
tal
5,29
0-
2,85
6-
--
--
-8,
146
5,34
8-
2,76
5-
--
--
-8,
113
A
ustr
alia
n La
w
Ref
orm
Com
mis
sion
O
utco
me
1 2,
842
-5
--
--
--
2,84
72,
873
-5
--
--
--
2,87
8
Tota
l 2,
842
-5
--
--
--
2,84
72,
873
-5
--
--
--
2,87
8
Aus
tral
ian
Secu
rity
Inte
llige
nce
Org
anis
atio
n O
utco
me
1 41
5,58
2-
16,3
94-
--
--
-43
1,97
636
8,72
5-
16,3
67-
--
--
-38
5,09
2
Equ
ity in
ject
ions
-
13,8
38-
--
--
--
13,8
38-
16,0
28-
--
--
--
16,0
28
Tota
l 41
5,58
213
,838
16,3
94-
--
--
-44
5,81
436
8,72
516
,028
16,3
67-
--
--
-40
1,12
0

Agency resourcing table
29
ATT
OR
NEY
-GEN
ERA
L’S
Age
ncy
Res
ourc
ing—
2015
-201
6 E
stim
ated
Act
ual—
2014
-201
5
Dep
artm
enta
l A
dmin
iste
red
A
ppro
pria
tion
Bill
No.
2
Ent
ity/O
utco
me/
N
on-o
pera
ting
App
ropr
iatio
nB
ill N
o. 1
App
ropr
iatio
nB
ill N
o. 2
Rec
eipt
s (a
)S
peci
alA
ppro
pria
tion
Spe
cial
A
ccou
nts
(b)
App
ropr
iatio
nB
ill N
o. 1
SP
Ps
Oth
er (c
)S
peci
alA
ppro
pria
tion
Tota
l
$'00
0$'
000
$'00
0$'
000
$'00
0$'
000
$'00
0$'
000
$'00
0$'
000
Aus
tral
ian
Tran
sact
ion
Rep
orts
an
d A
naly
sis
Cen
tre
Out
com
e 1
59,0
51-
2,08
3-
--
--
-61
,134
58,0
05-
4,91
4-
--
--
-62
,919
E
quity
inje
ctio
ns
-4,
750
--
--
--
-4,
750
--
--
--
--
--
To
tal
59,0
514,
750
2,08
3-
--
--
-65
,884
58,0
05-
4,91
4-
--
--
-62
,919
C
rimTr
ac A
genc
y O
utco
me
1 -
--
-79
,497
--
--
79,4
97-
--
-80
,502
--
--
80,5
02
Tota
l -
--
-79
,497
--
--
79,4
97-
--
-80
,502
--
--
80,5
02
Fam
ily C
ourt
and
Fe
dera
l Circ
uit C
ourt
O
utco
me
1 15
8,78
2-
1,47
5-
-89
2-
-30
016
1,44
915
6,58
3-
1,59
0-
-88
4-
-30
015
9,35
7
Tota
l 15
8,78
2-
1,47
5-
-89
2-
-30
016
1,44
915
6,58
3-
1,59
0-
-88
4-
-30
015
9,35
7

30
Agency resourcing table
ATT
OR
NEY
-GEN
ERA
L’S
Age
ncy
Res
ourc
ing—
2015
-201
6 E
stim
ated
Act
ual—
2014
-201
5
Dep
artm
enta
l A
dmin
iste
red
A
ppro
pria
tion
Bill
No.
2
Ent
ity/O
utco
me/
N
on-o
pera
ting
App
ropr
iatio
nB
ill N
o. 1
App
ropr
iatio
nB
ill N
o. 2
Rec
eipt
s (a
)S
peci
alA
ppro
pria
tion
Spe
cial
A
ccou
nts
(b)
App
ropr
iatio
nB
ill N
o. 1
SP
Ps
Oth
er (c
)S
peci
alA
ppro
pria
tion
Tota
l
$'00
0$'
000
$'00
0$'
000
$'00
0$'
000
$'00
0$'
000
$'00
0$'
000
Fede
ral C
ourt
of
Aus
tral
ia
Out
com
e 1
98,9
98-
2,76
9-
5,25
0-
--
600
107,
617
96,7
46-
2,73
3-
5,25
0-
--
600
105,
329
To
tal
98,9
98-
2,76
9-
5,25
0-
--
600
107,
617
96,7
46-
2,73
3-
5,25
0-
--
600
105,
329
H
igh
Cou
rt o
f A
ustr
alia
O
utco
me
1 15
,828
-63
0-
--
--
-16
,458
15,9
80-
645
--
--
--
16,6
25
Equ
ity in
ject
ions
-
1,45
0-
--
--
--
1,45
0-
1,45
0-
--
--
--
1,45
0
Tota
l 15
,828
1,45
063
0-
--
--
-17
,908
15,9
801,
450
645
--
--
--
18,0
75
Nat
iona
l Arc
hive
s of
A
ustr
alia
O
utco
me
1 65
,044
-2,
290
--
--
--
67,3
3464
,920
-2,
699
--
--
--
67,6
19
Tota
l 65
,044
-2,
290
--
--
--
67,3
3464
,920
-2,
699
--
--
--
67,6
19

Agency resourcing table
31
ATT
OR
NEY
-GEN
ERA
L’S
Age
ncy
Res
ourc
ing—
2015
-201
6 E
stim
ated
Act
ual—
2014
-201
5
Dep
artm
enta
l A
dmin
iste
red
A
ppro
pria
tion
Bill
No.
2
Ent
ity/O
utco
me/
N
on-o
pera
ting
App
ropr
iatio
nB
ill N
o. 1
App
ropr
iatio
nB
ill N
o. 2
Rec
eipt
s (a
)S
peci
alA
ppro
pria
tion
Spe
cial
A
ccou
nts
(b)
App
ropr
iatio
nB
ill N
o. 1
SP
Ps
Oth
er (c
)S
peci
alA
ppro
pria
tion
Tota
l
$'00
0$'
000
$'00
0$'
000
$'00
0$'
000
$'00
0$'
000
$'00
0$'
000
Offi
ce o
f the
A
ustr
alia
n In
form
atio
n C
omm
issi
oner
O
utco
me
1 8,
537
-3,
153
--
--
--
11,6
907,
191
-3,
153
--
--
--
10,3
44
Tota
l 8,
537
-3,
153
--
--
--
11,6
907,
191
-3,
153
--
--
--
10,3
44
Offi
ce o
f Pa
rliam
enta
ry
Cou
nsel
O
utco
me
1 15
,195
-6,
290
--
--
--
21,4
8516
,363
-6,
305
--
--
--
22,6
68
Tota
l 15
,195
-6,
290
--
--
--
21,4
8516
,363
-6,
305
--
--
--
22,6
68
Offi
ce o
f the
Dire
ctor
of
Pub
lic
Pros
ecut
ions
O
utco
me
1 77
,941
-7,
784
--
--
--
85,7
2579
,640
-5,
477
--
--
--
85,1
17
Tota
l 77
,941
-7,
784
--
--
--
85,7
2579
,640
-5,
477
--
--
--
85,1
17

32
Agency resourcing table
ATT
OR
NEY
-GEN
ERA
L’S
Age
ncy
Res
ourc
ing—
2015
-201
6 E
stim
ated
Act
ual—
2014
-201
5
Dep
artm
enta
l A
dmin
iste
red
A
ppro
pria
tion
Bill
No.
2
Ent
ity/O
utco
me/
N
on-o
pera
ting
App
ropr
iatio
nB
ill N
o. 1
App
ropr
iatio
nB
ill N
o. 2
Rec
eipt
s (a
)S
peci
alA
ppro
pria
tion
Spe
cial
A
ccou
nts
(b)
App
ropr
iatio
nB
ill N
o. 1
SP
Ps
Oth
er (c
)S
peci
alA
ppro
pria
tion
Tota
l
$'00
0$'
000
$'00
0$'
000
$'00
0$'
000
$'00
0$'
000
$'00
0$'
000
Old
Par
liam
ent
Hou
se
Out
com
e 1
14,0
17-
--
-2,
031
--
-16
,048
15,1
65-
--
-2,
091
--
-17
,256
E
quity
inje
ctio
ns
-52
--
--
--
-52
-52
--
--
--
-52
A
dmin
iste
red
Ass
ets
and
Liab
ilitie
s -
--
--
--
149
-14
9-
--
--
--
153
-15
3
Tota
l 14
,017
52-
--
2,03
1-
149
-16
,249
15,1
6552
--
-2,
091
-15
3-
17,4
61
PO
RTF
OLI
O
TO
TAL
2,92
9,55
512
3,89
958
0,23
3-
179,
228
722,
253
7,24
86,
113
22,3
024,
570,
831
2,88
1,20
111
5,02
265
6,74
3-
186,
703
705,
259
5,71
241
,050
55,8
614,
647,
551
(a)
Rec
eipt
s th
at w
ere
not a
ppro
pria
ted
to th
e en
tity
by a
n an
nual
App
ropr
iatio
n A
ct o
r ano
ther
Act
. (b
) A
mou
nts
cred
ited
to a
spe
cial
acc
ount
that
wer
e no
t app
ropr
iate
d to
the
entit
y by
an
annu
al A
ppro
pria
tion
Act
or a
noth
er A
ct.
(c)
Incl
udes
New
Adm
inis
tere
d O
utco
mes
and
adm
inis
tere
d as
sets
and
liab
ilitie
s ite
m, w
ithin
the
mea
ning
of A
ppro
pria
tion
Bill
No.
2.

Agency resourcing table
33
CO
MM
UN
ICA
TIO
NS
Age
ncy
Res
ourc
ing—
2015
-201
6 E
stim
ated
Act
ual—
2014
-201
5
Dep
artm
enta
l A
dmin
iste
red
A
ppro
pria
tion
Bill
No.
2
Ent
ity/O
utco
me/
N
on-o
pera
ting
App
ropr
iatio
nB
ill N
o. 1
App
ropr
iatio
nB
ill N
o. 2
Rec
eipt
s (a
)S
peci
alA
ppro
pria
tion
Spe
cial
A
ccou
nts
(b)
App
ropr
iatio
nB
ill N
o. 1
SP
Ps
Oth
er (c
)S
peci
alA
ppro
pria
tion
Tota
l
$'00
0$'
000
$'00
0$'
000
$'00
0$'
000
$'00
0$'
000
$'00
0$'
000
Dep
artm
ent o
f C
omm
unic
atio
ns
Out
com
e 1
88,6
63-
--
-19
9,89
1-
--
288,
554
93,7
72-
615
--
130,
659
--
-22
5,04
6
Equ
ity in
ject
ions
-
--
--
--
--
--
6,40
0-
--
--
--
6,40
0
Adm
inis
tere
d A
sset
s an
d Li
abili
ties
--
--
--
-7,
365,
908
-7,
365,
908
--
--
--
-3,
229,
445
-3,
229,
445
To
tal
88,6
63-
--
-19
9,89
1-
7,36
5,90
8-
7,65
4,46
293
,772
6,40
061
5-
-13
0,65
9-
3,22
9,44
5-
3,46
0,89
1
Aus
tral
ian
Bro
adca
stin
g C
orpo
ratio
n O
utco
me
1 1,
064,
413
-14
2,67
8-
--
--
-1,
207,
091
868,
364
-15
3,94
2-
--
--
-1,
022,
306
Lo
ans
-20
,000
--
--
--
-20
,000
-50
,000
--
--
--
-50
,000
To
tal
1,06
4,41
320
,000
142,
678
--
--
--
1,22
7,09
186
8,36
450
,000
153,
942
--
--
--
1,07
2,30
6

34
Agency resourcing table
CO
MM
UN
ICA
TIO
NS
Age
ncy
Res
ourc
ing—
2015
-201
6 E
stim
ated
Act
ual—
2014
-201
5
Dep
artm
enta
l A
dmin
iste
red
A
ppro
pria
tion
Bill
No.
2
Ent
ity/O
utco
me/
N
on-o
pera
ting
App
ropr
iatio
nB
ill N
o. 1
App
ropr
iatio
nB
ill N
o. 2
Rec
eipt
s (a
)S
peci
alA
ppro
pria
tion
Spe
cial
A
ccou
nts
(b)
App
ropr
iatio
nB
ill N
o. 1
SP
Ps
Oth
er (c
)S
peci
alA
ppro
pria
tion
Tota
l
$'00
0$'
000
$'00
0$'
000
$'00
0$'
000
$'00
0$'
000
$'00
0$'
000
Spec
ial B
road
cast
ing
Serv
ice
Cor
pora
tion
Out
com
e 1
283,
270
-90
,535
--
--
--
373,
805
285,
859
-11
0,77
4-
--
--
-39
6,63
3
Tota
l 28
3,27
0-
90,5
35-
--
--
-37
3,80
528
5,85
9-
110,
774
--
--
--
396,
633
A
ustr
alia
n C
omm
unic
atio
ns a
nd
Med
ia A
utho
rity
Out
com
e 1
89,2
04-
900
-50
--
-5,
100
95,2
5496
,032
-90
0-
50-
--
5,10
010
2,08
2
Equ
ity in
ject
ions
-
--
--
--
--
--
4,79
5-
--
--
--
4,79
5
Tota
l 89
,204
-90
0-
50-
--
5,10
095
,254
96,0
324,
795
900
-50
--
-5,
100
106,
877
D
igita
l Tr
ansf
orm
atio
n O
ffice
O
utco
me
1 28
,641
--
--
--
--
28,6
41-
--
--
--
--
-
Equ
ity in
ject
ions
-
2,22
6-
--
--
--
2,22
6-
--
--
--
--
-
Tota
l 28
,641
2,22
6-
--
--
--
30,8
67-
--
--
--
--
-

Agency resourcing table
35
CO
MM
UN
ICA
TIO
NS
Age
ncy
Res
ourc
ing—
2015
-201
6 E
stim
ated
Act
ual—
2014
-201
5
Dep
artm
enta
l A
dmin
iste
red
A
ppro
pria
tion
Bill
No.
2
Ent
ity/O
utco
me/
N
on-o
pera
ting
App
ropr
iatio
nB
ill N
o. 1
App
ropr
iatio
nB
ill N
o. 2
Rec
eipt
s (a
)S
peci
alA
ppro
pria
tion
Spe
cial
A
ccou
nts
(b)
App
ropr
iatio
nB
ill N
o. 1
SP
Ps
Oth
er (c
)S
peci
alA
ppro
pria
tion
Tota
l
$'00
0$'
000
$'00
0$'
000
$'00
0$'
000
$'00
0$'
000
$'00
0$'
000
Tele
com
mun
icat
ions
U
nive
rsal
Ser
vice
M
anag
emen
t Age
ncy
Out
com
e 1
--
--
--
--
--
4,02
5-
--
-95
,975
--
-10
0,00
0
Tota
l -
--
--
--
--
-4,
025
--
--
95,9
75-
--
100,
000
P
OR
TFO
LIO
T
OTA
L 1,
554,
191
22,2
2623
4,11
3-
5019
9,89
1-
7,36
5,90
85,
100
9,38
1,47
91,
348,
052
61,1
9526
6,23
1-
5022
6,63
4-
3,22
9,44
55,
100
5,13
6,70
7(a
) R
ecei
pts
that
wer
e no
t app
ropr
iate
d to
the
entit
y by
an
annu
al A
ppro
pria
tion
Act
or a
noth
er A
ct.
(b)
Am
ount
s cr
edite
d to
a s
peci
al a
ccou
nt th
at w
ere
not a
ppro
pria
ted
to th
e en
tity
by a
n an
nual
App
ropr
iatio
n A
ct o
r ano
ther
Act
. (c
) In
clud
es N
ew A
dmin
iste
red
Out
com
es a
nd a
dmin
iste
red
asse
ts a
nd li
abili
ties
item
, with
in th
e m
eani
ng o
f App
ropr
iatio
n B
ill N
o.2.

36
Agency resourcing table
DEF
ENC
E A
genc
y R
esou
rcin
g—20
15-2
016
Est
imat
ed A
ctua
l—20
14-2
015
D
epar
tmen
tal
Adm
inis
tere
d
App
ropr
iatio
n B
ill N
o. 2
E
ntity
/Out
com
e/
Non
-ope
ratin
g A
ppro
pria
tion
Bill
No.
1A
ppro
pria
tion
Bill
No.
2R
ecei
pts
(a)
Spe
cial
App
ropr
iatio
nS
peci
alA
ccou
nts
(b)
App
ropr
iatio
nB
ill N
o. 1
SP
Ps
Oth
er (c
)S
peci
alA
ppro
pria
tion
Tota
l
$'00
0$'
000
$'00
0$'
000
$'00
0$'
000
$'00
0$'
000
$'00
0$'
000
Dep
artm
ent o
f D
efen
ce
Out
com
e 1
28,0
63,7
24-
1,05
3,48
3-
34,9
89-
--
5,23
0,39
234
,382
,588
25,5
84,1
24-
942,
623
-39
,951
--
-6,
002,
415
32,5
69,1
13
Out
com
e 2
863,
807
-14
,059
--
--
--
877,
866
717,
502
--
--
--
--
717,
502
O
utco
me
3 48
,705
--
--
--
--
48,7
0567
,740
--
--
--
--
67,7
40
Equ
ity in
ject
ions
-
2,87
5,20
9-
--
--
--
2,87
5,20
9-
2,34
6,76
4-
--
--
--
2,34
6,76
4
Tota
l 28
,976
,236
2,87
5,20
91,
067,
542
-34
,989
--
-5,
230,
392
38,1
84,3
6826
,369
,366
2,34
6,76
494
2,62
3-
39,9
51-
--
6,00
2,41
535
,701
,119
A
AF
CO
MPA
NY
Out
com
e 1
--
687
--
--
--
687
--
462
--
--
--
462
To
tal
--
687
--
--
--
687
--
462
--
--
--
462
A
rmy
and
Air
Forc
e C
ante
en S
ervi
ce
Out
com
e 1
--
22,4
62-
--
--
-22
,462
--
--
--
--
--
To
tal
--
22,4
62-
--
--
-22
,462
--
--
--
--
--

Agency resourcing table
37
DEF
ENC
E A
genc
y R
esou
rcin
g—20
15-2
016
Est
imat
ed A
ctua
l—20
14-2
015
D
epar
tmen
tal
Adm
inis
tere
d
App
ropr
iatio
n B
ill N
o. 2
E
ntity
/Out
com
e/
Non
-ope
ratin
g A
ppro
pria
tion
Bill
No.
1A
ppro
pria
tion
Bill
No.
2R
ecei
pts
(a)
Spe
cial
App
ropr
iatio
nS
peci
alA
ccou
nts
(b)
App
ropr
iatio
nB
ill N
o. 1
SP
Ps
Oth
er (c
)S
peci
alA
ppro
pria
tion
Tota
l
$'00
0$'
000
$'00
0$'
000
$'00
0$'
000
$'00
0$'
000
$'00
0$'
000
Aus
tral
ian
Mili
tary
Fo
rces
Rel
ief T
rust
Fu
nd
Out
com
e 1
--
476
--
--
--
476
--
420
--
--
--
420
To
tal
--
476
--
--
--
476
--
420
--
--
--
420
A
ustr
alia
n St
rate
gic
Polic
y In
stitu
te
Lim
ited
Out
com
e 1
--
6,23
0-
--
--
-6,
230
--
6,28
6-
--
--
-6,
286
To
tal
--
6,23
0-
--
--
-6,
230
--
6,28
6-
--
--
-6,
286
D
efen
ce H
ousi
ng
Aus
tral
ia
Out
com
e 1
--
1,19
0,09
4-
--
--
-1,
190,
094
--
1,34
6,57
0-
--
--
-1,
346,
570
To
tal
--
1,19
0,09
4-
--
--
-1,
190,
094
--
1,34
6,57
0-
--
--
-1,
346,
570

38
Agency resourcing table
DEF
ENC
E A
genc
y R
esou
rcin
g—20
15-2
016
Est
imat
ed A
ctua
l—20
14-2
015
D
epar
tmen
tal
Adm
inis
tere
d
App
ropr
iatio
n B
ill N
o. 2
E
ntity
/Out
com
e/
Non
-ope
ratin
g A
ppro
pria
tion
Bill
No.
1A
ppro
pria
tion
Bill
No.
2R
ecei
pts
(a)
Spe
cial
App
ropr
iatio
nS
peci
alA
ccou
nts
(b)
App
ropr
iatio
nB
ill N
o. 1
SP
Ps
Oth
er (c
)S
peci
alA
ppro
pria
tion
Tota
l
$'00
0$'
000
$'00
0$'
000
$'00
0$'
000
$'00
0$'
000
$'00
0$'
000
RA
AF
Wel
fare
R
ecre
atio
nal
Com
pany
O
utco
me
1 -
-1,
022
--
--
--
1,02
2-
-46
2-
--
--
-46
2
Tota
l -
-1,
022
--
--
--
1,02
2-
-46
2-
--
--
-46
2
Roy
al A
ustr
alia
n A
ir Fo
rce
Vete
rans
R
esid
ence
s Tr
ust
Fund
O
utco
me
1 -
-55
8-
--
--
-55
8-
-56
8-
--
--
-56
8
Tota
l -
-55
8-
--
--
-55
8-
-56
8-
--
--
-56
8
Roy
al A
ustr
alia
n A
ir Fo
rce
Wel
fare
Tru
st
Fund
O
utco
me
1 -
-79
1-
--
--
-79
1-
-36
5-
--
--
-36
5
Tota
l -
-79
1-
--
--
-79
1-
-36
5-
--
--
-36
5

Agency resourcing table
39
DEF
ENC
E A
genc
y R
esou
rcin
g—20
15-2
016
Est
imat
ed A
ctua
l—20
14-2
015
D
epar
tmen
tal
Adm
inis
tere
d
App
ropr
iatio
n B
ill N
o. 2
E
ntity
/Out
com
e/
Non
-ope
ratin
g A
ppro
pria
tion
Bill
No.
1A
ppro
pria
tion
Bill
No.
2R
ecei
pts
(a)
Spe
cial
App
ropr
iatio
nS
peci
alA
ccou
nts
(b)
App
ropr
iatio
nB
ill N
o. 1
SP
Ps
Oth
er (c
)S
peci
alA
ppro
pria
tion
Tota
l
$'00
0$'
000
$'00
0$'
000
$'00
0$'
000
$'00
0$'
000
$'00
0$'
000
Roy
al A
ustr
alia
n N
avy
Cen
tral
C
ante
ens
Boa
rd
(Roy
al A
ustr
alia
n N
avy
Cen
tral
C
ante
ens
Fund
) O
utco
me
1 -
-17
,831
--
--
--
17,8
31-
-12
,466
--
--
--
12,4
66
Tota
l -
-17
,831
--
--
--
17,8
31-
-12
,466
--
--
--
12,4
66
Roy
al A
ustr
alia
n N
avy
Rel
ief T
rust
Fu
nd
Out
com
e 1
--
677
--
--
--
677
--
723
--
--
--
723
To
tal
--
677
--
--
--
677
--
723
--
--
--
723
D
efen
ce M
ater
iel
Org
anis
atio
n O
utco
me
1 -
--
-86
7,35
5-
--
-86
7,35
587
9,59
2-
--
11,7
72,9
95-
--
-12
,652
,587
To
tal
--
--
867,
355
--
--
867,
355
879,
592
--
-11
,772
,995
--
--
12,6
52,5
87

40
Agency resourcing table
DEF
ENC
E A
genc
y R
esou
rcin
g—20
15-2
016
Est
imat
ed A
ctua
l—20
14-2
015
D
epar
tmen
tal
Adm
inis
tere
d
App
ropr
iatio
n B
ill N
o. 2
E
ntity
/Out
com
e/
Non
-ope
ratin
g A
ppro
pria
tion
Bill
No.
1A
ppro
pria
tion
Bill
No.
2R
ecei
pts
(a)
Spe
cial
App
ropr
iatio
nS
peci
alA
ccou
nts
(b)
App
ropr
iatio
nB
ill N
o. 1
SP
Ps
Oth
er (c
)S
peci
alA
ppro
pria
tion
Tota
l
$'00
0$'
000
$'00
0$'
000
$'00
0$'
000
$'00
0$'
000
$'00
0$'
000
Dep
artm
ent o
f Ve
tera
ns’ A
ffairs
O
utco
me
1 16
0,51
5-
7,30
1-
45,0
8342
,082
--
6,13
9,20
76,
394,
188
146,
585
-7,
563
-49
,431
41,5
69-
-6,
404,
906
6,65
0,05
4
Out
com
e 2
109,
511
-2,
075
--
7,08
0-
-5,
237,
790
5,35
6,45
612
7,61
7-
2,09
8-
-7,
343
--
5,26
2,19
05,
399,
248
O
utco
me
3 27
,316
-24
0-
24,0
8138
,122
--
-89
,759
22,5
73-
250
-24
,093
57,8
20-
--
104,
736
E
quity
inje
ctio
ns
-1,
189
--
--
--
-1,
189
-2,
617
--
--
--
-2,
617
A
dmin
iste
red
Ass
ets
and
Liab
ilitie
s -
--
--
--
--
--
--
--
--
6,06
1-
6,06
1
Tota
l 29
7,34
21,
189
9,61
6-
69,1
6487
,284
--
11,3
76,9
9711
,841
,592
296,
775
2,61
79,
911
-73
,524
106,
732
-6,
061
11,6
67,0
9612
,162
,716
A
ustr
alia
n W
ar
Mem
oria
l O
utco
me
1 44
,073
-9,
775
--
--
--
53,8
4844
,008
-14
,727
--
--
--
58,7
35
Equ
ity in
ject
ions
-
7,47
2-
--
--
--
7,47
2-
12,4
44-
--
--
--
12,4
44
Tota
l 44
,073
7,47
29,
775
--
--
--
61,3
2044
,008
12,4
4414
,727
--
--
--
71,1
79

Agency resourcing table
41
DEF
ENC
E A
genc
y R
esou
rcin
g—20
15-2
016
Est
imat
ed A
ctua
l—20
14-2
015
D
epar
tmen
tal
Adm
inis
tere
d
App
ropr
iatio
n B
ill N
o. 2
E
ntity
/Out
com
e/
Non
-ope
ratin
g A
ppro
pria
tion
Bill
No.
1A
ppro
pria
tion
Bill
No.
2R
ecei
pts
(a)
Spe
cial
App
ropr
iatio
nS
peci
alA
ccou
nts
(b)
App
ropr
iatio
nB
ill N
o. 1
SP
Ps
Oth
er (c
)S
peci
alA
ppro
pria
tion
Tota
l
$'00
0$'
000
$'00
0$'
000
$'00
0$'
000
$'00
0$'
000
$'00
0$'
000
PO
RTF
OLI
O
TO
TAL
29,3
17,6
512,
883,
870
2,32
7,76
1-
971,
508
87,2
84-
-16
,607
,389
52,1
95,4
6327
,589
,741
2,36
1,82
52,
335,
583
-11
,886
,470
106,
732
-6,
061
17,6
69,5
1161
,955
,923
(a)
Rec
eipt
s th
at w
ere
not a
ppro
pria
ted
to th
e en
tity
by a
n an
nual
App
ropr
iatio
n A
ct o
r ano
ther
Act
. (b
) A
mou
nts
cred
ited
to a
spe
cial
acc
ount
that
wer
e no
t app
ropr
iate
d to
the
entit
y by
an
annu
al A
ppro
pria
tion
Act
or a
noth
er A
ct.
(c)
Incl
udes
New
Adm
inis
tere
d O
utco
mes
and
adm
inis
tere
d as
sets
and
liab
ilitie
s ite
m, w
ithin
the
mea
ning
of A
ppro
pria
tion
Bill
No.
2.

42
Agency resourcing table
EDU
CA
TIO
N A
ND
TR
AIN
ING
A
genc
y R
esou
rcin
g—20
15-2
016
Est
imat
ed A
ctua
l—20
14-2
015
D
epar
tmen
tal
Adm
inis
tere
d
App
ropr
iatio
n B
ill N
o. 2
E
ntity
/Out
com
e/
Non
-ope
ratin
g A
ppro
pria
tion
Bill
No.
1A
ppro
pria
tion
Bill
No.
2R
ecei
pts
(a)
Spe
cial
App
ropr
iatio
nS
peci
al
Acc
ount
s (b
)A
ppro
pria
tion
Bill
No.
1S
PP
sO
ther
(c)
Spe
cial
App
ropr
iatio
nTo
tal
$'
000
$'00
0$'
000
$'00
0$'
000
$'00
0$'
000
$'00
0$'
000
$'00
0D
epar
tmen
t of
Educ
atio
n an
d Tr
aini
ng
Out
com
e 1
96,8
42-
5,43
8-
240
100,
167
43,6
45-
15,7
00,3
4615
,946
,678
151,
137
-10
,823
-24
048
9,41
999
,621
-17
,982
,341
18,7
33,5
81
Out
com
e 2
180,
541
-12
,532
-46
,476
1,54
5,59
3-
-18
,683
,976
20,4
69,1
1814
4,90
8-
13,5
67-
227,
819
758,
380
--
16,8
31,7
4317
,976
,417
E
quity
inje
ctio
ns
-8,
465
--
--
--
-8,
465
-3,
489
--
--
--
-3,
489
To
tal
277,
383
8,46
517
,970
-46
,716
1,64
5,76
043
,645
-34
,384
,322
36,4
24,2
6129
6,04
53,
489
24,3
90-
228,
059
1,24
7,79
999
,621
-34
,814
,084
36,7
13,4
87
Aus
tral
ian
Cur
ricul
um,
Ass
essm
ent a
nd
Rep
ortin
g A
utho
rity
Out
com
e 1
--
25,2
20-
--
--
-25
,220
--
26,9
21-
--
--
-26
,921
To
tal
--
25,2
20-
--
--
-25
,220
--
26,9
21-
--
--
-26
,921

Agency resourcing table
43
EDU
CA
TIO
N A
ND
TR
AIN
ING
A
genc
y R
esou
rcin
g—20
15-2
016
Est
imat
ed A
ctua
l—20
14-2
015
D
epar
tmen
tal
Adm
inis
tere
d
App
ropr
iatio
n B
ill N
o. 2
E
ntity
/Out
com
e/
Non
-ope
ratin
g A
ppro
pria
tion
Bill
No.
1A
ppro
pria
tion
Bill
No.
2R
ecei
pts
(a)
Spe
cial
App
ropr
iatio
nS
peci
al
Acc
ount
s (b
)A
ppro
pria
tion
Bill
No.
1S
PP
sO
ther
(c)
Spe
cial
App
ropr
iatio
nTo
tal
$'
000
$'00
0$'
000
$'00
0$'
000
$'00
0$'
000
$'00
0$'
000
$'00
0A
ustr
alia
n In
stitu
te
for T
each
ing
and
Scho
ol L
eade
rshi
p Li
mite
d O
utco
me
1 -
-10
,200
--
--
--
10,2
00-
-15
,920
--
--
--
15,9
20
Tota
l -
-10
,200
--
--
--
10,2
00-
-15
,920
--
--
--
15,9
20
Aus
tral
ian
Inst
itute
of
Abo
rigin
al a
nd
Torr
es S
trai
t Isl
ande
r St
udie
s O
utco
me
1 14
,935
--
--
--
--
14,9
3513
,317
--
--
--
--
13,3
17
Equ
ity in
ject
ions
-
74-
--
--
--
74-
75-
--
--
--
75
Tota
l 14
,935
74-
--
--
--
15,0
0913
,317
75-
--
--
--
13,3
92

44
Agency resourcing table
EDU
CA
TIO
N A
ND
TR
AIN
ING
A
genc
y R
esou
rcin
g—20
15-2
016
Est
imat
ed A
ctua
l—20
14-2
015
D
epar
tmen
tal
Adm
inis
tere
d
App
ropr
iatio
n B
ill N
o. 2
E
ntity
/Out
com
e/
Non
-ope
ratin
g A
ppro
pria
tion
Bill
No.
1A
ppro
pria
tion
Bill
No.
2R
ecei
pts
(a)
Spe
cial
App
ropr
iatio
nS
peci
al
Acc
ount
s (b
)A
ppro
pria
tion
Bill
No.
1S
PP
sO
ther
(c)
Spe
cial
App
ropr
iatio
nTo
tal
$'
000
$'00
0$'
000
$'00
0$'
000
$'00
0$'
000
$'00
0$'
000
$'00
0A
ustr
alia
n R
esea
rch
Cou
ncil
Out
com
e 1
20,8
13-
--
-5,
156
--
789,
659
815,
628
21,0
14-
--
-5,
397
--
875,
642
902,
053
E
quity
inje
ctio
ns
-2,
572
--
--
--
-2,
572
-2,
605
--
--
--
-2,
605
To
tal
20,8
132,
572
--
-5,
156
--
789,
659
818,
200
21,0
142,
605
--
-5,
397
--
875,
642
904,
658
A
ustr
alia
n Sk
ills
Qua
lity
Aut
horit
y O
utco
me
1 38
,632
--
--
--
--
38,6
3240
,218
--
--
--
--
40,2
18
Equ
ity in
ject
ions
-
3,74
4-
--
--
--
3,74
4-
3,47
3-
--
--
--
3,47
3
Tota
l 38
,632
3,74
4-
--
--
--
42,3
7640
,218
3,47
3-
--
--
--
43,6
91
Tert
iary
Edu
catio
n Q
ualit
y an
d St
anda
rds
Age
ncy
Out
com
e 1
12,3
28-
15-
--
--
200
12,5
4316
,501
-15
--
--
-20
016
,716
To
tal
12,3
28-
15-
--
--
200
12,5
4316
,501
-15
--
--
-20
016
,716

Agency resourcing table
45
EDU
CA
TIO
N A
ND
TR
AIN
ING
A
genc
y R
esou
rcin
g—20
15-2
016
Est
imat
ed A
ctua
l—20
14-2
015
D
epar
tmen
tal
Adm
inis
tere
d
App
ropr
iatio
n B
ill N
o. 2
E
ntity
/Out
com
e/
Non
-ope
ratin
g A
ppro
pria
tion
Bill
No.
1A
ppro
pria
tion
Bill
No.
2R
ecei
pts
(a)
Spe
cial
App
ropr
iatio
nS
peci
al
Acc
ount
s (b
)A
ppro
pria
tion
Bill
No.
1S
PP
sO
ther
(c)
Spe
cial
App
ropr
iatio
nTo
tal
$'
000
$'00
0$'
000
$'00
0$'
000
$'00
0$'
000
$'00
0$'
000
$'00
0 P
OR
TFO
LIO
T
OTA
L 36
4,09
114
,855
53,4
05-
46,7
161,
650,
916
43,6
45-
35,1
74,1
8137
,347
,809
387,
095
9,64
267
,246
-22
8,05
91,
253,
196
99,6
21-
35,6
89,9
2637
,734
,785
(a)
Rec
eipt
s th
at w
ere
not a
ppro
pria
ted
to th
e en
tity
by a
n an
nual
App
ropr
iatio
n A
ct o
r ano
ther
Act
. (b
) A
mou
nts
cred
ited
to a
spe
cial
acc
ount
that
wer
e no
t app
ropr
iate
d to
the
entit
y by
an
annu
al A
ppro
pria
tion
Act
or a
noth
er A
ct.
(c)
Incl
udes
New
Adm
inis
tere
d O
utco
mes
and
adm
inis
tere
d as
sets
and
liab
ilitie
s ite
m, w
ithin
the
mea
ning
of A
ppro
pria
tion
Bill
No.
2.

46
Agency resourcing table
EMPL
OYM
ENT
Age
ncy
Res
ourc
ing—
2015
-201
6 E
stim
ated
Act
ual—
2014
-201
5
Dep
artm
enta
l A
dmin
iste
red
A
ppro
pria
tion
Bill
No.
2
Ent
ity/O
utco
me/
N
on-o
pera
ting
App
ropr
iatio
nB
ill N
o. 1
App
ropr
iatio
nB
ill N
o. 2
Rec
eipt
s (a
)S
peci
alA
ppro
pria
tion
Spe
cial
A
ccou
nts
(b)
App
ropr
iatio
nB
ill N
o. 1
SP
Ps
Oth
er (c
)S
peci
alA
ppro
pria
tion
Tota
l
$'00
0$'
000
$'00
0$'
000
$'00
0$'
000
$'00
0$'
000
$'00
0$'
000
Dep
artm
ent o
f Em
ploy
men
t O
utco
me
1 27
0,65
0-
15,2
33-
-1,
523,
012
--
301,
808,
925
269,
055
-17
,357
--
1,52
4,31
7-
-29
1,81
0,75
8
Out
com
e 2
42,2
94-
2,48
0-
-21
,352
--
443,
112
509,
238
57,9
58-
2,82
5-
-28
,235
--
511,
094
600,
112
E
quity
inje
ctio
ns
-9,
333
--
--
--
-9,
333
-23
,987
--
--
--
-23
,987
To
tal
312,
944
9,33
317
,713
--
1,54
4,36
4-
-44
3,14
22,
327,
496
327,
013
23,9
8720
,182
--
1,55
2,55
2-
-51
1,12
32,
434,
857
C
omca
re
Out
com
e 1
7,72
7-
584,
192
--
--
--
591,
919
2,18
9-
23,2
50-
--
--
-25
,439
To
tal
7,72
7-
584,
192
--
--
--
591,
919
2,18
9-
23,2
50-
--
--
-25
,439
A
sbes
tos
Safe
ty a
nd
Erad
icat
ion
Age
ncy
Out
com
e 1
3,26
4-
--
--
--
-3,
264
4,91
4-
--
--
--
-4,
914
To
tal
3,26
4-
--
--
--
-3,
264
4,91
4-
--
--
--
-4,
914
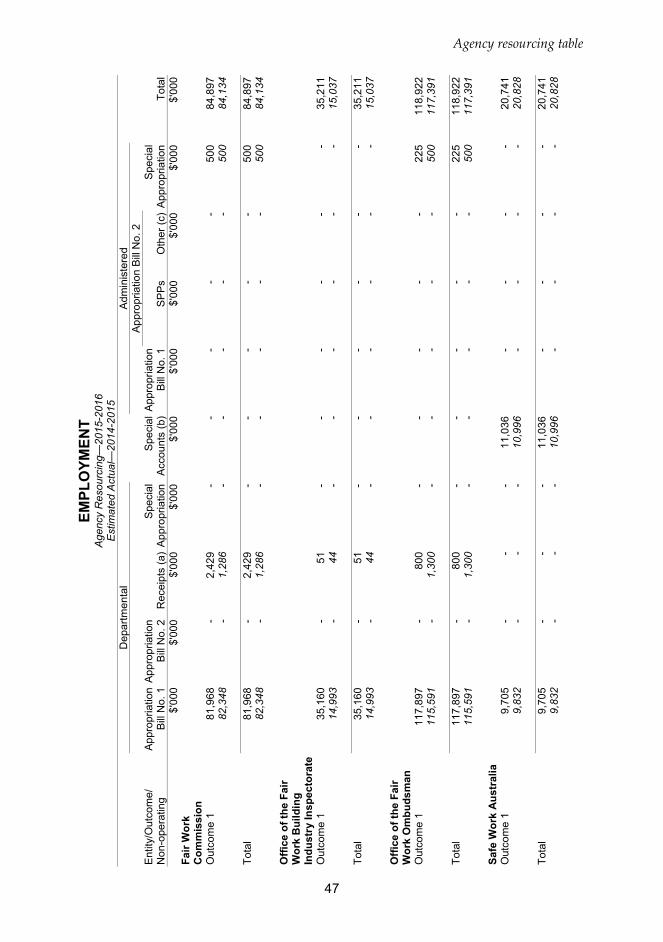
Agency resourcing table
47
EMPL
OYM
ENT
Age
ncy
Res
ourc
ing—
2015
-201
6 E
stim
ated
Act
ual—
2014
-201
5
Dep
artm
enta
l A
dmin
iste
red
A
ppro
pria
tion
Bill
No.
2
Ent
ity/O
utco
me/
N
on-o
pera
ting
App
ropr
iatio
nB
ill N
o. 1
App
ropr
iatio
nB
ill N
o. 2
Rec
eipt
s (a
)S
peci
alA
ppro
pria
tion
Spe
cial
A
ccou
nts
(b)
App
ropr
iatio
nB
ill N
o. 1
SP
Ps
Oth
er (c
)S
peci
alA
ppro
pria
tion
Tota
l
$'00
0$'
000
$'00
0$'
000
$'00
0$'
000
$'00
0$'
000
$'00
0$'
000
Fair
Wor
k C
omm
issi
on
Out
com
e 1
81,9
68-
2,42
9-
--
--
500
84,8
9782
,348
-1,
286
--
--
-50
084
,134
To
tal
81,9
68-
2,42
9-
--
--
500
84,8
9782
,348
-1,
286
--
--
-50
084
,134
O
ffice
of t
he F
air
Wor
k B
uild
ing
Indu
stry
Insp
ecto
rate
O
utco
me
1 35
,160
-51
--
--
--
35,2
1114
,993
-44
--
--
--
15,0
37
Tota
l 35
,160
-51
--
--
--
35,2
1114
,993
-44
--
--
--
15,0
37
Offi
ce o
f the
Fai
r W
ork
Om
buds
man
O
utco
me
1 11
7,89
7-
800
--
--
-22
511
8,92
211
5,59
1-
1,30
0-
--
--
500
117,
391
To
tal
117,
897
-80
0-
--
--
225
118,
922
115,
591
-1,
300
--
--
-50
011
7,39
1
Safe
Wor
k A
ustr
alia
O
utco
me
1 9,
705
--
-11
,036
--
--
20,7
419,
832
--
-10
,996
--
--
20,8
28
Tota
l 9,
705
--
-11
,036
--
--
20,7
419,
832
--
-10
,996
--
--
20,8
28

48
Agency resourcing table
EMPL
OYM
ENT
Age
ncy
Res
ourc
ing—
2015
-201
6 E
stim
ated
Act
ual—
2014
-201
5
Dep
artm
enta
l A
dmin
iste
red
A
ppro
pria
tion
Bill
No.
2
Ent
ity/O
utco
me/
N
on-o
pera
ting
App
ropr
iatio
nB
ill N
o. 1
App
ropr
iatio
nB
ill N
o. 2
Rec
eipt
s (a
)S
peci
alA
ppro
pria
tion
Spe
cial
A
ccou
nts
(b)
App
ropr
iatio
nB
ill N
o. 1
SP
Ps
Oth
er (c
)S
peci
alA
ppro
pria
tion
Tota
l
$'00
0$'
000
$'00
0$'
000
$'00
0$'
000
$'00
0$'
000
$'00
0$'
000
Seaf
arer
s Sa
fety
, R
ehab
ilita
tion
and
Com
pens
atio
n A
utho
rity
Out
com
e 1
--
--
132
--
--
132
--
--
132
--
--
132
To
tal
--
--
132
--
--
132
--
--
132
--
--
132
W
orkp
lace
Gen
der
Equa
lity
Age
ncy
Out
com
e 1
5,13
2-
100
--
--
--
5,23
25,
026
-19
0-
--
--
-5,
216
To
tal
5,13
2-
100
--
--
--
5,23
25,
026
-19
0-
--
--
-5,
216
P
OR
TFO
LIO
T
OTA
L 57
3,79
79,
333
605,
285
-11
,168
1,54
4,36
4-
-44
3,86
73,
187,
814
561,
906
23,9
8746
,252
-11
,128
1,55
2,55
2-
-51
2,12
32,
707,
948
(a)
Rec
eipt
s th
at w
ere
not a
ppro
pria
ted
to th
e en
tity
by a
n an
nual
App
ropr
iatio
n A
ct o
r ano
ther
Act
. (b
) A
mou
nts
cred
ited
to a
spe
cial
acc
ount
that
wer
e no
t app
ropr
iate
d to
the
entit
y by
an
annu
al A
ppro
pria
tion
Act
or a
noth
er A
ct.
(c)
Incl
udes
New
Adm
inis
tere
d O
utco
mes
and
adm
inis
tere
d as
sets
and
liab
ilitie
s ite
m, w
ithin
the
mea
ning
of A
ppro
pria
tion
Bill
No.
2.
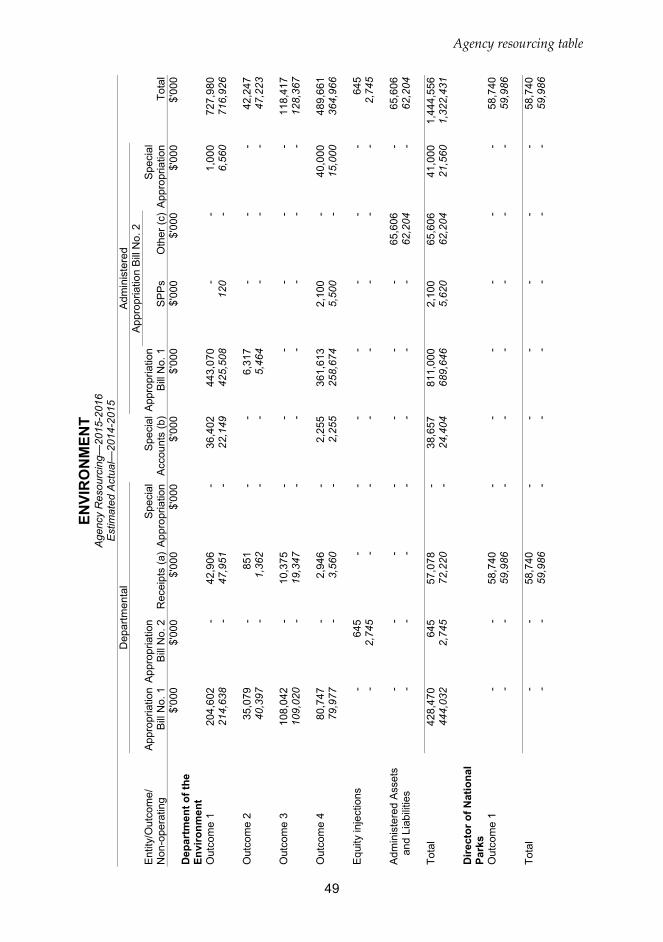
Agency resourcing table
49
ENVI
RO
NM
ENT
Age
ncy
Res
ourc
ing—
2015
-201
6 E
stim
ated
Act
ual—
2014
-201
5
Dep
artm
enta
l A
dmin
iste
red
A
ppro
pria
tion
Bill
No.
2
Ent
ity/O
utco
me/
N
on-o
pera
ting
App
ropr
iatio
nB
ill N
o. 1
App
ropr
iatio
nB
ill N
o. 2
Rec
eipt
s (a
)S
peci
alA
ppro
pria
tion
Spe
cial
A
ccou
nts
(b)
App
ropr
iatio
nB
ill N
o. 1
SP
Ps
Oth
er (c
)S
peci
alA
ppro
pria
tion
Tota
l
$'00
0$'
000
$'00
0$'
000
$'00
0$'
000
$'00
0$'
000
$'00
0$'
000
Dep
artm
ent o
f the
En
viro
nmen
t O
utco
me
1 20
4,60
2-
42,9
06-
36,4
0244
3,07
0-
-1,
000
727,
980
214,
638
-47
,951
-22
,149
425,
508
120
-6,
560
716,
926
O
utco
me
2 35
,079
-85
1-
-6,
317
--
-42
,247
40,3
97-
1,36
2-
-5,
464
--
-47
,223
O
utco
me
3 10
8,04
2-
10,3
75-
--
--
-11
8,41
710
9,02
0-
19,3
47-
--
--
-12
8,36
7
Out
com
e 4
80,7
47-
2,94
6-
2,25
536
1,61
32,
100
-40
,000
489,
661
79,9
77-
3,56
0-
2,25
525
8,67
45,
500
-15
,000
364,
966
E
quity
inje
ctio
ns
-64
5-
--
--
--
645
-2,
745
--
--
--
-2,
745
A
dmin
iste
red
Ass
ets
and
Liab
ilitie
s -
--
--
--
65,6
06-
65,6
06-
--
--
--
62,2
04-
62,2
04
Tota
l 42
8,47
064
557
,078
-38
,657
811,
000
2,10
065
,606
41,0
001,
444,
556
444,
032
2,74
572
,220
-24
,404
689,
646
5,62
062
,204
21,5
601,
322,
431
D
irect
or o
f Nat
iona
l Pa
rks
Out
com
e 1
--
58,7
40-
--
--
-58
,740
--
59,9
86-
--
--
-59
,986
To
tal
--
58,7
40-
--
--
-58
,740
--
59,9
86-
--
--
-59
,986
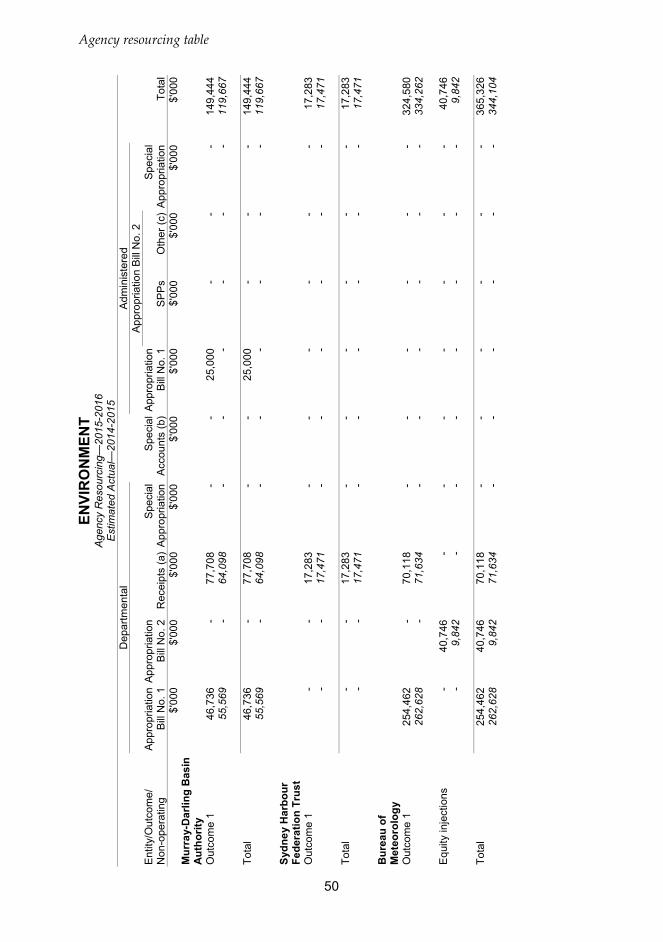
50
Agency resourcing table
ENVI
RO
NM
ENT
Age
ncy
Res
ourc
ing—
2015
-201
6 E
stim
ated
Act
ual—
2014
-201
5
Dep
artm
enta
l A
dmin
iste
red
A
ppro
pria
tion
Bill
No.
2
Ent
ity/O
utco
me/
N
on-o
pera
ting
App
ropr
iatio
nB
ill N
o. 1
App
ropr
iatio
nB
ill N
o. 2
Rec
eipt
s (a
)S
peci
alA
ppro
pria
tion
Spe
cial
A
ccou
nts
(b)
App
ropr
iatio
nB
ill N
o. 1
SP
Ps
Oth
er (c
)S
peci
alA
ppro
pria
tion
Tota
l
$'00
0$'
000
$'00
0$'
000
$'00
0$'
000
$'00
0$'
000
$'00
0$'
000
Mur
ray-
Dar
ling
Bas
in
Aut
horit
y O
utco
me
1 46
,736
-77
,708
--
25,0
00-
--
149,
444
55,5
69-
64,0
98-
--
--
-11
9,66
7
Tota
l 46
,736
-77
,708
--
25,0
00-
--
149,
444
55,5
69-
64,0
98-
--
--
-11
9,66
7
Sydn
ey H
arbo
ur
Fede
ratio
n Tr
ust
Out
com
e 1
--
17,2
83-
--
--
-17
,283
--
17,4
71-
--
--
-17
,471
To
tal
--
17,2
83-
--
--
-17
,283
--
17,4
71-
--
--
-17
,471
B
urea
u of
M
eteo
rolo
gy
Out
com
e 1
254,
462
-70
,118
--
--
--
324,
580
262,
628
-71
,634
--
--
--
334,
262
E
quity
inje
ctio
ns
-40
,746
--
--
--
-40
,746
-9,
842
--
--
--
-9,
842
To
tal
254,
462
40,7
4670
,118
--
--
--
365,
326
262,
628
9,84
271
,634
--
--
--
344,
104

Agency resourcing table
51
ENVI
RO
NM
ENT
Age
ncy
Res
ourc
ing—
2015
-201
6 E
stim
ated
Act
ual—
2014
-201
5
Dep
artm
enta
l A
dmin
iste
red
A
ppro
pria
tion
Bill
No.
2
Ent
ity/O
utco
me/
N
on-o
pera
ting
App
ropr
iatio
nB
ill N
o. 1
App
ropr
iatio
nB
ill N
o. 2
Rec
eipt
s (a
)S
peci
alA
ppro
pria
tion
Spe
cial
A
ccou
nts
(b)
App
ropr
iatio
nB
ill N
o. 1
SP
Ps
Oth
er (c
)S
peci
alA
ppro
pria
tion
Tota
l
$'00
0$'
000
$'00
0$'
000
$'00
0$'
000
$'00
0$'
000
$'00
0$'
000
Cle
an E
nerg
y R
egul
ator
O
utco
me
1 74
,597
--
--
303,
600
--
395
378,
592
77,8
47-
--
16,2
0479
,269
--
317,
432
490,
752
E
quity
inje
ctio
ns
--
--
--
--
--
-4,
406
--
--
--
-4,
406
To
tal
74,5
97-
--
-30
3,60
0-
-39
537
8,59
277
,847
4,40
6-
-16
,204
79,2
69-
-31
7,43
249
5,15
8
Clim
ate
Cha
nge
Aut
horit
y O
utco
me
1 3,
561
--
--
--
--
3,56
1-
-3,
538
--
--
--
3,53
8
Tota
l 3,
561
--
--
--
--
3,56
1-
-3,
538
--
--
--
3,53
8
Gre
at B
arrie
r Ree
f M
arin
e Pa
rk
Aut
horit
y O
utco
me
1 18
,162
-13
,120
8,40
08,
412
--
--
48,0
9422
,260
-13
,670
5,00
08,
412
--
--
49,3
42
Tota
l 18
,162
-13
,120
8,40
08,
412
--
--
48,0
9422
,260
-13
,670
5,00
08,
412
--
--
49,3
42

52
Agency resourcing table
ENVI
RO
NM
ENT
Age
ncy
Res
ourc
ing—
2015
-201
6 E
stim
ated
Act
ual—
2014
-201
5
Dep
artm
enta
l A
dmin
iste
red
A
ppro
pria
tion
Bill
No.
2
Ent
ity/O
utco
me/
N
on-o
pera
ting
App
ropr
iatio
nB
ill N
o. 1
App
ropr
iatio
nB
ill N
o. 2
Rec
eipt
s (a
)S
peci
alA
ppro
pria
tion
Spe
cial
A
ccou
nts
(b)
App
ropr
iatio
nB
ill N
o. 1
SP
Ps
Oth
er (c
)S
peci
alA
ppro
pria
tion
Tota
l
$'00
0$'
000
$'00
0$'
000
$'00
0$'
000
$'00
0$'
000
$'00
0$'
000
Nat
iona
l Wat
er
Com
mis
sion
O
utco
me
1 -
--
--
--
--
-4,
922
--
--
--
--
4,92
2
Tota
l -
--
--
--
--
-4,
922
--
--
--
--
4,92
2
PO
RTF
OLI
O
TO
TAL
825,
988
41,3
9129
4,04
78,
400
47,0
691,
139,
600
2,10
065
,606
41,3
952,
465,
596
867,
258
16,9
9330
2,61
75,
000
49,0
2076
8,91
55,
620
62,2
0433
8,99
22,
416,
619
(a)
Rec
eipt
s th
at w
ere
not a
ppro
pria
ted
to th
e en
tity
by a
n an
nual
App
ropr
iatio
n A
ct o
r ano
ther
Act
. (b
) A
mou
nts
cred
ited
to a
spe
cial
acc
ount
that
wer
e no
t app
ropr
iate
d to
the
entit
y by
an
annu
al A
ppro
pria
tion
Act
or a
noth
er A
ct.
(c)
Incl
udes
New
Adm
inis
tere
d O
utco
mes
and
adm
inis
tere
d as
sets
and
liab
ilitie
s ite
m, w
ithin
the
mea
ning
of A
ppro
pria
tion
Bill
No.
2.

Agency resourcing table
53
FIN
AN
CE
Age
ncy
Res
ourc
ing—
2015
-201
6 E
stim
ated
Act
ual—
2014
-201
5
Dep
artm
enta
l A
dmin
iste
red
A
ppro
pria
tion
Bill
No.
2
Ent
ity/O
utco
me/
N
on-o
pera
ting
App
ropr
iatio
nB
ill N
o. 1
App
ropr
iatio
nB
ill N
o. 2
Rec
eipt
s (a
)S
peci
alA
ppro
pria
tion
Spe
cial
A
ccou
nts
(b)
App
ropr
iatio
nB
ill N
o. 1
SP
Ps
Oth
er (c
)S
peci
alA
ppro
pria
tion
Tota
l
$'00
0$'
000
$'00
0$'
000
$'00
0$'
000
$'00
0$'
000
$'00
0$'
000
Dep
artm
ent o
f Fi
nanc
e O
utco
me
1 11
2,38
5-
--
--
--
-11
2,38
510
7,82
2-
7,59
6-
4,28
2,99
913
,652
--
8,63
1,00
813
,043
,077
O
utco
me
2 12
1,58
4-
7,84
4-
13,5
35,3
7712
,205
--
8,18
8,36
021
,865
,370
180,
527
-1,
884
75,5
2630
8,92
969
4-
-3,
252,
205
3,81
9,76
5
Out
com
e 3
34,9
97-
9,38
8-
-27
7,65
0-
-18
3,00
950
5,04
435
,655
-8,
976
--
277,
236
--
172,
500
494,
367
E
quity
inje
ctio
ns
-15
5,08
4-
--
--
--
155,
084
-21
3,87
7-
--
--
--
213,
877
A
dmin
iste
red
Ass
ets
and
Liab
ilitie
s -
--
--
--
1,60
6-
1,60
6-
--
--
--
1,55
6-
1,55
6
Spe
cial
Cap
ital
App
ropr
iatio
n -
--
--
--
-1,
983,
404
1,98
3,40
4-
--
--
--
-2,
722,
008
2,72
2,00
8
Tota
l 26
8,96
615
5,08
417
,232
-13
,535
,377
289,
855
-1,
606
10,3
54,7
7324
,622
,893
324,
004
213,
877
18,4
5675
,526
4,59
1,92
829
1,58
2-
1,55
614
,777
,721
20,2
94,6
50
Com
mon
wea
lth
Supe
rann
uatio
n C
orpo
ratio
n O
utco
me
1 -
-4,
181
--
--
--
4,18
1-
-13
,398
--
--
--
13,3
98
Tota
l -
-4,
181
--
--
--
4,18
1-
-13
,398
--
--
--
13,3
98
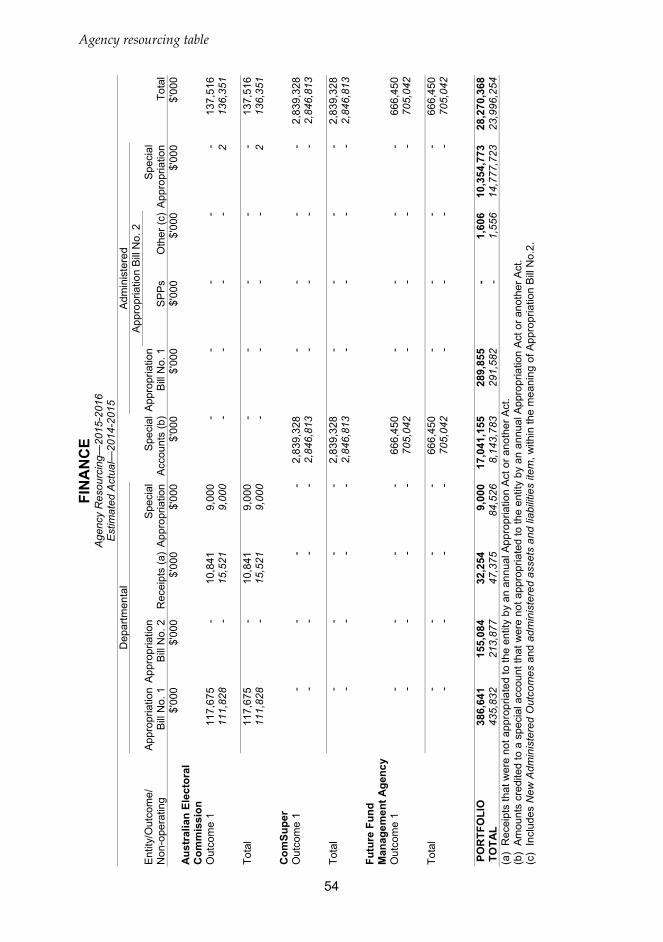
54
Agency resourcing table
FIN
AN
CE
Age
ncy
Res
ourc
ing—
2015
-201
6 E
stim
ated
Act
ual—
2014
-201
5
Dep
artm
enta
l A
dmin
iste
red
A
ppro
pria
tion
Bill
No.
2
Ent
ity/O
utco
me/
N
on-o
pera
ting
App
ropr
iatio
nB
ill N
o. 1
App
ropr
iatio
nB
ill N
o. 2
Rec
eipt
s (a
)S
peci
alA
ppro
pria
tion
Spe
cial
A
ccou
nts
(b)
App
ropr
iatio
nB
ill N
o. 1
SP
Ps
Oth
er (c
)S
peci
alA
ppro
pria
tion
Tota
l
$'00
0$'
000
$'00
0$'
000
$'00
0$'
000
$'00
0$'
000
$'00
0$'
000
Aus
tral
ian
Elec
tora
l C
omm
issi
on
Out
com
e 1
117,
675
-10
,841
9,00
0-
--
--
137,
516
111,
828
-15
,521
9,00
0-
--
-2
136,
351
To
tal
117,
675
-10
,841
9,00
0-
--
--
137,
516
111,
828
-15
,521
9,00
0-
--
-2
136,
351
C
omSu
per
Out
com
e 1
--
--
2,83
9,32
8-
--
-2,
839,
328
--
--
2,84
6,81
3-
--
-2,
846,
813
To
tal
--
--
2,83
9,32
8-
--
-2,
839,
328
--
--
2,84
6,81
3-
--
-2,
846,
813
Fu
ture
Fun
d M
anag
emen
t Age
ncy
Out
com
e 1
--
--
666,
450
--
--
666,
450
--
--
705,
042
--
--
705,
042
To
tal
--
--
666,
450
--
--
666,
450
--
--
705,
042
--
--
705,
042
P
OR
TFO
LIO
T
OTA
L 38
6,64
115
5,08
432
,254
9,00
017
,041
,155
289,
855
-1,
606
10,3
54,7
7328
,270
,368
435,
832
213,
877
47,3
7584
,526
8,14
3,78
329
1,58
2-
1,55
614
,777
,723
23,9
96,2
54(a
) R
ecei
pts
that
wer
e no
t app
ropr
iate
d to
the
entit
y by
an
annu
al A
ppro
pria
tion
Act
or a
noth
er A
ct.
(b)
Am
ount
s cr
edite
d to
a s
peci
al a
ccou
nt th
at w
ere
not a
ppro
pria
ted
to th
e en
tity
by a
n an
nual
App
ropr
iatio
n A
ct o
r ano
ther
Act
. (c
) In
clud
es N
ew A
dmin
iste
red
Out
com
es a
nd a
dmin
iste
red
asse
ts a
nd li
abili
ties
item
, with
in th
e m
eani
ng o
f App
ropr
iatio
n B
ill N
o.2.

Agency resourcing table
55
FOR
EIG
N A
FFA
IRS
AN
D T
RA
DE
Age
ncy
Res
ourc
ing—
2015
-201
6 E
stim
ated
Act
ual—
2014
-201
5
Dep
artm
enta
l A
dmin
iste
red
A
ppro
pria
tion
Bill
No.
2
Ent
ity/O
utco
me/
N
on-o
pera
ting
App
ropr
iatio
nB
ill N
o. 1
App
ropr
iatio
nB
ill N
o. 2
Rec
eipt
s (a
)S
peci
alA
ppro
pria
tion
Spe
cial
A
ccou
nts
(b)
App
ropr
iatio
nB
ill N
o. 1
SP
Ps
Oth
er (c
)S
peci
alA
ppro
pria
tion
Tota
l
$'00
0$'
000
$'00
0$'
000
$'00
0$'
000
$'00
0$'
000
$'00
0$'
000
Dep
artm
ent o
f Fo
reig
n A
ffairs
and
Tr
ade
Out
com
e 1
866,
556
-81
,599
-25
7,00
03,
579,
158
--
-4,
784,
313
841,
458
-81
,599
-27
5,77
54,
530,
015
--
-5,
728,
847
O
utco
me
2 34
0,09
1-
--
100
750
--
1,01
034
1,95
132
9,26
4-
--
100
750
--
1,01
033
1,12
4
Out
com
e 3
193,
343
--
-93
,540
--
--
286,
883
206,
594
--
-91
,964
--
--
298,
558
E
quity
inje
ctio
ns
-20
5,24
1-
--
--
--
205,
241
-12
0,92
0-
--
--
--
120,
920
A
dmin
iste
red
Ass
ets
and
Liab
ilitie
s -
--
--
--
13,5
27-
13,5
27-
--
--
--
212,
698
-21
2,69
8
Tota
l 1,
399,
990
205,
241
81,5
99-
350,
640
3,57
9,90
8-
13,5
271,
010
5,63
1,91
51,
377,
316
120,
920
81,5
99-
367,
839
4,53
0,76
5-
212,
698
1,01
06,
692,
147
To
uris
m A
ustr
alia
O
utco
me
1 13
7,29
0-
--
--
--
-13
7,29
013
8,86
5-
1,75
0-
--
--
-14
0,61
5
Tota
l 13
7,29
0-
--
--
--
-13
7,29
013
8,86
5-
1,75
0-
--
--
-14
0,61
5
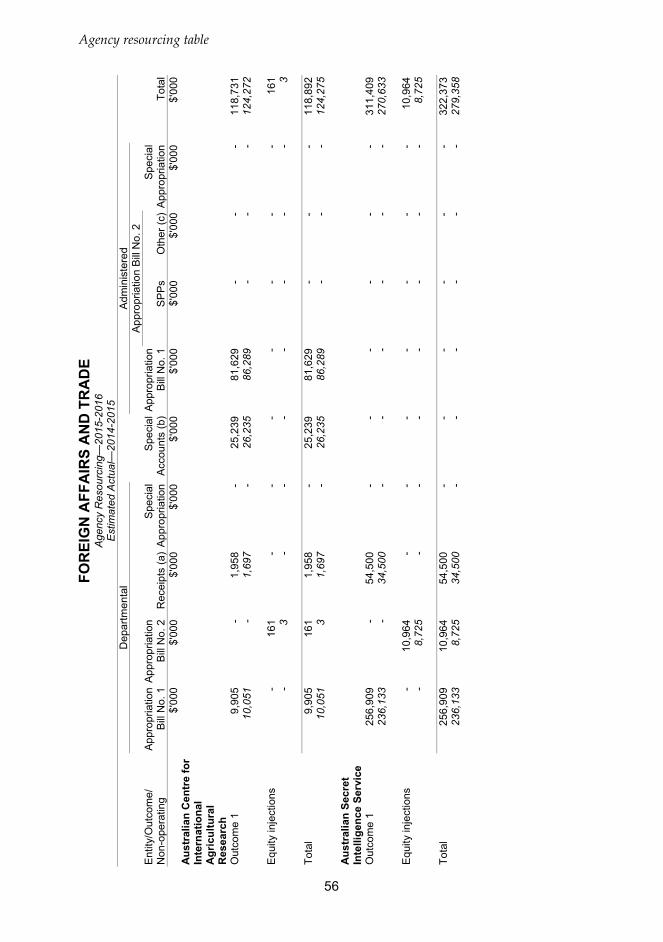
56
Agency resourcing table
FOR
EIG
N A
FFA
IRS
AN
D T
RA
DE
Age
ncy
Res
ourc
ing—
2015
-201
6 E
stim
ated
Act
ual—
2014
-201
5
Dep
artm
enta
l A
dmin
iste
red
A
ppro
pria
tion
Bill
No.
2
Ent
ity/O
utco
me/
N
on-o
pera
ting
App
ropr
iatio
nB
ill N
o. 1
App
ropr
iatio
nB
ill N
o. 2
Rec
eipt
s (a
)S
peci
alA
ppro
pria
tion
Spe
cial
A
ccou
nts
(b)
App
ropr
iatio
nB
ill N
o. 1
SP
Ps
Oth
er (c
)S
peci
alA
ppro
pria
tion
Tota
l
$'00
0$'
000
$'00
0$'
000
$'00
0$'
000
$'00
0$'
000
$'00
0$'
000
Aus
tral
ian
Cen
tre
for
Inte
rnat
iona
l A
gric
ultu
ral
Res
earc
h O
utco
me
1 9,
905
-1,
958
-25
,239
81,6
29-
--
118,
731
10,0
51-
1,69
7-
26,2
3586
,289
--
-12
4,27
2
Equ
ity in
ject
ions
-
161
--
--
--
-16
1-
3-
--
--
--
3
Tota
l 9,
905
161
1,95
8-
25,2
3981
,629
--
-11
8,89
210
,051
31,
697
-26
,235
86,2
89-
--
124,
275
A
ustr
alia
n Se
cret
In
telli
genc
e Se
rvic
e O
utco
me
1 25
6,90
9-
54,5
00-
--
--
-31
1,40
923
6,13
3-
34,5
00-
--
--
-27
0,63
3
Equ
ity in
ject
ions
-
10,9
64-
--
--
--
10,9
64-
8,72
5-
--
--
--
8,72
5
Tota
l 25
6,90
910
,964
54,5
00-
--
--
-32
2,37
323
6,13
38,
725
34,5
00-
--
--
-27
9,35
8

Agency resourcing table
57
FOR
EIG
N A
FFA
IRS
AN
D T
RA
DE
Age
ncy
Res
ourc
ing—
2015
-201
6 E
stim
ated
Act
ual—
2014
-201
5
Dep
artm
enta
l A
dmin
iste
red
A
ppro
pria
tion
Bill
No.
2
Ent
ity/O
utco
me/
N
on-o
pera
ting
App
ropr
iatio
nB
ill N
o. 1
App
ropr
iatio
nB
ill N
o. 2
Rec
eipt
s (a
)S
peci
alA
ppro
pria
tion
Spe
cial
A
ccou
nts
(b)
App
ropr
iatio
nB
ill N
o. 1
SP
Ps
Oth
er (c
)S
peci
alA
ppro
pria
tion
Tota
l
$'00
0$'
000
$'00
0$'
000
$'00
0$'
000
$'00
0$'
000
$'00
0$'
000
Aus
tral
ian
Trad
e C
omm
issi
on
Out
com
e 1
211,
718
-16
,496
-9,
433
145,
277
--
-38
2,92
419
7,04
5-
16,4
96-
10,2
6013
9,40
0-
--
363,
201
O
utco
me
2 9,
497
-3,
504
--
--
--
13,0
019,
314
-3,
504
--
--
--
12,8
18
Equ
ity in
ject
ions
-
2,71
8-
--
--
--
2,71
8-
505
--
--
--
-50
5
Tota
l 22
1,21
52,
718
20,0
00-
9,43
314
5,27
7-
--
398,
643
206,
359
505
20,0
00-
10,2
6013
9,40
0-
--
376,
524
P
OR
TFO
LIO
T
OTA
L 2,
025,
309
219,
084
158,
057
-38
5,31
23,
806,
814
-13
,527
1,01
06,
609,
113
1,96
8,72
413
0,15
313
9,54
6-
404,
334
4,75
6,45
4-
212,
698
1,01
07,
612,
919
(a)
Rec
eipt
s th
at w
ere
not a
ppro
pria
ted
to th
e en
tity
by a
n an
nual
App
ropr
iatio
n A
ct o
r ano
ther
Act
. (b
) A
mou
nts
cred
ited
to a
spe
cial
acc
ount
that
wer
e no
t app
ropr
iate
d to
the
entit
y by
an
annu
al A
ppro
pria
tion
Act
or a
noth
er A
ct.
(c)
Incl
udes
New
Adm
inis
tere
d O
utco
mes
and
adm
inis
tere
d as
sets
and
liab
ilitie
s ite
m, w
ithin
the
mea
ning
of A
ppro
pria
tion
Bill
No.
2.

58
Agency resourcing table
HEA
LTH
A
genc
y R
esou
rcin
g—20
15-2
016
Est
imat
ed A
ctua
l—20
14-2
015
D
epar
tmen
tal
Adm
inis
tere
d
App
ropr
iatio
n B
ill N
o. 2
E
ntity
/Out
com
e/
Non
-ope
ratin
g A
ppro
pria
tion
Bill
No.
1A
ppro
pria
tion
Bill
No.
2R
ecei
pts
(a)
Spe
cial
App
ropr
iatio
nS
peci
al
Acc
ount
s (b
)A
ppro
pria
tion
Bill
No.
1S
PP
sO
ther
(c)
Spe
cial
App
ropr
iatio
nTo
tal
$'
000
$'00
0$'
000
$'00
0$'
000
$'00
0$'
000
$'00
0$'
000
$'00
0D
epar
tmen
t of H
ealth
O
utco
me
1 52
,310
-18
,868
-8,
226
320,
545
--
242,
528
642,
477
68,4
47-
19,3
44-
12,8
3732
7,52
2-
-16
0,40
558
8,55
5
Out
com
e 2
53,4
58-
975
--
726,
663
--
10,1
16,8
5210
,897
,948
54,3
63-
947
--
755,
437
--
9,59
6,86
610
,407
,613
Out
com
e 3
46,4
65-
975
--
636,
136
--
21,8
16,4
1222
,499
,988
49,0
17-
947
--
586,
451
--
20,8
17,0
7521
,453
,490
Out
com
e 4
55,0
48-
1,39
4-
-79
,783
--
-13
6,22
546
,707
-1,
217
--
99,9
58-
--
147,
882
Out
com
e 5
97,6
03-
2,23
0-
-2,
322,
360
--
-2,
422,
193
98,4
77-
2,02
9-
-2,
202,
963
--
-2,
303,
469
Out
com
e 6
6,77
9-
2,36
9-
-2,
328
--
6,68
6,05
46,
697,
530
9,28
7-
2,43
4-
-2,
247
--
6,37
1,91
96,
385,
887
Out
com
e 7
68,5
55-
1,25
4-
465,
304
296,
080
--
721,
297
1,55
2,49
075
,715
-1,
217
-86
4,93
634
8,47
9-
-53
5,34
51,
825,
692
Out
com
e 8
39,7
56-
836
--
1,31
8,64
1-
--
1,35
9,23
349
,284
-81
2-
-1,
391,
752
--
-1,
441,
848
Out
com
e 9
16,9
63-
2,23
0-
-58
,642
--
-77
,835
20,4
11-
2,16
4-
-58
,005
--
-80
,580
Out
com
e 10
8,
056
-41
8-
407
26,9
48-
--
35,8
2914
,641
-54
1-
12,1
9747
,796
--
-75
,175
Equ
ity in
ject
ions
-
8,41
0-
--
--
--
8,41
0-
8,82
0-
--
--
--
8,82
0
Adm
inis
tere
d A
sset
s an
d Li
abili
ties
--
--
--
-31
,741
-31
,741
--
--
--
-5,
682
-5,
682
Tota
l 44
4,99
38,
410
31,5
49-
473,
937
5,78
8,12
6-
31,7
4139
,583
,143
46,3
61,8
9948
6,34
98,
820
31,6
52-
889,
970
5,82
0,61
0-
5,68
237
,481
,610
44,7
24,6
93

Agency resourcing table
59
HEA
LTH
A
genc
y R
esou
rcin
g—20
15-2
016
Est
imat
ed A
ctua
l—20
14-2
015
D
epar
tmen
tal
Adm
inis
tere
d
App
ropr
iatio
n B
ill N
o. 2
E
ntity
/Out
com
e/
Non
-ope
ratin
g A
ppro
pria
tion
Bill
No.
1A
ppro
pria
tion
Bill
No.
2R
ecei
pts
(a)
Spe
cial
App
ropr
iatio
nS
peci
al
Acc
ount
s (b
)A
ppro
pria
tion
Bill
No.
1S
PP
sO
ther
(c)
Spe
cial
App
ropr
iatio
nTo
tal
$'
000
$'00
0$'
000
$'00
0$'
000
$'00
0$'
000
$'00
0$'
000
$'00
0A
ustr
alia
n C
omm
issi
on o
n Sa
fety
and
Qua
lity
in
Hea
lth C
are
Out
com
e 1
--
19,8
03-
--
--
-19
,803
--
24,3
59-
--
--
-24
,359
Tota
l -
-19
,803
--
--
--
19,8
03-
-24
,359
--
--
--
24,3
59
Aus
tral
ian
Inst
itute
of
Hea
lth a
nd W
elfa
re
Out
com
e 1
15,6
25-
30,6
30-
--
--
-46
,255
15,8
00-
32,6
59-
--
--
-48
,459
Tota
l 15
,625
-30
,630
--
--
--
46,2
5515
,800
-32
,659
--
--
--
48,4
59
Aus
tral
ian
Spor
ts
Com
mis
sion
O
utco
me
1 83
,319
-6,
723
--
--
--
90,0
4287
,593
-14
,087
--
--
--
101,
680
Out
com
e 2
170,
327
-17
,000
--
--
--
187,
327
178,
475
-20
,212
--
--
--
198,
687
Equ
ity in
ject
ions
-
--
--
--
--
--
1,50
0-
--
--
--
1,50
0
Tota
l 25
3,64
6-
23,7
23-
--
--
-27
7,36
926
6,06
81,
500
34,2
99-
--
--
-30
1,86
7

60
Agency resourcing table
HEA
LTH
A
genc
y R
esou
rcin
g—20
15-2
016
Est
imat
ed A
ctua
l—20
14-2
015
D
epar
tmen
tal
Adm
inis
tere
d
App
ropr
iatio
n B
ill N
o. 2
E
ntity
/Out
com
e/
Non
-ope
ratin
g A
ppro
pria
tion
Bill
No.
1A
ppro
pria
tion
Bill
No.
2R
ecei
pts
(a)
Spe
cial
App
ropr
iatio
nS
peci
al
Acc
ount
s (b
)A
ppro
pria
tion
Bill
No.
1S
PP
sO
ther
(c)
Spe
cial
App
ropr
iatio
nTo
tal
$'
000
$'00
0$'
000
$'00
0$'
000
$'00
0$'
000
$'00
0$'
000
$'00
0A
ustr
alia
n Sp
orts
Fo
unda
tion
Lim
ited
Out
com
e 1
--
28,8
50-
--
--
-28
,850
--
21,7
88-
--
--
-21
,788
To
tal
--
28,8
50-
--
--
-28
,850
--
21,7
88-
--
--
-21
,788
Fo
od S
tand
ards
A
ustr
alia
New
Ze
alan
d O
utco
me
1 17
,257
-1,
993
--
--
--
19,2
5017
,479
-2,
169
--
--
--
19,6
48
Tota
l 17
,257
-1,
993
--
--
--
19,2
5017
,479
-2,
169
--
--
--
19,6
48
Gen
eral
Pra
ctic
e Ed
ucat
ion
and
Trai
ning
Lim
ited
Out
com
e 1
--
--
--
--
--
--
118,
749
--
--
--
118,
749
To
tal
--
--
--
--
--
--
118,
749
--
--
--
118,
749

Agency resourcing table
61
HEA
LTH
A
genc
y R
esou
rcin
g—20
15-2
016
Est
imat
ed A
ctua
l—20
14-2
015
D
epar
tmen
tal
Adm
inis
tere
d
App
ropr
iatio
n B
ill N
o. 2
E
ntity
/Out
com
e/
Non
-ope
ratin
g A
ppro
pria
tion
Bill
No.
1A
ppro
pria
tion
Bill
No.
2R
ecei
pts
(a)
Spe
cial
App
ropr
iatio
nS
peci
al
Acc
ount
s (b
)A
ppro
pria
tion
Bill
No.
1S
PP
sO
ther
(c)
Spe
cial
App
ropr
iatio
nTo
tal
$'
000
$'00
0$'
000
$'00
0$'
000
$'00
0$'
000
$'00
0$'
000
$'00
0In
depe
nden
t Hos
pita
l Pr
icin
g A
utho
rity
Out
com
e 1
25,8
77-
--
--
--
-25
,877
25,7
26-
--
--
--
-25
,726
To
tal
25,8
77-
--
--
--
-25
,877
25,7
26-
--
--
--
-25
,726
N
atio
nal H
ealth
Pe
rfor
man
ce
Aut
horit
y O
utco
me
1 34
,097
--
--
--
--
34,0
9733
,850
--
--
--
--
33,8
50
Tota
l 34
,097
--
--
--
--
34,0
9733
,850
--
--
--
--
33,8
50
Priv
ate
Hea
lth
Insu
ranc
e A
dmin
istr
atio
n C
ounc
il O
utco
me
1 -
-7,
137
--
--
--
7,13
7-
-4,
682
--
--
--
4,68
2
Tota
l -
-7,
137
--
--
--
7,13
7-
-4,
682
--
--
--
4,68
2

62
Agency resourcing table
HEA
LTH
A
genc
y R
esou
rcin
g—20
15-2
016
Est
imat
ed A
ctua
l—20
14-2
015
D
epar
tmen
tal
Adm
inis
tere
d
App
ropr
iatio
n B
ill N
o. 2
E
ntity
/Out
com
e/
Non
-ope
ratin
g A
ppro
pria
tion
Bill
No.
1A
ppro
pria
tion
Bill
No.
2R
ecei
pts
(a)
Spe
cial
App
ropr
iatio
nS
peci
al
Acc
ount
s (b
)A
ppro
pria
tion
Bill
No.
1S
PP
sO
ther
(c)
Spe
cial
App
ropr
iatio
nTo
tal
$'
000
$'00
0$'
000
$'00
0$'
000
$'00
0$'
000
$'00
0$'
000
$'00
0A
ustr
alia
n O
rgan
and
Ti
ssue
Don
atio
n an
d Tr
ansp
lant
atio
n A
utho
rity
Out
com
e 1
5,92
6-
--
-46
,872
--
-52
,798
6,86
2-
--
-40
,394
--
-47
,256
To
tal
5,92
6-
--
-46
,872
--
-52
,798
6,86
2-
--
-40
,394
--
-47
,256
A
ustr
alia
n R
adia
tion
Prot
ectio
n an
d N
ucle
ar S
afet
y A
genc
y O
utco
me
1 15
,043
--
-10
,046
--
--
25,0
8915
,256
--
-10
,046
--
--
25,3
02
Tota
l 15
,043
--
-10
,046
--
--
25,0
8915
,256
--
-10
,046
--
--
25,3
02
Aus
tral
ian
Spor
ts
Ant
i-Dop
ing
Aut
horit
y O
utco
me
1 12
,607
-30
0-
--
--
-12
,907
13,3
13-
300
--
--
--
13,6
13
Tota
l 12
,607
-30
0-
--
--
-12
,907
13,3
13-
300
--
--
--
13,6
13

Agency resourcing table
63
HEA
LTH
A
genc
y R
esou
rcin
g—20
15-2
016
Est
imat
ed A
ctua
l—20
14-2
015
D
epar
tmen
tal
Adm
inis
tere
d
App
ropr
iatio
n B
ill N
o. 2
E
ntity
/Out
com
e/
Non
-ope
ratin
g A
ppro
pria
tion
Bill
No.
1A
ppro
pria
tion
Bill
No.
2R
ecei
pts
(a)
Spe
cial
App
ropr
iatio
nS
peci
al
Acc
ount
s (b
)A
ppro
pria
tion
Bill
No.
1S
PP
sO
ther
(c)
Spe
cial
App
ropr
iatio
nTo
tal
$'
000
$'00
0$'
000
$'00
0$'
000
$'00
0$'
000
$'00
0$'
000
$'00
0C
ance
r Aus
tral
ia
Out
com
e 1
12,0
91-
1,12
8-
-16
,938
--
-30
,157
12,0
51-
1,53
4-
-16
,744
--
-30
,329
To
tal
12,0
91-
1,12
8-
-16
,938
--
-30
,157
12,0
51-
1,53
4-
-16
,744
--
-30
,329
N
atio
nal B
lood
A
utho
rity
Out
com
e 1
5,91
2-
--
1,32
0,39
97,
070
--
-1,
333,
381
6,93
8-
--
1,07
6,60
07,
178
--
-1,
090,
716
To
tal
5,91
2-
--
1,32
0,39
97,
070
--
-1,
333,
381
6,93
8-
--
1,07
6,60
07,
178
--
-1,
090,
716
N
atio
nal H
ealth
and
M
edic
al R
esea
rch
Cou
ncil
Out
com
e 1
44,4
41-
1,50
0-
34,0
0084
0,58
3-
--
920,
524
42,6
81-
2,00
0-
38,6
0090
5,71
5-
--
988,
996
To
tal
44,4
41-
1,50
0-
34,0
0084
0,58
3-
--
920,
524
42,6
81-
2,00
0-
38,6
0090
5,71
5-
--
988,
996
N
atio
nal H
ealth
Fu
ndin
g B
ody
Out
com
e 1
4,31
5-
--
--
--
-4,
315
4,34
8-
--
--
--
-4,
348
To
tal
4,31
5-
--
--
--
-4,
315
4,34
8-
--
--
--
-4,
348

64
Agency resourcing table
HEA
LTH
A
genc
y R
esou
rcin
g—20
15-2
016
Est
imat
ed A
ctua
l—20
14-2
015
D
epar
tmen
tal
Adm
inis
tere
d
App
ropr
iatio
n B
ill N
o. 2
E
ntity
/Out
com
e/
Non
-ope
ratin
g A
ppro
pria
tion
Bill
No.
1A
ppro
pria
tion
Bill
No.
2R
ecei
pts
(a)
Spe
cial
App
ropr
iatio
nS
peci
al
Acc
ount
s (b
)A
ppro
pria
tion
Bill
No.
1S
PP
sO
ther
(c)
Spe
cial
App
ropr
iatio
nTo
tal
$'
000
$'00
0$'
000
$'00
0$'
000
$'00
0$'
000
$'00
0$'
000
$'00
0N
atio
nal M
enta
l H
ealth
Com
mis
sion
O
utco
me
1 2,
826
--
--
3,64
9-
--
6,47
52,
866
--
--
3,61
7-
--
6,48
3
Tota
l 2,
826
--
--
3,64
9-
--
6,47
52,
866
--
--
3,61
7-
--
6,48
3
Priv
ate
Hea
lth
Insu
ranc
e O
mbu
dsm
an
Out
com
e 1
--
--
--
--
--
3,17
6-
10-
--
--
-3,
186
To
tal
--
--
--
--
--
3,17
6-
10-
--
--
-3,
186
Pr
ofes
sion
al
Serv
ices
Rev
iew
O
utco
me
1 5,
533
--
--
--
--
5,53
35,
742
--
--
--
--
5,74
2
Tota
l 5,
533
--
--
--
--
5,53
35,
742
--
--
--
--
5,74
2
PO
RTF
OLI
O
TO
TAL
900,
189
8,41
014
6,61
3-
1,83
8,38
26,
703,
238
-31
,741
39,5
83,1
4349
,211
,716
958,
505
10,3
2027
4,20
1-
2,01
5,21
66,
794,
258
-5,
682
37,4
81,6
1047
,539
,792
(a)
Rec
eipt
s th
at w
ere
not a
ppro
pria
ted
to th
e en
tity
by a
n an
nual
App
ropr
iatio
n A
ct o
r ano
ther
Act
. (b
) A
mou
nts
cred
ited
to a
spe
cial
acc
ount
that
wer
e no
t app
ropr
iate
d to
the
entit
y by
an
annu
al A
ppro
pria
tion
Act
or a
noth
er A
ct.
(c)
Incl
udes
New
Adm
inis
tere
d O
utco
mes
and
adm
inis
tere
d as
sets
and
liab
ilitie
s ite
m, w
ithin
the
mea
ning
of A
ppro
pria
tion
Bill
No.
2.
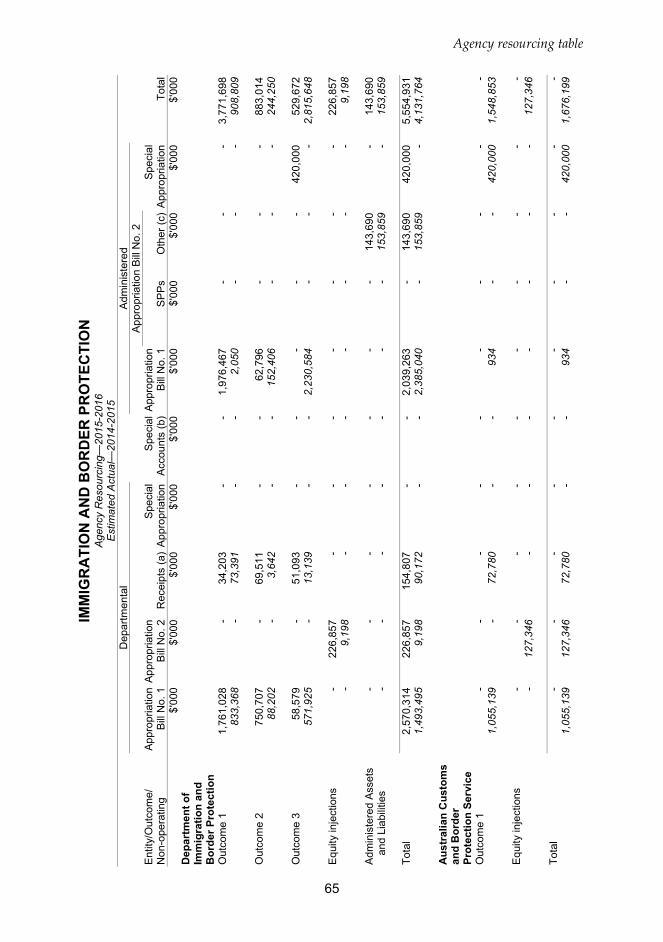
Agency resourcing table
65
IMM
IGR
ATI
ON
AN
D B
OR
DER
PR
OTE
CTI
ON
A
genc
y R
esou
rcin
g—20
15-2
016
Est
imat
ed A
ctua
l—20
14-2
015
D
epar
tmen
tal
Adm
inis
tere
d
App
ropr
iatio
n B
ill N
o. 2
E
ntity
/Out
com
e/
Non
-ope
ratin
g A
ppro
pria
tion
Bill
No.
1A
ppro
pria
tion
Bill
No.
2R
ecei
pts
(a)
Spe
cial
App
ropr
iatio
nS
peci
al
Acc
ount
s (b
)A
ppro
pria
tion
Bill
No.
1S
PP
sO
ther
(c)
Spe
cial
App
ropr
iatio
nTo
tal
$'
000
$'00
0$'
000
$'00
0$'
000
$'00
0$'
000
$'00
0$'
000
$'00
0D
epar
tmen
t of
Imm
igra
tion
and
Bor
der P
rote
ctio
n O
utco
me
1 1,
761,
028
-34
,203
--
1,97
6,46
7-
--
3,77
1,69
883
3,36
8-
73,3
91-
-2,
050
--
-90
8,80
9
Out
com
e 2
750,
707
-69
,511
--
62,7
96-
--
883,
014
88,2
02-
3,64
2-
-15
2,40
6-
--
244,
250
O
utco
me
3 58
,579
-51
,093
--
--
-42
0,00
052
9,67
257
1,92
5-
13,1
39-
-2,
230,
584
--
-2,
815,
648
E
quity
inje
ctio
ns
-22
6,85
7-
--
--
--
226,
857
-9,
198
--
--
--
-9,
198
A
dmin
iste
red
Ass
ets
and
Liab
ilitie
s -
--
--
--
143,
690
-14
3,69
0-
--
--
--
153,
859
-15
3,85
9
Tota
l 2,
570,
314
226,
857
154,
807
--
2,03
9,26
3-
143,
690
420,
000
5,55
4,93
11,
493,
495
9,19
890
,172
--
2,38
5,04
0-
153,
859
-4,
131,
764
A
ustr
alia
n C
usto
ms
and
Bor
der
Prot
ectio
n Se
rvic
e O
utco
me
1 -
--
--
--
--
-1,
055,
139
-72
,780
--
934
--
420,
000
1,54
8,85
3
Equ
ity in
ject
ions
-
--
--
--
--
--
127,
346
--
--
--
-12
7,34
6
Tota
l -
--
--
--
--
-1,
055,
139
127,
346
72,7
80-
-93
4-
-42
0,00
01,
676,
199

66
Agency resourcing table
IMM
IGR
ATI
ON
AN
D B
OR
DER
PR
OTE
CTI
ON
A
genc
y R
esou
rcin
g—20
15-2
016
Est
imat
ed A
ctua
l—20
14-2
015
D
epar
tmen
tal
Adm
inis
tere
d
App
ropr
iatio
n B
ill N
o. 2
E
ntity
/Out
com
e/
Non
-ope
ratin
g A
ppro
pria
tion
Bill
No.
1A
ppro
pria
tion
Bill
No.
2R
ecei
pts
(a)
Spe
cial
App
ropr
iatio
nS
peci
al
Acc
ount
s (b
)A
ppro
pria
tion
Bill
No.
1S
PP
sO
ther
(c)
Spe
cial
App
ropr
iatio
nTo
tal
$'
000
$'00
0$'
000
$'00
0$'
000
$'00
0$'
000
$'00
0$'
000
$'00
0M
igra
tion
Rev
iew
Tr
ibun
al a
nd R
efug
ee
Rev
iew
Trib
unal
O
utco
me
1 -
--
--
--
--
-84
,089
--
--
--
--
84,0
89
Tota
l -
--
--
--
--
-84
,089
--
--
--
--
84,0
89
PO
RTF
OLI
O
TO
TAL
2,57
0,31
422
6,85
715
4,80
7-
-2,
039,
263
-14
3,69
042
0,00
05,
554,
931
2,63
2,72
313
6,54
416
2,95
2-
-2,
385,
974
-15
3,85
942
0,00
05,
892,
052
(a)
Rec
eipt
s th
at w
ere
not a
ppro
pria
ted
to th
e en
tity
by a
n an
nual
App
ropr
iatio
n A
ct o
r ano
ther
Act
. (b
) A
mou
nts
cred
ited
to a
spe
cial
acc
ount
that
wer
e no
t app
ropr
iate
d to
the
entit
y by
an
annu
al A
ppro
pria
tion
Act
or a
noth
er A
ct.
(c)
Incl
udes
New
Adm
inis
tere
d O
utco
mes
and
adm
inis
tere
d as
sets
and
liab
ilitie
s ite
m, w
ithin
the
mea
ning
of A
ppro
pria
tion
Bill
No.
2.
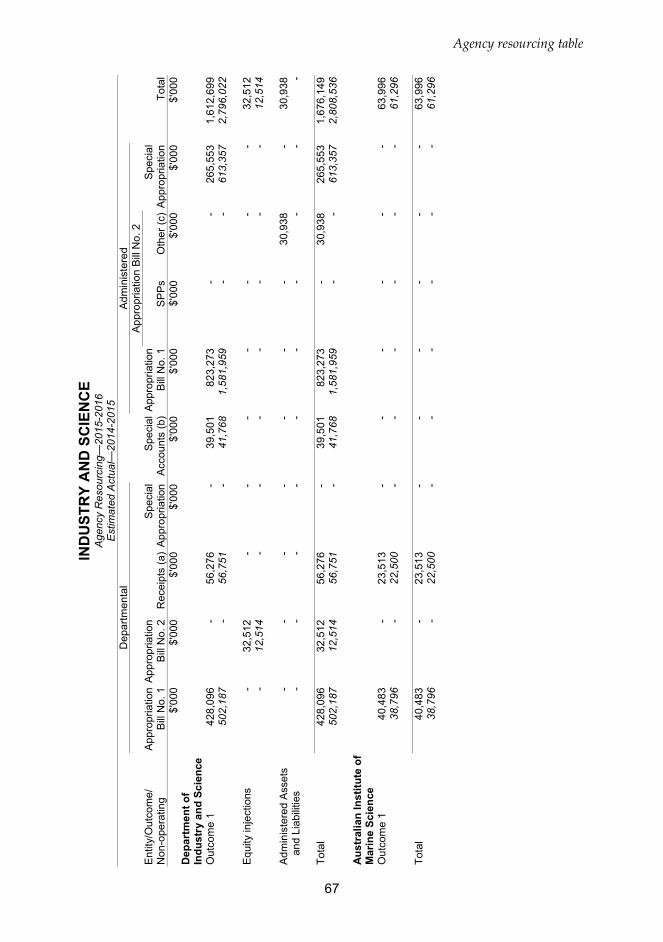
Agency resourcing table
67
IND
UST
RY
AN
D S
CIE
NC
E A
genc
y R
esou
rcin
g—20
15-2
016
Est
imat
ed A
ctua
l—20
14-2
015
D
epar
tmen
tal
Adm
inis
tere
d
App
ropr
iatio
n B
ill N
o. 2
E
ntity
/Out
com
e/
Non
-ope
ratin
g A
ppro
pria
tion
Bill
No.
1A
ppro
pria
tion
Bill
No.
2R
ecei
pts
(a)
Spe
cial
App
ropr
iatio
nS
peci
al
Acc
ount
s (b
)A
ppro
pria
tion
Bill
No.
1S
PP
sO
ther
(c)
Spe
cial
App
ropr
iatio
nTo
tal
$'
000
$'00
0$'
000
$'00
0$'
000
$'00
0$'
000
$'00
0$'
000
$'00
0D
epar
tmen
t of
Indu
stry
and
Sci
ence
O
utco
me
1 42
8,09
6-
56,2
76-
39,5
0182
3,27
3-
-26
5,55
31,
612,
699
502,
187
-56
,751
-41
,768
1,58
1,95
9-
-61
3,35
72,
796,
022
E
quity
inje
ctio
ns
-32
,512
--
--
--
-32
,512
-12
,514
--
--
--
-12
,514
A
dmin
iste
red
Ass
ets
and
Liab
ilitie
s -
--
--
--
30,9
38-
30,9
38-
--
--
--
--
-
Tota
l 42
8,09
632
,512
56,2
76-
39,5
0182
3,27
3-
30,9
3826
5,55
31,
676,
149
502,
187
12,5
1456
,751
-41
,768
1,58
1,95
9-
-61
3,35
72,
808,
536
A
ustr
alia
n In
stitu
te o
f M
arin
e Sc
ienc
e O
utco
me
1 40
,483
-23
,513
--
--
--
63,9
9638
,796
-22
,500
--
--
--
61,2
96
Tota
l 40
,483
-23
,513
--
--
--
63,9
9638
,796
-22
,500
--
--
--
61,2
96

68
Agency resourcing table
IND
UST
RY
AN
D S
CIE
NC
E A
genc
y R
esou
rcin
g—20
15-2
016
Est
imat
ed A
ctua
l—20
14-2
015
D
epar
tmen
tal
Adm
inis
tere
d
App
ropr
iatio
n B
ill N
o. 2
E
ntity
/Out
com
e/
Non
-ope
ratin
g A
ppro
pria
tion
Bill
No.
1A
ppro
pria
tion
Bill
No.
2R
ecei
pts
(a)
Spe
cial
App
ropr
iatio
nS
peci
al
Acc
ount
s (b
)A
ppro
pria
tion
Bill
No.
1S
PP
sO
ther
(c)
Spe
cial
App
ropr
iatio
nTo
tal
$'
000
$'00
0$'
000
$'00
0$'
000
$'00
0$'
000
$'00
0$'
000
$'00
0A
ustr
alia
n N
ucle
ar
Scie
nce
and
Tech
nolo
gy
Org
anis
atio
n O
utco
me
1 15
6,70
0-
118,
984
--
--
--
275,
684
157,
414
-11
1,21
3-
--
--
-26
8,62
7
Equ
ity in
ject
ions
-
35,9
16-
--
--
--
35,9
16-
96,4
39-
--
--
--
96,4
39
Tota
l 15
6,70
035
,916
118,
984
--
--
--
311,
600
157,
414
96,4
3911
1,21
3-
--
--
-36
5,06
6
Com
mon
wea
lth
Scie
ntifi
c an
d In
dust
rial R
esea
rch
Org
anis
atio
n O
utco
me
1 74
9,68
1-
542,
101
--
--
--
1,29
1,78
274
5,26
8-
505,
420
--
--
--
1,25
0,68
8
Tota
l 74
9,68
1-
542,
101
--
--
--
1,29
1,78
274
5,26
8-
505,
420
--
--
--
1,25
0,68
8

Agency resourcing table
69
IND
UST
RY
AN
D S
CIE
NC
E A
genc
y R
esou
rcin
g—20
15-2
016
Est
imat
ed A
ctua
l—20
14-2
015
D
epar
tmen
tal
Adm
inis
tere
d
App
ropr
iatio
n B
ill N
o. 2
E
ntity
/Out
com
e/
Non
-ope
ratin
g A
ppro
pria
tion
Bill
No.
1A
ppro
pria
tion
Bill
No.
2R
ecei
pts
(a)
Spe
cial
App
ropr
iatio
nS
peci
al
Acc
ount
s (b
)A
ppro
pria
tion
Bill
No.
1S
PP
sO
ther
(c)
Spe
cial
App
ropr
iatio
nTo
tal
$'
000
$'00
0$'
000
$'00
0$'
000
$'00
0$'
000
$'00
0$'
000
$'00
0N
atio
nal O
ffsho
re
Petr
oleu
m S
afet
y an
d En
viro
nmen
tal
Man
agem
ent
Aut
horit
y O
utco
me
1 -
-38
,019
--
--
--
38,0
1915
0-
37,4
59-
--
--
-37
,609
Tota
l -
-38
,019
--
--
--
38,0
1915
0-
37,4
59-
--
--
-37
,609
G
eosc
ienc
e A
ustr
alia
O
utco
me
1 12
5,81
4-
39,9
00-
-20
--
-16
5,73
412
9,57
8-
59,7
99-
-20
--
-18
9,39
7
Equ
ity in
ject
ions
-
10-
--
--
--
10-
10-
--
--
--
10
Tota
l 12
5,81
410
39,9
00-
-20
--
-16
5,74
412
9,57
810
59,7
99-
-20
--
-18
9,40
7
IP A
ustr
alia
O
utco
me
1 2,
192
--
-20
2,02
3-
--
-20
4,21
52,
302
--
-19
7,42
2-
--
-19
9,72
4
Tota
l 2,
192
--
-20
2,02
3-
--
-20
4,21
52,
302
--
-19
7,42
2-
--
-19
9,72
4 P
OR
TFO
LIO
T
OTA
L 1,
502,
966
68,4
3881
8,79
3-
241,
524
823,
293
-30
,938
265,
553
3,75
1,50
51,
575,
695
108,
963
793,
142
-23
9,19
01,
581,
979
--
613,
357
4,91
2,32
6(a
) R
ecei
pts
that
wer
e no
t app
ropr
iate
d to
the
entit
y by
an
annu
al A
ppro
pria
tion
Act o
r ano
ther
Act
. (b
) Am
ount
s cr
edite
d to
a s
peci
al a
ccou
nt th
at w
ere
not a
ppro
pria
ted
to th
e en
tity
by a
n an
nual
App
ropr
iatio
n Ac
t or a
noth
er A
ct.
(c)
Incl
udes
New
Adm
inis
tere
d O
utco
mes
and
adm
inis
tere
d as
sets
and
liab
ilitie
s ite
m, w
ithin
the
mea
ning
of A
ppro
pria
tion
Bill
No.
2.

70
Agency resourcing table
INFR
AST
RU
CTU
RE
AN
D R
EGIO
NA
L D
EVEL
OPM
ENT
Age
ncy
Res
ourc
ing—
2015
-201
6 E
stim
ated
Act
ual—
2014
-201
5
Dep
artm
enta
l A
dmin
iste
red
A
ppro
pria
tion
Bill
No.
2
Ent
ity/O
utco
me/
N
on-o
pera
ting
App
ropr
iatio
nB
ill N
o. 1
App
ropr
iatio
nB
ill N
o. 2
Rec
eipt
s (a
)S
peci
alA
ppro
pria
tion
Spe
cial
A
ccou
nts
(b)
App
ropr
iatio
nB
ill N
o. 1
SP
Ps
Oth
er (c
)S
peci
alA
ppro
pria
tion
Tota
l
$'00
0$'
000
$'00
0$'
000
$'00
0$'
000
$'00
0$'
000
$'00
0$'
000
Dep
artm
ent o
f In
fras
truc
ture
and
R
egio
nal
Dev
elop
men
t O
utco
me
1 30
,778
-38
1-
54,4
6015
0,87
569
9,63
0-
-93
6,12
446
,156
-56
1-
184,
680
80,4
5345
6,06
5-
15,0
3778
2,95
2
Out
com
e 2
169,
892
-9,
675
--
247,
669
--
312,
027
739,
263
177,
937
-15
,839
--
190,
871
--
299,
539
684,
186
O
utco
me
3 31
,074
-35
5-
-53
7,09
82,
400
-2,
288,
701
2,85
9,62
834
,986
-56
9-
-25
8,11
94,
350
-2,
301,
476
2,59
9,50
0
Out
com
e 4
14,8
07-
265
-24
,249
128,
404
--
-16
7,72
510
,339
-31
6-
1,48
217
4,51
7-
-1,
083
187,
737
A
dmin
iste
red
Ass
ets
and
Liab
ilitie
s -
--
--
--
2,25
0,00
0-
2,25
0,00
0-
--
--
--
36,4
00-
36,4
00
Tota
l 24
6,55
1-
10,6
76-
78,7
091,
064,
046
702,
030
2,25
0,00
02,
600,
728
6,95
2,74
026
9,41
8-
17,2
85-
186,
162
703,
960
460,
415
36,4
002,
617,
135
4,29
0,77
5
Aus
tral
ian
Mar
itim
e Sa
fety
Aut
horit
y O
utco
me
1 57
,509
-14
3,31
9-
--
--
-20
0,82
865
,284
-13
6,46
1-
--
--
-20
1,74
5
Tota
l 57
,509
-14
3,31
9-
--
--
-20
0,82
865
,284
-13
6,46
1-
--
--
-20
1,74
5

Agency resourcing table
71
INFR
AST
RU
CTU
RE
AN
D R
EGIO
NA
L D
EVEL
OPM
ENT
Age
ncy
Res
ourc
ing—
2015
-201
6 E
stim
ated
Act
ual—
2014
-201
5
Dep
artm
enta
l A
dmin
iste
red
A
ppro
pria
tion
Bill
No.
2
Ent
ity/O
utco
me/
N
on-o
pera
ting
App
ropr
iatio
nB
ill N
o. 1
App
ropr
iatio
nB
ill N
o. 2
Rec
eipt
s (a
)S
peci
alA
ppro
pria
tion
Spe
cial
A
ccou
nts
(b)
App
ropr
iatio
nB
ill N
o. 1
SP
Ps
Oth
er (c
)S
peci
alA
ppro
pria
tion
Tota
l
$'00
0$'
000
$'00
0$'
000
$'00
0$'
000
$'00
0$'
000
$'00
0$'
000
Civ
il A
viat
ion
Safe
ty
Aut
horit
y O
utco
me
1 42
,461
-13
7,67
3-
--
--
-18
0,13
442
,480
-13
3,13
0-
--
--
-17
5,61
0
Tota
l 42
,461
-13
7,67
3-
--
--
-18
0,13
442
,480
-13
3,13
0-
--
--
-17
5,61
0
Infr
astr
uctu
re
Aus
tral
ia
Out
com
e 1
11,7
68-
--
--
--
-11
,768
--
15,0
37-
--
--
-15
,037
To
tal
11,7
68-
--
--
--
-11
,768
--
15,0
37-
--
--
-15
,037
N
atio
nal T
rans
port
C
omm
issi
on
Out
com
e 1
3,30
1-
6,16
6-
--
--
-9,
467
3,24
2-
6,05
3-
--
--
-9,
295
To
tal
3,30
1-
6,16
6-
--
--
-9,
467
3,24
2-
6,05
3-
--
--
-9,
295

72
Agency resourcing table
INFR
AST
RU
CTU
RE
AN
D R
EGIO
NA
L D
EVEL
OPM
ENT
Age
ncy
Res
ourc
ing—
2015
-201
6 E
stim
ated
Act
ual—
2014
-201
5
Dep
artm
enta
l A
dmin
iste
red
A
ppro
pria
tion
Bill
No.
2
Ent
ity/O
utco
me/
N
on-o
pera
ting
App
ropr
iatio
nB
ill N
o. 1
App
ropr
iatio
nB
ill N
o. 2
Rec
eipt
s (a
)S
peci
alA
ppro
pria
tion
Spe
cial
A
ccou
nts
(b)
App
ropr
iatio
nB
ill N
o. 1
SP
Ps
Oth
er (c
)S
peci
alA
ppro
pria
tion
Tota
l
$'00
0$'
000
$'00
0$'
000
$'00
0$'
000
$'00
0$'
000
$'00
0$'
000
Aus
tral
ian
Tran
spor
t Sa
fety
Bur
eau
Out
com
e 1
68,5
79-
1,30
4-
--
--
-69
,883
69,2
42-
16,0
07-
--
--
-85
,249
E
quity
inje
ctio
ns
-37
1-
--
--
--
371
-55
5-
--
--
--
555
To
tal
68,5
7937
11,
304
--
--
--
70,2
5469
,242
555
16,0
07-
--
--
-85
,804
N
atio
nal C
apita
l A
utho
rity
Out
com
e 1
18,2
04-
1,95
5-
-16
,688
--
2536
,872
18,2
21-
1,94
0-
-17
,018
--
2537
,204
A
dmin
iste
red
Ass
ets
and
Liab
ilitie
s -
--
--
--
--
--
--
--
--
3,06
7-
3,06
7
Tota
l 18
,204
-1,
955
--
16,6
88-
-25
36,8
7218
,221
-1,
940
--
17,0
18-
3,06
725
40,2
71
PO
RTF
OLI
O
TO
TAL
448,
373
371
301,
093
-78
,709
1,08
0,73
470
2,03
02,
250,
000
2,60
0,75
37,
462,
063
467,
887
555
325,
913
-18
6,16
272
0,97
846
0,41
539
,467
2,61
7,16
04,
818,
537
(a)
Rec
eipt
s th
at w
ere
not a
ppro
pria
ted
to th
e en
tity
by a
n an
nual
App
ropr
iatio
n A
ct o
r ano
ther
Act
. (b
) A
mou
nts
cred
ited
to a
spe
cial
acc
ount
that
wer
e no
t app
ropr
iate
d to
the
entit
y by
an
annu
al A
ppro
pria
tion
Act
or a
noth
er A
ct.
(c)
Incl
udes
New
Adm
inis
tere
d O
utco
mes
and
adm
inis
tere
d as
sets
and
liab
ilitie
s ite
m, w
ithin
the
mea
ning
of A
ppro
pria
tion
Bill
No.
2.

Agency resourcing table
73
PRIM
E M
INIS
TER
AN
D C
AB
INET
A
genc
y R
esou
rcin
g—20
15-2
016
Est
imat
ed A
ctua
l—20
14-2
015
D
epar
tmen
tal
Adm
inis
tere
d
App
ropr
iatio
n B
ill N
o. 2
E
ntity
/Out
com
e/
Non
-ope
ratin
g A
ppro
pria
tion
Bill
No.
1A
ppro
pria
tion
Bill
No.
2R
ecei
pts
(a)
Spe
cial
App
ropr
iatio
nS
peci
al
Acc
ount
s (b
)A
ppro
pria
tion
Bill
No.
1S
PP
sO
ther
(c)
Spe
cial
App
ropr
iatio
nTo
tal
$'
000
$'00
0$'
000
$'00
0$'
000
$'00
0$'
000
$'00
0$'
000
$'00
0D
epar
tmen
t of t
he
Prim
e M
inis
ter a
nd
Cab
inet
O
utco
me
1 11
5,87
7-
4,16
6-
-15
,119
--
1013
5,17
225
0,98
2-
4,83
4-
-14
,954
--
1027
0,78
0
Out
com
e 2
270,
329
-1,
798
-3,
787,
808
1,18
7,86
78,
647
-16
8,55
45,
425,
003
296,
774
-3,
365
-3,
685,
477
1,16
6,60
88,
517
-21
0,47
95,
371,
220
E
quity
inje
ctio
ns
-3,
096
--
--
--
-3,
096
-6,
205
--
--
--
-6,
205
To
tal
386,
206
3,09
65,
964
-3,
787,
808
1,20
2,98
68,
647
-16
8,56
45,
563,
271
547,
756
6,20
58,
199
-3,
685,
477
1,18
1,56
28,
517
-21
0,48
95,
648,
205
A
borig
inal
Hos
tels
Li
mite
d O
utco
me
1 37
,582
-18
,820
--
--
--
56,4
0238
,044
-23
,620
--
--
--
61,6
64
Equ
ity in
ject
ions
-
--
--
--
--
--
1,24
4-
--
--
--
1,24
4
Tota
l 37
,582
-18
,820
--
--
--
56,4
0238
,044
1,24
423
,620
--
--
--
62,9
08

74
Agency resourcing table
PRIM
E M
INIS
TER
AN
D C
AB
INET
A
genc
y R
esou
rcin
g—20
15-2
016
Est
imat
ed A
ctua
l—20
14-2
015
D
epar
tmen
tal
Adm
inis
tere
d
App
ropr
iatio
n B
ill N
o. 2
E
ntity
/Out
com
e/
Non
-ope
ratin
g A
ppro
pria
tion
Bill
No.
1A
ppro
pria
tion
Bill
No.
2R
ecei
pts
(a)
Spe
cial
App
ropr
iatio
nS
peci
al
Acc
ount
s (b
)A
ppro
pria
tion
Bill
No.
1S
PP
sO
ther
(c)
Spe
cial
App
ropr
iatio
nTo
tal
$'
000
$'00
0$'
000
$'00
0$'
000
$'00
0$'
000
$'00
0$'
000
$'00
0In
dige
nous
Bus
ines
s A
ustr
alia
O
utco
me
1 34
,258
-17
3,64
0-
--
--
-20
7,89
834
,328
-15
4,50
6-
--
--
-18
8,83
4
Equ
ity in
ject
ions
-
36,5
50-
--
--
--
36,5
50-
36,8
80-
--
--
--
36,8
80
Tota
l 34
,258
36,5
5017
3,64
0-
--
--
-24
4,44
834
,328
36,8
8015
4,50
6-
--
--
-22
5,71
4
Indi
geno
us L
and
Cor
pora
tion
Out
com
e 1
9,38
9-
55,4
12-
--
--
-64
,801
9,52
7-
54,5
65-
--
--
-64
,092
To
tal
9,38
9-
55,4
12-
--
--
-64
,801
9,52
7-
54,5
65-
--
--
-64
,092
N
atio
nal A
ustr
alia
D
ay C
ounc
il Li
mite
d O
utco
me
1 -
-6,
817
--
--
--
6,81
7-
-6,
810
--
--
--
6,81
0
Tota
l -
-6,
817
--
--
--
6,81
7-
-6,
810
--
--
--
6,81
0

Agency resourcing table
75
PRIM
E M
INIS
TER
AN
D C
AB
INET
A
genc
y R
esou
rcin
g—20
15-2
016
Est
imat
ed A
ctua
l—20
14-2
015
D
epar
tmen
tal
Adm
inis
tere
d
App
ropr
iatio
n B
ill N
o. 2
E
ntity
/Out
com
e/
Non
-ope
ratin
g A
ppro
pria
tion
Bill
No.
1A
ppro
pria
tion
Bill
No.
2R
ecei
pts
(a)
Spe
cial
App
ropr
iatio
nS
peci
al
Acc
ount
s (b
)A
ppro
pria
tion
Bill
No.
1S
PP
sO
ther
(c)
Spe
cial
App
ropr
iatio
nTo
tal
$'
000
$'00
0$'
000
$'00
0$'
000
$'00
0$'
000
$'00
0$'
000
$'00
0To
rres
Str
ait
Reg
iona
l Aut
horit
y O
utco
me
1 39
,498
-11
,432
--
--
--
50,9
3048
,159
-9,
885
--
--
--
58,0
44
Tota
l 39
,498
-11
,432
--
--
--
50,9
3048
,159
-9,
885
--
--
--
58,0
44
Aus
tral
ian
Nat
iona
l A
udit
Offi
ce
Out
com
e 1
73,0
87-
3,50
064
4-
--
--
77,2
3173
,799
-3,
500
626
--
--
3277
,957
To
tal
73,0
87-
3,50
064
4-
--
--
77,2
3173
,799
-3,
500
626
--
--
3277
,957
A
ustr
alia
n Pu
blic
Se
rvic
e C
omm
issi
on
Out
com
e 1
21,0
64-
20,2
44-
--
--
63,1
4110
4,44
922
,059
-22
,319
--
--
-61
,963
106,
341
To
tal
21,0
64-
20,2
44-
--
--
63,1
4110
4,44
922
,059
-22
,319
--
--
-61
,963
106,
341
O
ffice
of N
atio
nal
Ass
essm
ents
O
utco
me
1 34
,208
--
--
--
--
34,2
0833
,554
--
--
--
--
33,5
54
Tota
l 34
,208
--
--
--
--
34,2
0833
,554
--
--
--
--
33,5
54
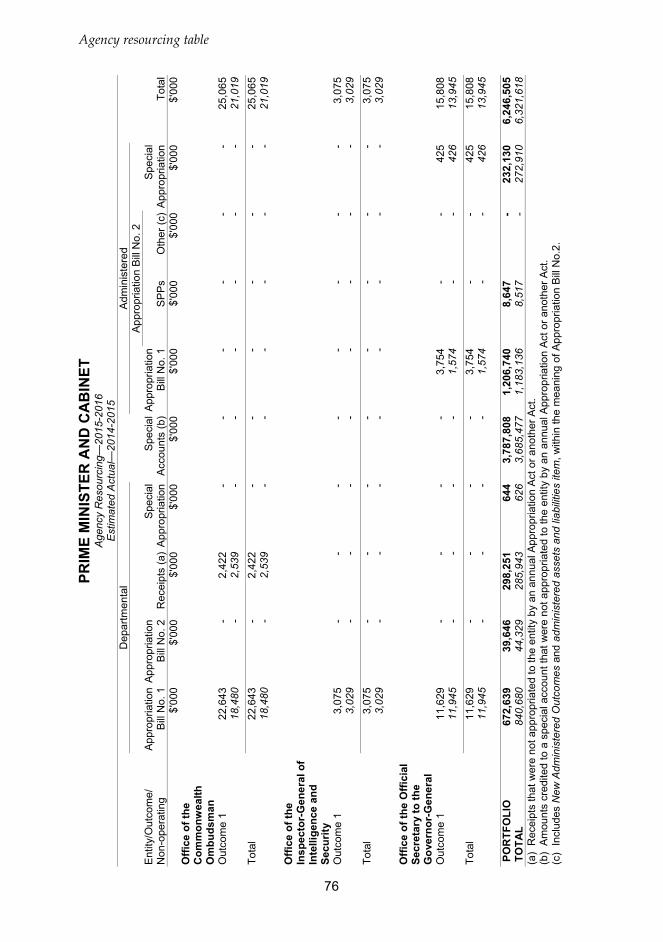
76
Agency resourcing table
PRIM
E M
INIS
TER
AN
D C
AB
INET
A
genc
y R
esou
rcin
g—20
15-2
016
Est
imat
ed A
ctua
l—20
14-2
015
D
epar
tmen
tal
Adm
inis
tere
d
App
ropr
iatio
n B
ill N
o. 2
E
ntity
/Out
com
e/
Non
-ope
ratin
g A
ppro
pria
tion
Bill
No.
1A
ppro
pria
tion
Bill
No.
2R
ecei
pts
(a)
Spe
cial
App
ropr
iatio
nS
peci
al
Acc
ount
s (b
)A
ppro
pria
tion
Bill
No.
1S
PP
sO
ther
(c)
Spe
cial
App
ropr
iatio
nTo
tal
$'
000
$'00
0$'
000
$'00
0$'
000
$'00
0$'
000
$'00
0$'
000
$'00
0O
ffice
of t
he
Com
mon
wea
lth
Om
buds
man
O
utco
me
1 22
,643
-2,
422
--
--
--
25,0
6518
,480
-2,
539
--
--
--
21,0
19
Tota
l 22
,643
-2,
422
--
--
--
25,0
6518
,480
-2,
539
--
--
--
21,0
19
Offi
ce o
f the
In
spec
tor-
Gen
eral
of
Inte
llige
nce
and
Secu
rity
Out
com
e 1
3,07
5-
--
--
--
-3,
075
3,02
9-
--
--
--
-3,
029
Tota
l 3,
075
--
--
--
--
3,07
53,
029
--
--
--
--
3,02
9
Offi
ce o
f the
Offi
cial
Se
cret
ary
to th
e G
over
nor-
Gen
eral
O
utco
me
1 11
,629
--
--
3,75
4-
-42
515
,808
11,9
45-
--
-1,
574
--
426
13,9
45
Tota
l 11
,629
--
--
3,75
4-
-42
515
,808
11,9
45-
--
-1,
574
--
426
13,9
45 P
OR
TFO
LIO
T
OTA
L 67
2,63
939
,646
298,
251
644
3,78
7,80
81,
206,
740
8,64
7-
232,
130
6,24
6,50
584
0,68
044
,329
285,
943
626
3,68
5,47
71,
183,
136
8,51
7-
272,
910
6,32
1,61
8(a
) R
ecei
pts
that
wer
e no
t app
ropr
iate
d to
the
entit
y by
an
annu
al A
ppro
pria
tion
Act
or a
noth
er A
ct.
(b)
Am
ount
s cr
edite
d to
a s
peci
al a
ccou
nt th
at w
ere
not a
ppro
pria
ted
to th
e en
tity
by a
n an
nual
App
ropr
iatio
n A
ct o
r ano
ther
Act
. (c
) In
clud
es N
ew A
dmin
iste
red
Out
com
es a
nd a
dmin
iste
red
asse
ts a
nd li
abili
ties
item
, with
in th
e m
eani
ng o
f App
ropr
iatio
n B
ill N
o.2.

Agency resourcing table
77
SOC
IAL
SER
VIC
ES
Age
ncy
Res
ourc
ing—
2015
-201
6 E
stim
ated
Act
ual—
2014
-201
5
Dep
artm
enta
l A
dmin
iste
red
A
ppro
pria
tion
Bill
No.
2
Ent
ity/O
utco
me/
N
on-o
pera
ting
App
ropr
iatio
nB
ill N
o. 1
App
ropr
iatio
nB
ill N
o. 2
Rec
eipt
s (a
)S
peci
alA
ppro
pria
tion
Spe
cial
A
ccou
nts
(b)
App
ropr
iatio
nB
ill N
o. 1
SP
Ps
Oth
er (c
)S
peci
alA
ppro
pria
tion
Tota
l
$'00
0$'
000
$'00
0$'
000
$'00
0$'
000
$'00
0$'
000
$'00
0$'
000
Dep
artm
ent o
f Soc
ial
Serv
ices
O
utco
me
1 12
8,40
1-
23,9
02-
-13
,564
--
110,
630,
143
110,
796,
010
180,
055
-23
,994
--
13,6
70-
-10
8,22
0,95
610
8,43
8,67
5
Out
com
e 2
212,
773
--
-1,
201
1,01
1,50
7-
-9,
228,
192
10,4
53,6
7315
5,40
3-
--
1,29
982
2,04
9-
-5,
132,
851
6,11
1,60
2
Out
com
e 3
193,
664
--
--
2,19
3,46
9-
-11
,648
,838
14,0
35,9
7111
9,29
5-
--
230
2,22
7,35
9-
-11
,001
,265
13,3
48,1
49
Out
com
e 4
11,6
57-
--
-73
,571
--
-85
,228
3,01
9-
--
-70
,558
--
-73
,577
O
utco
me
5 10
6,06
3-
--
-1,
806,
943
--
-1,
913,
006
172,
058
--
--
1,58
0,53
9-
--
1,75
2,59
7
Equ
ity in
ject
ions
-
66,3
57-
--
--
--
66,3
57-
6,37
3-
--
--
--
6,37
3
Tota
l 65
2,55
866
,357
23,9
02-
1,20
15,
099,
054
--
131,
507,
173
137,
350,
245
629,
830
6,37
323
,994
-1,
529
4,71
4,17
5-
-12
4,35
5,07
212
9,73
0,97
3

78
Agency resourcing table
SOC
IAL
SER
VIC
ES
Age
ncy
Res
ourc
ing—
2015
-201
6 E
stim
ated
Act
ual—
2014
-201
5
Dep
artm
enta
l A
dmin
iste
red
A
ppro
pria
tion
Bill
No.
2
Ent
ity/O
utco
me/
N
on-o
pera
ting
App
ropr
iatio
nB
ill N
o. 1
App
ropr
iatio
nB
ill N
o. 2
Rec
eipt
s (a
)S
peci
alA
ppro
pria
tion
Spe
cial
A
ccou
nts
(b)
App
ropr
iatio
nB
ill N
o. 1
SP
Ps
Oth
er (c
)S
peci
alA
ppro
pria
tion
Tota
l
$'00
0$'
000
$'00
0$'
000
$'00
0$'
000
$'00
0$'
000
$'00
0$'
000
Nat
iona
l Dis
abili
ty
Insu
ranc
e A
genc
y^
Out
com
e 1
208,
102
-30
4,57
5-
-26
5,73
3-
--
778,
410
162,
661
-17
6,48
9-
-16
7,10
1-
--
506,
251
E
quity
inje
ctio
ns
-57
,756
--
--
--
-57
,756
-23
,349
--
--
--
-23
,349
To
tal
208,
102
57,7
5630
4,57
5-
-26
5,73
3-
--
836,
166
162,
661
23,3
4917
6,48
9-
-16
7,10
1-
--
529,
600
A
ustr
alia
n A
ged
Car
e Q
ualit
y A
genc
y O
utco
me
1 28
,941
-13
,641
--
--
--
42,5
8225
,705
-19
,589
--
--
--
45,2
94
Tota
l 28
,941
-13
,641
--
--
--
42,5
8225
,705
-19
,589
--
--
--
45,2
94
Aus
tral
ian
Inst
itute
of
Fam
ily S
tudi
es
Out
com
e 1
4,75
0-
9,28
9-
--
--
-14
,039
4,81
6-
9,64
2-
--
--
-14
,458
To
tal
4,75
0-
9,28
9-
--
--
-14
,039
4,81
6-
9,64
2-
--
--
-14
,458

Agency resourcing table
79
SOC
IAL
SER
VIC
ES
Age
ncy
Res
ourc
ing—
2015
-201
6 E
stim
ated
Act
ual—
2014
-201
5
Dep
artm
enta
l A
dmin
iste
red
A
ppro
pria
tion
Bill
No.
2
Ent
ity/O
utco
me/
N
on-o
pera
ting
App
ropr
iatio
nB
ill N
o. 1
App
ropr
iatio
nB
ill N
o. 2
Rec
eipt
s (a
)S
peci
alA
ppro
pria
tion
Spe
cial
A
ccou
nts
(b)
App
ropr
iatio
nB
ill N
o. 1
SP
Ps
Oth
er (c
)S
peci
alA
ppro
pria
tion
Tota
l
$'00
0$'
000
$'00
0$'
000
$'00
0$'
000
$'00
0$'
000
$'00
0$'
000
Dep
artm
ent o
f H
uman
Ser
vice
s O
utco
me
1 4,
416,
647
-14
1,41
9-
1,68
1,96
82,
252
--
59,6
776,
301,
963
4,27
9,27
0-
195,
322
-1,
652,
923
8,38
6-
-57
,223
6,19
3,12
4
Equ
ity in
ject
ions
-
37,5
48-
--
--
--
37,5
48-
20,4
42-
--
--
--
20,4
42
Tota
l 4,
416,
647
37,5
4814
1,41
9-
1,68
1,96
82,
252
--
59,6
776,
339,
511
4,27
9,27
020
,442
195,
322
-1,
652,
923
8,38
6-
-57
,223
6,21
3,56
6
PO
RTF
OLI
O
TO
TAL
5,31
0,99
816
1,66
149
2,82
6-
1,68
3,16
95,
367,
039
--
131,
566,
850
144,
582,
543
5,10
2,28
250
,164
425,
036
-1,
654,
452
4,88
9,66
2-
-12
4,41
2,29
513
6,53
3,89
1(a
) R
ecei
pts
that
wer
e no
t app
ropr
iate
d to
the
entit
y by
an
annu
al A
ppro
pria
tion
Act
or a
noth
er A
ct.
(b)
Am
ount
s cr
edite
d to
a s
peci
al a
ccou
nt th
at w
ere
not a
ppro
pria
ted
to th
e en
tity
by a
n an
nual
App
ropr
iatio
n A
ct o
r ano
ther
Act
. (c
) In
clud
es N
ew A
dmin
iste
red
Out
com
es a
nd a
dmin
iste
red
asse
ts a
nd li
abili
ties
item
, with
in th
e m
eani
ng o
f App
ropr
iatio
n B
ill N
o.2.
^
The
Nat
iona
l Dis
abili
ty In
sura
nce
Age
ncy
(ND
IA) i
s a
Com
mon
wea
lth c
orpo
rate
ent
ity a
nd a
s su
ch is
not
requ
ired
to re
port
reso
urce
s se
para
tely
as
adm
inis
tere
d or
de
partm
enta
l. H
owev
er, t
he re
sour
ces
that
will
be
appl
ied
by th
e N
DIA
to th
e pr
ovis
ion
of re
ason
able
and
nec
essa
ry c
are
and
supp
ort t
o cl
ient
s (a
dmin
iste
red
in
natu
re)
will
be
sign
ifica
nt o
ver
the
forw
ard
estim
ates
com
pare
d to
oth
er C
omm
onw
ealth
cor
pora
te e
ntiti
es.
Add
ition
ally
, thi
s re
sour
cing
is jo
intly
pro
vide
d by
the
Com
mon
wea
lth a
nd p
artic
ipat
ing
stat
es a
nd t
errit
orie
s. T
o pr
ovid
e a
bette
r vi
ew o
f th
e ap
plic
atio
n of
the
se N
DIA
res
ourc
es,
the
Age
ncy
Res
ourc
ing
Tabl
e se
para
tes
them
bet
wee
n th
ose
that
are
dep
artm
enta
l or a
dmin
iste
red
in n
atur
e.

80
Agency resourcing table
TREA
SUR
Y A
genc
y R
esou
rcin
g—20
15-2
016
Est
imat
ed A
ctua
l—20
14-2
015
D
epar
tmen
tal
Adm
inis
tere
d
App
ropr
iatio
n B
ill N
o. 2
E
ntity
/Out
com
e/
Non
-ope
ratin
g A
ppro
pria
tion
Bill
No.
1A
ppro
pria
tion
Bill
No.
2R
ecei
pts
(a)
Spe
cial
App
ropr
iatio
nS
peci
al
Acc
ount
s (b
)A
ppro
pria
tion
Bill
No.
1S
PP
sO
ther
(c)
Spe
cial
App
ropr
iatio
nTo
tal
$'
000
$'00
0$'
000
$'00
0$'
000
$'00
0$'
000
$'00
0$'
000
$'00
0D
epar
tmen
t of t
he
Trea
sury
O
utco
me
1 16
4,65
3-
8,71
8-
13,0
33,4
9236
,724
--
77,0
36,8
2390
,280
,410
178,
140
-8,
488
-12
,267
,561
50,3
68-
-73
,255
,849
85,7
60,4
06
Equ
ity in
ject
ions
-
1,70
0-
--
--
--
1,70
0-
--
--
--
--
-
Spe
cial
Cap
ital
App
ropr
iatio
n -
--
--
--
-2,
020,
092
2,02
0,09
2-
--
--
--
-14
9,64
614
9,64
6
Tota
l 16
4,65
31,
700
8,71
8-
13,0
33,4
9236
,724
--
79,0
56,9
1592
,302
,202
178,
140
-8,
488
-12
,267
,561
50,3
68-
-73
,405
,495
85,9
10,0
52
Cle
an E
nerg
y Fi
nanc
e C
orpo
ratio
n O
utco
me
1 -
-44
,925
--
--
--
44,9
25-
-47
,186
--
--
--
47,1
86
Tota
l -
-44
,925
--
--
--
44,9
25-
-47
,186
--
--
--
47,1
86
Cor
pora
tions
and
M
arke
ts A
dvis
ory
Com
mitt
ee
Out
com
e 1
--
--
--
--
--
1,15
6-
--
--
--
-1,
156
To
tal
--
--
--
--
--
1,15
6-
--
--
--
-1,
156
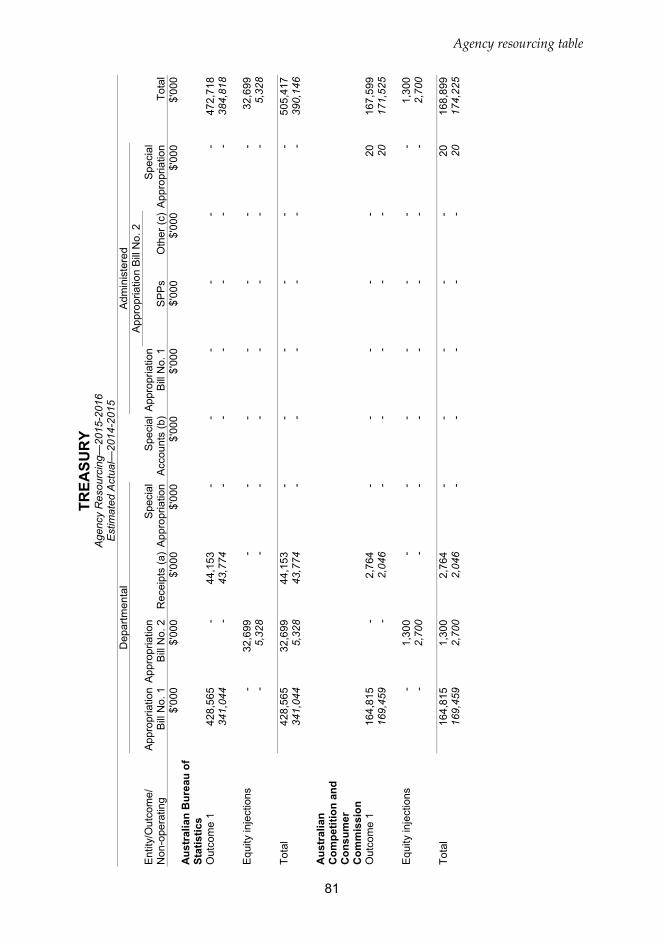
Agency resourcing table
81
TREA
SUR
Y A
genc
y R
esou
rcin
g—20
15-2
016
Est
imat
ed A
ctua
l—20
14-2
015
D
epar
tmen
tal
Adm
inis
tere
d
App
ropr
iatio
n B
ill N
o. 2
E
ntity
/Out
com
e/
Non
-ope
ratin
g A
ppro
pria
tion
Bill
No.
1A
ppro
pria
tion
Bill
No.
2R
ecei
pts
(a)
Spe
cial
App
ropr
iatio
nS
peci
al
Acc
ount
s (b
)A
ppro
pria
tion
Bill
No.
1S
PP
sO
ther
(c)
Spe
cial
App
ropr
iatio
nTo
tal
$'
000
$'00
0$'
000
$'00
0$'
000
$'00
0$'
000
$'00
0$'
000
$'00
0A
ustr
alia
n B
urea
u of
St
atis
tics
Out
com
e 1
428,
565
-44
,153
--
--
--
472,
718
341,
044
-43
,774
--
--
--
384,
818
E
quity
inje
ctio
ns
-32
,699
--
--
--
-32
,699
-5,
328
--
--
--
-5,
328
To
tal
428,
565
32,6
9944
,153
--
--
--
505,
417
341,
044
5,32
843
,774
--
--
--
390,
146
A
ustr
alia
n C
ompe
titio
n an
d C
onsu
mer
C
omm
issi
on
Out
com
e 1
164,
815
-2,
764
--
--
-20
167,
599
169,
459
-2,
046
--
--
-20
171,
525
E
quity
inje
ctio
ns
-1,
300
--
--
--
-1,
300
-2,
700
--
--
--
-2,
700
To
tal
164,
815
1,30
02,
764
--
--
-20
168,
899
169,
459
2,70
02,
046
--
--
-20
174,
225

82
Agency resourcing table
TREA
SUR
Y A
genc
y R
esou
rcin
g—20
15-2
016
Est
imat
ed A
ctua
l—20
14-2
015
D
epar
tmen
tal
Adm
inis
tere
d
App
ropr
iatio
n B
ill N
o. 2
E
ntity
/Out
com
e/
Non
-ope
ratin
g A
ppro
pria
tion
Bill
No.
1A
ppro
pria
tion
Bill
No.
2R
ecei
pts
(a)
Spe
cial
App
ropr
iatio
nS
peci
al
Acc
ount
s (b
)A
ppro
pria
tion
Bill
No.
1S
PP
sO
ther
(c)
Spe
cial
App
ropr
iatio
nTo
tal
$'
000
$'00
0$'
000
$'00
0$'
000
$'00
0$'
000
$'00
0$'
000
$'00
0A
ustr
alia
n O
ffice
of
Fina
ncia
l M
anag
emen
t O
utco
me
1 11
,907
-81
1-
-10
--
15,5
60,9
7515
,573
,703
12,1
30-
361
--
10-
-14
,472
,492
14,4
84,9
93
Spe
cial
Cap
ital
App
ropr
iatio
n -
--
--
--
-47
9,58
1,76
347
9,58
1,76
3-
--
--
--
-60
6,24
2,33
360
6,24
2,33
3
Tota
l 11
,907
-81
1-
-10
--
495,
142,
738
495,
155,
466
12,1
30-
361
--
10-
-62
0,71
4,82
562
0,72
7,32
6
Aus
tral
ian
Prud
entia
l R
egul
atio
n A
utho
rity
Out
com
e 1
1,23
7-
4,93
0-
118,
951
--
--
125,
118
953
-4,
140
-11
9,54
3-
--
-12
4,63
6
Equ
ity in
ject
ions
-
--
--
--
--
--
108
--
--
--
-10
8
Tota
l 1,
237
-4,
930
-11
8,95
1-
--
-12
5,11
895
310
84,
140
-11
9,54
3-
--
-12
4,74
4
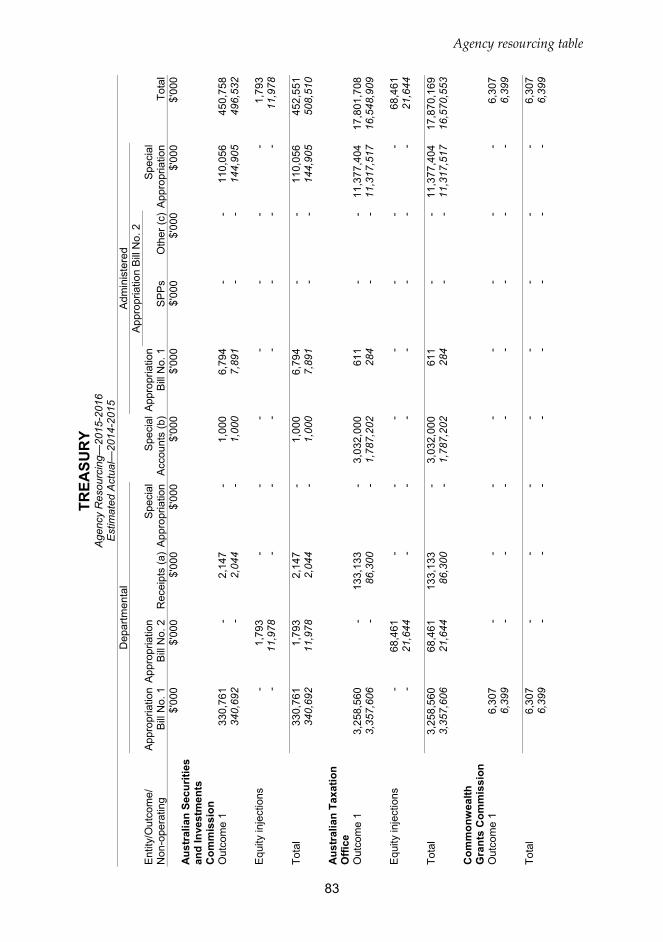
Agency resourcing table
83
TREA
SUR
Y A
genc
y R
esou
rcin
g—20
15-2
016
Est
imat
ed A
ctua
l—20
14-2
015
D
epar
tmen
tal
Adm
inis
tere
d
App
ropr
iatio
n B
ill N
o. 2
E
ntity
/Out
com
e/
Non
-ope
ratin
g A
ppro
pria
tion
Bill
No.
1A
ppro
pria
tion
Bill
No.
2R
ecei
pts
(a)
Spe
cial
App
ropr
iatio
nS
peci
al
Acc
ount
s (b
)A
ppro
pria
tion
Bill
No.
1S
PP
sO
ther
(c)
Spe
cial
App
ropr
iatio
nTo
tal
$'
000
$'00
0$'
000
$'00
0$'
000
$'00
0$'
000
$'00
0$'
000
$'00
0A
ustr
alia
n Se
curit
ies
and
Inve
stm
ents
C
omm
issi
on
Out
com
e 1
330,
761
-2,
147
-1,
000
6,79
4-
-11
0,05
645
0,75
834
0,69
2-
2,04
4-
1,00
07,
891
--
144,
905
496,
532
E
quity
inje
ctio
ns
-1,
793
--
--
--
-1,
793
-11
,978
--
--
--
-11
,978
To
tal
330,
761
1,79
32,
147
-1,
000
6,79
4-
-11
0,05
645
2,55
134
0,69
211
,978
2,04
4-
1,00
07,
891
--
144,
905
508,
510
A
ustr
alia
n Ta
xatio
n O
ffice
O
utco
me
1 3,
258,
560
-13
3,13
3-
3,03
2,00
061
1-
-11
,377
,404
17,8
01,7
083,
357,
606
-86
,300
-1,
787,
202
284
--
11,3
17,5
1716
,548
,909
E
quity
inje
ctio
ns
-68
,461
--
--
--
-68
,461
-21
,644
--
--
--
-21
,644
To
tal
3,25
8,56
068
,461
133,
133
-3,
032,
000
611
--
11,3
77,4
0417
,870
,169
3,35
7,60
621
,644
86,3
00-
1,78
7,20
228
4-
-11
,317
,517
16,5
70,5
53
Com
mon
wea
lth
Gra
nts
Com
mis
sion
O
utco
me
1 6,
307
--
--
--
--
6,30
76,
399
--
--
--
--
6,39
9
Tota
l 6,
307
--
--
--
--
6,30
76,
399
--
--
--
--
6,39
9

84
Agency resourcing table
TREA
SUR
Y A
genc
y R
esou
rcin
g—20
15-2
016
Est
imat
ed A
ctua
l—20
14-2
015
D
epar
tmen
tal
Adm
inis
tere
d
App
ropr
iatio
n B
ill N
o. 2
E
ntity
/Out
com
e/
Non
-ope
ratin
g A
ppro
pria
tion
Bill
No.
1A
ppro
pria
tion
Bill
No.
2R
ecei
pts
(a)
Spe
cial
App
ropr
iatio
nS
peci
al
Acc
ount
s (b
)A
ppro
pria
tion
Bill
No.
1S
PP
sO
ther
(c)
Spe
cial
App
ropr
iatio
nTo
tal
$'
000
$'00
0$'
000
$'00
0$'
000
$'00
0$'
000
$'00
0$'
000
$'00
0In
spec
tor G
ener
al o
f Ta
xatio
n O
utco
me
1 6,
532
--
--
--
--
6,53
22,
818
--
--
--
--
2,81
8
Equ
ity in
ject
ions
-
198
--
--
--
-19
8-
--
--
--
--
-
Tota
l 6,
532
198
--
--
--
-6,
730
2,81
8-
--
--
--
-2,
818
N
atio
nal C
ompe
titio
n C
ounc
il O
utco
me
1 1,
740
--
--
--
--
1,74
01,
913
--
--
--
--
1,91
3
Tota
l 1,
740
--
--
--
--
1,74
01,
913
--
--
--
--
1,91
3
Offi
ce o
f the
Aud
iting
an
d A
ssur
ance
St
anda
rds
Boa
rd
Out
com
e 1
2,19
8-
36-
--
--
-2,
234
2,22
6-
35-
--
--
-2,
261
To
tal
2,19
8-
36-
--
--
-2,
234
2,22
6-
35-
--
--
-2,
261

Agency resourcing table
85
TREA
SUR
Y A
genc
y R
esou
rcin
g—20
15-2
016
Est
imat
ed A
ctua
l—20
14-2
015
D
epar
tmen
tal
Adm
inis
tere
d
App
ropr
iatio
n B
ill N
o. 2
E
ntity
/Out
com
e/
Non
-ope
ratin
g A
ppro
pria
tion
Bill
No.
1A
ppro
pria
tion
Bill
No.
2R
ecei
pts
(a)
Spe
cial
App
ropr
iatio
nS
peci
al
Acc
ount
s (b
)A
ppro
pria
tion
Bill
No.
1S
PP
sO
ther
(c)
Spe
cial
App
ropr
iatio
nTo
tal
$'
000
$'00
0$'
000
$'00
0$'
000
$'00
0$'
000
$'00
0$'
000
$'00
0O
ffice
of t
he
Aus
tral
ian
Acc
ount
ing
Stan
dard
s B
oard
O
utco
me
1 3,
730
-76
7-
--
--
-4,
497
3,78
1-
813
--
--
--
4,59
4
Tota
l 3,
730
-76
7-
--
--
-4,
497
3,78
1-
813
--
--
--
4,59
4
Prod
uctiv
ity
Com
mis
sion
O
utco
me
1 33
,744
-1,
036
--
--
--
34,7
8034
,118
-1,
036
--
--
--
35,1
54
Tota
l 33
,744
-1,
036
--
--
--
34,7
8034
,118
-1,
036
--
--
--
35,1
54
Roy
al A
ustr
alia
n M
int
Out
com
e 1
--
--
156,
525
--
--
156,
525
--
--
147,
126
--
--
147,
126
To
tal
--
--
156,
525
--
--
156,
525
--
--
147,
126
--
--
147,
126
P
OR
TFO
LIO
T
OTA
L 4,
414,
749
106,
151
243,
420
-16
,341
,968
44,1
39-
-58
5,68
7,13
360
6,83
7,56
04,
452,
435
41,7
5819
6,22
3-
14,3
22,4
3258
,553
--
705,
582,
762
724,
654,
163
(a)
Rec
eipt
s th
at w
ere
not a
ppro
pria
ted
to th
e en
tity
by a
n an
nual
App
ropr
iatio
n A
ct o
r ano
ther
Act
. (b
) A
mou
nts
cred
ited
to a
spe
cial
acc
ount
that
wer
e no
t app
ropr
iate
d to
the
entit
y by
an
annu
al A
ppro
pria
tion
Act
or a
noth
er A
ct.
(c)
Incl
udes
New
Adm
inis
tere
d O
utco
mes
and
adm
inis
tere
d as
sets
and
liab
ilitie
s ite
m, w
ithin
the
mea
ning
of A
ppro
pria
tion
Bill
No.
2.

Special appropriations table
86
SPECIAL APPROPRIATIONS TABLE
Overview of the Special appropriations table The Special appropriations table lists Acts that contain one or more special appropriation(s). An Act is listed under an agency consistent with the most recent Administrative Arrangements Order.
Special appropriations are those appropriations contained in Acts other than the annual Appropriation Acts. Special appropriations account for around three quarters of GGS expenditure each year. An example of expenditure that is met using a special appropriation is aged pensions paid under the Social Security (Administration) Act 1999.
Expenditure authorised by special appropriations is triggered by legislative eligibility criteria and conditions. A small number of Acts stipulate a maximum amount appropriated for the particular purpose. Some Acts additionally specify a time period for the special appropriation. Such special appropriations are referred to as being limited appropriations (in amount and/or time).
The Summary of Special appropriations table presents portfolio resourcing that is supported by special appropriations. The detailed Special appropriations table presents resourcing for each agency that is supported by special appropriations.
The detailed Special appropriations table shows, on an Act basis, the total resources from all special appropriations contained in each Act. The amount for each Act is totaled because Acts that contain special appropriations do not authorise expenditure on an Outcomes basis. Noting this, only the aggregated total in the Special appropriations table, for all Acts for an agency, can be matched with the total of special appropriation amounts shown in the Agency resourcing table. For an example of this matching, see Figure 3 of the section entitled Guide to Budget Paper No. 4.

Special appropriations table
87
Summary of special appropriations table Estimated Actual Budget Estimate
Portfolio 2014-2015 2015-2016 ($’000) ($’000)
Parliament - 548 Agriculture 832,094 834,993 Attorney-General’s 55,861 22,302 Communications 5,100 5,100 Defence 17,669,511 16,607,389 Education and Training 35,689,926 35,174,181 Employment 512,123 443,867 Environment 343,992 49,795 Finance 12,140,241 8,380,369 Foreign Affairs and Trade 1,010 1,010 Health 37,481,610 39,583,143 Immigration and Border Protection 420,000 420,000 Industry and Science 613,357 265,553 Infrastructure and Regional Development 2,617,160 2,600,753 Prime Minister and Cabinet 273,536 232,774 Social Services 124,412,295 131,566,850 Treasury 99,190,783 104,085,278
Total: Special appropriations 332,258,599 340,273,905

Special appropriations table
88
Special appropriations table Estimated Actual Budget Estimate 2014-2015 2015-2016 ($’000) ($’000)
PARLIAMENT
Parliamentary Budget Office Parliamentary Service Act 1999 - 548
Total: Parliamentary Budget Office - 548
AGRICULTURE PORTFOLIO
Department of Agriculture Agricultural and Veterinary Chemicals (Administration) Act 1992 12,746 31,721 Australian Animal Health Council (Livestock Industry) Funding Act
1996 7,142 6,361 Australian Grape and Wine Authority Act 2013 30,088 30,843 Australian Meat and Live-stock Industry Act 1997 183,739 161,248 Dairy Produce Act 1986 54,313 56,246 Egg Industry Service Provision Act 2002 8,579 8,870 Farm Household Support Act 2014 70,017 117,430 Forestry Marketing and Research and Development Services Act
2007 8,643 8,816 Horticulture Marketing and Research and Development Services Act
2000 86,598 86,396 Pig Industry Act 2001 18,880 19,425 Plant Health Australia (Plant Industries) Funding Act 2002 2,583 5,483 Primary Industries and Energy Research and Development Act 1989 - - Primary Industries Research and Development Act 1989 242,659 216,931 Public Governance, Performance and Accountability (Consequential
and Transitional Provisions) Act 2014 18,528 - Public Governance, Performance and Accountability Act 2013 3,000 3,000 Sugar Research and Development Services Act 2013 29,235 27,723 Wool Services Privatisation Act 2000 55,344 54,500
Total: Department of Agriculture 832,094 834,993
ATTORNEY-GENERAL’S PORTFOLIO
Attorney-General’s Department Classification (Publications, Films and Computer Games) Act 1995 - - Commonwealth Places (Application of Laws) Act 1970 - - Crimes (Superannuation Benefits) Act 1989 - - Family Law Act 1975 - - Federal Circuit Court of Australia Act 1999 - - Federal Court of Australia Act 1976 - - Financial Management and Accountability Act 1997 5 - High Court Justices (Long Leave Payments) Act 1979 - - High Court of Australia Act 1979 - - Judges (Long Leave Payments) Act 1979 - - Law Officers Act 1964 450 450 National Firearms Program Implementation Act 1996 - -

Special appropriations table
89
Estimated Actual Budget Estimate 2014-2015 2015-2016 ($’000) ($’000)
National Firearms Program Implementation Act 1997 - - National Firearms Program Implementation Act 1998 - - National Handgun Buyback Act 2003 - - Native Title Act 1993 - - Public Governance, Performance and Accountability Act 2013 122 127 Social Security (Administration) Act 1999 52,684 13,425
Total: Attorney-General’s Department 53,261 14,002
Administrative Appeals Tribunal Public Governance, Performance and Accountability Act 2013 700 6,400
Total: Administrative Appeals Tribunal 700 6,400
Australian Federal Police Australian Federal Police Act 1979 - - Public Governance, Performance and Accountability Act 2013 - -
Total: Australian Federal Police - -
Australian Financial Security Authority Bankruptcy Act 1966 500 500 Public Governance, Performance and Accountability Act 2013 500 500
Total: Australian Financial Security Authority 1,000 1,000
Australian Transaction Reports and Analysis Centre Public Governance, Performance and Accountability Act 2013 - -
Total: Australian Transaction Reports and Analysis Centre - -
Family Court and Federal Circuit Court Public Governance, Performance and Accountability Act 2013 300 300
Total: Family Court and Federal Circuit Court 300 300
Federal Court of Australia Public Governance, Performance and Accountability Act 2013 600 600
Total: Federal Court of Australia 600 600
COMMUNICATIONS PORTFOLIO
Department of Communications Telecommunications (Consumer Protection and Service Standards)
Act 1999 - -
Total: Department of Communications - -
Australian Communications and Media Authority Public Governance, Performance and Accountability Act 2013 4,800 4,800 Telecommunications Act 1997 300 300
Total: Australian Communications and Media Authority 5,100 5,100

Special appropriations table
90
Estimated Actual Budget Estimate 2014-2015 2015-2016 ($’000) ($’000)
DEFENCE PORTFOLIO
Department of Defence Defence Force (Home Loans Assistance) Act 1990 1,357 1,116 Defence Force Retirement and Death Benefits Act 1973 1,794,000 1,872,626 Defence Forces Retirement Benefits Act 1948 23,000 25,542 Defence Home Ownership Assistance Scheme Act 2008 103,175 118,661 Military Superannuation and Benefits Act 1991 4,080,883 3,212,447 War Gratuity Act 1945 - -
Total: Department of Defence 6,002,415 5,230,392
Department of Veterans’ Affairs Australian Participants in British Nuclear Tests (Treatment) Act 2006 421 420 Compensation (Japanese Internment) Act 2001 - - Defence Service Homes Act 1918 1,451 1,219 Military Rehabilitation and Compensation Act 2004 295,440 309,494 Papua New Guinea (Members of the Forces Benefits) Act 1957 70 70 Safety, Rehabilitation and Compensation Act 1988 177,904 171,728 Veterans’ Entitlements Act 1986 11,191,810 10,894,066
Total: Department of Veterans’ Affairs 11,667,096 11,376,997 EDUCATION AND TRAINING PORTFOLIO
Department of Education and Training Australian Education Act 2013 14,621,373 15,700,346 Higher Education Support Act 2003 16,770,769 18,152,359 Public Governance, Performance and Accountability Act 2013 - - Schools Assistance Act 2008 - - Trade Support Loan Act 2014 60,974 531,617 A New Tax System (Family Assistance) Act 1999 3,360,968, -
Total: Department of Education and Training 34,814,084 34,384,322
Australian Research Council Australian Research Council Act 2001 875,642 789,659
Total: Australian Research Council 875,642 789,659
Australian Skills Quality Authority Public Governance, Performance and Accountability Act 2013 - -
Total: Australian Skills Quality Authority - -
Tertiary Education Quality and Standards Agency Public Governance, Performance and Accountability Act 2013 200 200
Total: Tertiary Education Quality and Standards Agency 200 200

Special appropriations table
91
Estimated Actual Budget Estimate 2014-2015 2015-2016 ($’000) ($’000) EMPLOYMENT PORTFOLIO
Department of Employment Asbestos-related Claims (Management of Commonwealth Liabilities)
Act 2005 22,887 33,211 Coal Mining Industry (Long Service Leave Funding) Act 1992 174,618 174,618 Fair Entitlements Guarantee Act 2012 263,505 198,768 Public Governance, Performance and Accountability Act 2013 44 30 Safety, Rehabilitation and Compensation Act 1988 50,069 36,515
Total: Department of Employment 511,123 443,142
Fair Work Commission Judges’ Pensions Act 1968 - - Public Governance, Performance and Accountability Act 2013 500 500
Total: Fair Work Commission 500 500
Office of the Fair Work Ombudsman Fair Work Act 2009 500 225
Total: Office of the Fair Work Ombudsman 500 225 ENVIRONMENT PORTFOLIO
Department of the Environment Ozone Protection and Synthetic Greenhouse Gas Management Act
1989 2,000 1,000 Public Governance, Performance and Accountability (Consequential
and Transitional Provisions) Act 2014 4,305 - Public Governance, Performance and Accountability Act 2013 255 - Water Act 2007 15,000 40,000
Total: Department of the Environment 21,560 41,000
Clean Energy Regulator Clean Energy Act 2011 308,128 - Public Governance, Performance and Accountability Act 2013 9,045 100 Renewable Energy (Electricity) Act 2000 259 295
Total: Clean Energy Regulator 317,432 395
Great Barrier Reef Marine Park Authority Great Barrier Reef Marine Park Act 1975 5,000 8,400
Total: Great Barrier Reef Marine Park Authority 5,000 8,400

Special appropriations table
92
Estimated Actual Budget Estimate 2014-2015 2015-2016 ($’000) ($’000) FINANCE PORTFOLIO
Department of Finance Commonwealth of Australia Constitution Act 4,825 4,825 Federal Circuit Court of Australia Act 1999 729 741 Governance of Australian Government Superannuation Schemes
Act 2011 1,400 1,400 Governor-General Act 1974 893 1,244 Judges’ Pensions Act 1968 84,100 82,100 Lands Acquisition Act 1989 - - Medibank Private Sale Act 2006 3,327,182 - Members of Parliament (Life Gold Pass) Act 2002 1,065 1,120 Parliamentary Contributory Superannuation Act 1948 51,629 54,417 Parliamentary Entitlements Act 1990 166,610 175,064 Parliamentary Retiring Allowances Act 1964-1966 - - Parliamentary Superannuation Act 2004 5,769 5,887 Public Accounts and Audit Committee Act 1951 - - Public Governance, Performance and Accountability Act 2013 - 2,300 Public Works Committee Act 1969 - - Remuneration Tribunal Act 1973 - - Same-Sex Relationships (Equal Treatment in Commonwealth Laws -
Superannuation) Act 2008 50 57 Superannuation (Pension Increases) Act 1961 - - Superannuation Act 1922 32,106 37,341 Superannuation Act 1976 3,060,701 3,510,317 Superannuation Act 1990 5,394,180 4,494,556 Superannuation Act 2005 - - Transferred Officers’ Allowances Act 1948 - -
Total: Department of Finance 12,131,239 8,371,369
Australian Electoral Commission Commonwealth Electoral Act 1918 9,000 9,000 Public Governance, Performance and Accountability Act 2013 2 -
Total: Australian Electoral Commission 9,002 9,000 FOREIGN AFFAIRS AND TRADE PORTFOLIO
Department of Foreign Affairs and Trade Export Finance and Insurance Corporation Act 1991 - - International Organisations (Privileges and Immunities) Act 1963 - - Public Governance, Performance and Accountability Act 2013 1,010 1,010
Total: Department of Foreign Affairs and Trade 1,010 1,010

Special appropriations table
93
Estimated Actual Budget Estimate 2014-2015 2015-2016 ($’000) ($’000) HEALTH PORTFOLIO
Department of Health Dental Benefits Act 2008 424,607 605,451 Gene Technology Act 2000 - - Health and Other Services (Compensation) Act 1995 - - Health Insurance Act 1973 20,311,899 21,126,958 Medical Indemnity Act 2002 79,748 82,495 Midwife Professional Indemnity (Commonwealth Contribution)
Scheme Act 2010 821 1,508 National Blood Authority Act 2003 - - National Health Act 1953 10,292,116 11,080,177 Private Health Insurance Act 2007 6,371,919 6,686,054 Public Governance, Performance and Accountability Act 2013 500 500
Total: Department of Health 37,481,610 39,583,143
Australian Institute of Health and Welfare Australian Institute of Health and Welfare Act 1987 - -
Total: Australian Institute of Health and Welfare - -
Food Standards Australia New Zealand Food Standards Australia New Zealand Act 1991 - -
Total: Food Standards Australia New Zealand - -
Australian Radiation Protection and Nuclear Safety Agency Australian Radiation Protection and Nuclear Safety Act 1998 - -
Total: Australian Radiation Protection and Nuclear Safety Agency - -
National Blood Authority National Blood Authority Act 2003 - -
Total: National Blood Authority - -
Private Health Insurance Ombudsman Aged Care Act 1997 - - National Health Act 1953 - -
Total: Private Health Insurance Ombudsman - -
Professional Services Review Health Insurance Act 1973 - -
Total: Professional Services Review - -

Special appropriations table
94
Estimated Actual Budget Estimate 2014-2015 2015-2016 ($’000) ($’000) IMMIGRATION AND BORDER PROTECTION PORTFOLIO
Department of Immigration and Border Protection Public Governance, Performance and Accountability Act 2013 - 420,000
Total: Department of Immigration and Border Protection - 420,000
Australian Customs and Border Protection Service Customs Act 1901 - - Financial Management and Accountability Act 1997 79,846 - Public Governance, Performance and Accountability Act 2013 340,154 -
Total: Australian Customs and Border Protection Service 420,000 -
Migration Review Tribunal and Refugee Review Tribunal Public Governance, Performance and Accountability Act 2013 - -
Total: Migration Review Tribunal and Refugee Review Tribunal - - INDUSTRY AND SCIENCE PORTFOLIO
Department of Industry and Science Australian Renewable Energy Agency Act 2011 267,271 - Automotive Transformation Scheme Act 2009 259,854 227,624 Offshore Minerals Act 1994 10 60 Offshore Petroleum and Greenhouse Gas Storage Act 2006 37,869 37,869 Public Governance, Performance and Accountability (Consequential
and Transitional Provisions) Act 2014 - - Public Governance, Performance and Accountability Act 2013 - - Skilling Australia’s Workforce Act 2005 - - Textile, Clothing and Footwear Strategic Investment Program
Act 1999 26,304 - Trade Support Loan Act 2014 22,049 -
Total: Department of Industry and Science 613,357 265,553
Commonwealth Scientific and Industrial Research Organisation Science and Industry Endowment Act 1926 - -
Total: Commonwealth Scientific and Industrial Research Organisation - -
INFRASTRUCTURE AND REGIONAL DEVELOPMENT PORTFOLIO
Department of Infrastructure and Regional Development ACT Self-Government (Consequential Provisions) Act 1988 - - Australian Maritime Safety Authority Act 1990 112,265 121,944 Australian National Railways Commission Sale Act 1997 - - Aviation Fuel Revenues (Special Appropriation) Act 1988 115,048 117,931 Infrastructure Australia Amendment Act 2014 15,037 - Interstate Road Transport Act 1985 71,002 71,002

Special appropriations table
95
Estimated Actual Budget Estimate 2014-2015 2015-2016 ($’000) ($’000)
Local Government (Financial Assistance) Act 1995 2,301,476 2,288,701 Protection of the Sea (Oil Pollution Compensation Fund) Act 1993 1,000 1,000 Public Governance, Performance and Accountability Act 2013 1,307 150 Roads to Recovery Act 2000 - - Sydney Airport Demand Management Act 1997 - -
Total: Department of Infrastructure and Regional Development 2,617,135 2,600,728
Civil Aviation Safety Authority Aviation Fuel Revenues (Special Appropriation) Act 1988 - -
Total: Civil Aviation Safety Authority - -
National Capital Authority Public Governance, Performance and Accountability Act 2013 25 25
Total: National Capital Authority 25 25 PRIME MINISTER AND CABINET PORTFOLIO
Department of the Prime Minister and Cabinet Aboriginal Land Rights (Northern Territory) Act 1976 157,955 113,979 Governor-General Act 1974 - - Higher Education Support Act 2003 52,524 54,575 Indigenous Education (Targeted Assistance) Act 2000 - - Parliamentary Commission of Inquiry (Repeal) Act 1986 - - Public Governance, Performance and Accountability Act 2013 10 10
Total: Department of the Prime Minister and Cabinet 210,489 168,564
Australian National Audit Office Auditor-General Act 1997 626 644 Public Governance, Performance and Accountability Act 2013 32 -
Total: Australian National Audit Office 658 644
Australian Public Service Commission Judicial and Statutory Officers (Remuneration and Allowances) Act
1984 - - Remuneration and Allowances Act 1990 - - Remuneration Tribunal Act 1973 61,963 63,141
Total: Australian Public Service Commission 61,963 63,141
Office of the Official Secretary to the Governor-General Governor-General Act 1974 425 425 Public Governance, Performance and Accountability Act 2013 1 -
Total: Office of the Official Secretary to the Governor-General 426 425

Special appropriations table
96
Estimated Actual Budget Estimate 2014-2015 2015-2016 ($’000) ($’000) SOCIAL SERVICES PORTFOLIO
Department of Social Services A New Tax System (Family Assistance) (Administration) Act 1999 24,513,461 27,290,906 Aged Care Act 1997 10,917,740 11,549,325 Early Years Quality Fund Special Account Act 2013 135,000 - National Health Act 1953 83,525 99,513 Paid Parental Leave Act 2010 1,980,127 2,066,333 Public Governance, Performance and Accountability Act 2013 - - Social and Community Services Pay Equity Special Account
Act 2012 - - Social Security (Administration) Act 1999 86,405,673 90,160,170 Student Assistance Act 1973 319,546 340,926
Total: Department of Social Services 124,355,072 131,507,173
Department of Human Services Child Support (Registration and Collection) Act 1988 57,223 59,677 Public Governance, Performance and Accountability Act 2013 - -
Total: Department of Human Services 57,223 59,677 TREASURY PORTFOLIO
Department of the Treasury Asian Development Bank Act 1966 - - Clean Energy Act 2011 - - Clean Energy Finance Corporation Act 2012 - - Commonwealth Places (Mirror Taxes) Act 1998 - - European Bank for Reconstruction and Development Act 1990 - - Federal Financial Relations Act 2009 73,248,732 77,033,023 Financial Agreements (Commonwealth Liability) Act 1932 - - Financial Services Reform Act 2001 - - Guarantee Scheme for Large Deposits and Wholesale Funding
Appropriation Act 2008 - - International Bank for Reconstruction and Development (General
Capital Increase) Act 1989 - - International Bank for Reconstruction and Development (Share
Increase) Act 1988 - - International Finance Corporation Act 1955 - - International Financial Institutions (Share Increase) Act 1982 - - International Financial Institutions (Share Increase) Act 1986 - - International Monetary Agreements Act 1947 3,243 2,800 Multilateral Investment Guarantee Agency Act 1997 - - Papua and New Guinea Loan (International Bank) Act 1970 - - Papua New Guinea Loans Guarantee Act 1975 - - Payment of Tax Receipts (Victoria) Act 1996 - - Public Governance, Performance and Accountability Act 2013 3,874 1,000 States (Works And Housing) Assistance Act 1984 - -
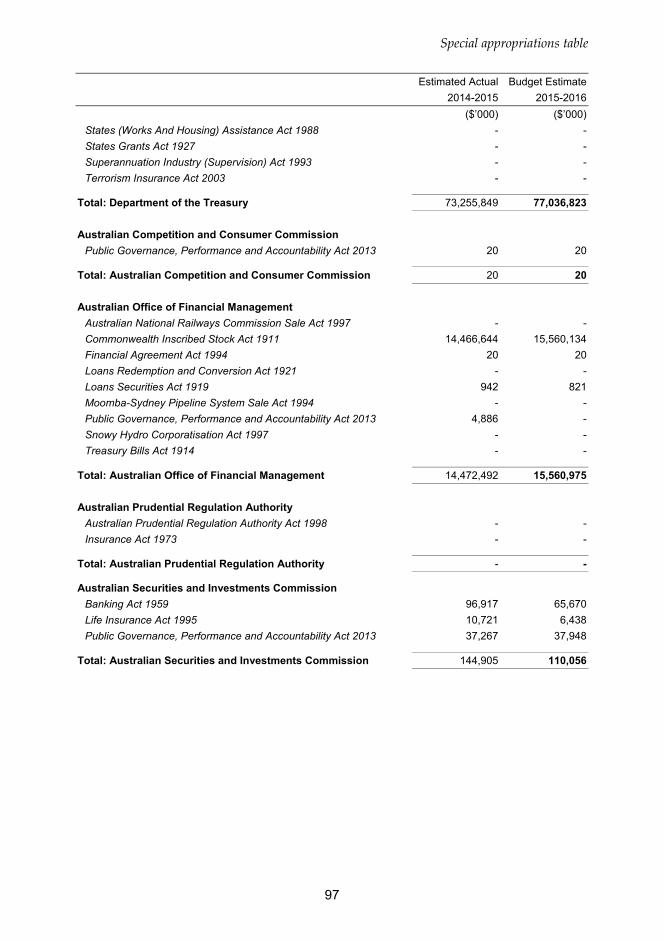
Special appropriations table
97
Estimated Actual Budget Estimate 2014-2015 2015-2016 ($’000) ($’000)
States (Works And Housing) Assistance Act 1988 - - States Grants Act 1927 - - Superannuation Industry (Supervision) Act 1993 - - Terrorism Insurance Act 2003 - -
Total: Department of the Treasury 73,255,849 77,036,823
Australian Competition and Consumer Commission Public Governance, Performance and Accountability Act 2013 20 20
Total: Australian Competition and Consumer Commission 20 20
Australian Office of Financial Management Australian National Railways Commission Sale Act 1997 - - Commonwealth Inscribed Stock Act 1911 14,466,644 15,560,134 Financial Agreement Act 1994 20 20 Loans Redemption and Conversion Act 1921 - - Loans Securities Act 1919 942 821 Moomba-Sydney Pipeline System Sale Act 1994 - - Public Governance, Performance and Accountability Act 2013 4,886 - Snowy Hydro Corporatisation Act 1997 - - Treasury Bills Act 1914 - -
Total: Australian Office of Financial Management 14,472,492 15,560,975
Australian Prudential Regulation Authority Australian Prudential Regulation Authority Act 1998 - - Insurance Act 1973 - -
Total: Australian Prudential Regulation Authority - -
Australian Securities and Investments Commission Banking Act 1959 96,917 65,670 Life Insurance Act 1995 10,721 6,438 Public Governance, Performance and Accountability Act 2013 37,267 37,948
Total: Australian Securities and Investments Commission 144,905 110,056

Special appropriations table
98
Estimated Actual Budget Estimate 2014-2015 2015-2016 ($’000) ($’000) Australian Taxation Office
A New Tax System (Family Assistance) (Administration) Act 1999 - - Commonwealth Places Windfall Tax (Collection) Act 1998 - - Income Tax Assessment Act 1936 - - Product Grants and Benefits Administration Act 2000 234,750 62,000 Public Governance, Performance and Accountability Act 2013 102,000 100,000 Small Superannuation Accounts Act 1995 - - Superannuation (Unclaimed Money and Lost Members) Act 1999 - - Superannuation Guarantee (Administration) Act 1992 468,000 481,000 Taxation Administration Act 1953 10,512,767 10,734,404
Total: Australian Taxation Office 11,317,517 11,377,404 Total: Special appropriations 332,258,599 340,273,905

Special accounts table
99
SPECIAL ACCOUNTS TABLE
Overview of the Special accounts table A special account is an appropriation mechanism that sets aside an amount within the CRF for specific expenditure purposes. Special accounts can be used to appropriate for expenditure that is resourced with contributions from other parties such as other governments, contributions from industry or members of the community. Special accounts can also be credited with amounts from annual appropriations and special appropriations.
The Special accounts table lists special accounts by portfolios and managing agency. For each special account the table shows the estimated opening balance for the Budget year, estimated cash inflows and outflows (receipts and payments) during the year, and estimated closing balance at the end of the Budget year. Estimated resources for the previous year are printed in italics. Where responsibility for managing a special account is moved between agencies during the year, the part-year impact for each agency is shown.
The column headed Receipts (non-appropriated) shows estimated amounts to be credited to a special account, which are received from other government agencies, individuals, or non-government bodies. The column headed Receipts (appropriated) shows amounts estimated to be credited to a special account, which are received by the agency in an annual Appropriation Act or another Act containing a special appropriation.
Amounts for an agency in the Special accounts table column headed Receipts (non-appropriated) can be matched with the Agency resourcing table’s column headed Special accounts. Amounts in the Special accounts table column headed Receipts (appropriated) are included in the Agency resourcing table in the column headed Appropriation Bill No. 1, Appropriation Bill No. 2 or Special appropriations. Further detail on matching amounts between these two tables is in Figure 4 of the section entitled Guide to Budget Paper No. 4.

Special accounts table
100
B
udge
t Est
imat
e—20
15-2
016
Est
imat
ed A
ctua
l—20
14-2
015
O
peni
ng
Bal
ance
Rec
eipt
s (N
on-
App
ropr
iate
d)
Rec
eipt
s (A
ppro
pria
ted)
Pay
men
tsA
djus
tmen
tsC
losi
ng
Bal
ance
($
’000
)($
’000
) ($
’000
)($
’000
)($
’000
)($
’000
)
PAR
LIA
MEN
T
Dep
artm
ent o
f the
Hou
se o
f Rep
rese
ntat
ives
Inte
r-P
arlia
men
tary
Rel
atio
ns S
peci
al A
ccou
nt
2,50
4-
60-6
0-
2,50
42,
504
- 62
-62
-2,
504
Ser
vice
s fo
r Oth
er E
ntiti
es a
nd T
rust
Mon
eys
- Dep
artm
ent o
f the
H
ouse
of R
epre
sent
ativ
es S
peci
al A
ccou
nt*
--
--
--
--
--
--
To
tal:
Dep
artm
ent o
f the
Hou
se o
f Rep
rese
ntat
ives
2,
504
- 60
-60
-2,
504
2,50
4-
62-6
2-
2,50
4

Special accounts table
101
B
udge
t Est
imat
e—20
15-2
016
Est
imat
ed A
ctua
l—20
14-2
015
O
peni
ng
Bal
ance
Rec
eipt
s (N
on-
App
ropr
iate
d)
Rec
eipt
s (A
ppro
pria
ted)
Pay
men
tsA
djus
tmen
tsC
losi
ng
Bal
ance
($
’000
)($
’000
) ($
’000
)($
’000
)($
’000
)($
’000
)
AG
RIC
ULT
UR
E PO
RTF
OLI
O
D
epar
tmen
t of A
gric
ultu
re
Aus
tralia
n Q
uara
ntin
e an
d In
spec
tion
Ser
vice
Spe
cial
Acc
ount
41
,036
357,
799
128,
731
-486
,530
-41
,036
35,0
8635
4,17
3 12
8,73
1-4
76,9
54-
41,0
36
Nat
iona
l Cat
tle D
isea
se E
radi
catio
n A
ccou
nt
15-
--
-15
15-
--
-15
Nat
iona
l Res
idue
Sur
vey
Acc
ount
91
721
,610
61
-21,
767
-82
185
723
,515
61
-23,
516
-91
7
Nat
ural
Res
ourc
es M
anag
emen
t Acc
ount
-
- 5,
862
-5,8
62-
-8,
305
- 10
,390
-18,
695
--
Whe
at In
dust
ry S
peci
al A
ccou
nt
--
--
--
3,47
0-
--3
,470
--
To
tal:
Dep
artm
ent o
f Agr
icul
ture
41
,968
379,
409
134,
654
-514
,159
-41
,872
47,7
3337
7,68
8 13
9,18
2-5
22,6
35-
41,9
68
Aus
tral
ian
Pest
icid
es a
nd V
eter
inar
y M
edic
ines
Aut
horit
y
Aus
tralia
n P
estic
ides
and
Vet
erin
ary
Med
icin
es S
peci
al A
ccou
nt*
--
--
--
--
--
--
To
tal:
Aus
tral
ian
Pest
icid
es a
nd V
eter
inar
y M
edic
ines
Aut
horit
y-
- -
--
--
- -
--
-
Aus
tral
ian
Fish
erie
s M
anag
emen
t Aut
horit
y
AFM
A S
peci
al A
ccou
nt
15,2
5618
,831
21
,104
-39,
935
-15
,256
15,2
5617
,104
20
,725
-37,
829
-15
,256
Aus
tralia
n Fi
sher
ies
Man
agem
ent A
utho
rity
Ser
vice
s fo
r Oth
er
Ent
ities
and
Tru
st M
oney
s S
peci
al A
ccou
nt
135
- -
--
135
135
- -
--
135
Tota
l: A
ustr
alia
n Fi
sher
ies
Man
agem
ent A
utho
rity
15,3
9118
,831
21
,104
-39,
935
-15
,391
15,3
9117
,104
20
,725
-37,
829
-15
,391

Special accounts table
102
B
udge
t Est
imat
e—20
15-2
016
Est
imat
ed A
ctua
l—20
14-2
015
O
peni
ng
Bal
ance
Rec
eipt
s (N
on-
App
ropr
iate
d)
Rec
eipt
s (A
ppro
pria
ted)
Pay
men
tsA
djus
tmen
tsC
losi
ng
Bal
ance
($
’000
)($
’000
) ($
’000
)($
’000
)($
’000
)($
’000
)
ATT
OR
NEY
-GEN
ERA
L’S
POR
TFO
LIO
Atto
rney
-Gen
eral
’s D
epar
tmen
t
Art
Ren
tal S
peci
al A
ccou
nt
1,28
83,
200
--3
,300
-1,
188
1,18
83,
300
--3
,200
-1,
288
Cul
tura
l Spe
cial
Acc
ount
38
239
2 -
-558
-21
611
466
8 -
-400
-38
2
Indi
geno
us R
epat
riatio
n S
peci
al A
ccou
nt
2,51
0-
846
-1,8
46-
1,51
02,
722
- 1,
427
-1,6
39-
2,51
0
Nat
iona
l Col
lect
ions
Spe
cial
Acc
ount
-
- -
--
-48
- -
-48
--
Nat
iona
l Cul
tura
l Her
itage
Acc
ount
-
- 50
0-5
00-
--
- 50
0-5
00-
-
Ser
vice
s fo
r Oth
er E
ntiti
es a
nd T
rust
Mon
eys
- Atto
rney
Gen
eral
’s
Dep
artm
ent S
peci
al A
ccou
nt
7,62
937
,454
-
-41,
900
-3,
183
5,64
643
,442
-
-41,
459
-7,
629
Ser
vice
s fo
r Oth
er E
ntiti
es a
nd T
rust
Mon
eys
Spe
cial
Acc
ount
- A
ustra
lian
Hum
an R
ight
s C
omm
issi
on*
--
--
--
--
--
--
Tota
l: A
ttorn
ey-G
ener
al’s
Dep
artm
ent
11,8
0941
,046
1,
346
-48,
104
-6,
097
9,71
847
,410
1,
927
-47,
246
-11
,809
A
ustr
alia
n Fe
dera
l Pol
ice
Ser
vice
s fo
r Oth
er E
ntiti
es a
nd T
rust
Mon
eys
- Aus
tralia
n Fe
dera
l P
olic
e S
peci
al A
ccou
nt
83,8
0426
,273
1,
512
-27,
785
-83
,804
83,8
0426
,273
1,
522
-27,
795
-83
,804
Tota
l: A
ustr
alia
n Fe
dera
l Pol
ice
83,8
0426
,273
1,
512
-27,
785
-83
,804
83,8
0426
,273
1,
522
-27,
795
-83
,804
A
ustr
alia
n Fi
nanc
ial S
ecur
ity A
utho
rity
Com
mon
Inve
stm
ent F
und
Equ
alis
atio
n A
ccou
nt
199
396
--3
96-
199
199
396
--3
96-
199
Con
fisca
ted
Ass
ets
Acc
ount
63
,678
26,7
66
--4
2,72
1-
47,7
2388
,023
26,7
28
--5
1,07
3-
63,6
78

Special accounts table
103
B
udge
t Est
imat
e—20
15-2
016
Est
imat
ed A
ctua
l—20
14-2
015
O
peni
ng
Bal
ance
Rec
eipt
s (N
on-
App
ropr
iate
d)
Rec
eipt
s (A
ppro
pria
ted)
Pay
men
tsA
djus
tmen
tsC
losi
ng
Bal
ance
($
’000
)($
’000
) ($
’000
)($
’000
)($
’000
)($
’000
)
Con
fisca
ted
Ass
ets
Spe
cial
Acc
ount
25
- -
-11
-14
1110
1 -
-87
-25
Ser
vice
s fo
r Oth
er E
ntiti
es a
nd T
rust
Mon
eys
Spe
cial
Acc
ount
- In
solv
ency
and
Tru
stee
Ser
vice
Aus
tralia
-
- -
--
--
43
--4
3-
-
Tota
l: A
ustr
alia
n Fi
nanc
ial S
ecur
ity A
utho
rity
63,9
0227
,162
-
-43,
128
-47
,936
88,2
3327
,268
-
-51,
599
-63
,902
A
ustr
alia
n In
stitu
te o
f Crim
inol
ogy
Crim
inol
ogy
Res
earc
h S
peci
al A
ccou
nt
3,38
6-
3,11
4-3
,405
-3,
095
4,37
6-
3,02
3-4
,013
-3,
386
Tota
l: A
ustr
alia
n In
stitu
te o
f Crim
inol
ogy
3,38
6-
3,11
4-3
,405
-3,
095
4,37
6-
3,02
3-4
,013
-3,
386
A
ustr
alia
n La
w R
efor
m C
omm
issi
on
Law
Ref
orm
Spe
cial
Acc
ount
1,
324
- 2,
850
-2,8
50-
1,32
41,
324
- 2,
873
-2,8
73-
1,32
4
Tota
l: A
ustr
alia
n La
w R
efor
m C
omm
issi
on
1,32
4-
2,85
0-2
,850
-1,
324
1,32
4-
2,87
3-2
,873
-1,
324
C
rimTr
ac A
genc
y
Nat
iona
l Pol
icin
g In
form
atio
n S
yste
ms
and
Ser
vice
s S
peci
al
Acc
ount
11
1,73
079
,497
-
-80,
712
-11
0,51
511
6,39
180
,502
-
-85,
163
-11
1,73
0
Tota
l: C
rimTr
ac A
genc
y 11
1,73
079
,497
-
-80,
712
-11
0,51
511
6,39
180
,502
-
-85,
163
-11
1,73
0
Fam
ily C
ourt
and
Fed
eral
Circ
uit C
ourt
Litig
ants
’ Fun
d S
peci
al A
ccou
nt
548
- 60
0-6
00-
548
548
- 60
0-6
00-
548
Tota
l: Fa
mily
Cou
rt a
nd F
eder
al C
ircui
t Cou
rt
548
- 60
0-6
00-
548
548
- 60
0-6
00-
548

Special accounts table
104
B
udge
t Est
imat
e—20
15-2
016
Est
imat
ed A
ctua
l—20
14-2
015
O
peni
ng
Bal
ance
Rec
eipt
s (N
on-
App
ropr
iate
d)
Rec
eipt
s (A
ppro
pria
ted)
Pay
men
tsA
djus
tmen
tsC
losi
ng
Bal
ance
($
’000
)($
’000
) ($
’000
)($
’000
)($
’000
)($
’000
)
Fede
ral C
ourt
of A
ustr
alia
Fede
ral C
ourt
of A
ustra
lia L
itiga
nts’
Fun
d S
peci
al A
ccou
nt
2,30
35,
000
--5
,000
-2,
303
2,30
35,
000
--5
,000
-2,
303
Ser
vice
s fo
r Oth
er E
ntiti
es a
nd T
rust
Mon
eys
Spe
cial
Acc
ount
- Fe
dera
l Cou
rt of
Aus
tralia
-
250
--2
50-
--
250
--2
50-
-
Tota
l: Fe
dera
l Cou
rt o
f Aus
tral
ia
2,30
35,
250
--5
,250
-2,
303
2,30
35,
250
--5
,250
-2,
303

Special accounts table
105
B
udge
t Est
imat
e—20
15-2
016
Est
imat
ed A
ctua
l—20
14-2
015
O
peni
ng
Bal
ance
Rec
eipt
s (N
on-
App
ropr
iate
d)
Rec
eipt
s (A
ppro
pria
ted)
Pay
men
tsA
djus
tmen
tsC
losi
ng
Bal
ance
($
’000
)($
’000
) ($
’000
)($
’000
)($
’000
)($
’000
)
CO
MM
UN
ICA
TIO
NS
POR
TFO
LIO
Dep
artm
ent o
f Com
mun
icat
ions
Aus
tralia
New
Zea
land
Lan
d In
form
atio
n S
peci
al A
ccou
nt
103
- -
-43
-60
133
- -
-30
-10
3
BA
F C
omm
unic
atio
ns P
ortfo
lio S
peci
al A
ccou
nt
--
--
--
--
--
--
Pub
lic In
tere
st T
elec
omm
unic
atio
ns S
ervi
ces
Spe
cial
Acc
ount
32
,560
- 31
2,20
7-3
28,9
07-
15,8
60-
- -
--
-
Tota
l: D
epar
tmen
t of C
omm
unic
atio
ns
32,6
63-
312,
207
-328
,950
-15
,920
133
- -
-30
-10
3
Aus
tral
ian
Com
mun
icat
ions
and
Med
ia A
utho
rity
NR
S A
ccou
nt
--
--
--
--
--
--
Ser
vice
s fo
r Oth
er E
ntiti
es a
nd T
rust
Mon
eys
Spe
cial
Acc
ount
- A
ustra
lian
Com
mun
icat
ions
and
Med
ia A
utho
rity
-50
-
-50
--
-50
-
-50
--
Uni
vers
al S
ervi
ce A
ccou
nt
--
--
--
--
--
--
Tota
l: A
ustr
alia
n C
omm
unic
atio
ns a
nd M
edia
Aut
horit
y -
50
--5
0-
--
50
--5
0-
-
Tele
com
mun
icat
ions
Uni
vers
al S
ervi
ce M
anag
emen
t Age
ncy
Tele
com
mun
icat
ions
Uni
vers
al S
ervi
ce S
peci
al A
ccou
nt
--
--
--
32,5
60-
308,
200
-308
,200
-32
,560
Tota
l: Te
leco
mm
unic
atio
ns U
nive
rsal
Ser
vice
Man
agem
ent
Age
ncy
--
--
--
32,5
60-
308,
200
-308
,200
-32
,560
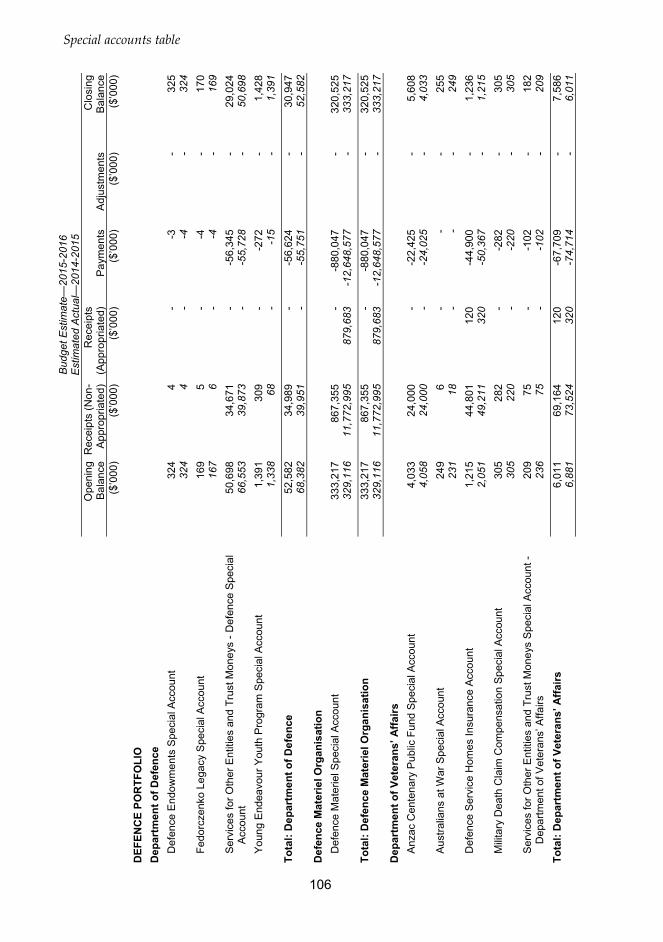
Special accounts table
106
B
udge
t Est
imat
e—20
15-2
016
Est
imat
ed A
ctua
l—20
14-2
015
O
peni
ng
Bal
ance
Rec
eipt
s (N
on-
App
ropr
iate
d)
Rec
eipt
s (A
ppro
pria
ted)
Pay
men
tsA
djus
tmen
tsC
losi
ng
Bal
ance
($
’000
)($
’000
) ($
’000
)($
’000
)($
’000
)($
’000
)
DEF
ENC
E PO
RTF
OLI
O
Dep
artm
ent o
f Def
ence
Def
ence
End
owm
ents
Spe
cial
Acc
ount
32
44
--3
-32
532
44
--4
-32
4
Fedo
rcze
nko
Lega
cy S
peci
al A
ccou
nt
169
5 -
-4-
170
167
6 -
-4-
169
Ser
vice
s fo
r Oth
er E
ntiti
es a
nd T
rust
Mon
eys
- Def
ence
Spe
cial
A
ccou
nt
50,6
9834
,671
-
-56,
345
-29
,024
66,5
5339
,873
-
-55,
728
-50
,698
Youn
g E
ndea
vour
You
th P
rogr
am S
peci
al A
ccou
nt
1,39
130
9 -
-272
-1,
428
1,33
868
-
-15
-1,
391
Tota
l: D
epar
tmen
t of D
efen
ce
52,5
8234
,989
-
-56,
624
-30
,947
68,3
8239
,951
-
-55,
751
-52
,582
Def
ence
Mat
erie
l Org
anis
atio
n
Def
ence
Mat
erie
l Spe
cial
Acc
ount
33
3,21
786
7,35
5 -
-880
,047
-32
0,52
532
9,11
611
,772
,995
87
9,68
3-1
2,64
8,57
7-
333,
217
Tota
l: D
efen
ce M
ater
iel O
rgan
isat
ion
333,
217
867,
355
--8
80,0
47-
320,
525
329,
116
11,7
72,9
95
879,
683
-12,
648,
577
-33
3,21
7
Dep
artm
ent o
f Vet
eran
s’ A
ffairs
Anz
ac C
ente
nary
Pub
lic F
und
Spe
cial
Acc
ount
4,
033
24,0
00
--2
2,42
5-
5,60
84,
058
24,0
00
--2
4,02
5-
4,03
3
Aus
tralia
ns a
t War
Spe
cial
Acc
ount
24
96
--
-25
523
118
-
--
249
Def
ence
Ser
vice
Hom
es In
sura
nce
Acc
ount
1,
215
44,8
01
120
-44,
900
-1,
236
2,05
149
,211
32
0-5
0,36
7-
1,21
5
Mili
tary
Dea
th C
laim
Com
pens
atio
n S
peci
al A
ccou
nt
305
282
--2
82-
305
305
220
--2
20-
305
Ser
vice
s fo
r Oth
er E
ntiti
es a
nd T
rust
Mon
eys
Spe
cial
Acc
ount
- D
epar
tmen
t of V
eter
ans’
Affa
irs
209
75
--1
02-
182
236
75
--1
02-
209
Tota
l: D
epar
tmen
t of V
eter
ans’
Affa
irs
6,01
169
,164
12
0-6
7,70
9-
7,58
66,
881
73,5
24
320
-74,
714
-6,
011

Special accounts table
107
B
udge
t Est
imat
e—20
15-2
016
Est
imat
ed A
ctua
l—20
14-2
015
O
peni
ng
Bal
ance
Rec
eipt
s (N
on-
App
ropr
iate
d)
Rec
eipt
s (A
ppro
pria
ted)
Pay
men
tsA
djus
tmen
tsC
losi
ng
Bal
ance
($
’000
)($
’000
) ($
’000
)($
’000
)($
’000
)($
’000
)
EDU
CA
TIO
N A
ND
TR
AIN
ING
PO
RTF
OLI
O
D
epar
tmen
t of E
duca
tion
and
Trai
ning
Dep
artm
ent o
f Edu
catio
n, E
mpl
oym
ent a
nd W
orkp
lace
Rel
atio
ns
Ser
vice
s fo
r Oth
er E
ntiti
es a
nd T
rust
Mon
eys
Spe
cial
Acc
ount
6,
935
- -
--
6,93
56,
589
- -
-78
424
6,93
5
EIF
Edu
catio
n P
ortfo
lio S
peci
al A
ccou
nt
-36
,627
-
-36,
627
--
-14
6,46
2 -
-146
,462
--
EIF
Res
earc
h P
ortfo
lio S
peci
al A
ccou
nt
--
--
--
-70
,950
-
-70,
950
--
Nat
iona
l You
th A
ffairs
Res
earc
h S
chem
e S
peci
al A
ccou
nt
251
240
--2
40-
251
251
240
--2
40-
251
Ove
rsea
s S
tude
nts
Tuiti
on F
und
17,1
976,
999
--1
,785
-22
,411
12,1
576,
782
--1
,742
-17
,197
Stu
dent
Iden
tifie
rs S
peci
al A
ccou
nt
2,18
62,
850
--2
,850
-2,
186
2,18
63,
625
--3
,625
-2,
186
Tota
l: D
epar
tmen
t of E
duca
tion
and
Trai
ning
26
,569
46,7
16
--4
1,50
2-
31,7
8321
,183
228,
059
--2
23,0
9742
426
,569
A
ustr
alia
n R
esea
rch
Cou
ncil
AR
C R
esea
rch
End
owm
ent A
ccou
nt
--
--
--
6,66
7-
--6
,667
--
Tota
l: A
ustr
alia
n R
esea
rch
Cou
ncil
--
--
--
6,66
7-
--6
,667
--

Special accounts table
108
B
udge
t Est
imat
e—20
15-2
016
Est
imat
ed A
ctua
l—20
14-2
015
O
peni
ng
Bal
ance
Rec
eipt
s (N
on-
App
ropr
iate
d)
Rec
eipt
s (A
ppro
pria
ted)
Pay
men
tsA
djus
tmen
tsC
losi
ng
Bal
ance
($
’000
)($
’000
) ($
’000
)($
’000
)($
’000
)($
’000
)
EMPL
OYM
ENT
POR
TFO
LIO
Safe
Wor
k A
ustr
alia
The
Saf
e W
ork
Aus
tralia
Spe
cial
Acc
ount
10
,999
11,0
36
9,70
6-2
0,44
2-
11,2
9910
,699
10,9
96
9,83
2-2
0,52
8-
10,9
99
Tota
l: Sa
fe W
ork
Aus
tral
ia
10,9
9911
,036
9,
706
-20,
442
-11
,299
10,6
9910
,996
9,
832
-20,
528
-10
,999
Se
afar
ers
Safe
ty, R
ehab
ilita
tion
and
Com
pens
atio
n A
utho
rity
Sea
fare
rs R
ehab
ilita
tion
and
Com
pens
atio
n A
ccou
nt
-13
2 -
-132
--
-13
2 -
-132
--
To
tal:
Seaf
arer
s Sa
fety
, Reh
abili
tatio
n an
d C
ompe
nsat
ion
Aut
horit
y -
132
--1
32-
--
132
--1
32-
-

Special accounts table
109
B
udge
t Est
imat
e—20
15-2
016
Est
imat
ed A
ctua
l—20
14-2
015
O
peni
ng
Bal
ance
Rec
eipt
s (N
on-
App
ropr
iate
d)
Rec
eipt
s (A
ppro
pria
ted)
Pay
men
tsA
djus
tmen
tsC
losi
ng
Bal
ance
($
’000
)($
’000
) ($
’000
)($
’000
)($
’000
)($
’000
)
ENVI
RO
NM
ENT
POR
TFO
LIO
Dep
artm
ent o
f the
Env
ironm
ent
A
ntar
ctic
Env
ironm
enta
l Lia
bilit
y S
peci
al A
ccou
nt
--
--
--
--
--
--
BA
F W
ater
Por
tfolio
Spe
cial
Acc
ount
-
- -
--
--
- -
--
-
Env
ironm
enta
l Wat
er H
oldi
ngs
Spe
cial
Acc
ount
54
,316
- 25
,940
-29,
925
-50
,331
53,0
83-
29,7
26-2
8,49
3-
54,3
16
Nat
iona
l Env
ironm
ent P
rote
ctio
n C
ounc
il S
peci
al A
ccou
nt
2,76
325
1 42
9-1
,743
-1,
700
-86
4,
734
-2,0
57-
2,76
3
Nat
ural
Her
itage
Tru
st o
f Aus
tralia
Acc
ount
41
3,06
125
,342
20
3,24
0-2
27,2
94-
414,
349
411,
773
11,5
82
239,
312
-249
,606
-41
3,06
1
Ozo
ne P
rote
ctio
n an
d S
GG
Acc
ount
19
,787
10,8
09
--1
2,80
4-
17,7
9221
,652
10,4
81
--1
2,34
6-
19,7
87
Ree
f Tru
st S
peci
al A
ccou
nt 2
014
--
15,7
79-1
5,77
9-
--
- 9,
658
-9,6
58-
-
Ser
vice
s fo
r Oth
er E
ntiti
es a
nd T
rust
Mon
eys
- Dep
artm
ent o
f the
E
nviro
nmen
t, W
ater
, Her
itage
and
the
Arts
Spe
cial
Acc
ount
82
851
0 -
-510
-82
882
851
0 -
-510
-82
8
Wat
er fo
r the
Env
ironm
ent S
peci
al A
ccou
nt
10,0
00-
40,0
00-4
0,00
0-
10,0
00-
- 15
,000
-5,0
00-
10,0
00
WE
LS A
ccou
nt
2,29
21,
745
215
-1,9
63-
2,28
92,
280
1,74
5 21
5-1
,948
-2,
292
Tota
l: D
epar
tmen
t of t
he E
nviro
nmen
t 50
3,04
738
,657
28
5,60
3-3
30,0
18-
497,
289
489,
616
24,4
04
298,
645
-309
,618
-50
3,04
7
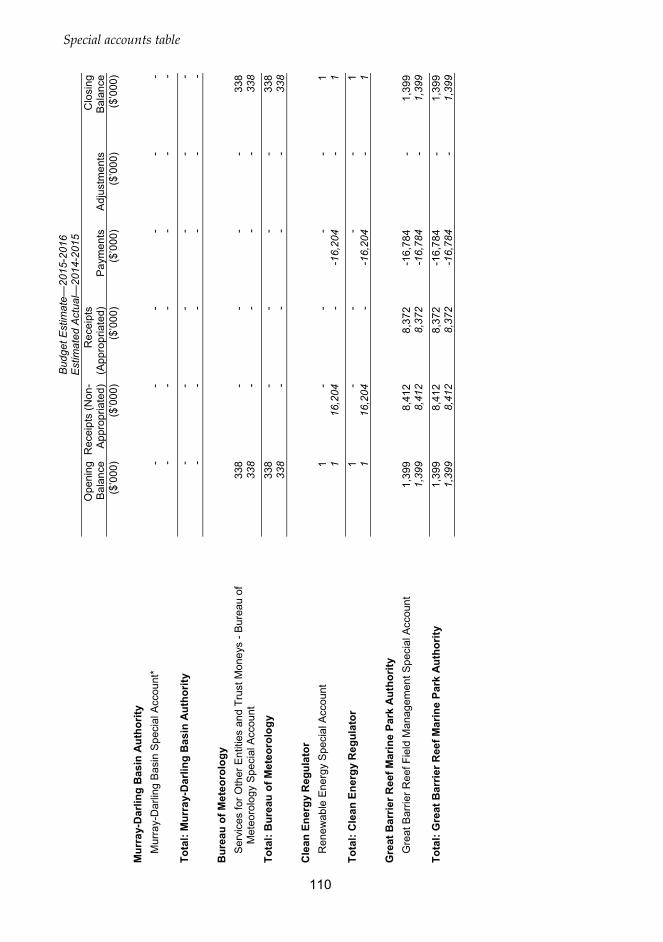
Special accounts table
110
B
udge
t Est
imat
e—20
15-2
016
Est
imat
ed A
ctua
l—20
14-2
015
O
peni
ng
Bal
ance
Rec
eipt
s (N
on-
App
ropr
iate
d)
Rec
eipt
s (A
ppro
pria
ted)
Pay
men
tsA
djus
tmen
tsC
losi
ng
Bal
ance
($
’000
)($
’000
) ($
’000
)($
’000
)($
’000
)($
’000
)
Mur
ray-
Dar
ling
Bas
in A
utho
rity
Mur
ray-
Dar
ling
Bas
in S
peci
al A
ccou
nt*
--
--
--
--
--
--
Tota
l: M
urra
y-D
arlin
g B
asin
Aut
horit
y -
- -
--
--
- -
--
-
Bur
eau
of M
eteo
rolo
gy
Ser
vice
s fo
r Oth
er E
ntiti
es a
nd T
rust
Mon
eys
- Bur
eau
of
Met
eoro
logy
Spe
cial
Acc
ount
33
8-
--
-33
833
8-
--
-33
8
Tota
l: B
urea
u of
Met
eoro
logy
33
8-
--
-33
833
8-
--
-33
8
Cle
an E
nerg
y R
egul
ator
Ren
ewab
le E
nerg
y S
peci
al A
ccou
nt
1-
--
-1
116
,204
-
-16,
204
-1
Tota
l: C
lean
Ene
rgy
Reg
ulat
or
1-
--
-1
116
,204
-
-16,
204
-1
G
reat
Bar
rier R
eef M
arin
e Pa
rk A
utho
rity
Gre
at B
arrie
r Ree
f Fie
ld M
anag
emen
t Spe
cial
Acc
ount
1,
399
8,41
2 8,
372
-16,
784
-1,
399
1,39
98,
412
8,37
2-1
6,78
4-
1,39
9
Tota
l: G
reat
Bar
rier R
eef M
arin
e Pa
rk A
utho
rity
1,39
98,
412
8,37
2-1
6,78
4-
1,39
91,
399
8,41
2 8,
372
-16,
784
-1,
399

Special accounts table
111
B
udge
t Est
imat
e—20
15-2
016
Est
imat
ed A
ctua
l—20
14-2
015
O
peni
ng
Bal
ance
Rec
eipt
s (N
on-
App
ropr
iate
d)
Rec
eipt
s (A
ppro
pria
ted)
Pay
men
tsA
djus
tmen
tsC
losi
ng
Bal
ance
($
’000
)($
’000
) ($
’000
)($
’000
)($
’000
)($
’000
)
FIN
AN
CE
POR
TFO
LIO
Dep
artm
ent o
f Fin
ance
Bui
ldin
g A
ustra
lia F
und
Spe
cial
Acc
ount
-
3,71
9,40
8 -
-3,7
19,4
08-
--
289,
111
--2
89,1
11-
-
Bus
ines
s S
ervi
ces
Spe
cial
Acc
ount
6,
157
- -
--
6,15
768
75,
470
--
-6,
157
Com
cove
r Spe
cial
Acc
ount
35
7,32
612
6,99
0 10
,151
-143
,730
-35
0,73
736
0,67
310
1,35
7 9,
111
-113
,815
-35
7,32
6
Coo
rdin
ated
Pro
cure
men
t Con
tract
ing
Spe
cial
Acc
ount
44
,184
117,
785
3,41
2-1
20,8
52-
44,5
2948
,378
123,
660
--1
27,8
54-
44,1
84
Dis
abilt
yCar
e A
ustra
lia F
und
Spe
cial
Acc
ount
-
4,15
0,21
4 -
-4,1
50,2
14-
--
2,89
8,22
5 -
-2,8
98,2
25-
-
Edu
catio
n In
vest
men
t Fun
d S
peci
al A
ccou
nt
-3,
794,
554
--3
,794
,554
--
-32
1,44
9 -
-321
,449
--
Hea
lth a
nd H
ospi
tals
Fun
d S
peci
al A
ccou
nt
-1,
515,
742
--1
,515
,742
--
-77
4,21
4 -
-774
,214
--
Land
s A
cqui
sitio
n A
ccou
nt
--
--
--
--
--
--
Pro
perty
Spe
cial
Acc
ount
* -
- -
--
-28
0,38
621
,551
10
9,57
0-6
6,38
7-3
45,1
20-
Pro
perty
Spe
cial
Acc
ount
201
4 23
1,48
111
0,68
4 13
3,42
8-2
75,5
11-
200,
082
-56
,891
47
,091
-217
,621
345,
120
231,
481
Ser
vice
s fo
r Oth
er E
ntiti
es a
nd T
rust
Mon
eys
Spe
cial
Acc
ount
- D
epar
tmen
t of F
inan
ce a
nd D
ereg
ulat
ion
--
--
--
--
--
--
Tota
l: D
epar
tmen
t of F
inan
ce
639,
148
13,5
35,3
77
146,
991
-13,
720,
011
-60
1,50
569
0,12
44,
591,
928
165,
772
-4,8
08,6
76-
639,
148
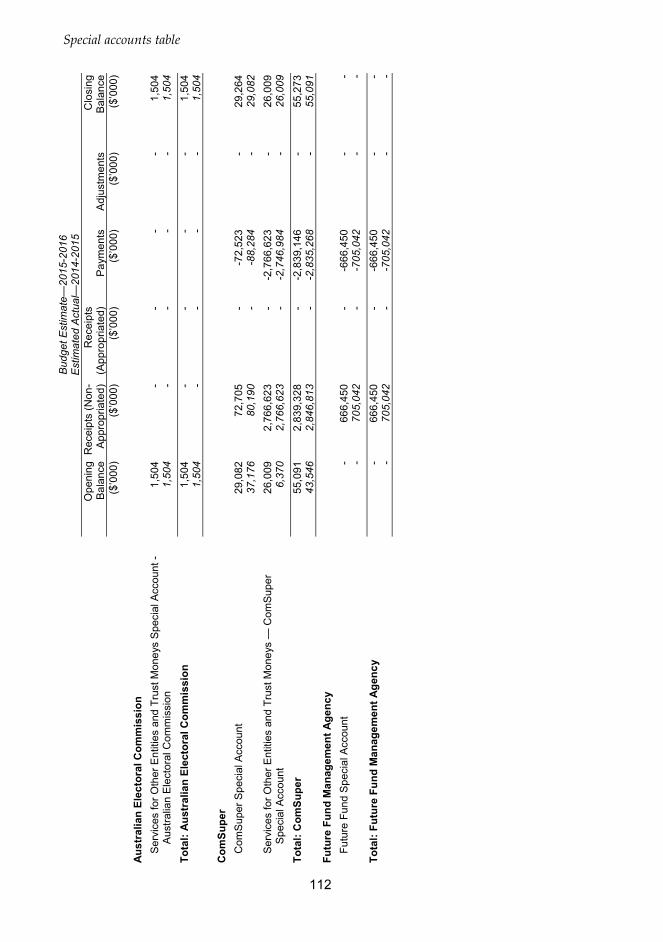
Special accounts table
112
B
udge
t Est
imat
e—20
15-2
016
Est
imat
ed A
ctua
l—20
14-2
015
O
peni
ng
Bal
ance
Rec
eipt
s (N
on-
App
ropr
iate
d)
Rec
eipt
s (A
ppro
pria
ted)
Pay
men
tsA
djus
tmen
tsC
losi
ng
Bal
ance
($
’000
)($
’000
) ($
’000
)($
’000
)($
’000
)($
’000
)
Aus
tral
ian
Elec
tora
l Com
mis
sion
Ser
vice
s fo
r Oth
er E
ntiti
es a
nd T
rust
Mon
eys
Spe
cial
Acc
ount
- A
ustra
lian
Ele
ctor
al C
omm
issi
on
1,50
4-
--
-1,
504
1,50
4-
--
-1,
504
Tota
l: A
ustr
alia
n El
ecto
ral C
omm
issi
on
1,50
4-
--
-1,
504
1,50
4-
--
-1,
504
C
omSu
per
Com
Sup
er S
peci
al A
ccou
nt
29,0
8272
,705
-
-72,
523
-29
,264
37,1
7680
,190
-
-88,
284
-29
,082
Ser
vice
s fo
r Oth
er E
ntiti
es a
nd T
rust
Mon
eys
— C
omS
uper
S
peci
al A
ccou
nt
26,0
092,
766,
623
--2
,766
,623
-26
,009
6,37
02,
766,
623
--2
,746
,984
-26
,009
Tota
l: C
omSu
per
55,0
912,
839,
328
--2
,839
,146
-55
,273
43,5
462,
846,
813
--2
,835
,268
-55
,091
Futu
re F
und
Man
agem
ent A
genc
y
Futu
re F
und
Spe
cial
Acc
ount
-
666,
450
--6
66,4
50-
--
705,
042
--7
05,0
42-
-
Tota
l: Fu
ture
Fun
d M
anag
emen
t Age
ncy
-66
6,45
0 -
-666
,450
--
-70
5,04
2 -
-705
,042
--

Special accounts table
113
B
udge
t Est
imat
e—20
15-2
016
Est
imat
ed A
ctua
l—20
14-2
015
O
peni
ng
Bal
ance
Rec
eipt
s (N
on-
App
ropr
iate
d)
Rec
eipt
s (A
ppro
pria
ted)
Pay
men
tsA
djus
tmen
tsC
losi
ng
Bal
ance
($
’000
)($
’000
) ($
’000
)($
’000
)($
’000
)($
’000
)
FOR
EIG
N A
FFA
IRS
AN
D T
RA
DE
POR
TFO
LIO
Dep
artm
ent o
f For
eign
Affa
irs a
nd T
rade
Adm
inis
tere
d P
aym
ents
and
Rec
eipt
s fo
r Oth
er E
ntiti
es S
peci
al
Acc
ount
5,
000
250,
000
--2
50,0
00-
5,00
05,
000
250,
000
--2
50,0
00-
5,00
0
Aus
tralia
-Indo
nesi
a P
artn
ersh
ip fo
r Rec
onst
ruct
ion
and
Dev
elop
men
t (G
rant
s) S
peci
al A
ccou
nt*
--
--
--
--
--
--
Aus
tralia
-Indo
nesi
a P
artn
ersh
ip fo
r Rec
onst
ruct
ion
and
Dev
elop
men
t (Lo
ans)
Spe
cial
Acc
ount
* -
- -
--
-38
,057
- -
-19,
282
-18,
775
-
Aus
tralia
-Indo
nesi
a P
artn
ersh
ip fo
r Rec
onst
ruct
ion
and
Dev
elop
men
t (Lo
ans)
Spe
cial
Acc
ount
201
5 -
- -
--
--
18,7
75
--1
8,77
5-
-
Con
sula
r Ser
vice
s S
peci
al A
ccou
nt
3410
0 -
-100
-34
3410
0 -
-100
-34
Exp
ositi
ons
Spe
cial
Acc
ount
99
4-
--
-99
499
4-
--
-99
4
Ove
rsea
s P
rope
rty S
peci
al A
ccou
nt
154,
027
93,5
40
2,03
6-1
58,7
85-
90,8
1828
1,32
791
,964
-
-219
,264
-15
4,02
7
Ser
vice
s fo
r Oth
er E
ntiti
es a
nd T
rust
Mon
eys
- Aus
AID
Spe
cial
A
ccou
nt*
--
--
--
--
--
--
Ser
vice
s fo
r Oth
er E
ntiti
es a
nd T
rust
Mon
eys
- For
eign
Affa
irs a
nd
Trad
e S
peci
al A
ccou
nt
6,97
77,
000
--7
,000
-6,
977
6,97
77,
000
--7
,000
-6,
977
To
tal:
Dep
artm
ent o
f For
eign
Affa
irs a
nd T
rade
16
7,03
235
0,64
0 2,
036
-415
,885
-10
3,82
333
2,38
936
7,83
9 -
-514
,421
-18,
775
167,
032
A
ustr
alia
n C
entr
e fo
r Int
erna
tiona
l Agr
icul
tura
l Res
earc
h
Aus
tralia
n C
entre
for I
nter
natio
nal A
gric
ultu
ral R
esea
rch
Acc
ount
26
,159
25,2
39
--2
5,23
9-
26,1
5926
,159
26,2
35
--2
6,23
5-
26,1
59
Tota
l: A
ustr
alia
n C
entr
e fo
r Int
erna
tiona
l Agr
icul
tura
l Res
earc
h 26
,159
25,2
39
--2
5,23
9-
26,1
5926
,159
26,2
35
--2
6,23
5-
26,1
59
Aus
tral
ian
Trad
e C
omm
issi
on

Special accounts table
114
B
udge
t Est
imat
e—20
15-2
016
Est
imat
ed A
ctua
l—20
14-2
015
O
peni
ng
Bal
ance
Rec
eipt
s (N
on-
App
ropr
iate
d)
Rec
eipt
s (A
ppro
pria
ted)
Pay
men
tsA
djus
tmen
tsC
losi
ng
Bal
ance
($
’000
)($
’000
) ($
’000
)($
’000
)($
’000
)($
’000
)
Adm
inis
tere
d P
aym
ents
and
Rec
eipt
s fo
r Oth
er E
ntiti
es -
Aus
tralia
n Tr
ade
Com
mis
sion
Spe
cial
Acc
ount
10
09,
200
--9
,200
-10
010
09,
200
--9
,200
-10
0
Ser
vice
s fo
r Oth
er E
ntiti
es a
nd T
rust
Mon
eys
- Dep
artm
ent o
f R
esou
rces
, Ene
rgy
and
Tour
ism
Spe
cial
Acc
ount
93
023
3 -
-1,1
63-
-94
71,
060
--1
,077
-93
0
Tota
l: A
ustr
alia
n Tr
ade
Com
mis
sion
1,
030
9,43
3 -
-10,
363
-10
01,
047
10,2
60
--1
0,27
7-
1,03
0

Special accounts table
115
B
udge
t Est
imat
e—20
15-2
016
Est
imat
ed A
ctua
l—20
14-2
015
O
peni
ng
Bal
ance
Rec
eipt
s (N
on-
App
ropr
iate
d)
Rec
eipt
s (A
ppro
pria
ted)
Pay
men
tsA
djus
tmen
tsC
losi
ng
Bal
ance
($
’000
)($
’000
) ($
’000
)($
’000
)($
’000
)($
’000
)
HEA
LTH
PO
RTF
OLI
O
D
epar
tmen
t of H
ealth
Aus
tralia
n C
hild
hood
Imm
unis
atio
n R
egis
ter S
peci
al A
ccou
nt
2,44
23,
705
5,85
8-9
,563
-2,
442
2,44
23,
673
5,80
2-9
,475
-2,
442
Gen
e Te
chno
logy
Acc
ount
7,
042
176
7,73
0-7
,906
-7,
042
7,04
217
1 7,
810
-7,9
81-
7,04
2
HH
F H
ealth
Por
tfolio
Spe
cial
Acc
ount
-
315,
944
--3
15,9
44-
--
719,
802
--7
19,8
02-
-
Hum
an P
ituita
ry H
orm
ones
Spe
cial
Acc
ount
2,
697
- -
-160
-2,
537
2,85
7-
--1
60-
2,69
7
Indu
stria
l Che
mic
als
Acc
ount
11
,125
15,8
70
3,87
4-1
9,62
0-
11,2
4911
,069
12,9
69
354
-13,
267
-11
,125
Ser
vice
s fo
r Oth
er E
ntiti
es a
nd T
rust
Mon
eys
- Dep
artm
ent o
f H
ealth
and
Age
ing
Spe
cial
Acc
ount
13
,840
4,52
1 1,
437
-5,9
20-
13,8
7816
,246
9,16
4 5,
976
-17,
546
-13
,840
Spo
rt an
d R
ecre
atio
n S
peci
al A
ccou
nt
5,43
540
7 -
-378
-5,
464
5,40
612
,197
-
-12,
168
-5,
435
Ther
apeu
tic G
oods
Adm
inis
tratio
n A
ccou
nt
55,2
5213
3,31
4 3,
602
-140
,921
-51
,247
63,3
3013
1,99
4 9,
320
-149
,392
-55
,252
Tota
l: D
epar
tmen
t of H
ealth
97
,833
473,
937
22,5
01-5
00,4
12-
93,8
5910
8,39
288
9,97
0 29
,262
-929
,791
-97
,833
A
ustr
alia
n N
atio
nal P
reve
ntiv
e H
ealth
Age
ncy
AN
PH
A S
peci
al A
ccou
nt
12,3
83-
--
-12
,383
12,3
83-
--
-12
,383
Tota
l: A
ustr
alia
n N
atio
nal P
reve
ntiv
e H
ealth
Age
ncy
12,3
83-
--
-12
,383
12,3
83-
--
-12
,383

Special accounts table
116
B
udge
t Est
imat
e—20
15-2
016
Est
imat
ed A
ctua
l—20
14-2
015
O
peni
ng
Bal
ance
Rec
eipt
s (N
on-
App
ropr
iate
d)
Rec
eipt
s (A
ppro
pria
ted)
Pay
men
tsA
djus
tmen
tsC
losi
ng
Bal
ance
($
’000
)($
’000
) ($
’000
)($
’000
)($
’000
)($
’000
)
Aus
tral
ian
Rad
iatio
n Pr
otec
tion
and
Nuc
lear
Saf
ety
Age
ncy
AR
PA
NS
A A
ccou
nt
880
10,0
46
15,9
07-2
5,70
7-
1,12
61,
395
10,0
46
15,2
56-2
5,81
7-
880
Tota
l: A
ustr
alia
n R
adia
tion
Prot
ectio
n an
d N
ucle
ar S
afet
y A
genc
y 88
010
,046
15
,907
-25,
707
-1,
126
1,39
510
,046
15
,256
-25,
817
-88
0
Nat
iona
l Blo
od A
utho
rity
Nat
iona
l Blo
od A
ccou
nt
140,
166
1,25
7,76
5 12
,982
-1,3
15,2
61-
95,6
5229
9,92
81,
029,
258
14,1
16-1
,203
,136
-14
0,16
6
Nat
iona
l Man
aged
Fun
d (B
lood
and
Blo
od P
rodu
cts)
Spe
cial
A
ccou
nt
331
62,6
34
--6
2,63
4-
331
331
47,3
42
--4
7,34
2-
331
Tota
l: N
atio
nal B
lood
Aut
horit
y 14
0,49
71,
320,
399
12,9
82-1
,377
,895
-95
,983
300,
259
1,07
6,60
0 14
,116
-1,2
50,4
78-
140,
497
N
atio
nal H
ealth
and
Med
ical
Res
earc
h C
ounc
il
Med
ical
Res
earc
h E
ndow
men
t Acc
ount
73
,715
34,0
00
796,
265
-871
,780
-32
,200
134,
147
38,6
00
859,
026
-958
,058
-73
,715
Tota
l: N
atio
nal H
ealth
and
Med
ical
Res
earc
h C
ounc
il 73
,715
34,0
00
796,
265
-871
,780
-32
,200
134,
147
38,6
00
859,
026
-958
,058
-73
,715

Special accounts table
117
B
udge
t Est
imat
e—20
15-2
016
Est
imat
ed A
ctua
l—20
14-2
015
O
peni
ng
Bal
ance
Rec
eipt
s (N
on-
App
ropr
iate
d)
Rec
eipt
s (A
ppro
pria
ted)
Pay
men
tsA
djus
tmen
tsC
losi
ng
Bal
ance
($
’000
)($
’000
) ($
’000
)($
’000
)($
’000
)($
’000
)
IMM
IGR
ATI
ON
AN
D B
OR
DER
PR
OTE
CTI
ON
PO
RTF
OLI
O
D
epar
tmen
t of I
mm
igra
tion
and
Bor
der P
rote
ctio
n
Aus
tralia
n P
opul
atio
n, M
ultic
ultu
ral a
nd Im
mig
ratio
n R
esea
rch
Pro
gram
Spe
cial
Acc
ount
-
- -
--
--
- -
--
-
Sec
urity
Dep
osits
Acc
ount
* -
- -
--
--
- -
--
-
Ser
vice
s fo
r Oth
er E
ntiti
es a
nd T
rust
Mon
eys
Spe
cial
Acc
ount
- A
ustra
lian
Cus
tom
s an
d B
orde
r Pro
tect
ion
Ser
vice
* -
- -
--
--
- -
--
-
Tota
l: D
epar
tmen
t of I
mm
igra
tion
and
Bor
der P
rote
ctio
n -
- -
--
--
- -
--
-
Aus
tral
ian
Cus
tom
s an
d B
orde
r Pro
tect
ion
Serv
ice
Sec
urity
Dep
osits
Acc
ount
* -
- -
--
--
- -
--
-
Ser
vice
s fo
r Oth
er E
ntiti
es a
nd T
rust
Mon
eys
Spe
cial
Acc
ount
- A
ustra
lian
Cus
tom
s an
d B
orde
r Pro
tect
ion
Ser
vice
* -
- -
--
--
- -
--
-
Tota
l: A
ustr
alia
n C
usto
ms
and
Bor
der P
rote
ctio
n Se
rvic
e -
- -
--
--
- -
--
-

Special accounts table
118
B
udge
t Est
imat
e—20
15-2
016
Est
imat
ed A
ctua
l—20
14-2
015
O
peni
ng
Bal
ance
Rec
eipt
s (N
on-
App
ropr
iate
d)
Rec
eipt
s (A
ppro
pria
ted)
Pay
men
tsA
djus
tmen
tsC
losi
ng
Bal
ance
($
’000
)($
’000
) ($
’000
)($
’000
)($
’000
)($
’000
)
IND
UST
RY
AN
D S
CIE
NC
E PO
RTF
OLI
O
D
epar
tmen
t of I
ndus
try
and
Scie
nce
Aus
tralia
n B
uild
ing
Cod
es B
oard
Spe
cial
Acc
ount
8,
613
4,30
0 4,
000
-8,6
50-
8,26
311
,693
4,32
0 4,
000
-11,
400
-8,
613
Aus
tralia
New
Zea
land
Lan
d In
form
atio
n S
peci
al A
ccou
nt
--
--
--
133
- -
--1
33-
Cle
an E
nerg
y In
itiat
ive
Spe
cial
Acc
ount
73
,709
- 87
,835
-114
,921
-46
,623
107,
777
- 58
,659
-92,
727
-73
,709
Clim
ate
Cha
nge
Spe
cial
Acc
ount
-
6,43
4 -
-6,4
34-
-6,
521
1,70
9 -
-8,2
30-
-
Ene
rgy
Spe
cial
Acc
ount
11
,841
- -
--
11,8
4111
,841
2,52
8 -
-2,5
28-
11,8
41
Nat
iona
l Offs
hore
Pet
role
um T
itles
Adm
inis
trato
r Spe
cial
Acc
ount
10
,126
10,2
06
--1
0,20
6-
10,1
2610
,126
9,98
5 -
-9,9
85-
10,1
26
Nat
iona
l Rep
osito
ry C
apita
l Con
tribu
tion
Fund
Spe
cial
Acc
ount
-
- -
--
--
- -
--
-
Ran
ger R
ehab
ilita
tion
Spe
cial
Acc
ount
68
,764
2,60
1 -
--
71,3
6566
,163
2,60
1 -
--
68,7
64
Sci
ence
and
Tec
hnol
ogy
Don
atio
ns/S
pons
orsh
ip S
peci
al A
ccou
nt
2,78
12,
460
--2
,569
-2,
672
698
2,83
4 -
-751
-2,
781
Ser
vice
s fo
r Oth
er E
ntiti
es a
nd T
rust
Mon
eys
- Dep
artm
ent o
f In
nova
tion,
Indu
stry
, Sci
ence
and
Res
earc
h S
peci
al A
ccou
nt
5,00
013
,500
-
-13,
500
-5,
000
11,9
6213
,500
-
-20,
039
-423
5,00
0
Stu
dent
Iden
tifie
rs S
peci
al A
ccou
nt
--
--
--
-4,
291
--1
,856
-2,4
35-
Tota
l: D
epar
tmen
t of I
ndus
try
and
Scie
nce
180,
834
39,5
01
91,8
35-1
56,2
80-
155,
890
226,
914
41,7
68
62,6
59-1
47,5
16-2
,991
180,
834
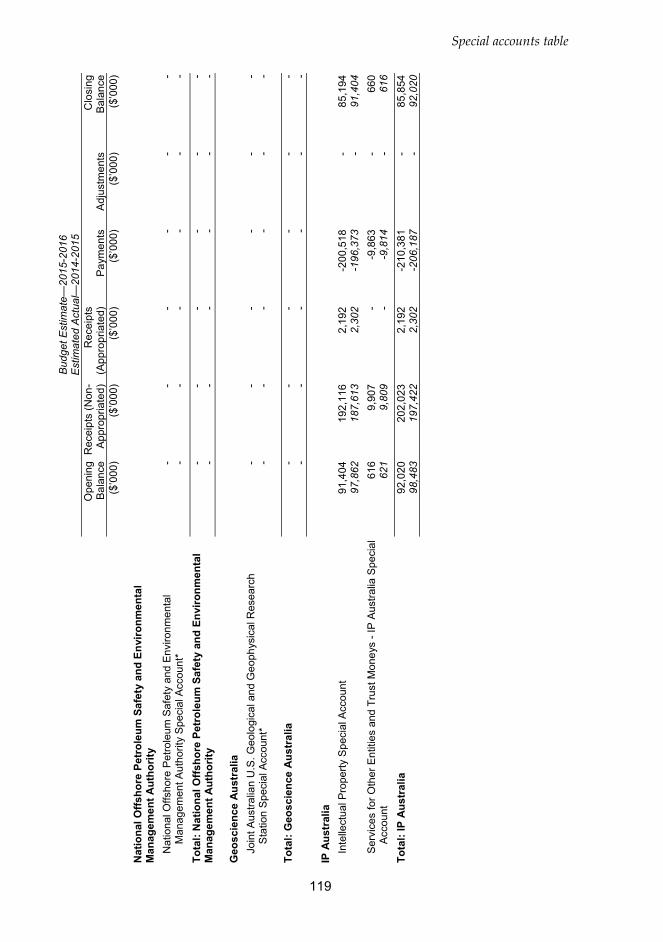
Special accounts table
119
B
udge
t Est
imat
e—20
15-2
016
Est
imat
ed A
ctua
l—20
14-2
015
O
peni
ng
Bal
ance
Rec
eipt
s (N
on-
App
ropr
iate
d)
Rec
eipt
s (A
ppro
pria
ted)
Pay
men
tsA
djus
tmen
tsC
losi
ng
Bal
ance
($
’000
)($
’000
) ($
’000
)($
’000
)($
’000
)($
’000
)
Nat
iona
l Offs
hore
Pet
role
um S
afet
y an
d En
viro
nmen
tal
Man
agem
ent A
utho
rity
Nat
iona
l Offs
hore
Pet
role
um S
afet
y an
d E
nviro
nmen
tal
Man
agem
ent A
utho
rity
Spe
cial
Acc
ount
* -
- -
--
--
- -
--
-
Tota
l: N
atio
nal O
ffsho
re P
etro
leum
Saf
ety
and
Envi
ronm
enta
l M
anag
emen
t Aut
horit
y -
- -
--
--
- -
--
-
Geo
scie
nce
Aus
tral
ia
Join
t Aus
tralia
n U
.S. G
eolo
gica
l and
Geo
phys
ical
Res
earc
h S
tatio
n S
peci
al A
ccou
nt*
--
--
--
--
--
--
To
tal:
Geo
scie
nce
Aus
tral
ia
--
--
--
--
--
--
IP
Aus
tral
ia
Inte
llect
ual P
rope
rty S
peci
al A
ccou
nt
91,4
0419
2,11
6 2,
192
-200
,518
-85
,194
97,8
6218
7,61
3 2,
302
-196
,373
-91
,404
Ser
vice
s fo
r Oth
er E
ntiti
es a
nd T
rust
Mon
eys
- IP
Aus
tralia
Spe
cial
A
ccou
nt
616
9,90
7 -
-9,8
63-
660
621
9,80
9 -
-9,8
14-
616
Tota
l: IP
Aus
tral
ia
92,0
2020
2,02
3 2,
192
-210
,381
-85
,854
98,4
8319
7,42
2 2,
302
-206
,187
-92
,020

Special accounts table
120
B
udge
t Est
imat
e—20
15-2
016
Est
imat
ed A
ctua
l—20
14-2
015
O
peni
ng
Bal
ance
Rec
eipt
s (N
on-
App
ropr
iate
d)
Rec
eipt
s (A
ppro
pria
ted)
Pay
men
tsA
djus
tmen
tsC
losi
ng
Bal
ance
($
’000
)($
’000
) ($
’000
)($
’000
)($
’000
)($
’000
)
INFR
AST
RU
CTU
RE
AN
D R
EGIO
NA
L D
EVEL
OPM
ENT
POR
TFO
LIO
Dep
artm
ent o
f Inf
rast
ruct
ure
and
Reg
iona
l Dev
elop
men
t
BA
F In
frast
ruct
ure
Por
tfolio
Spe
cial
Acc
ount
-
54,4
60
--5
4,46
0-
--
184,
680
--1
84,6
80-
-
Chr
istm
as Is
land
Pho
spha
te M
inin
g R
ehab
ilita
tion
Spe
cial
Acc
ount
1,71
71,
445
--1
,700
-1,
462
1,94
51,
482
--1
,710
-1,
717
Indi
an O
cean
Ter
ritor
ies
Spe
cial
Acc
ount
201
4 -
21,7
57
--2
1,75
7-
--
- -
--
-
Infra
stru
ctur
e A
ustra
lia S
peci
al A
ccou
nt*
--
--
--
5,29
9-
11,9
53-2
,215
-15,
037
-
Inte
rsta
te R
oad
Tran
spor
t Acc
ount
6,
971
- 71
,002
-71,
002
-6,
971
6,97
1-
71,0
02-7
1,00
2-
6,97
1
Jerv
is B
ay T
errit
ory
Spe
cial
Acc
ount
201
4 -
1,04
7 -
-1,0
47-
--
- -
--
-
Ser
vice
s fo
r Oth
er E
ntiti
es a
nd T
rust
Mon
eys
- Dep
artm
ent o
f In
frast
ruct
ure
and
Tran
spor
t Spe
cial
Acc
ount
24
5-
--
-24
537
0-
--1
25-
245
Tota
l: D
epar
tmen
t of I
nfra
stru
ctur
e an
d R
egio
nal D
evel
opm
ent
8,93
378
,709
71
,002
-149
,966
-8,
678
14,5
8518
6,16
2 82
,955
-259
,732
-15,
037
8,93
3

Special accounts table
121
B
udge
t Est
imat
e—20
15-2
016
Est
imat
ed A
ctua
l—20
14-2
015
O
peni
ng
Bal
ance
Rec
eipt
s (N
on-
App
ropr
iate
d)
Rec
eipt
s (A
ppro
pria
ted)
Pay
men
tsA
djus
tmen
tsC
losi
ng
Bal
ance
($
’000
)($
’000
) ($
’000
)($
’000
)($
’000
)($
’000
)
PRIM
E M
INIS
TER
AN
D C
AB
INET
PO
RTF
OLI
O
D
epar
tmen
t of t
he P
rime
Min
iste
r and
Cab
inet
Abo
rigin
al A
dvan
cem
ent A
ccou
nt
--
--
--
--
--
--
Abo
rigin
al a
nd T
orre
s S
trait
Isla
nder
Cor
pora
tions
Unc
laim
ed
Mon
ey A
ccou
nt
549
- -
--
549
709
- -
-160
-54
9
Abo
rigin
al a
nd T
orre
s S
trait
Isla
nder
Lan
d A
ccou
nt
12,
984,
586
--3
,012
,599
28,0
131
12,
902,
791
--2
,929
,944
27,1
531
Abo
rigin
al T
utor
ial A
ssis
tanc
e S
uper
annu
atio
n S
peci
al A
ccou
nt
6035
-
-5-
9030
35
--5
-60
Abo
rigin
als
Ben
efit
Acc
ount
15
,865
803,
177
113,
000
-1,0
02,8
7386
,696
15,8
6517
,569
782,
545
157,
000
-960
,570
19,3
2115
,865
Dep
artm
ent o
f the
Prim
e M
inis
ter a
nd C
abin
et S
ervi
ces
for O
ther
E
ntiti
es a
nd T
rust
Mon
eys
Spe
cial
Acc
ount
61
4-
--5
-60
961
4-
--
-61
4
Indi
geno
us C
omm
uniti
es S
trate
gic
Inve
stm
ent P
rogr
am S
peci
al
Acc
ount
* -
- -
--
--
- -
--
-
Indi
geno
us R
emot
e S
ervi
ce D
eliv
ery
Spe
cial
Acc
ount
8,
118
10
--7
,783
-34
511
,213
106
--3
,201
-8,
118
Tota
l: D
epar
tmen
t of t
he P
rime
Min
iste
r and
Cab
inet
25
,207
3,78
7,80
8 11
3,00
0-4
,023
,265
114,
709
17,4
5930
,136
3,68
5,47
7 15
7,00
0-3
,893
,880
46,4
7425
,207
A
ustr
alia
n N
atio
nal A
udit
Offi
ce
Ser
vice
s fo
r Oth
er E
ntiti
es a
nd T
rust
Mon
eys
Spe
cial
Acc
ount
- A
ustra
lian
Nat
iona
l Aud
it O
ffice
-
- -
--
--
- -
--
-
Tota
l: A
ustr
alia
n N
atio
nal A
udit
Offi
ce
--
--
--
--
--
--

Special accounts table
122
B
udge
t Est
imat
e—20
15-2
016
Est
imat
ed A
ctua
l—20
14-2
015
O
peni
ng
Bal
ance
Rec
eipt
s (N
on-
App
ropr
iate
d)
Rec
eipt
s (A
ppro
pria
ted)
Pay
men
tsA
djus
tmen
tsC
losi
ng
Bal
ance
($
’000
)($
’000
) ($
’000
)($
’000
)($
’000
)($
’000
)
SOC
IAL
SER
VIC
ES P
OR
TFO
LIO
Dep
artm
ent o
f Soc
ial S
ervi
ces
Ear
ly Y
ears
Qua
lity
Fund
Spe
cial
Acc
ount
67
,682
- -
-67,
487
-19
5-
- 13
5,00
0-7
8,09
010
,772
67,6
82
Nat
iona
l Dis
abili
ty S
peci
al A
ccou
nt
7,15
4-
--2
,374
-4,
780
7,62
9-
--4
75-
7,15
4
Ser
vice
s fo
r Oth
er E
ntiti
es a
nd T
rust
Mon
eys
- Dep
artm
ent o
f Fa
mili
es, H
ousi
ng, C
omm
unity
Ser
vice
s an
d In
dige
nous
Affa
irs
Spe
cial
Acc
ount
21,2
191,
201
5,00
0-1
6,68
3-
10,7
37
6,78
81,
529
20,1
25-7
,223
-21
,219
Soc
ial a
nd C
omm
unity
Ser
vice
s P
ay E
quity
Spe
cial
Acc
ount
11
8,59
8-
261,
563
-261
,563
-11
8,59
811
8,59
8-
204,
440
-204
,440
-11
8,59
8
Tota
l: D
epar
tmen
t of S
ocia
l Ser
vice
s 21
4,65
31,
201
266,
563
-348
,107
-13
4,31
013
3,01
51,
529
359,
565
-290
,228
10,7
7221
4,65
3
Dep
artm
ent o
f Hum
an S
ervi
ces
Chi
ld S
uppo
rt A
ccou
nt
56,8
871,
420,
867
61,9
29-1
,482
,796
-56
,887
56,8
871,
395,
681
59,4
55-1
,455
,136
-56
,887
Rec
over
y of
Com
pens
atio
n fo
r Hea
lth C
are
and
Oth
er S
ervi
ces
Spe
cial
Acc
ount
31
,061
261,
101
--2
65,5
71-
26,5
9135
,465
257,
242
--2
61,6
46-
31,0
61
Ser
vice
s fo
r Oth
er E
ntiti
es a
nd T
rust
Mon
eys
- Dep
artm
ent o
f H
uman
Ser
vice
s S
peci
al A
ccou
nt
--
--
--
--
--
--
Tota
l: D
epar
tmen
t of H
uman
Ser
vice
s 87
,948
1,68
1,96
8 61
,929
-1,7
48,3
67-
83,4
7892
,352
1,65
2,92
3 59
,455
-1,7
16,7
82-
87,9
48

Special accounts table
123
B
udge
t Est
imat
e—20
15-2
016
Est
imat
ed A
ctua
l—20
14-2
015
O
peni
ng
Bal
ance
Rec
eipt
s (N
on-
App
ropr
iate
d)
Rec
eipt
s (A
ppro
pria
ted)
Pay
men
tsA
djus
tmen
tsC
losi
ng
Bal
ance
($
’000
)($
’000
) ($
’000
)($
’000
)($
’000
)($
’000
)
TREA
SUR
Y PO
RTF
OLI
O
D
epar
tmen
t of t
he T
reas
ury
Act
uaria
l Ser
vice
s S
peci
al A
ccou
nt
2,44
61,
803
--1
,803
-2,
446
2,44
61,
629
--1
,629
-2,
446
Cle
an E
nerg
y Fi
nanc
e C
orpo
ratio
n S
peci
al A
ccou
nt
2,91
9,00
028
8,54
3 -
--
3,20
7,54
386
8,40
050
,600
2,
000,
000
--
2,91
9,00
0
CO
AG
Ref
orm
Fun
d S
peci
al A
ccou
nt
-12
,743
,146
-
-12,
743,
146
--
-12
,215
,332
-
-12,
215,
332
--
Fina
ncia
l Sys
tem
Sta
bilit
y S
peci
al A
ccou
nt
--
--
--
--
--
--
Ser
vice
s fo
r Oth
er E
ntiti
es a
nd T
rust
Mon
eys
Spe
cial
Acc
ount
- D
epar
tmen
t of t
he T
reas
ury
--
--
--
--
--
--
Tota
l: D
epar
tmen
t of t
he T
reas
ury
2,92
1,44
613
,033
,492
-
-12,
744,
949
-3,
209,
989
870,
846
12,2
67,5
61
2,00
0,00
0-1
2,21
6,96
1-
2,92
1,44
6
Aus
tral
ian
Com
petit
ion
and
Con
sum
er C
omm
issi
on
Ser
vice
s fo
r Oth
er E
ntiti
es a
nd T
rust
Mon
eys
- Aus
tralia
n C
ompe
titio
n an
d C
onsu
mer
Com
mis
sion
Spe
cial
Acc
ount
54
- -
--
5454
- -
--
54
Tota
l: A
ustr
alia
n C
ompe
titio
n an
d C
onsu
mer
Com
mis
sion
54
- -
--
5454
- -
--
54
Aus
tral
ian
Offi
ce o
f Fin
anci
al M
anag
emen
t
Deb
t Ret
irem
ent R
eser
ve T
rust
Acc
ount
84
3-
--
-84
384
3-
--
-84
3
Tota
l: A
ustr
alia
n O
ffice
of F
inan
cial
Man
agem
ent
843
- -
--
843
843
- -
--
843

Special accounts table
124
B
udge
t Est
imat
e—20
15-2
016
Est
imat
ed A
ctua
l—20
14-2
015
O
peni
ng
Bal
ance
Rec
eipt
s (N
on-
App
ropr
iate
d)
Rec
eipt
s (A
ppro
pria
ted)
Pay
men
tsA
djus
tmen
tsC
losi
ng
Bal
ance
($
’000
)($
’000
) ($
’000
)($
’000
)($
’000
)($
’000
)
Aus
tral
ian
Prud
entia
l Reg
ulat
ion
Aut
horit
y
Aus
tralia
n P
rude
ntia
l Reg
ulat
ion
Aut
horit
y S
peci
al A
ccou
nt
59,8
7711
8,95
1 6,
167
-121
,890
-63
,105
57,6
1411
9,54
3 5,
201
-122
,481
-59
,877
Fina
ncia
l Cla
ims
Sch
eme
Spe
cial
Acc
ount
83
5-
--
-83
583
5-
--
-83
5
Lloy
d’s
Dep
osit
Trus
t Spe
cial
Acc
ount
2,
000
- -
--
2,00
02,
000
- -
--
2,00
0
Tota
l: A
ustr
alia
n Pr
uden
tial R
egul
atio
n A
utho
rity
62,7
1211
8,95
1 6,
167
-121
,890
-65
,940
60,4
4911
9,54
3 5,
201
-122
,481
-62
,712
Aus
tral
ian
Secu
ritie
s an
d In
vest
men
ts C
omm
issi
on
AS
IC D
ereg
iste
red
Com
pani
es T
rust
Mon
eys
Spe
cial
Acc
ount
1,
546
1,00
0 -
-1,0
00-
1,54
61,
546
1,00
0 -
-1,0
00-
1,54
6
AS
IC In
vest
igat
ions
, Leg
al P
roce
edin
gs, S
ettle
men
ts a
nd C
ourt
Ord
ers
Spe
cial
Acc
ount
11
- -
--
1111
- -
--
11
AS
IC S
ecur
ity D
epos
its S
peci
al A
ccou
nt
445
- -
--
445
445
- -
--
445
Enf
orce
men
t Spe
cial
Acc
ount
51
,900
- 26
,973
-26,
973
-51
,900
51,9
00-
27,0
00-2
7,00
0-
51,9
00
Ser
vice
s fo
r Oth
er E
ntiti
es a
nd T
rust
Mon
eys
Spe
cial
Acc
ount
- A
ustra
lian
Sec
uriti
es a
nd In
vest
men
ts C
omm
issi
on
--
--
--
--
--
--
To
tal:
Aus
tral
ian
Secu
ritie
s an
d In
vest
men
ts C
omm
issi
on
53,9
021,
000
26,9
73-2
7,97
3-
53,9
0253
,902
1,00
0 27
,000
-28,
000
-53
,902

Special accounts table
125
B
udge
t Est
imat
e—20
15-2
016
Est
imat
ed A
ctua
l—20
14-2
015
O
peni
ng
Bal
ance
Rec
eipt
s (N
on-
App
ropr
iate
d)
Rec
eipt
s (A
ppro
pria
ted)
Pay
men
tsA
djus
tmen
tsC
losi
ng
Bal
ance
($
’000
)($
’000
) ($
’000
)($
’000
)($
’000
)($
’000
)
Aus
tral
ian
Taxa
tion
Offi
ce
Aus
tralia
n C
harit
ies
and
Not
-for-
prof
its C
omm
issi
on S
peci
al
Acc
ount
5,
748
- 14
,812
-16,
194
-4,
366
5,34
1-
14,9
86-1
4,57
9-
5,74
8
Exc
ise
Sec
urity
Dep
osits
Spe
cial
Acc
ount
45
5-
--
-45
535
510
0 -
--
455
Ser
vice
s fo
r Oth
er E
ntiti
es a
nd T
rust
Mon
eys
Spe
cial
Acc
ount
- A
ustra
lian
Taxa
tion
Offi
ce
2,59
610
,000
-
-10,
000
-2,
596
2,59
610
,000
-
-10,
000
-2,
596
Sup
eran
nuat
ion
Cle
arin
g H
ouse
Spe
cial
Acc
ount
11
,005
3,02
2,00
0 -
-3,0
14,0
00-
19,0
0520
,005
1,77
5,00
0 -
-1,7
84,0
00-
11,0
05
Sup
eran
nuat
ion
Hol
ding
Acc
ount
s S
peci
al A
ccou
nt
94,2
83-
60,7
00-1
4,80
0-
140,
183
74,5
83-
48,5
00-2
8,80
0-
94,2
83
Val
uatio
n S
ervi
ces
Spe
cial
Acc
ount
-
- -
--
-11
,209
2,10
2 7,
400
-20,
711
--
Tota
l: A
ustr
alia
n Ta
xatio
n O
ffice
11
4,08
73,
032,
000
75,5
12-3
,054
,994
-16
6,60
511
4,08
91,
787,
202
70,8
86-1
,858
,090
-11
4,08
7
Roy
al A
ustr
alia
n M
int
Min
ting
and
Coi
nage
Spe
cial
Acc
ount
* -
- -
--
--
- -
--
-
Roy
al A
ustra
lian
Min
t Spe
cial
Acc
ount
7,
012
156,
525
--1
58,4
21-
5,11
66,
571
147,
126
--1
46,6
85-
7,01
2
Tota
l: R
oyal
Aus
tral
ian
Min
t 7,
012
156,
525
--1
58,4
21-
5,11
66,
571
147,
126
--1
46,6
85-
7,01
2
* D
enot
es a
spe
cial
acc
ount
whi
ch w
as a
bolis
hed
durin
g 20
14-1
5.


127
Part 2: Staffing of Agencies


129
A SMALLER MORE AGILE PUBLIC SERVICE REDUCING THE PUBLIC SECTOR WORKFORCE
In around 18 months, the Government has reversed an eight-year peak in staffing levels, bringing the Commonwealth public sector back to a more affordable and sustainable size.
Last year’s Budget forecast that in 2014-15 the net reduction in total Average Staffing Levels (ASL) excluding military and reserves would be 10,031 ASL from 2012-13. Based on figures collected for the current Budget, the latest projections in fact show a net reduction of 12,542 ASL.
Over the period from 1 September 2013 to 28 February 2015 over 17,300 public servants left the Australian Public Service. Around half of this reduction was achieved through natural attrition and the overwhelming majority of redundancies have been voluntary. Natural attrition has helped to lessen the number of redundancies required across the Commonwealth public sector.
The Government has provided $212 million to 38 agencies to assist with redundancies, where there had been insufficient provision made by the previous Government to meet the costs of planned workforce reductions.
Interim recruitment arrangements which the Government commenced from November 2013 have also helped reduce the size of the Australian Public Service in an orderly way. From 1 July 2015, new controls will afford agency heads the flexibility to manage recruitment, including graduate recruitment, without the need for external approval. This will be subject to functional requirements and ongoing monitoring by the Australian Public Service Commission.
SHIFTS IN STAFFING INVESTMENT
The 2015-16 Budget includes outcomes from the independent functional and efficiency review of the Department of Health and the first stage of outcomes from the equivalent review of the Department of Education and Training. These reviews are contributing to the realignment of agency capabilities to the Government’s priorities and will be followed by reviews of other departments throughout 2015-16.
The integration of the Defence Materiel Organisation into the Department of Defence is expected to provide additional staffing reductions, with savings to be worked through in a methodical way later in 2015.
Strong progress toward staffing reductions has enabled some limited reinvestment by the Government into higher priority areas, such as access to high quality affordable childcare and the My Health Record Strategy. The Government is committed to a

Part 2: Staffing of agencies
130
sustainable Public Service, where size is based on functional requirements and the highest standards of efficiency.
Some of the overall reductions in staffing levels will be offset by temporary increases in particular areas to manage implementation of policy change or to build infrastructure required to achieve future automation and efficiencies. This includes investment in the information technology systems of the Australian Bureau of Statistics and the first tranche of the Welfare Payment Infrastructure Transformation Programme.
Other areas of targeted or transitory ASL growth within the 2015-16 Budget support a smaller role for government, including welfare compliance resources to help to control administered spending and reduce dependency on the Government.
SIMPLER STRUCTURES OF GOVERNMENT
The Government has been methodically reducing the number of government bodies, to reduce the level of inefficiency, duplication and over-governance. More cohesive government structures are better able to work flexibly across shifting areas of need and deal with new or emerging issues.
The Government is actively identifying opportunities to outsource activities that can be better delivered using non-government sector expertise, technology, or capital.
Smaller Government reforms announced in the 2015-16 Budget include: market testing the capacity of a private operator to upgrade and operate the Australian Securities and Investment Commission (ASIC) Registry; disbanding the Defence Materiel Organisation by folding its functions into the Department of Defence; abolition of the Administrative Review Council through shifting its functions to the Attorney-General’s Department; and consolidation of the Bureau of Resource and Energy Economics into the Department of Industry and Science.
The Government will also undertake a scoping study in 2015-16 on options for the future management, operations and ownership of the Australian Rail Track Corporation Ltd.
The Government will continue to focus on ensuring that the resources and staff it deploys are the right people, undertaking necessary work, as efficiently as is achievable anywhere in the market.
TRENDS IN AVERAGE STAFFING LEVELS
Trends in the estimated annual ASL for all agencies in the GGS are reported in Table 2.1, including all Defence Force personnel. ASL figures reflect the average number of employees receiving salary or wages over the financial year, with adjustments for casual and part-time staff, to show the average full-time equivalent.

131
ASL numbers are one factor in determining wages and salary figures shown in the budget estimates. The other main factors include the classification of staff and the level of wages and salaries in each agency.
The estimated ASL for 2014-15, excluding military personnel and reserves, as reported in the 2014-15 Budget papers (Budget Paper No. 4) was 169,922. The current estimate by agencies for their 2014-15 ASL has reduced to 167,411. The ASL estimated for 2015-16 is 167,340, although final ASL for 2015-16 may be lower as a result of additional Functional and Efficiency Reviews and further targeted efficiency measures due to be considered by the Government later in 2015.
ASL in 2015-16 will be 15,165 lower than the ASL peak of 182,505 in 2011-12.
The Budget forecasts for the 2015-16 year will see total staffing return to the level last recorded in 2006-07, as measured across the GGS excluding military personnel and reserves.
Table 2.1: Estimates of total average staff levels in the General Government Sector
ASL Excluding military and reserves
Military and reserves
Total ASL
2005-06 156,674 70,339 227,013 2006-07 167,596 71,026 238,622 2007-08 175,531 72,686 248,217 2008-09 175,422 75,144 250,566 2009-10 178,970 79,351 258,321 2010-11 181,018 80,873 261,891 2011-12 182,505 79,132 261,637 2012-13 179,953 76,678 256,631 2013-14 177,258 76,595 253,853 2014-15 167,411 76,848 244,259 2015-16 167,340 76,842 244,182
Part 2: Staffing of agencies

Part 2: Staffing of agencies
132
Table 2.2 provides details of ASL at the portfolio and agency level.
Following the issuing of Administrative Arrangements Orders on 23 December 2014, there were a number of machinery of government changes including transfers of functions between agencies, movements of agencies between portfolios, mergers of agencies, and the establishment and abolition of agencies. Comparison of ASL at portfolio and agency level between years should take into consideration that the related ASL would have a part-year effect in 2014-15 and a full-year effect in 2015-16.
Table 2.2: Estimates of average staffing level (ASL) of agencies in the Australian Government General Government Sector(a)
ASL ASL ChangeAgricultureDepartment of Agriculture 4,108 4,179 71Australian Grape and Wine Authority 54 53 -2Australian Fisheries Management Authority 182 185 3Australian Pesticides and Veterinary Medicines Authority 171 171 0Cotton Research and Development Corporation 13 13 0Fisheries Research and Development Corporation 12 13 0Grains Research and Development Corporation 75 79 4Rural Industries Research and Development Corporation 19 19 0
Total 4,635 4,712 77
Average staffing levels #
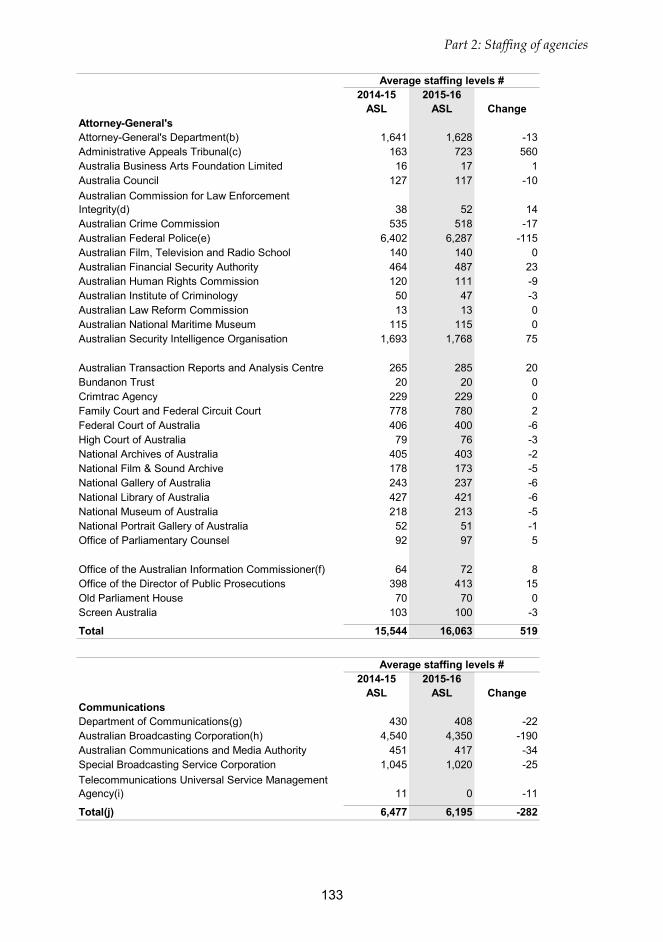
133
2014-15 ASL
2015-16 ASL Change
Attorney-General's Attorney-General's Department(b) 1,641 1,628 -13Administrative Appeals Tribunal(c) 163 723 560Australia Business Arts Foundation Limited 16 17 1Australia Council 127 117 -10Australian Commission for Law Enforcement Integrity(d) 38 52 14Australian Crime Commission 535 518 -17Australian Federal Police(e) 6,402 6,287 -115Australian Film, Television and Radio School 140 140 0Australian Financial Security Authority 464 487 23Australian Human Rights Commission 120 111 -9Australian Institute of Criminology 50 47 -3Australian Law Reform Commission 13 13 0Australian National Maritime Museum 115 115 0Australian Security Intelligence Organisation 1,693 1,768 75
Australian Transaction Reports and Analysis Centre 265 285 20Bundanon Trust 20 20 0Crimtrac Agency 229 229 0Family Court and Federal Circuit Court 778 780 2Federal Court of Australia 406 400 -6High Court of Australia 79 76 -3National Archives of Australia 405 403 -2National Film & Sound Archive 178 173 -5National Gallery of Australia 243 237 -6National Library of Australia 427 421 -6National Museum of Australia 218 213 -5National Portrait Gallery of Australia 52 51 -1Office of Parliamentary Counsel 92 97 5
Office of the Australian Information Commissioner(f) 64 72 8Office of the Director of Public Prosecutions 398 413 15Old Parliament House 70 70 0Screen Australia 103 100 -3
Total 15,544 16,063 519
Average staffing levels #
2014-15 ASL
2015-16 ASL Change
CommunicationsDepartment of Communications(g) 430 408 -22Australian Broadcasting Corporation(h) 4,540 4,350 -190Australian Communications and Media Authority 451 417 -34Special Broadcasting Service Corporation 1,045 1,020 -25Telecommunications Universal Service Management Agency(i) 11 0 -11
Total(j) 6,477 6,195 -282
Average staffing levels #
Part 2: Staffing of agencies

Part 2: Staffing of agencies
134
2014-15 ASL
2015-16 ASL Change
DefenceDepartment of Defence – Civilian(k) 14,472 18,380 3,908Department of Defence – Military(l) 57,588 57,982 394Department of Defence – Reserves(m) 19,260 18,860 -400Department of Veterans' Affairs 1,935 1,894 -41Australian War Memorial 301 278 -23Defence Housing Australia 664 676 12Defence Materiel Organisation(n) 4,888 0 -4,888
Total 99,108 98,070 -1,038
Average staffing levels #
2014-15 ASL
2015-16 ASL Change
Departments of the ParliamentDepartment of Parliamentary Services 743 739 -4Department of the House of Representatives 158 158 0Department of the Senate 150 155 5Parliamentary Budget Office 39 39 0
Total 1,090 1,091 1
Average staffing levels #
2014-15 ASL
2015-16 ASL Change
Education and TrainingDepartment of Education and Training(o) 1,651 1,601 -50Australian Curriculum Assessment and Reporting Authority 96 93 -3Australian Institute for Teaching and School Leadership Limited 62 56 -6Australian Institute of Aboriginal and Torres Strait Islander Studies 134 143 9Australian Research Council 120 120 0Australian Skills Quality Authority(p) 205 213 8
Tertiary Education Quality and Standards Agency(q) 71 60 -11
Total 2,339 2,286 -53
Average staffing levels #

135
2014-15 ASL
2015-16 ASL Change
EmploymentDepartment of Employment 1,695 1,791 96Asbestos Safety and Eradication Agency(r) 9 12 3Comcare 610 652 42Fair Work Commission 339 336 -3Office of the Fair Work Building Industry Inspectorate(s) 139 155 16Office of the Fair Work Ombudsman 710 685 -25Safe Work Australia 95 101 6Workplace Gender Equality Agency 29 29 0
Total 3,626 3,761 134
Average staffing levels #
2014-15 ASL
2015-16 ASL Change
EnvironmentDepartment of the Environment 1,945 1,910 -35Bureau of Meteorology(t) 1,481 1,379 -102Clean Energy Regulator 318 324 6Climate Change Authority(u) 21 18 -3Director of National Parks 262 260 -2Great Barrier Reef Marine Park Authority 200 195 -5Murray-Darling Basin Authority 299 316 17National Water Commission(v) 12 0 -12Sydney Harbour Federation Trust 62 64 2
Total 4,600 4,466 -134
Average staffing levels #
2014-15 ASL
2015-16 ASL Change
FinanceDepartment of Finance 1,347 1,350 3Australian Electoral Commission 801 788 -13Commonwealth Superannuation Corporation(w) 81 476 395ComSuper(w) 410 0 -410Future Fund Management Agency(x) 104 122 18Total 2,743 2,736 -7
Average staffing levels #
Part 2: Staffing of agencies

Part 2: Staffing of agencies
136
2014-15 ASL
2015-16 ASL Change
Foreign Affairs and TradeDepartment of Foreign Affairs and Trade 5,722 5,734 12
Australian Centre for International Agriculture Research 74 74 0Australian Secret Intelligence Service* * * *Australian Trade Commission (Austrade) 1,010 1,018 9Export Finance and Insurance Corporation - National Interest Account 3 3 0Tourism Australia 204 207 3
Total 7,013 7,036 23
Average staffing levels #
2014-15 ASL
2015-16 ASL Change
Health Department of Health 3,196 3,202 6Australian Commission on Safety and Quality in Health Care(y) 82 92 10Australian Institute of Health and Welfare 298 285 -13Australian National Preventive Health Agency(z) 1 0 -1Australian Organ and Tissue Donation and Transplantation Authority 28 28 0Australian Radiation Protection and Nuclear Safety Agency 127 135 8Australian Sports Anti-Doping Authority 60 57 -3Australian Sports Commission 610 584 -26Australian Sports Foundation Limited(aa) 5 11 6Cancer Australia 68 71 3Food Standards Australia and New Zealand 102 109 7
General Practice Education and Training Limited(ab) 28 0 -28Health Workforce Australia(ac) 8 0 -8Independent Hospital Pricing Authority 54 59 5National Blood Authority 53 53 0National Health and Medical Research Council 200 190 -10National Health Funding Body 19 19 0National Health Performance Authority 51 54 3National Mental Health Commission 13 14 1Private Health Insurance Administration Council 29 28 -1Private Health Insurance Ombudsman(ad) 11 0 -11Professional Services Review 17 17 0
Total 5,060 5,009 -52
Average staffing levels #

137
2014-15 ASL
2015-16 ASL Change
Immigration and Border Protection
Department of Immigration and Border Protection(ae) 8,825 13,700 4,875
Australian Customs and Border Protection Service(ae) 4,905 0 -4,905Migration Review Tribunal and Refugee Review Tribunal(af) 410 0 -410
Total 14,140 13,700 -440
Average staffing levels #
2014-15 ASL
2015-16 ASL Change
Industry and ScienceDepartment of Industry and Science(ag) 2,807 2,538 -269Australian Institute of Marine Science 210 213 3Australian Nuclear Science and Technology Organisation 1,227 1,257 31Australian Renewable Energy Agency(ah) 2 0 -2Commonwealth Scientific and Industrial Research Organisation 4,970 4,971 0Geoscience Australia 602 600 -2IP Australia 1,028 1,054 26National Offshore Petroleum Safety and Environmental Management Authority 135 135 0
Total 10,981 10,767 -213
Average staffing levels #
2014-15 ASL
2015-16 ASL Change
Infrastructure and Regional DevelopmentDepartment of Infrastructure and Regional Development 1,141 1,144 3Australian Maritime Safety Authority 374 375 1Australian Transport Safety Bureau 105 100 -5Civil Aviation Safety Authority 802 833 31Infrastructure Australia(ai) 11 15 4National Capital Authority 58 56 -3National Transport Commission 39 39 0
Total 2,531 2,562 32
Average staffing levels #
Part 2: Staffing of agencies

Part 2: Staffing of agencies
138
2014-15 ASL
2015-16 ASL Change
Prime Minister and Cabinet Department of the Prime Minister and Cabinet(aj) 2,195 2,043 -152Aboriginal Hostels Limited 418 404 -14Anindilyakwa Land Council(ak) 29 34 5Australian National Audit Office 338 345 7Australian Public Service Commission 218 213 -5Central Land Council 227 227 0Indigenous Business Australia 225 236 11Indigenous Land Corporation 265 265 0National Australia Day Council Limited 12 12 -1Northern Land Council 220 230 10Office of National Assessments 132 138 6Office of the Commonwealth Ombudsman(al) 137 149 12Office of the Inspector-General of Intelligence and Security(am) 13 16 3
Office of the Official Secretary to the Governor-General 76 75 -1Outback Stores Pty Ltd 151 151 0Tiwi Land Council(an) 14 16 2Torres Strait Regional Authority 146 150 4Wreck Bay Aboriginal Community Council 32 32 0
Total 4,848 4,735 -113
Average staffing levels #
2014-15 ASL
2015-16 ASL Change
Social ServicesDepartment of Social Services(ao) 3,233 3,561 328Department of Human Services(ap) 30,017 30,461 444Australian Aged Care Quality Agency 249 244 -5Australian Institute of Family Studies 83 82 -1National Disability Insurance Agency(aq) 659 1,220 560
Total 34,241 35,568 1,326
Average staffing levels #

139
2014-15 ASL
2015-16 ASL Change
Treasury Department of the Treasury 815 833 18Australian Bureau of Statistics 2,580 2,670 90Australian Competition and Consumer Commission 715 725 10Australian Office of Financial Management 42 41 -1Australian Prudential Regulation Authority 589 590 1Australian Securities and Investments Commission 1,573 1,569 -4Australian Taxation Office(ar) 18,439 18,482 43Clean Energy Finance Corporation(as) 54 30 -24Commonwealth Grants Commission 36 36 0Corporations and Markets Advisory Committee(at) 2 0 -2Inspector-General of Taxation(au) 14 34 20National Competition Council(av) 2 1 -1
Office of the Auditing and Assurance Standards Board 7 7 0
Office of the Australian Accounting Standards Board 22 22 0Productivity Commission 166 167 1Royal Australian Mint 228 219 -9
Total 25,283 25,427 143
TOTAL (for all general government sector agencies) 244,259 244,182 -76
Average staffing levels #
# Any discrepancies in totals are due to rounding of partial ASL * Not disclosed Table footnotes: (a) This table includes estimates of ASL provided by GGS agencies. ASL figures reflect the average
number of employees receiving salary or wages over the financial year, with adjustments for casual and part time staff to show the full-time equivalent. It also includes uniformed staff and overseas personnel. The ASL figures exclude contractors.
(b) The projected departmental total does not reflect the amalgamation of the Australian Government Solicitor (AGS) into the Attorney-General's Department to ensure accurate comparison at the GGS level between 2014-15 and 2015-16, noting that prior to 1 July 2015 the AGS was outside the GGS. Refer the 2014-15 Mid-Year Economic and Fiscal Outlook measure (Smaller Government – Australian Government Solicitor).
(c) The projected increase reflects the amalgamation of all Commonwealth merits review tribunals, with the exception of the Veterans Review Board, from 1 July 2015.
(d) The projected increase reflects the impact of 2015-16 Budget measures. (e) The projected decrease is due to terminating measures and the implementation of efficiency
measures. (f) The projected increase reflects the implementation of the 2015-16 Budget measures (National Security
– Implementation of Mandatory Telecommunications Data Retention) and (Smaller Government)– Attorney-General's Portfolio).
(g) The projected decrease reflects the implementation of the 2015-16 Budget measure (Digital Transformation Agenda – Portfolio Contributions) and the 2014-15 Mid-Year Economic and Fiscal Outlook measure (Enhancing Online Safety for Children – support).
(h) The projected decrease reflects the implementation of the 2014-15 Budget measure (Australian Broadcasting Corporation and Special Broadcasting Service Corporation – efficiency savings) and the 2014-15 Mid-Year Economic and Fiscal Outlook measure (Australian Broadcasting Corporation and Special Broadcasting Service Corporation – additional efficiency savings).
(i) Telecommunications Universal Service Management Agency will be transitioned into the Department of Communications from 1 July 2015 – refer the 2014-15 Budget measure (Smaller Government – Telecommunications Universal Service Management Agency – abolition and transfer to the Department of Communications).
(j) This does not include the Digital Transformation Office. ASL yet to be determined.
Part 2: Staffing of agencies

Part 2: Staffing of agencies
140
(k) The projected change reflects that the Defence Materiel Organisation will be disbanded and its function reintegrated into the Department of Defence with effect from 1 July 2015 – refer the 2015-16 Budget measure (Smaller Government – Defence Materiel Organisation – reintegration into the Department of Defence).
(l) The projected change reflects lower than expected separation rates and increased recruiting targets. (m) A lower number of reservists will be required due to an expected increase in the average number of
days of military service performed. (n) The projected change reflects that the Defence Materiel Organisation will be reintegrated into the
Department of Defence from 1 July 2015 – refer the 2015-16 Budget measure (Smaller Government – Defence Materiel Organisation – reintegration into the Department of Defence).
(o) The projected decrease reflects the net impact of efficiency measures and the machinery of government changes of 23 December 2014. Staff transferred from the Department of Industry and Science and to the Department of Social Services.
(p) Australian Skills Quality Authority transferred from the Industry and Science portfolio to the Education and Training portfolio as a result of the machinery of government changes of 23 December 2014.
(q) The projected decrease reflects the implementation of the 2014-15 Budget measure (Upholding Quality – Tertiary Education Quality and Standards Agency – revised funding arrangements).
(r) The projected increase reflects improved workforce planning and estimates. (s) The projected increase reflects delays in the recruitment of additional staff. (t) The projected decrease reflects the impact of efficiency measures and declining external revenue
projections. (u) The Government has agreed to extend the operations of the Climate Change Authority until
31 December 2016 – refer the 2015-16 Budget measure (Climate Change Authority – extension). (v) The National Water Commission is to be abolished – refer the 2014-15 Budget measure (Smaller
Government – National Water Commission – cessation). (w) The projected change reflects the proposed merger of ComSuper and Commonwealth Superannuation
Corporation from 1 July 2015 – refer the 2014-15 Budget measure (Smaller Government – additional reductions in the number of Australian Government bodies).
(x) The projected increase reflects the additional resourcing required to support the operations, growth and management of the Future Fund.
(y) The projected increase reflects the implementation of several funded projects, including the Anti-Microbial Resistance AURA project, the Patient Blood management collaborative and the GP Accreditation projects, and the development of the Australian Atlas of Healthcare Variation.
(z) The agency will be abolished – refer the 2014-15 Budget measure (Smaller Government – Australian National Preventive Health Agency – abolish).
(aa) Australian Sports Foundation Limited separated its operational functions from the Australian Sports Commission as a result of the Government's response to the Independent Sport panel, 'Australian Sport: The pathway to success'. The projected increase reflects the implementation of this transition.
(ab) General Practice Education and Training Limited was abolished in April 2015 – refer the 2014-15 Budget measure (Rebuilding general practice education and training to deliver more GPs).
(ac) Health Workforce Australia was abolished – refer the 2014-15 Budget measure (Smaller Government – More Efficient Health Workforce Development).
(ad) The projected decrease reflects the integration of the Private Health Insurance Ombudsman into the Office of the Commonwealth Ombudsman from 1 July 2015 – refer the 2014-15 Budget measure (Smaller Government – additional reductions in the number of Australian Government bodies).
(ae) The projected change reflects the proposed merger of the Department of Immigration and Border Protection and Australian Customs and Border Protection Service from 1 July 2015 – refer the 2014-15 Budget measure (Smaller Government – strengthen and enhance Australia's border protection services).
(af) The projected decrease reflects the amalgamation of all Commonwealth merits review tribunals, with the exception of the Veterans Review Board, from 1 July 2015.
(ag) The projected decrease reflects the net impact of Budget measures and the machinery of government changes of 23 December 2014. Staff transferred to the Department of Education and Training.
(ah) Australian Renewable Energy Agency is to be abolished – refer the 2014-15 Budget measure (Australian Renewable Energy Agency – cessation).
(ai) Infrastructure Australia was established on 1 September 2014 following the amendment of the Infrastructure Australia Act 2008. The projected increase reflects additional resourcing to support statutory functions.
(aj) The projected decrease reflects the completion of the G20 Leaders’ Summit and the impact of the 2014-15 Budget measure (Indigenous Affairs Programmes – rationalisation).
(ak) The projected increase reflects the implementation of the proposed Community Development Unit. (al) The projected increase reflects the implementation of the 2015-16 Budget measure (National Security
– Implementation of Mandatory Telecommunications Data Retention) and the 2014-15 Budget

141
measures (Inspector-General of Taxation – transfer of tax complaints handling) and (Smaller Government – additional reductions in the number of Australian Government bodies).
(am) The projected increase reflects the implementation of the 2014-15 Mid-Year Economic and Fiscal Outlook measure (National Security – additional counter-terrorism funding).
(an) The projected increase reflects the engagement of executive management. (ao) The projected increase reflects the impact of the machinery of government changes of 23 December
2014 (staff transferred from the Department of Education and Training) and implementation of 2015-16 Budget measures.
(ap) The projected increase reflects the implementation of 2015-16 Budget measures. (aq) The projected increase reflects the resourcing required for the expansion of trial sites and the growth in
the number of participants. (ar) The projected marginal increase reflects the implementation of measures announced in the 2014-15
Mid-Year Economic and Fiscal Outlook and the 2015-16 Budget. The ATO resourcing after 2015-16 will provide for additional staff for GST compliance that will be funded by the states and territories, although the employees will be part of the Commonwealth employment arrangements. The Australian Government administers the GST on behalf of the states and territories, which receive GST revenues.
(as) The projected decrease reflects the impact of the abolition of the Clean Energy Finance Corporation from 31 December 2015 – refer the 2013-14 Mid-Year Economic and Fiscal Outlook measure (Repeal of the Carbon Tax – abolishing other measures).
(at) The Corporations and Markets Advisory Committee ceased as an entity as at 19 December 2014. (au) The projected increase reflects the staffing required to establish a complaints handling function – refer
the 2015-16 Budget measure (Inspector-General of Taxation – additional funding). (av) The projected decrease reflects a staff redundancy at the SES level.
Part 2: Staffing of agencies


143
Part 3: Expenses and Net Capital Investment

144
PART 3: EXPENSES AND NET CAPITAL INVESTMENT
This Part reports on departmental expenses and net capital investment, by agency. The data are presented on the same basis as data in Statement 6 of Budget Paper No. 1. Both sets of data are presented on the basis of external accounting and financial reporting standards. These standards present information in terms of accrued expenses1 and accrued revenue.
The main external standards used are:
• the Australian Bureau of Statistics’ (ABS) accrual Government Finance Statistics (GFS) publication, Australian System of Government Finance Statistics: Concepts, Sources and Methods, (cat no. 5514.0), which in turn is based on the International Monetary Fund (IMF) accrual GFS framework; and
• Australian Accounting Standards (AAS), being AASB 1049 Whole of Government and General Government Sector Financial Reporting (AASB 1049) and other applicable Australian Equivalents to International Financial Reporting Standards (AEIFRS).
Machinery of government changes have implications for how information is presented in the tables in Part 3. For example, if an agency was abolished in 2014-15 it will have estimated expenses for 2014-15 reflecting expenditure in part of that year. If an agency was created in 2014-15, it will have estimated expenses for both 2014-15 and 2015-16, and for projected out-years.
1 The tables in Part 3 present financial information on a different basis to the tables in Part 1 —
Agency Financial Resourcing, which presents financial resourcing that is not necessarily expensed within a financial year. Resourcing provided to agencies can be carried over financial years for agency expenses in a future year. Additionally, some accrued expenses are not appropriated for, such as asset writedowns, foreign exchanges losses, fair value losses and depreciation.

Part 3: Expenses and net capital investment
145
3.1 DEPARTMENTAL EXPENSES TABLE
Table 3.1 presents departmental expenses by agency. Departmental expenses reduce the net worth of agencies. It includes expenses controlled by agencies such as payment of wages and purchases of goods and services. It excludes administered expenses — not controlled by agencies — paid on behalf of government such as social benefits and grants to the states. It also excludes capital expenditure which does not reduce net worth.
Table 3.1: Departmental expenses table Estimates Projections
2014-15 2015-16 2016-17 2017-18 2018-19$m $m $m $m $m
AgricultureDepartment of Agriculture 699 709 695 691 687Grains Research and Development Corporation 219 220 218 209 209Total 918 928 914 901 896Attorney-General'sAttorney-General's Department 371 402 374 368 367Australian Federal Police 1,429 1,380 1,338 1,226 1,223Australian Security Intelligence Organisation 458 464 493 507 524Family Court and Federal Circuit Court 206 205 204 203 202High Court of Australia 21 21 21 22 22National Archives of Australia 74 74 87 80 81National Gallery of Australia 46 45 44 45 45National Library of Australia 77 77 73 73 74National Museum of Australia 48 47 46 47 47Total 2,729 2,714 2,681 2,570 2,585CommunicationsAustralian Broadcasting Corporation 1,205 1,201 1,158 1,169 1,176Australian Communications and Media Authority 99 93 92 92 93Department of Communications 98 90 89 90 90Special Broadcasting Service Corporation 382 373 368 379 377Total 1,784 1,758 1,707 1,730 1,736DefenceAustralian War Memorial 69 67 63 60 60Defence Housing Australia 1,211 1,210 1,348 1,398 1,147Defence Materiel Organisation 12,479 806 868 898 922Department of Defence 28,353 30,215 29,820 31,333 32,447Department of Veterans' Affairs 378 358 347 347 343Total 42,490 32,657 32,446 34,037 34,920Education and TrainingAustralian Research Council 23 24 24 24 24Department of Education and Training 343 314 307 306 309Total 366 338 331 330 333

Part 3: Expenses and net capital investment
146
Table 3.1: Departmental expenses table (continued) Estimates Projections
2014-15 2015-16 2016-17 2017-18 2018-19$m $m $m $m $m
EmploymentComcare 618 513 519 532 550Department of Employment 346 338 326 327 326Total 965 851 845 859 877EnvironmentBureau of Meteorology 357 348 349 312 308Clean Energy Regulator 90 88 87 81 78Department of the Environment 583 534 477 465 460Total 1,030 970 913 858 846FinanceAustralian Electoral Commission 137 135 248 130 134Department of Finance 663 600 565 553 558Future Fund Management Agency 45 47 48 48 49Total 845 782 861 732 741Foreign Affairs and TradeAustralian Trade Commission 218 246 241 237 238Department of Foreign Affairs and Trade 1,471 1,536 1,528 1,348 1,460Total 1,689 1,781 1,769 1,585 1,698HealthAustralian Sports Commission 314 283 281 243 239Department of Health and Ageing 689 635 589 584 590National Blood Authority 11 10 10 10 10National Health and Medical Research Council 46 44 41 42 42Total 1,060 973 921 879 881Immigration and Border ProtectionAustralian Customs and Border Protection Service 1,224 0 0 0 0Department of Immigration and Border Protection 1,565 2,847 2,673 2,652 2,698Total 2,788 2,847 2,673 2,652 2,698Industry and ScienceAustralian Nuclear Science and
Technology Organisation 314 317 320 295 301Commonwealth Scientific and Industrial Research Organisation 1,261 1,277 1,298 1,303 1,347
Department of Industry and Science 584 513 492 483 485Total 2,160 2,107 2,110 2,081 2,133Infrastructure and Regional DevelopmentDepartment of Infrastructure and Regional Development 288 269 243 228 218
National Capital Authority 21 21 20 21 21Total 308 290 264 248 239

Part 3: Expenses and net capital investment
147
Table 3.1: Departmental expenses table (continued) Estimates Projections
2014-15 2015-16 2016-17 2017-18 2018-19$m $m $m $m $m
ParliamentDepartment of Parliamentary Services 154 154 153 153 154Total 154 154 153 153 154Prime Minister and CabinetDepartment of the Prime Minister and Cabinet 573 403 391 396 402Indigenous Business Australia 178 201 202 207 212Total 752 604 593 603 614Social ServicesDepartment of Human Services 4,485 4,633 4,462 4,246 4,188Department of Social Services 679 726 678 620 602National Disability Insurance Agency (NDIA)(c) 629 1,079 4,331 11,785 19,202
NDIA administered in nature 467 857 3,655 10,454 17,661NDIA departmental in nature 162 222 676 1,331 1,541
Total 5,794 6,437 9,471 16,651 23,992TreasuryAustralian Bureau of Statistics 395 489 601 410 396Australian Office of Financial Management 11 13 13 13 13Australian Securities and Investments Commission 366 350 339 335 332Australian Taxation Office 3,415 3,442 3,391 3,260 3,189Clean Energy Finance Corporation 25 19 5 4 4Department of the Treasury 196 181 173 174 175Total 4,408 4,493 4,522 4,197 4,108Small agencies 5,023 4,818 4,713 4,689 4,708Whole of government and inter-agency
amounts(a) -14,594 -2,525 -2,492 -2,806 -2,641AEIFRS expenses considered
other economic flows(b) -1,178 -1,055 -1,071 -1,026 -1,181Total departmental expenses 59,490 61,921 64,321 71,922 80,338less: NDIA administered in nature(c) 467 857 3,655 10,454 17,661Total excluding NDIA administered in nature 59,023 61,063 60,666 61,468 62,677 (a) Estimates of inter-agency transactions are included in the whole of government and inter-agency
amounts. The entry for each portfolio does not include eliminations for inter-agency transactions within that portfolio.
(b) Agency estimates are reported on an AEIFRS basis. AEIFRS expenses considered other economic flows include net write-down and impairment of assets and fair value losses.
(c) The National Disability Insurance Agency (NDIA) is a Commonwealth corporate entity and as such is not required to report expenses separately as administered or departmental. However, the NDIA's expenses incurred in the provision of reasonable and necessary care and support to clients (administered in nature) will be significant over the forward estimates compared to other Commonwealth corporate entities. Additionally, these expenses are jointly funded by the Commonwealth and participating states and territories. To provide a better view of these NDIA expenses, Table 3.1 shows the split between expenses that are departmental or administered in nature and provides a total excluding NDIA administered in nature.

Part 3: Expenses and net capital investment
148
3.2 NET CAPITAL INVESTMENT TABLE
Table 3.2 presents net capital investment by agency. Net capital investment represents expenditure by agencies on non-financial assets. It includes expenditure on assets such as defence equipment. It excludes any investment in financial assets such as loans.
Table 3.2: Net capital investment table Estimates Projections
2014-15 2015-16 2016-17 2017-18 2018-19$m $m $m $m $m
AgricultureDepartment of Agriculture 5 14 9 9 -5Grains Research and Development Corporation -21 0 -2 -1 -1Total -15 14 7 7 -6Attorney-General'sAttorney-General's Department -6 13 -19 -13 -5Australian Federal Police 30 10 8 21 13Australian Security Intelligence Organisation 12 1 -5 30 24Family Court and Federal Circuit Court -1 -3 -2 -2 -2High Court of Australia 0 2 0 0 -1National Archives of Australia 5 3 3 3 4National Gallery of Australia 17 17 17 17 17National Library of Australia 5 3 2 0 -3National Museum of Australia 1 3 2 2 2Total 64 50 6 58 47CommunicationsAustralian Broadcasting Corporation 61 24 -33 -29 -37Australian Communications and Media Authority 3 9 -2 -2 -1Department of Communications -11 -12 -10 -8 -8Special Broadcasting Service Corporation 2 2 -2 -2 1Total 54 22 -48 -42 -44DefenceAustralian War Memorial 21 -6 -4 -2 4Defence Housing Australia 190 64 72 49 -122Defence Materiel Organisation 155 0 0 0 0Department of Defence 2,719 3,490 2,557 3,727 4,962Department of Veterans' Affairs -22 -15 -10 -7 -8Total 3,063 3,534 2,615 3,767 4,836Education and TrainingAustralian Research Council 0 0 -1 -3 -3Department of Education and Training 12 2 -9 -9 -10Total 13 2 -10 -13 -13

Part 3: Expenses and net capital investment
149
Table 3.2: Net capital investment table (continued) Estimates Projections
2014-15 2015-16 2016-17 2017-18 2018-19$m $m $m $m $m
EmploymentComcare -5 -3 6 4 -6Department of Employment -3 2 -5 -4 -2Total -9 -1 1 1 -8EnvironmentBureau of Meteorology -18 20 -20 -14 20Clean Energy Regulator -3 -12 -13 -6 -3Department of the Environment 145 119 149 568 305Total 124 127 116 547 322FinanceAustralian Electoral Commission 1 3 -3 0 2Department of Finance 267 -110 42 -4 -16Future Fund Management Agency 0 4 -1 -1 -1Total 268 -102 38 -5 -15Foreign Affairs and TradeAustralian Trade Commission 3 0 1 -1 -4Department of Foreign Affairs and Trade 204 332 80 12 187Total 207 332 81 12 183HealthAustralian Sports Commission -6 -19 0 -7 12Department of Health and Ageing -37 -94 5 -26 -30National Blood Authority 1 0 1 1 1National Health and Medical Research Council 0 2 -2 -2 -2Total -42 -112 4 -35 -19Immigration and Border ProtectionAustralian Customs and Border Protection Service 150 -788 0 0 0Department of Immigration and Border Protection 375 1,157 -61 -114 -163Total 524 369 -61 -114 -163Industry and ScienceAustralian Nuclear Science and
Technology Organisation -6 -2 -2 6 -1Commonwealth Scientific and Industrial Research Organisation 89 -103 -57 -43 -48
Department of Industry and Science -32 -3 -11 -12 -16Total 50 -108 -70 -49 -65Infrastructure and Regional DevelopmentDepartment of Infrastructure and Regional Development -27 -30 -2 -24 -22
National Capital Authority -5 -8 -8 -8 -8Total -32 -38 -10 -32 -30

Part 3: Expenses and net capital investment
150
Table 3.2: Net capital investment table (continued) Estimates Projections
2014-15 2015-16 2016-17 2017-18 2018-19$m $m $m $m $m
ParliamentDepartment of Parliamentary Services 97 -1 -1 -1 0Total 97 -1 -1 -1 0Prime Minister and CabinetDepartment of the Prime Minister and Cabinet -2 -11 -2 -5 -8Indigenous Business Australia 23 -2 2 -1 -1Total 21 -13 1 -6 -9Social ServicesDepartment of Human Services -14 -24 -38 -55 -59Department of Social Services -1 25 16 -16 -10National Disability Insurance Agency (NDIA) 15 44 92 67 -29Total 0 45 69 -4 -97TreasuryAustralian Bureau of Statistics 0 17 28 9 -6Australian Office of Financial Management 1 1 0 0 0Australian Securities and Investments Commission -17 -16 -8 -4 3Australian Taxation Office -11 13 -27 -26 -36Clean Energy Finance Corporation 1 -1 0 0 0Department of the Treasury -4 -1 0 0 0Total -30 13 -8 -21 -38Small agencies 22 14 57 17 -22Whole of government and inter-agency
amounts(a) 197 -848 754 192 175Adjustments to AEIFRS movements in
non-financial assets(b) -1,438 555 658 -681 58Total net capital investment 3,138 3,854 4,198 3,598 5,090 (a) Estimates of inter-agency transactions are included in the whole of government and inter-agency
amounts. The entry for each portfolio does not include eliminations for inter-agency transactions within that portfolio.
(b) Agency estimates are reported on an AEIFRS basis. AEIFRS movements in non-financial assets considered other economic flows include net write-down and impairment of non-financial assets and assets recognised for the first time. They also include Contingency Reserve movements in non-financial assets.

151
APPENDIX A: AGENCY OUTCOME STATEMENTS This appendix provides the Outcomes managed by each agency. It assists understanding Table 1.1.
Outcome statements articulate Government objectives and serve three main purposes:
• to explain the purposes for which annual appropriations are approved by the Parliament for use by Commonwealth entities;
• to provide a basis for budgeting and reporting against the use of funds; and
• to measure and assess agency and programme non-financial performance in contributing to Government policy objectives.
Commonwealth agencies within the GGS have at least one Outcome statement.

152
AG
ENC
Y O
UTC
OM
E ST
ATEM
ENTS
Pa
rliam
ent
Age
ncy
Out
com
e D
escr
iptio
n D
epar
tmen
t of t
he H
ouse
of
Rep
rese
ntat
ives
1
Adv
isor
y an
d ad
min
istra
tive
serv
ices
sup
port
the
Hou
se o
f Rep
rese
ntat
ives
to fu
lfil i
ts re
pres
enta
tive
and
legi
slat
ive
role
.
Dep
artm
ent o
f the
Sen
ate
1 A
dvis
ory
and
adm
inis
trativ
e su
ppor
t ser
vice
s to
ena
ble
the
Sen
ate
and
Sen
ator
s to
fulfi
l the
ir re
pres
enta
tive
and
legi
slat
ive
dutie
s.
Par
liam
enta
ry B
udge
t Offi
ce
1 In
form
the
Par
liam
ent b
y pr
ovid
ing
inde
pend
ent a
nd n
on-p
artis
an a
naly
sis
of th
e bu
dget
cyc
le, f
isca
l pol
icy
and
the
finan
cial
impl
icat
ions
of p
ropo
sals
. D
epar
tmen
t of P
arlia
men
tary
S
ervi
ces
1 S
uppo
rt th
e fu
nctio
ns o
f Par
liam
ent a
nd p
arlia
men
taria
ns th
roug
h th
e pr
ovis
ion
of p
rofe
ssio
nal s
ervi
ces,
adv
ice
and
faci
litie
s an
d m
aint
ain
Aus
tralia
n P
arlia
men
t Hou
se.
A
gric
ultu
re
Age
ncy
Out
com
e D
escr
iptio
n
Dep
artm
ent o
f Agr
icul
ture
1
Mor
e su
stai
nabl
e, p
rodu
ctiv
e, in
tern
atio
nally
com
petit
ive
and
prof
itabl
e A
ustra
lian
agric
ultu
ral,
food
and
fibr
e in
dust
ries
thro
ugh
polic
ies
and
initi
ativ
es th
at p
rom
ote
bette
r res
ourc
e m
anag
emen
t pra
ctic
es, i
nnov
atio
n, s
elf-
relia
nce
and
impr
oved
acc
ess
to in
tern
atio
nal m
arke
ts.
Dep
artm
ent o
f Agr
icul
ture
2
Saf
egua
rd A
ustra
lia’s
ani
mal
and
pla
nt h
ealth
sta
tus
to m
aint
ain
over
seas
mar
kets
and
pro
tect
the
econ
omy
and
envi
ronm
ent f
rom
the
impa
ct o
f exo
tic p
ests
and
dis
ease
s, th
roug
h ris
k as
sess
men
t, in
spec
tion
and
certi
ficat
ion,
an
d th
e im
plem
enta
tion
of e
mer
genc
y re
spon
se a
rran
gem
ents
for A
ustra
lian
agric
ultu
ral,
food
and
fibr
e in
dust
ries.
A
ustra
lian
Gra
pe a
nd W
ine
Aut
horit
y 1
Fost
er a
nd e
nabl
e a
com
petit
ive
Aus
tralia
n w
ine
indu
stry
by
inve
stin
g in
rese
arch
and
dev
elop
men
t, bu
ildin
g m
arke
ts, d
isse
min
atin
g kn
owle
dge
and
ensu
ring
com
plia
nce.
A
ustra
lian
Pes
ticid
es a
nd
Vet
erin
ary
Med
icin
es A
utho
rity
1 P
rote
ctio
n of
the
heal
th a
nd s
afet
y of
peo
ple,
ani
mal
s, th
e en
viro
nmen
t, an
d ag
ricul
tura
l and
live
stoc
k in
dust
ries
thro
ugh
regu
latio
n of
pes
ticid
es a
nd v
eter
inar
y m
edic
ines
.
Cot
ton
Res
earc
h an
d D
evel
opm
ent
Cor
pora
tion
1 A
dopt
ion
of in
nova
tion
that
lead
s to
incr
ease
d pr
oduc
tivity
, com
petit
iven
ess
and
envi
ronm
enta
l sus
tain
abili
ty
thro
ugh
inve
stm
ent i
n re
sear
ch a
nd d
evel
opm
ent t
hat b
enef
its th
e A
ustra
lian
cotto
n in
dust
ry a
nd th
e w
ider
co
mm
unity
.
Fish
erie
s R
esea
rch
and
Dev
elop
men
t Cor
pora
tion
1 In
crea
sed
know
ledg
e th
at fo
ster
s su
stai
nabl
e ec
onom
ic, e
nviro
nmen
tal a
nd s
ocia
l ben
efits
for t
he A
ustra
lian
fishi
ng in
dust
ry; i
nclu
ding
indi
geno
us, r
ecre
atio
nal,
com
mer
cial
and
aqu
acul
ture
sec
tors
, and
the
com
mun
ity;
thro
ugh
inve
stin
g in
rese
arch
, dev
elop
men
t and
ado
ptio
n.

153
Agency outcome statements
Agr
icul
ture
A
genc
y O
utco
me
Des
crip
tion
Gra
ins
Res
earc
h an
d D
evel
opm
ent
Cor
pora
tion
1 N
ew in
form
atio
n an
d pr
oduc
ts th
at e
nhan
ce th
e pr
oduc
tivity
, com
petit
iven
ess
and
envi
ronm
enta
l sus
tain
abili
ty o
f A
ustra
lian
grai
n gr
ower
s an
d be
nefit
the
indu
stry
and
wid
er c
omm
unity
, thr
ough
pla
nnin
g, m
anag
ing
and
impl
emen
ting
inve
stm
ents
in g
rain
s re
sear
ch a
nd d
evel
opm
ent.
Rur
al In
dust
ries
Res
earc
h an
d D
evel
opm
ent C
orpo
ratio
n 1
Incr
ease
d kn
owle
dge
that
fost
ers
sust
aina
ble,
pro
duct
ive
and
prof
itabl
e ne
w a
nd e
xist
ing
rura
l ind
ustri
es a
nd
furth
ers
unde
rsta
ndin
g of
nat
iona
l rur
al is
sues
thro
ugh
rese
arch
and
dev
elop
men
t in
gove
rnm
ent-i
ndus
try
partn
ersh
ip.
Aus
tralia
n Fi
sher
ies
Man
agem
ent
Aut
horit
y 1
Eco
logi
cally
sus
tain
able
and
eco
nom
ical
ly e
ffici
ent C
omm
onw
ealth
fish
erie
s, th
roug
h un
ders
tand
ing
and
mon
itorin
g A
ustra
lia’s
mar
ine
livin
g re
sour
ces
and
regu
latin
g an
d m
onito
ring
com
mer
cial
fish
ing,
incl
udin
g do
mes
tic li
cens
ing
and
dete
rren
ce o
f ille
gal f
orei
gn fi
shin
g.
Atto
rney
-Gen
eral
’s
Age
ncy
Out
com
e D
escr
iptio
n
Atto
rney
-Gen
eral
’s D
epar
tmen
t 1
A ju
st a
nd s
ecur
e so
ciet
y th
roug
h th
e m
aint
enan
ce a
nd im
prov
emen
t of A
ustra
lia’s
law
and
just
ice
fram
ewor
k an
d its
nat
iona
l sec
urity
and
em
erge
ncy
man
agem
ent s
yste
m.
Atto
rney
-Gen
eral
’s D
epar
tmen
t 2
Par
ticip
atio
n in
, and
acc
ess
to, A
ustra
lia’s
arts
and
cul
ture
thro
ugh
deve
lopi
ng a
nd s
uppo
rting
cul
tura
l exp
ress
ion.
A
ustra
lia B
usin
ess
Arts
Fou
ndat
ion
Lim
ited
1 A
cul
tura
l env
ironm
ent t
hat e
nric
hes
the
lives
of a
ll A
ustra
lians
.
Aus
tralia
Cou
ncil
1 S
uppo
rting
Aus
tralia
n ar
tists
and
arts
org
anis
atio
ns to
cre
ate
and
pres
ent e
xcel
lent
art
that
is a
cces
sed
by
audi
ence
s ac
ross
Aus
tralia
and
abr
oad.
A
ustra
lian
Film
, Tel
evis
ion
and
Rad
io S
choo
l 1
Sup
port
the
deve
lopm
ent o
f a p
rofe
ssio
nal s
cree
n ar
ts a
nd b
road
cast
cul
ture
in A
ustra
lia in
clud
ing
thro
ugh
the
prov
isio
n of
spe
cial
ist i
ndus
try-fo
cuse
d ed
ucat
ion,
trai
ning
, and
rese
arch
.
Aus
tralia
n H
uman
Rig
hts
Com
mis
sion
1
An
Aus
tralia
n so
ciet
y in
whi
ch h
uman
righ
ts a
re re
spec
ted,
pro
tect
ed a
nd p
rom
oted
thro
ugh
inde
pend
ent
inve
stig
atio
n an
d re
solu
tion
of c
ompl
aint
s, e
duca
tion
and
rese
arch
to p
rom
ote
and
elim
inat
e di
scrim
inat
ion,
and
m
onito
ring,
and
repo
rting
on
hum
an ri
ghts
. A
ustra
lian
Nat
iona
l Mar
itim
e M
useu
m
1 In
crea
sed
know
ledg
e, a
ppre
ciat
ion
and
enjo
ymen
t of A
ustra
lia’s
mar
itim
e he
ritag
e by
man
agin
g th
e N
atio
nal
Mar
itim
e C
olle
ctio
n an
d st
agin
g pr
ogra
ms,
exh
ibiti
ons
and
even
ts.
Nat
iona
l Film
and
Sou
nd A
rchi
ve o
f A
ustra
lia
1 In
crea
sed
enga
gem
ent w
ith A
ustra
lia’s
aud
iovi
sual
cul
ture
pas
t and
pre
sent
thro
ugh
deve
lopi
ng, p
rese
rvin
g,
mai
ntai
ning
and
pro
mot
ing
the
natio
nal a
udio
visu
al c
olle
ctio
n of
his
toric
and
cul
tura
l sig
nific
ance
.
Nat
iona
l Gal
lery
of A
ustra
lia
1 In
crea
sed
unde
rsta
ndin
g, k
now
ledg
e an
d en
joym
ent o
f the
vis
ual a
rts b
y pr
ovid
ing
acce
ss to
, and
info
rmat
ion
abou
t, w
orks
of a
rt lo
cally
, nat
iona
lly a
nd in
tern
atio
nally
.

154
Agency outcome statements
Atto
rney
-Gen
eral
’s
Age
ncy
Out
com
e D
escr
iptio
n
Nat
iona
l Lib
rary
of A
ustra
lia
1 E
nhan
ced
lear
ning
, kno
wle
dge
crea
tion,
enj
oym
ent a
nd u
nder
stan
ding
of A
ustra
lian
life
and
soci
ety
by p
rovi
ding
ac
cess
to a
nat
iona
l col
lect
ion
of li
brar
y m
ater
ial.
Nat
iona
l Mus
eum
of A
ustra
lia
1 In
crea
sed
awar
enes
s an
d un
ders
tand
ing
of A
ustra
lia’s
his
tory
and
cul
ture
by
man
agin
g th
e N
atio
nal M
useu
m’s
co
llect
ions
and
pro
vidi
ng a
cces
s th
roug
h pu
blic
pro
gram
s an
d ex
hibi
tions
.
Nat
iona
l Por
trait
Gal
lery
of
Aus
tralia
1
Enh
ance
d un
ders
tand
ing
and
appr
ecia
tion
of A
ustra
lian
iden
tity,
cul
ture
and
div
ersi
ty th
roug
h po
rtrai
ture
by
enga
ging
the
publ
ic in
edu
catio
n pr
ogra
ms
and
exhi
bitio
ns, a
nd b
y de
velo
ping
and
pre
serv
ing
the
natio
nal p
ortra
it co
llect
ion.
Scr
een
Aus
tralia
1
Pro
mot
e en
gage
d au
dien
ces
and
supp
ort a
cre
ativ
e, in
nova
tive
and
com
mer
cial
ly s
usta
inab
le s
cree
n in
dust
ry
thro
ugh
the
fund
ing
and
prom
otio
n of
div
erse
Aus
tralia
n sc
reen
pro
duct
.
Adm
inis
trativ
e Ap
peal
s Tr
ibun
al
1 A
cces
s to
a fa
ir, ju
st, e
cono
mic
al, i
nfor
mal
and
qui
ck re
view
mec
hani
sm fo
r app
lican
ts th
roug
h re
view
s of
go
vern
men
t adm
inis
trativ
e de
cisi
ons,
incl
udin
g di
sput
e re
solu
tion
proc
esse
s an
d in
depe
nden
t for
mal
hea
rings
. A
ustra
lian
Com
mis
sion
for L
aw
Enf
orce
men
t Int
egrit
y 1
Inde
pend
ent a
ssur
ance
to th
e A
ustra
lian
Gov
ernm
ent t
hat C
omm
onw
ealth
law
enf
orce
men
t age
ncie
s an
d th
eir
staf
f act
with
inte
grity
by
dete
ctin
g, in
vest
igat
ing
and
prev
entin
g co
rrup
tion.
Aus
tralia
n C
rime
Com
mis
sion
1
Red
uced
ser
ious
and
org
anis
ed c
rime
thre
ats
of m
ost h
arm
to A
ustra
lians
and
the
natio
nal i
nter
est i
nclu
ding
th
roug
h pr
ovid
ing
the
abili
ty to
und
erst
and,
dis
cove
r and
resp
ond
to s
uch
thre
ats.
Aus
tralia
n Fe
dera
l Pol
ice
1 R
educ
ed c
rimin
al a
nd s
ecur
ity th
reat
s to
Aus
tralia
’s c
olle
ctiv
e ec
onom
ic a
nd s
ocie
tal i
nter
ests
thro
ugh
co-o
pera
tive
polic
ing
serv
ices
. A
ustra
lian
Fede
ral P
olic
e 2
A s
afe
and
secu
re e
nviro
nmen
t thr
ough
pol
icin
g ac
tiviti
es o
n be
half
of th
e A
ustra
lian
Cap
ital T
errit
ory
Gov
ernm
ent.
Aus
tralia
n Fi
nanc
ial S
ecur
ity
Aut
horit
y 1
Impr
oved
and
equ
itabl
e fin
anci
al o
utco
mes
for c
onsu
mer
s, b
usin
ess
and
the
com
mun
ity th
roug
h ap
plic
atio
n of
ba
nkru
ptcy
and
per
sona
l pro
perty
sec
uriti
es la
ws,
regu
latio
n of
per
sona
l ins
olve
ncy
prac
titio
ners
, and
trus
tee
serv
ices
.
Aus
tralia
n In
stitu
te o
f Crim
inol
ogy
1 In
form
ed c
rime
and
just
ice
polic
y an
d pr
actic
e in
Aus
tralia
by
unde
rtaki
ng, f
undi
ng a
nd d
isse
min
atin
g po
licy-
rele
vant
rese
arch
of n
atio
nal s
igni
fican
ce; a
nd th
roug
h th
e ge
nera
tion
of a
crim
e an
d ju
stic
e ev
iden
ce b
ase
and
natio
nal k
now
ledg
e ce
ntre
. A
ustra
lian
Law
Ref
orm
C
omm
issi
on
1 In
form
ed g
over
nmen
t dec
isio
ns a
bout
the
deve
lopm
ent,
refo
rm a
nd h
arm
onis
atio
n of
Aus
tralia
n la
ws
and
rela
ted
proc
esse
s th
roug
h re
sear
ch, a
naly
sis,
repo
rts a
nd c
omm
unity
con
sulta
tion
and
educ
atio
n.
Aus
tralia
n S
ecur
ity In
telli
genc
e O
rgan
isat
ion
1 To
pro
tect
Aus
tralia
, its
peo
ple
and
its in
tere
sts
from
thre
ats
to s
ecur
ity th
roug
h in
telli
genc
e co
llect
ion,
ass
essm
ent
and
advi
ce to
Gov
ernm
ent.
Aus
tralia
n Tr
ansa
ctio
n R
epor
ts a
nd
Ana
lysi
s C
entre
1
A fi
nanc
ial e
nviro
nmen
t hos
tile
to m
oney
laun
derin
g, fi
nanc
ing
of te
rror
ism
, maj
or c
rime
and
tax
evas
ion
thro
ugh
indu
stry
regu
latio
n an
d th
e co
llect
ion,
ana
lysi
s an
d di
ssem
inat
ion
of fi
nanc
ial i
ntel
ligen
ce.

155
Agency outcome statements
Atto
rney
-Gen
eral
’s
Age
ncy
Out
com
e D
escr
iptio
n
Crim
Trac
Age
ncy
1 A
cces
s to
info
rmat
ion
that
sup
ports
law
enf
orce
men
t age
ncie
s th
roug
h co
llabo
rativ
e na
tiona
l inf
orm
atio
n sy
stem
s an
d se
rvic
es.
Fam
ily C
ourt
and
Fede
ral C
ircui
t C
ourt
1
Pro
vide
acc
ess
to ju
stic
e fo
r liti
gant
s in
fam
ily a
nd fe
dera
l law
mat
ters
with
in th
e ju
risdi
ctio
n of
the
cour
ts th
roug
h th
e pr
ovis
ion
of ju
dici
al a
nd s
uppo
rt se
rvic
es.
Fede
ral C
ourt
of A
ustra
lia
1 Th
roug
h its
juris
dict
ion,
the
Cou
rt w
ill a
pply
and
uph
old
the
rule
of l
aw to
del
iver
rem
edie
s an
d en
forc
e rig
hts
and
in
so d
oing
, con
tribu
te to
the
soci
al a
nd e
cono
mic
dev
elop
men
t and
wel
l-bei
ng o
f all
Aus
tralia
ns.
Hig
h C
ourt
of A
ustra
lia
1 To
inte
rpre
t and
uph
old
the
Aus
tralia
n C
onst
itutio
n an
d pe
rform
the
func
tions
of t
he u
ltim
ate
appe
llate
Cou
rt of
A
ustra
lia.
Nat
iona
l Arc
hive
s of
Aus
tralia
1
To p
rom
ote
the
crea
tion,
man
agem
ent a
nd p
rese
rvat
ion
of a
uthe
ntic
, rel
iabl
e an
d us
able
Com
mon
wea
lth re
cord
s an
d to
faci
litat
e A
ustra
lians
’ acc
ess
to th
e ar
chiv
al re
sour
ces
of th
e C
omm
onw
ealth
.
Offi
ce o
f Par
liam
enta
ry C
ouns
el
1 A
bod
y of
Com
mon
wea
lth la
ws
and
inst
rum
ents
that
giv
e ef
fect
to in
tend
ed p
olic
y, a
nd th
at a
re c
oher
ent,
read
able
an
d re
adily
acc
essi
ble,
thro
ugh
the
draf
ting
and
publ
icat
ion
of th
ose
law
s an
d in
stru
men
ts.
Offi
ce o
f the
Aus
tralia
n In
form
atio
n C
omm
issi
oner
1
Pro
visi
on o
f pub
lic a
cces
s to
Com
mon
wea
lth G
over
nmen
t inf
orm
atio
n, p
rote
ctio
n of
indi
vidu
als’
per
sona
l in
form
atio
n, a
nd p
erfo
rman
ce o
f inf
orm
atio
n co
mm
issi
oner
, fre
edom
of i
nfor
mat
ion
and
priv
acy
func
tions
. O
ffice
of t
he D
irect
or o
f Pub
lic
Pro
secu
tions
1
Mai
nten
ance
of l
aw a
nd o
rder
for t
he A
ustra
lian
com
mun
ity th
roug
h an
inde
pend
ent a
nd e
thic
al p
rose
cutio
n se
rvic
e in
acc
orda
nce
with
the
Pro
secu
tion
Pol
icy
of th
e C
omm
onw
ealth
.
Old
Par
liam
ent H
ouse
1
An
enha
nced
app
reci
atio
n an
d un
ders
tand
ing
of th
e po
litic
al a
nd s
ocia
l her
itage
of A
ustra
lia fo
r mem
bers
of t
he
publ
ic, t
hrou
gh a
ctiv
ities
incl
udin
g th
e co
nser
vatio
n an
d up
keep
of,
and
the
prov
isio
n of
acc
ess
to, O
ld P
arlia
men
t H
ouse
and
the
deve
lopm
ent o
f its
col
lect
ions
, exh
ibiti
ons
and
educ
atio
nal p
rogr
ams.
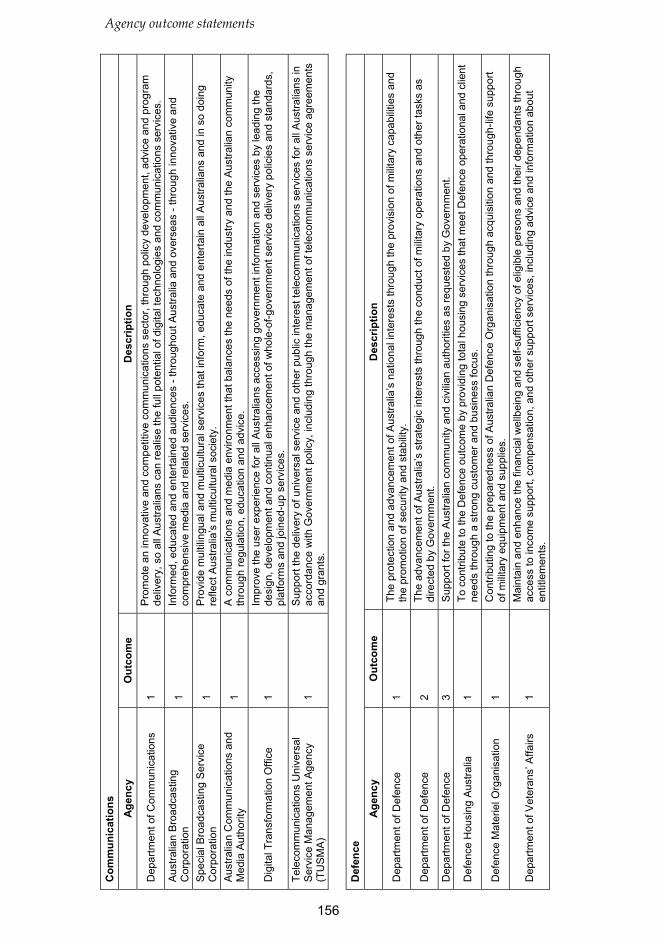
156
Agency outcome statements
Com
mun
icat
ions
A
genc
y O
utco
me
Des
crip
tion
Dep
artm
ent o
f Com
mun
icat
ions
1
Pro
mot
e an
inno
vativ
e an
d co
mpe
titiv
e co
mm
unic
atio
ns s
ecto
r, th
roug
h po
licy
deve
lopm
ent,
advi
ce a
nd p
rogr
am
deliv
ery,
so
all A
ustra
lians
can
real
ise
the
full
pote
ntia
l of d
igita
l tec
hnol
ogie
s an
d co
mm
unic
atio
ns s
ervi
ces.
A
ustra
lian
Bro
adca
stin
g C
orpo
ratio
n 1
Info
rmed
, edu
cate
d an
d en
terta
ined
aud
ienc
es -
thro
ugho
ut A
ustra
lia a
nd o
vers
eas
- thr
ough
inno
vativ
e an
d co
mpr
ehen
sive
med
ia a
nd re
late
d se
rvic
es.
Spe
cial
Bro
adca
stin
g S
ervi
ce
Cor
pora
tion
1 P
rovi
de m
ultil
ingu
al a
nd m
ultic
ultu
ral s
ervi
ces
that
info
rm, e
duca
te a
nd e
nter
tain
all
Aus
tralia
ns a
nd in
so
doin
g re
flect
Aus
tralia
’s m
ultic
ultu
ral s
ocie
ty.
Aus
tralia
n C
omm
unic
atio
ns a
nd
Med
ia A
utho
rity
1 A
com
mun
icat
ions
and
med
ia e
nviro
nmen
t tha
t bal
ance
s th
e ne
eds
of th
e in
dust
ry a
nd th
e A
ustra
lian
com
mun
ity
thro
ugh
regu
latio
n, e
duca
tion
and
advi
ce.
Dig
ital T
rans
form
atio
n O
ffice
1
Impr
ove
the
user
exp
erie
nce
for a
ll A
ustra
lians
acc
essi
ng g
over
nmen
t inf
orm
atio
n an
d se
rvic
es b
y le
adin
g th
e de
sign
, dev
elop
men
t and
con
tinua
l enh
ance
men
t of w
hole
-of-g
over
nmen
t ser
vice
del
iver
y po
licie
s an
d st
anda
rds,
pl
atfo
rms
and
join
ed-u
p se
rvic
es.
Tele
com
mun
icat
ions
Uni
vers
al
Ser
vice
Man
agem
ent A
genc
y (T
US
MA
) 1
Sup
port
the
deliv
ery
of u
nive
rsal
ser
vice
and
oth
er p
ublic
inte
rest
tele
com
mun
icat
ions
ser
vice
s fo
r all
Aus
tralia
ns in
ac
cord
ance
with
Gov
ernm
ent p
olic
y, in
clud
ing
thro
ugh
the
man
agem
ent o
f tel
ecom
mun
icat
ions
ser
vice
agr
eem
ents
an
d gr
ants
.
D
efen
ce
Age
ncy
Out
com
e D
escr
iptio
n
Dep
artm
ent o
f Def
ence
1
The
prot
ectio
n an
d ad
vanc
emen
t of A
ustra
lia’s
nat
iona
l int
eres
ts th
roug
h th
e pr
ovis
ion
of m
ilita
ry c
apab
ilitie
s an
d th
e pr
omot
ion
of s
ecur
ity a
nd s
tabi
lity.
Dep
artm
ent o
f Def
ence
2
The
adva
ncem
ent o
f Aus
tralia
’s s
trate
gic
inte
rest
s th
roug
h th
e co
nduc
t of m
ilita
ry o
pera
tions
and
oth
er ta
sks
as
dire
cted
by
Gov
ernm
ent.
Dep
artm
ent o
f Def
ence
3
Sup
port
for t
he A
ustra
lian
com
mun
ity a
nd c
ivili
an a
utho
ritie
s as
requ
este
d by
Gov
ernm
ent.
Def
ence
Hou
sing
Aus
tralia
1
To c
ontri
bute
to th
e D
efen
ce o
utco
me
by p
rovi
ding
tota
l hou
sing
ser
vice
s th
at m
eet D
efen
ce o
pera
tiona
l and
clie
nt
need
s th
roug
h a
stro
ng c
usto
mer
and
bus
ines
s fo
cus.
Def
ence
Mat
erie
l Org
anis
atio
n 1
Con
tribu
ting
to th
e pr
epar
edne
ss o
f Aus
tralia
n D
efen
ce O
rgan
isat
ion
thro
ugh
acqu
isiti
on a
nd th
roug
h-lif
e su
ppor
t of
mili
tary
equ
ipm
ent a
nd s
uppl
ies.
Dep
artm
ent o
f Vet
eran
s’ A
ffairs
1
Mai
ntai
n an
d en
hanc
e th
e fin
anci
al w
ellb
eing
and
sel
f-suf
ficie
ncy
of e
ligib
le p
erso
ns a
nd th
eir d
epen
dant
s th
roug
h ac
cess
to in
com
e su
ppor
t, co
mpe
nsat
ion,
and
oth
er s
uppo
rt se
rvic
es, i
nclu
ding
adv
ice
and
info
rmat
ion
abou
t en
title
men
ts.
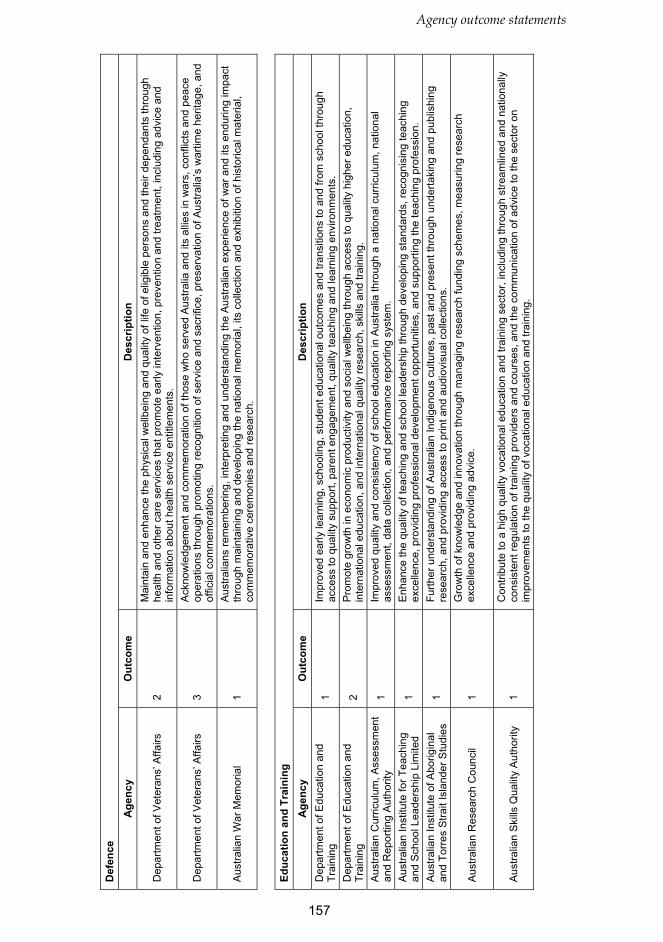
157
Agency outcome statements
Def
ence
A
genc
y O
utco
me
Des
crip
tion
Dep
artm
ent o
f Vet
eran
s’ A
ffairs
2
Mai
ntai
n an
d en
hanc
e th
e ph
ysic
al w
ellb
eing
and
qua
lity
of li
fe o
f elig
ible
per
sons
and
thei
r dep
enda
nts
thro
ugh
heal
th a
nd o
ther
car
e se
rvic
es th
at p
rom
ote
early
inte
rven
tion,
pre
vent
ion
and
treat
men
t, in
clud
ing
advi
ce a
nd
info
rmat
ion
abou
t hea
lth s
ervi
ce e
ntitl
emen
ts.
Dep
artm
ent o
f Vet
eran
s’ A
ffairs
3
Ack
now
ledg
emen
t and
com
mem
orat
ion
of th
ose
who
ser
ved
Aus
tralia
and
its
allie
s in
war
s, c
onfli
cts
and
peac
e op
erat
ions
thro
ugh
prom
otin
g re
cogn
ition
of s
ervi
ce a
nd s
acrif
ice,
pre
serv
atio
n of
Aus
tralia
’s w
artim
e he
ritag
e, a
nd
offic
ial c
omm
emor
atio
ns.
Aus
tralia
n W
ar M
emor
ial
1 A
ustra
lians
rem
embe
ring,
inte
rpre
ting
and
unde
rsta
ndin
g th
e A
ustra
lian
expe
rienc
e of
war
and
its
endu
ring
impa
ct
thro
ugh
mai
ntai
ning
and
dev
elop
ing
the
natio
nal m
emor
ial,
its c
olle
ctio
n an
d ex
hibi
tion
of h
isto
rical
mat
eria
l, co
mm
emor
ativ
e ce
rem
onie
s an
d re
sear
ch.
Ed
ucat
ion
and
Trai
ning
A
genc
y O
utco
me
Des
crip
tion
Dep
artm
ent o
f Edu
catio
n an
d Tr
aini
ng
1 Im
prov
ed e
arly
lear
ning
, sch
oolin
g, s
tude
nt e
duca
tiona
l out
com
es a
nd tr
ansi
tions
to a
nd fr
om s
choo
l thr
ough
ac
cess
to q
ualit
y su
ppor
t, pa
rent
eng
agem
ent,
qual
ity te
achi
ng a
nd le
arni
ng e
nviro
nmen
ts.
Dep
artm
ent o
f Edu
catio
n an
d Tr
aini
ng
2 P
rom
ote
grow
th in
eco
nom
ic p
rodu
ctiv
ity a
nd s
ocia
l wel
lbei
ng th
roug
h ac
cess
to q
ualit
y hi
gher
edu
catio
n,
inte
rnat
iona
l edu
catio
n, a
nd in
tern
atio
nal q
ualit
y re
sear
ch, s
kills
and
trai
ning
. A
ustra
lian
Cur
ricul
um, A
sses
smen
t an
d R
epor
ting
Aut
horit
y 1
Impr
oved
qua
lity
and
cons
iste
ncy
of s
choo
l edu
catio
n in
Aus
tralia
thro
ugh
a na
tiona
l cur
ricul
um, n
atio
nal
asse
ssm
ent,
data
col
lect
ion,
and
per
form
ance
repo
rting
sys
tem
. A
ustra
lian
Inst
itute
for T
each
ing
and
Sch
ool L
eade
rshi
p Li
mite
d 1
Enh
ance
the
qual
ity o
f tea
chin
g an
d sc
hool
lead
ersh
ip th
roug
h de
velo
ping
sta
ndar
ds, r
ecog
nisi
ng te
achi
ng
exce
llenc
e, p
rovi
ding
pro
fess
iona
l dev
elop
men
t opp
ortu
nitie
s, a
nd s
uppo
rting
the
teac
hing
pro
fess
ion.
A
ustra
lian
Inst
itute
of A
borig
inal
an
d To
rres
Stra
it Is
land
er S
tudi
es
1 Fu
rther
und
erst
andi
ng o
f Aus
tralia
n In
dige
nous
cul
ture
s, p
ast a
nd p
rese
nt th
roug
h un
derta
king
and
pub
lishi
ng
rese
arch
, and
pro
vidi
ng a
cces
s to
prin
t and
aud
iovi
sual
col
lect
ions
.
Aus
tralia
n R
esea
rch
Cou
ncil
1 G
row
th o
f kno
wle
dge
and
inno
vatio
n th
roug
h m
anag
ing
rese
arch
fund
ing
sche
mes
, mea
surin
g re
sear
ch
exce
llenc
e an
d pr
ovid
ing
advi
ce.
Aus
tralia
n S
kills
Qua
lity
Aut
horit
y 1
Con
tribu
te to
a h
igh
qual
ity v
ocat
iona
l edu
catio
n an
d tra
inin
g se
ctor
, inc
ludi
ng th
roug
h st
ream
lined
and
nat
iona
lly
cons
iste
nt re
gula
tion
of tr
aini
ng p
rovi
ders
and
cou
rses
, and
the
com
mun
icat
ion
of a
dvic
e to
the
sect
or o
n im
prov
emen
ts to
the
qual
ity o
f voc
atio
nal e
duca
tion
and
train
ing.

158
Agency outcome statements
Educ
atio
n an
d Tr
aini
ng
Age
ncy
Out
com
e D
escr
iptio
n
Terti
ary
Edu
catio
n Q
ualit
y an
d S
tand
ards
Age
ncy
1 C
ontri
bute
to a
hig
h qu
ality
hig
her e
duca
tion
sect
or th
roug
h st
ream
lined
and
nat
iona
lly c
onsi
sten
t hig
her e
duca
tion
regu
lato
ry a
rran
gem
ents
; reg
istra
tion
of h
ighe
r edu
catio
n pr
ovid
ers;
acc
redi
tatio
n of
hig
her e
duca
tion
cour
ses;
and
in
vest
igat
ion,
qua
lity
assu
ranc
e an
d di
ssem
inat
ion
of h
ighe
r edu
catio
n st
anda
rds
and
perfo
rman
ce.
Empl
oym
ent
Age
ncy
Out
com
e D
escr
iptio
n
Dep
artm
ent o
f Em
ploy
men
t 1
Fost
er a
pro
duct
ive
and
com
petit
ive
labo
ur m
arke
t thr
ough
em
ploy
men
t pol
icie
s an
d pr
ogra
mm
es th
at a
ssis
t job
se
eker
s in
to w
ork,
mee
t em
ploy
er n
eeds
and
incr
ease
Aus
tralia
’s w
orkf
orce
par
ticip
atio
n.
Dep
artm
ent o
f Em
ploy
men
t 2
Faci
litat
e jo
bs g
row
th th
roug
h po
licie
s th
at p
rom
ote
fair,
pro
duct
ive
and
safe
wor
kpla
ces.
Com
care
1
Sup
port
parti
cipa
tion
and
prod
uctiv
ity th
roug
h he
alth
y an
d sa
fe w
orkp
lace
s th
at m
inim
ise
the
impa
ct o
f har
m in
w
orkp
lace
s co
vere
d by
Com
care
. A
sbes
tos
Saf
ety
and
Era
dica
tion
Age
ncy
1 A
ssis
t in
the
prev
entio
n of
exp
osur
e to
asb
esto
s fib
res
and
the
elim
inat
ion
of a
sbes
tos-
rela
ted
dise
ase
in A
ustra
lia
thro
ugh
impl
emen
ting
the
Nat
iona
l Stra
tegi
c P
lan
for A
sbes
tos
Aw
aren
ess
and
Man
agem
ent i
n A
ustra
lia.
Fair
Wor
k C
omm
issi
on
1 S
impl
e, fa
ir an
d fle
xibl
e w
orkp
lace
rela
tions
for e
mpl
oyee
s an
d em
ploy
ers
thro
ugh
the
exer
cise
of p
ower
s to
set
an
d va
ry m
inim
um w
ages
and
mod
ern
awar
ds, f
acili
tate
col
lect
ive
barg
aini
ng, a
ppro
ve a
gree
men
ts a
nd d
eal w
ith
disp
utes
.
Offi
ce o
f the
Fai
r Wor
k B
uild
ing
Indu
stry
Insp
ecto
rate
1
Enf
orce
wor
kpla
ce re
latio
ns la
ws
in th
e bu
ildin
g an
d co
nstru
ctio
n in
dust
ry a
nd e
nsur
e co
mpl
ianc
e w
ith th
ose
law
s by
all
parti
cipa
nts
in th
e bu
ildin
g an
d co
nstru
ctio
n in
dust
ry th
roug
h th
e pr
ovis
ion
of e
duca
tion,
ass
ista
nce
and
advi
ce.
Offi
ce o
f the
Fai
r Wor
k O
mbu
dsm
an
1 C
ompl
ianc
e w
ith w
orkp
lace
rela
tions
legi
slat
ion
by e
mpl
oyee
s an
d em
ploy
ers
thro
ugh
advi
ce, e
duca
tion
and
whe
re n
eces
sary
enf
orce
men
t.
Saf
e W
ork
Aus
tralia
1
Hea
lthie
r, sa
fer a
nd m
ore
prod
uctiv
e w
orkp
lace
s th
roug
h im
prov
emen
ts to
Aus
tralia
n w
ork
heal
th a
nd s
afet
y an
d w
orke
rs’ c
ompe
nsat
ion
arra
ngem
ents
. S
eafa
rers
Saf
ety,
Reh
abili
tatio
n an
d C
ompe
nsat
ion
Aut
horit
y 1
Saf
e an
d he
alth
y w
orkp
lace
s, a
nd c
ost e
ffect
ive
and
fair
com
pens
atio
n.
Wor
kpla
ce G
ende
r Equ
ality
A
genc
y 1
Pro
mot
e an
d im
prov
e ge
nder
equ
ality
in A
ustra
lian
wor
kpla
ces
incl
udin
g th
roug
h th
e pr
ovis
ion
of a
dvic
e an
d as
sist
ance
to e
mpl
oyer
s an
d th
e as
sess
men
t and
mea
sure
men
t of w
orkp
lace
gen
der d
ata.
Dep
artm
ent o
f the
Env
ironm
ent
1 C
onse
rve,
pro
tect
and
sus
tain
ably
man
age
Aus
tralia
’s b
iodi
vers
ity, e
cosy
stem
s, e
nviro
nmen
t and
her
itage
thro
ugh
rese
arch
, inf
orm
atio
n m
anag
emen
t, su
ppor
ting
natu
ral r
esou
rce
man
agem
ent,
esta
blis
hing
and
man
agin
g C
omm
onw
ealth
pro
tect
ed a
reas
, and
redu
cing
and
regu
latin
g th
e us
e of
pol
luta
nts
and
haza
rdou
s su
bsta
nces
.

159
Agency outcome statements
Dep
artm
ent o
f the
Env
ironm
ent
2 R
educ
e A
ustra
lia’s
gre
enho
use
gas
emis
sion
s, a
dapt
to th
e im
pact
s of
clim
ate
chan
ge a
nd c
ontri
bute
to th
e ne
gotia
tion
of a
n ef
fect
ive
glob
al s
olut
ion
to c
limat
e ch
ange
, thr
ough
dev
elop
ing
and
impl
emen
ting
a na
tiona
l re
spon
se to
clim
ate
chan
ge.
Dep
artm
ent o
f the
Env
ironm
ent
3 A
dvan
cem
ent o
f Aus
tralia
’s s
trate
gic,
sci
entif
ic, e
nviro
nmen
tal a
nd e
cono
mic
inte
rest
s in
the
Ant
arct
ic b
y pr
otec
ting,
adm
inis
terin
g an
d re
sear
chin
g th
e re
gion
.
Dep
artm
ent o
f the
Env
ironm
ent
4 Im
prov
e th
e he
alth
of r
iver
s an
d fre
shw
ater
eco
syst
ems
and
wat
er u
se e
ffici
ency
thro
ugh
impl
emen
ting
wat
er
refo
rms,
and
ens
urin
g en
hanc
ed s
usta
inab
ility
, effi
cien
cy a
nd p
rodu
ctiv
ity in
the
man
agem
ent a
nd u
se o
f wat
er
reso
urce
s.
Dire
ctor
of N
atio
nal P
arks
1
Con
serv
atio
n an
d ap
prec
iatio
n of
Com
mon
wea
lth re
serv
es th
roug
h th
e pr
ovis
ion
of s
afe
visi
tor a
cces
s, th
e co
ntro
l of
inva
sive
spe
cies
and
wor
king
with
sta
keho
lder
s an
d ne
ighb
ours
.
Mur
ray-
Dar
ling
Bas
in A
utho
rity
1 E
quita
ble
and
sust
aina
ble
use
of th
e M
urra
y-D
arlin
g B
asin
by
gove
rnm
ents
and
the
com
mun
ity in
clud
ing
thro
ugh
deve
lopm
ent a
nd im
plem
enta
tion
of a
Bas
in P
lan,
ope
ratio
n of
the
Riv
er M
urra
y sy
stem
, sha
red
natu
ral r
esou
rce
man
agem
ent p
rogr
ams,
rese
arch
, inf
orm
atio
n an
d ad
vice
.
Syd
ney
Har
bour
Fed
erat
ion
Trus
t 1
Enh
ance
d ap
prec
iatio
n an
d un
ders
tand
ing
of th
e na
tura
l and
cul
tura
l val
ues
of S
ydne
y fo
r all
visi
tors
, thr
ough
the
rem
edia
tion,
con
serv
atio
n an
d ad
aptiv
e re
-use
of,
and
acce
ss to
, Tru
st la
nds
on S
ydne
y H
arbo
ur.
Bur
eau
of M
eteo
rolo
gy
1 In
form
ed s
afet
y, s
ecur
ity a
nd e
cono
mic
dec
isio
ns b
y go
vern
men
ts, i
ndus
try a
nd th
e co
mm
unity
thro
ugh
the
prov
isio
n of
info
rmat
ion,
fore
cast
s, s
ervi
ces
and
rese
arch
rela
ting
to w
eath
er, c
limat
e an
d w
ater
.
Cle
an E
nerg
y R
egul
ator
1
Con
tribu
te to
a re
duct
ion
in A
ustra
lia’s
net
gre
enho
use
gas
emis
sion
s, in
clud
ing
thro
ugh
the
adm
inis
tratio
n of
m
arke
t bas
ed m
echa
nism
s th
at in
cent
ivis
e re
duct
ion
in e
mis
sion
s an
d th
e pr
omot
ion
of a
dditi
onal
rene
wab
le
elec
trici
ty g
ener
atio
n.
Clim
ate
Cha
nge
Aut
horit
y 1
Pro
vide
exp
ert a
dvic
e to
the
Aus
tralia
n G
over
nmen
t on
clim
ate
chan
ge m
itiga
tion
initi
ativ
es, i
nclu
ding
thro
ugh
cond
uctin
g re
gula
r and
spe
cific
ally
com
mis
sion
ed re
view
s an
d th
roug
h un
derta
king
clim
ate
chan
ge re
sear
ch.
Gre
at B
arrie
r Ree
f Mar
ine
Par
k A
utho
rity
1 Th
e lo
ng-te
rm p
rote
ctio
n, e
colo
gica
lly s
usta
inab
le u
se, u
nder
stan
ding
and
enj
oym
ent o
f the
Gre
at B
arrie
r Ree
f for
al
l Aus
tralia
ns a
nd th
e in
tern
atio
nal c
omm
unity
, thr
ough
the
care
and
dev
elop
men
t of t
he M
arin
e P
ark.
Nat
iona
l Wat
er C
omm
issi
on
1 In
form
ed d
ecis
ions
by
gove
rnm
ents
on
natio
nal w
ater
issu
es, a
nd im
prov
ed m
anag
emen
t of A
ustra
lia’s
wat
er
reso
urce
s, th
roug
h ad
voca
cy, f
acili
tatio
n an
d in
depe
nden
t adv
ice.

160
Agency outcome statements
Fina
nce
Age
ncy
Out
com
e D
escr
iptio
n
Dep
artm
ent o
f Fin
ance
1
Sup
port
sust
aina
ble
Aus
tralia
n G
over
nmen
t fin
ance
s th
roug
h pr
ovid
ing
high
qua
lity
polic
y ad
vice
and
ope
ratio
nal
supp
ort t
o th
e go
vern
men
t and
Com
mon
wea
lth e
ntiti
es to
mai
ntai
n ef
fect
ive
and
effic
ient
use
of p
ublic
reso
urce
s.
Dep
artm
ent o
f Fin
ance
2
Sup
port
an e
ffici
ent a
nd h
igh-
perfo
rmin
g pu
blic
sec
tor t
hrou
gh p
rovi
ding
lead
ersh
ip to
Com
mon
wea
lth e
ntiti
es in
on
goin
g im
prov
emen
ts to
pub
lic s
ecto
r gov
erna
nce,
incl
udin
g th
roug
h sy
stem
s, fr
amew
orks
, pol
icy,
adv
ice
and
serv
ice
deliv
ery.
Dep
artm
ent o
f Fin
ance
3
Sup
port
for P
arlia
men
taria
ns a
nd o
ther
s as
requ
ired
by th
e A
ustra
lian
Gov
ernm
ent t
hrou
gh th
e de
liver
y of
, and
ad
vice
on,
ent
itlem
ents
and
targ
eted
ass
ista
nce.
C
omm
onw
ealth
Sup
eran
nuat
ion
Cor
pora
tion
1 R
etire
men
t ben
efits
for p
ast,
pres
ent a
nd fu
ture
Aus
tralia
n go
vern
men
t em
ploy
ees
and
mem
bers
of t
he A
ustra
lian
Def
ence
For
ce th
roug
h in
vest
men
t and
adm
inis
tratio
n of
thei
r sup
eran
nuat
ion
fund
s an
d sc
hem
es.
Aus
tralia
n E
lect
oral
Com
mis
sion
1
Mai
ntai
n an
impa
rtial
and
inde
pend
ent e
lect
oral
sys
tem
for e
ligib
le v
oter
s th
roug
h ac
tive
elec
tora
l rol
l m
anag
emen
t, ef
ficie
nt d
eliv
ery
of p
ollin
g se
rvic
es a
nd ta
rget
ed e
duca
tion
and
publ
ic a
war
enes
s pr
ogra
ms.
Com
Sup
er
1
Pro
vide
acc
ess
to A
ustra
lian
Gov
ernm
ent s
uper
annu
atio
n be
nefit
s an
d in
form
atio
n, th
roug
h de
velo
ping
mem
bers
’ un
ders
tand
ing
of th
e sc
hem
es, p
roce
ssin
g co
ntrib
utio
ns, s
uppo
rting
inve
stm
ent p
roce
sses
, pay
ing
bene
fits
and
man
agin
g m
embe
r det
ails
, for
cur
rent
and
form
er A
ustra
lian
Pub
lic S
erva
nts
and
mem
bers
of t
he A
ustra
lian
Def
ence
For
ce, o
n be
half
of th
e C
omm
onw
ealth
Sup
eran
nuat
ion
Cor
pora
tion.
Futu
re F
und
Man
agem
ent A
genc
y 1
Mak
e pr
ovis
ion
for t
he C
omm
onw
ealth
’s u
nfun
ded
supe
rann
uatio
n lia
bilit
ies,
pay
men
ts fo
r the
cre
atio
n an
d de
velo
pmen
t of i
nfra
stru
ctur
e, a
nd p
aym
ents
from
the
Dis
abili
tyC
are
Aus
tralia
Fun
d by
man
agin
g th
e in
vest
men
t ac
tiviti
es o
f the
Fut
ure
Fund
, Nat
ion-
build
ing
Fund
s an
d D
isab
ility
Car
e A
ustra
lia F
und,
in li
ne w
ith th
e G
over
nmen
t’s in
vest
men
t man
date
s.
Fore
ign
Affa
irs a
nd T
rade
A
genc
y O
utco
me
Des
crip
tion
Dep
artm
ent o
f For
eign
Affa
irs a
nd
Trad
e 1
The
adva
ncem
ent o
f Aus
tralia
’s in
tern
atio
nal s
trate
gic,
sec
urity
and
eco
nom
ic in
tere
sts
incl
udin
g th
roug
h bi
late
ral,
regi
onal
and
mul
tilat
eral
eng
agem
ent o
n A
ustra
lian
Gov
ernm
ent f
orei
gn, t
rade
and
inte
rnat
iona
l dev
elop
men
t po
licy
prio
ritie
s.
Dep
artm
ent o
f For
eign
Affa
irs a
nd
Trad
e 2
The
prot
ectio
n an
d w
elfa
re o
f Aus
tralia
ns a
broa
d an
d ac
cess
to s
ecur
e in
tern
atio
nal t
rave
l doc
umen
tatio
n th
roug
h tim
ely
and
resp
onsi
ve tr
avel
adv
ice
and
cons
ular
and
pas
spor
t ser
vice
s in
Aus
tralia
and
ove
rsea
s.
Dep
artm
ent o
f For
eign
Affa
irs a
nd
Trad
e 3
A s
ecur
e A
ustra
lian
Gov
ernm
ent p
rese
nce
over
seas
thro
ugh
the
prov
isio
n of
sec
urity
ser
vice
s an
d in
form
atio
n an
d co
mm
unic
atio
ns te
chno
logy
infra
stru
ctur
e, a
nd th
e m
anag
emen
t of t
he C
omm
onw
ealth
’s o
vers
eas
owne
d es
tate
.
Tour
ism
Aus
tralia
1
Gro
w d
eman
d an
d fo
ster
a c
ompe
titiv
e an
d su
stai
nabl
e to
uris
m in
dust
ry th
roug
h pa
rtner
ship
mar
ketin
g to
targ
eted
gl
obal
con
sum
ers
in k
ey m
arke
ts.

161
Agency outcome statements
Fore
ign
Affa
irs a
nd T
rade
A
genc
y O
utco
me
Des
crip
tion
Aus
tralia
n C
entre
for I
nter
natio
nal
Agr
icul
tura
l Res
earc
h 1
To a
chie
ve m
ore
prod
uctiv
e an
d su
stai
nabl
e ag
ricul
tura
l sys
tem
s fo
r the
ben
efit
of d
evel
opin
g co
untri
es a
nd
Aus
tralia
thro
ugh
inte
rnat
iona
l agr
icul
tura
l res
earc
h an
d tra
inin
g pa
rtner
ship
s.
Aus
tralia
n S
ecre
t Int
ellig
ence
S
ervi
ce
1 E
nhan
ced
unde
rsta
ndin
g fo
r the
Gov
ernm
ent o
f the
ove
rsea
s en
viro
nmen
t affe
ctin
g A
ustra
lia’s
inte
rest
s th
roug
h th
e pr
ovis
ion
of c
over
t int
ellig
ence
ser
vice
s ab
out t
he c
apab
ilitie
s, in
tent
ions
or a
ctiv
ities
of p
eopl
e or
org
anis
atio
ns
outs
ide
Aus
tralia
.
Aus
tralia
n Tr
ade
Com
mis
sion
1
Con
tribu
te to
Aus
tralia
’s e
cono
mic
pro
sper
ity b
y pr
omot
ing
Aus
tralia
’s e
xpor
t and
oth
er in
tern
atio
nal e
cono
mic
in
tere
sts
thro
ugh
the
prov
isio
n of
info
rmat
ion,
adv
ice
and
serv
ices
to b
usin
ess,
ass
ocia
tions
, ins
titut
ions
and
go
vern
men
t.
Aus
tralia
n Tr
ade
Com
mis
sion
2
The
prot
ectio
n an
d w
elfa
re o
f Aus
tralia
ns a
broa
d th
roug
h tim
ely
and
resp
onsi
ve c
onsu
lar a
nd p
assp
ort s
ervi
ces
in
spec
ific
loca
tions
ove
rsea
s.
Hea
lth
Age
ncy
Out
com
e D
escr
iptio
n
Dep
artm
ent o
f Hea
lth
1 A
redu
ctio
n in
the
inci
denc
e of
pre
vent
able
mor
talit
y an
d m
orbi
dity
, inc
ludi
ng th
roug
h na
tiona
l pub
lic h
ealth
in
itiat
ives
, pro
mot
ion
of h
ealth
y lif
esty
les,
and
app
roac
hes
cove
ring
dise
ase
prev
entio
n, h
ealth
scr
eeni
ng a
nd
imm
unis
atio
n.
Dep
artm
ent o
f Hea
lth
2 A
cces
s to
Pha
rmac
eutic
al S
ervi
ces
— A
cces
s to
cos
t-effe
ctiv
e m
edic
ines
, inc
ludi
ng th
roug
h th
e P
harm
aceu
tical
B
enef
its S
chem
e an
d re
late
d su
bsid
ies,
and
ass
ista
nce
for m
edic
atio
n m
anag
emen
t thr
ough
indu
stry
par
tner
ship
s.
Dep
artm
ent o
f Hea
lth
3 A
cces
s to
cos
t-effe
ctiv
e m
edic
al, d
enta
l, al
lied
heal
th a
nd h
earin
g se
rvic
es, i
nclu
ding
thro
ugh
impl
emen
ting
targ
eted
med
ical
ass
ista
nce
stra
tegi
es, a
nd p
rovi
ding
Med
icar
e su
bsid
ies
for c
linic
ally
rele
vant
ser
vice
s an
d he
arin
g de
vice
s to
elig
ible
peo
ple.
Dep
artm
ent o
f Hea
lth
4 Im
prov
ed a
cces
s to
, and
effi
cien
cy o
f, pu
blic
hos
pita
ls, a
cute
and
sub
acut
e ca
re s
ervi
ces,
incl
udin
g th
roug
h pa
ymen
ts to
sta
te a
nd te
rrito
ry g
over
nmen
ts.
Dep
artm
ent o
f Hea
lth
5 A
cces
s to
com
preh
ensi
ve p
rimar
y an
d m
enta
l hea
lth c
are
serv
ices
, and
hea
lth c
are
serv
ices
for A
borig
inal
and
To
rres
Stra
it Is
land
er p
eopl
es a
nd ru
ral a
nd re
mot
e po
pula
tions
, inc
ludi
ng th
roug
h fir
st p
oint
of c
all s
ervi
ces
for t
he
prev
entio
n, d
iagn
osis
and
trea
tmen
t of i
ll-he
alth
and
ong
oing
ser
vice
s fo
r man
agin
g ch
roni
c di
seas
e.
Dep
artm
ent o
f Hea
lth
6 P
rivat
e H
ealth
— Im
prov
ed c
hoic
e in
hea
lth s
ervi
ces
by s
uppo
rting
affo
rdab
le q
ualit
y pr
ivat
e he
alth
car
e, in
clud
ing
thro
ugh
priv
ate
heal
th in
sura
nce
reba
tes
and
a re
gula
tory
fram
ewor
k.

162
Agency outcome statements
Hea
lth
Age
ncy
Out
com
e D
escr
iptio
n
Dep
artm
ent o
f Hea
lth
7 Im
prov
ed c
apac
ity, q
ualit
y an
d sa
fety
of A
ustra
lia’s
hea
lth c
are
syst
em to
mee
t cur
rent
and
futu
re h
ealth
nee
ds
incl
udin
g th
roug
h in
vest
men
t in
heal
th in
frast
ruct
ure,
regu
latio
n, in
tern
atio
nal h
ealth
pol
icy
enga
gem
ent,
rese
arch
in
to h
ealth
car
e, a
nd s
uppo
rt fo
r blo
od a
nd o
rgan
don
atio
n se
rvic
es.
Dep
artm
ent o
f Hea
lth
8 H
ealth
Wor
kfor
ce C
apac
ity —
Impr
oved
cap
acity
, qua
lity
and
mix
of t
he h
ealth
wor
kfor
ce to
mee
t the
requ
irem
ents
of
hea
lth s
ervi
ces,
incl
udin
g th
roug
h tra
inin
g, re
gist
ratio
n, a
ccre
dita
tion
and
dist
ribut
ion
stra
tegi
es.
Dep
artm
ent o
f Hea
lth
9 B
iose
curit
y an
d E
mer
genc
y R
espo
nse
— P
repa
redn
ess
to re
spon
d to
nat
iona
l hea
lth e
mer
genc
ies
and
risks
, in
clud
ing
thro
ugh
surv
eilla
nce,
regu
latio
n, p
reve
ntio
n, d
etec
tion
and
lead
ersh
ip in
nat
iona
l hea
lth c
oord
inat
ion.
Dep
artm
ent o
f Hea
lth
10
Impr
oved
opp
ortu
nitie
s fo
r com
mun
ity p
artic
ipat
ion
in s
port
and
recr
eatio
n, a
nd e
xcel
lenc
e in
hig
h-pe
rform
ance
at
hlet
es, t
hrou
gh in
itiat
ives
to h
elp
prot
ect t
he in
tegr
ity o
f spo
rt, in
vest
men
t in
spor
t inf
rast
ruct
ure,
coo
rdin
atio
n of
C
omm
onw
ealth
invo
lvem
ent i
n m
ajor
spo
rting
eve
nts,
and
rese
arch
and
inte
rnat
iona
l coo
pera
tion
on s
port
issu
es.
Aus
tralia
n C
omm
issi
on o
n S
afet
y an
d Q
ualit
y in
Hea
lth C
are
1 Im
prov
ed s
afet
y an
d qu
ality
in h
ealth
car
e ac
ross
the
heal
th s
yste
m, i
nclu
ding
thro
ugh
the
deve
lopm
ent,
supp
ort
for i
mpl
emen
tatio
n, a
nd m
onito
ring
of n
atio
nal c
linic
al s
afet
y an
d qu
ality
gui
delin
es a
nd s
tand
ards
. A
ustra
lian
Inst
itute
of H
ealth
and
W
elfa
re
1 A
robu
st e
vide
nce-
base
for t
he h
ealth
, hou
sing
and
com
mun
ity s
ecto
rs, i
nclu
ding
thro
ugh
deve
lopi
ng a
nd
diss
emin
atin
g co
mpa
rabl
e he
alth
and
wel
fare
info
rmat
ion
and
stat
istic
s.
Aus
tralia
n S
ports
Com
mis
sion
1
Impr
oved
par
ticip
atio
n in
stru
ctur
ed p
hysi
cal a
ctiv
ity, p
artic
ular
ly o
rgan
ised
spo
rt, a
t the
com
mun
ity le
vel,
incl
udin
g th
roug
h le
ader
ship
and
targ
eted
com
mun
ity-b
ased
spo
rts a
ctiv
ity.
Aus
tralia
n S
ports
Com
mis
sion
2
Exc
elle
nce
in s
ports
per
form
ance
and
con
tinue
d in
tern
atio
nal s
porti
ng s
ucce
ss, b
y ta
lent
ed a
thle
tes
and
coac
hes,
in
clud
ing
thro
ugh
lead
ersh
ip in
hig
h pe
rform
ance
ath
lete
dev
elop
men
t, an
d ta
rget
ed s
cien
ce a
nd re
sear
ch.
Aus
tralia
n S
ports
Fou
ndat
ion
Lim
ited
1 Im
prov
ed A
ustra
lian
spor
ting
infra
stru
ctur
e th
roug
h as
sist
ing
elig
ible
org
anis
atio
ns to
rais
e fu
nds
for r
egis
tere
d sp
ortin
g pr
ojec
ts.
Food
Sta
ndar
ds A
ustra
lia N
ew
Zeal
and
1 A
saf
e fo
od s
uppl
y an
d w
ell-i
nfor
med
con
sum
ers
in A
ustra
lia a
nd N
ew Z
eala
nd, i
nclu
ding
thro
ugh
the
deve
lopm
ent
of fo
od re
gula
tory
mea
sure
s an
d th
e pr
omot
ion
of th
eir c
onsi
sten
t im
plem
enta
tion,
coo
rdin
atio
n of
food
reca
ll ac
tiviti
es a
nd th
e m
onito
ring
of c
onsu
mer
and
indu
stry
food
pra
ctic
es.
Gen
eral
Pra
ctic
e E
duca
tion
and
Trai
ning
Lim
ited
1 Im
prov
ed q
ualit
y an
d ac
cess
to p
rimar
y ca
re a
cros
s A
ustra
lia, i
nclu
ding
thro
ugh
gene
ral p
ract
ition
er v
ocat
iona
l ed
ucat
ion
and
train
ing
for m
edic
al g
radu
ates
. In
depe
nden
t Hos
pita
l Pric
ing
Aut
horit
y 1
Pro
mot
e im
prov
ed e
ffici
ency
in, a
nd a
cces
s to
, pub
lic h
ospi
tal s
ervi
ces
prim
arily
thro
ugh
setti
ng e
ffici
ent n
atio
nal
pric
es a
nd le
vels
of b
lock
fund
ing
for h
ospi
tal a
ctiv
ities
.
Nat
iona
l Hea
lth P
erfo
rman
ce
Aut
horit
y 1
Con
tribu
te to
tran
spar
ent a
nd a
ccou
ntab
le h
ealth
car
e se
rvic
es in
Aus
tralia
, inc
ludi
ng th
roug
h th
e pr
ovis
ion
of
inde
pend
ent p
erfo
rman
ce m
onito
ring
and
repo
rting
; the
form
ulat
ion
of p
erfo
rman
ce in
dica
tors
; and
con
duct
ing
and
eval
uatin
g re
sear
ch.

163
Agency outcome statements
Hea
lth
Age
ncy
Out
com
e D
escr
iptio
n P
rivat
e H
ealth
Insu
ranc
e A
dmin
istra
tion
Cou
ncil
1 P
rude
ntia
l saf
ety
and
com
petit
iven
ess
of th
e pr
ivat
e he
alth
insu
ranc
e in
dust
ry in
the
inte
rest
s of
con
sum
ers,
in
clud
ing
thro
ugh
effic
ient
indu
stry
regu
latio
n.
Aus
tralia
n N
atio
nal P
reve
ntiv
e H
ealth
Age
ncy
1 A
redu
ctio
n in
the
prev
alen
ce o
f pre
vent
able
dis
ease
, inc
ludi
ng th
roug
h re
sear
ch a
nd e
valu
atio
n to
bui
ld th
e ev
iden
ce b
ase
for f
utur
e ac
tion,
and
by
man
agin
g lif
esty
le e
duca
tion
cam
paig
ns a
nd d
evel
opin
g pa
rtner
ship
s w
ith
non-
gove
rnm
ent s
ecto
rs.
Aus
tralia
n O
rgan
and
Tis
sue
Don
atio
n an
d Tr
ansp
lant
atio
n A
utho
rity
1 Im
prov
ed a
cces
s to
org
an a
nd ti
ssue
tran
spla
nts,
incl
udin
g th
roug
h a
natio
nally
coo
rdin
ated
and
con
sist
ent
appr
oach
and
sys
tem
.
Aus
tralia
n R
adia
tion
Pro
tect
ion
and
Nuc
lear
Saf
ety
Age
ncy
1
Pro
tect
ion
of p
eopl
e an
d th
e en
viro
nmen
t thr
ough
radi
atio
n pr
otec
tion
and
nucl
ear s
afet
y re
sear
ch, p
olic
y, a
dvic
e,
code
s, s
tand
ards
, ser
vice
s an
d re
gula
tion.
A
ustra
lian
Spo
rts A
nti-D
opin
g A
utho
rity
1 P
rote
ctio
n of
the
heal
th o
f ath
lete
s an
d th
e in
tegr
ity o
f Aus
tralia
n sp
ort,
incl
udin
g th
roug
h de
terr
ence
, det
ectio
n an
d en
forc
emen
t to
elim
inat
e do
ping
.
Can
cer A
ustra
lia
1 M
inim
ised
impa
cts
of c
ance
r, in
clud
ing
thro
ugh
natio
nal l
eade
rshi
p in
can
cer c
ontro
l, w
ith ta
rget
ed re
sear
ch,
canc
er s
ervi
ce d
evel
opm
ent,
educ
atio
n an
d co
nsum
er s
uppo
rt.
Nat
iona
l Blo
od A
utho
rity
1
Acc
ess
to a
sec
ure
supp
ly o
f saf
e an
d af
ford
able
blo
od p
rodu
cts,
incl
udin
g th
roug
h na
tiona
l sup
ply
arra
ngem
ents
an
d co
ordi
natio
n of
bes
t pra
ctic
e st
anda
rds
with
in a
gree
d fu
ndin
g po
licie
s un
der t
he n
atio
nal b
lood
arr
ange
men
ts.
Nat
iona
l Hea
lth a
nd M
edic
al
Res
earc
h C
ounc
il 1
Impr
oved
hea
lth a
nd m
edic
al k
now
ledg
e, in
clud
ing
thro
ugh
fund
ing
rese
arch
, tra
nsla
ting
rese
arch
find
ings
into
ev
iden
ce-b
ased
clin
ical
pra
ctic
e, a
dmin
iste
ring
legi
slat
ion
gove
rnin
g re
sear
ch, i
ssui
ng g
uide
lines
and
adv
ice
for
ethi
cs in
hea
lth a
nd th
e pr
omot
ion
of p
ublic
hea
lth.
Nat
iona
l Hea
lth F
undi
ng B
ody
1 P
rovi
de tr
ansp
aren
t and
effi
cien
t adm
inis
tratio
n of
Com
mon
wea
lth, s
tate
and
terr
itory
fund
ing
of th
e A
ustra
lian
publ
ic h
ospi
tal s
yste
m, a
nd s
uppo
rt th
e ob
ligat
ions
and
resp
onsi
bilit
ies
of th
e A
dmin
istra
tor o
f the
Nat
iona
l Hea
lth
Fund
ing
Poo
l.
Nat
iona
l Men
tal H
ealth
C
omm
issi
on
1
Pro
vide
exp
ert a
dvic
e to
the
Aus
tralia
n G
over
nmen
t and
cro
ss-s
ecto
ral l
eade
rshi
p on
the
polic
y, p
rogr
amm
es,
serv
ices
and
sys
tem
s th
at s
uppo
rt m
enta
l hea
lth in
Aus
tralia
, inc
ludi
ng th
roug
h ad
min
iste
ring
the
Ann
ual N
atio
nal
Rep
ort C
ard
on M
enta
l Hea
lth a
nd S
uici
de P
reve
ntio
n, u
nder
taki
ng p
erfo
rman
ce m
onito
ring
and
repo
rting
, and
en
gagi
ng c
onsu
mer
s an
d ca
rers
. P
rivat
e H
ealth
Insu
ranc
e O
mbu
dsm
an
1 P
ublic
con
fiden
ce in
priv
ate
heal
th in
sura
nce,
incl
udin
g th
roug
h co
nsum
er a
nd p
rovi
der c
ompl
aint
and
enq
uiry
in
vest
igat
ions
, and
per
form
ance
mon
itorin
g an
d re
porti
ng.
Pro
fess
iona
l Ser
vice
s R
evie
w
1 A
redu
ctio
n of
the
risks
to p
atie
nts
and
cost
s to
the
Aus
tralia
n G
over
nmen
t of i
napp
ropr
iate
clin
ical
pra
ctic
e,
incl
udin
g th
roug
h in
vest
igat
ing
heal
th s
ervi
ces
clai
med
und
er th
e M
edic
are
and
Pha
rmac
eutic
al b
enef
its s
chem
es.

164
Agency outcome statements
Imm
igra
tion
and
Bor
der P
rote
ctio
n A
genc
y O
utco
me
Des
crip
tion
Dep
artm
ent o
f Im
mig
ratio
n an
d B
orde
r Pro
tect
ion
1 P
rote
ct A
ustra
lia’s
sov
erei
gnty
, sec
urity
and
saf
ety
by m
anag
ing
its b
orde
r, in
clud
ing
thro
ugh
man
agin
g th
e st
ay
and
depa
rture
of a
ll no
n-ci
tizen
s.
Dep
artm
ent o
f Im
mig
ratio
n an
d B
orde
r Pro
tect
ion
2 S
uppo
rt a
pros
pero
us a
nd in
clus
ive
soci
ety,
and
adv
ance
Aus
tralia
’s e
cono
mic
inte
rest
s th
roug
h th
e ef
fect
ive
man
agem
ent o
f the
vis
a an
d ci
tizen
ship
pro
gram
mes
and
pro
visi
on o
f ref
ugee
and
hum
anita
rian
assi
stan
ce.
Dep
artm
ent o
f Im
mig
ratio
n an
d B
orde
r Pro
tect
ion
3 A
dvan
ce A
ustra
lia’s
eco
nom
ic in
tere
sts
thro
ugh
the
faci
litat
ion
of th
e tra
de o
f goo
ds to
and
from
Aus
tralia
and
the
colle
ctio
n of
bor
der r
even
ue.
Aus
tralia
n C
usto
ms
and
Bor
der
Pro
tect
ion
Ser
vice
1
The
prot
ectio
n of
the
safe
ty, s
ecur
ity a
nd c
omm
erci
al in
tere
sts
of A
ustra
lians
thro
ugh
bord
er p
rote
ctio
n de
sign
ed to
su
ppor
t leg
itim
ate
trade
and
trav
el a
nd e
nsur
e co
llect
ion
of b
orde
r rev
enue
and
trad
e st
atis
tics.
M
igra
tion
Rev
iew
Trib
unal
and
R
efug
ee R
evie
w T
ribun
al
1 To
pro
vide
cor
rect
and
pre
fera
ble
deci
sion
s fo
r vis
a ap
plic
ants
and
spo
nsor
s th
roug
h in
depe
nden
t, fa
ir, ju
st,
econ
omic
al, i
nfor
mal
and
qui
ck m
erits
revi
ews
of m
igra
tion
and
refu
gee
deci
sion
s.
Indu
stry
and
Sci
ence
A
genc
y O
utco
me
Des
crip
tion
Dep
artm
ent o
f Ind
ustry
and
S
cien
ce
1 E
nabl
ing
grow
th a
nd p
rodu
ctiv
ity fo
r glo
bally
com
petit
ive
indu
strie
s th
roug
h su
ppor
ting
scie
nce
and
com
mer
cial
isat
ion,
gro
win
g bu
sine
ss in
vest
men
t and
impr
ovin
g bu
sine
ss c
apab
ility
and
stre
amlin
ing
regu
latio
n.
Aus
tralia
n In
stitu
te o
f Mar
ine
Sci
ence
1
Gro
wth
of k
now
ledg
e to
sup
port
prot
ectio
n an
d su
stai
nabl
e de
velo
pmen
t of A
ustra
lia’s
mar
ine
reso
urce
s th
roug
h in
nova
tive
mar
ine
scie
nce
and
tech
nolo
gy.
Aus
tralia
n N
ucle
ar S
cien
ce a
nd
Tech
nolo
gy O
rgan
isat
ion
1 Im
prov
ed k
now
ledg
e, in
nova
tive
capa
city
and
hea
lthca
re th
roug
h nu
clea
r-ba
sed
faci
litie
s, re
sear
ch, t
rain
ing,
pr
oduc
ts, s
ervi
ces
and
advi
ce to
Gov
ernm
ent,
indu
stry
, the
edu
catio
n se
ctor
and
the
Aus
tralia
n po
pula
tion.
Aus
tralia
n R
enew
able
Ene
rgy
Age
ncy
1 S
uppo
rt im
prov
emen
ts in
the
com
petit
iven
ess
of re
new
able
ene
rgy
and
rela
ted
tech
nolo
gies
and
the
supp
ly o
f re
new
able
ene
rgy
by a
dmin
iste
ring
finan
cial
ass
ista
nce,
dev
elop
ing
anal
ysis
and
adv
ice
abou
t, an
d sh
arin
g in
form
atio
n an
d kn
owle
dge
with
rega
rd to
, ren
ewab
le e
nerg
y an
d re
late
d te
chno
logi
es.
Com
mon
wea
lth S
cien
tific
and
In
dust
rial R
esea
rch
Org
anis
atio
n 1
Inno
vativ
e sc
ient
ific
and
tech
nolo
gy s
olut
ions
to n
atio
nal c
halle
nges
and
opp
ortu
nitie
s to
ben
efit
indu
stry
, the
en
viro
nmen
t and
the
com
mun
ity, t
hrou
gh s
cien
tific
rese
arch
and
cap
abili
ty d
evel
opm
ent,
serv
ices
and
adv
ice.
N
atio
nal O
ffsho
re P
etro
leum
S
afet
y an
d E
nviro
nmen
tal
Man
agem
ent A
utho
rity
1 P
rom
ote
and
enfo
rce
the
effe
ctiv
e m
anag
emen
t of r
isks
to th
e w
orkf
orce
, the
env
ironm
ent a
nd th
e st
ruct
ural
in
tegr
ity o
f fac
ilitie
s, w
ells
and
wel
l-rel
ated
equ
ipm
ent o
f the
Aus
tralia
n of
fsho
re p
etro
leum
and
gre
enho
use
gas
stor
age
indu
strie
s th
roug
h re
gula
tory
ove
rsig
ht.
Geo
scie
nce
Aus
tralia
1
Info
rmed
gov
ernm
ent,
indu
stry
and
com
mun
ity d
ecis
ions
on
the
econ
omic
, soc
ial a
nd e
nviro
nmen
tal m
anag
emen
t of
the
natio
n’s
natu
ral r
esou
rces
thro
ugh
enab
ling
acce
ss to
geo
scie
ntifi
c an
d sp
atia
l inf
orm
atio
n.

165
Agency outcome statements
Indu
stry
and
Sci
ence
A
genc
y O
utco
me
Des
crip
tion
IP A
ustra
lia
1 In
crea
sed
inno
vatio
n, in
vest
men
t and
trad
e in
Aus
tralia
, and
by
Aus
tralia
ns o
vers
eas,
thro
ugh
the
adm
inis
tratio
n of
th
e re
gist
rabl
e in
telle
ctua
l pro
perty
righ
ts s
yste
m, p
rom
otin
g pu
blic
aw
aren
ess
and
indu
stry
eng
agem
ent,
and
advi
sing
gov
ernm
ent.
Infr
astr
uctu
re a
nd R
egio
nal D
evel
opm
ent
Age
ncy
Out
com
e D
escr
iptio
n D
epar
tmen
t of I
nfra
stru
ctur
e an
d R
egio
nal D
evel
opm
ent
1 Im
prov
ed in
frast
ruct
ure
acro
ss A
ustra
lia th
roug
h in
vest
men
t in
and
coor
dina
tion
of tr
ansp
ort a
nd o
ther
in
frast
ruct
ure.
D
epar
tmen
t of I
nfra
stru
ctur
e an
d R
egio
nal D
evel
opm
ent
2 A
n ef
ficie
nt, s
usta
inab
le, c
ompe
titiv
e, s
afe
and
secu
re tr
ansp
ort s
yste
m fo
r all
trans
port
user
s th
roug
h re
gula
tion,
fin
anci
al a
ssis
tanc
e an
d sa
fety
inve
stig
atio
ns.
Dep
artm
ent o
f Inf
rast
ruct
ure
and
Reg
iona
l Dev
elop
men
t 3
Stre
ngth
enin
g th
e su
stai
nabi
lity,
cap
acity
and
div
ersi
ty o
f reg
iona
l eco
nom
ies
incl
udin
g th
roug
h fa
cilit
atin
g lo
cal
partn
ersh
ips
betw
een
all l
evel
s of
gov
ernm
ent a
nd lo
cal c
omm
uniti
es; a
nd p
rovi
ding
gra
nts
and
finan
cial
as
sist
ance
. D
epar
tmen
t of I
nfra
stru
ctur
e an
d R
egio
nal D
evel
opm
ent
4 G
ood
gove
rnan
ce in
the
Aus
tralia
n Te
rrito
ries
thro
ugh
the
mai
nten
ance
and
impr
ovem
ent o
f the
ove
rarc
hing
le
gisl
ativ
e fra
mew
ork
for s
elf-g
over
ning
terr
itorie
s, a
nd la
ws
and
serv
ices
for n
on-s
elf-g
over
ning
terr
itorie
s.
Aus
tralia
n M
ariti
me
Saf
ety
Aut
horit
y 1
Min
imis
e th
e ris
k of
shi
ppin
g in
cide
nts
and
pollu
tion
in A
ustra
lian
wat
ers
thro
ugh
ship
saf
ety
and
envi
ronm
ent
prot
ectio
n re
gula
tion
and
serv
ices
and
max
imis
e pe
ople
sav
ed fr
om m
ariti
me
and
avia
tion
inci
dent
s th
roug
h se
arch
and
resc
ue c
oord
inat
ion.
Civ
il Av
iatio
n S
afet
y A
utho
rity
1
Max
imis
e av
iatio
n sa
fety
thro
ugh
a re
gula
tory
regi
me,
det
aile
d te
chni
cal m
ater
ial o
n sa
fety
sta
ndar
ds,
com
preh
ensi
ve a
viat
ion
indu
stry
ove
rsig
ht, r
isk
anal
ysis
, ind
ustry
con
sulta
tion,
edu
catio
n an
d tra
inin
g.
Infra
stru
ctur
e A
ustra
lia
1 Im
prov
e de
cisi
on-m
akin
g on
mat
ters
rela
ting
to in
frast
ruct
ure;
adv
ise
gove
rnm
ents
and
oth
ers
on m
atte
rs re
latin
g to
infra
stru
ctur
e, in
clud
ing
bette
r ass
essm
ent o
f inf
rast
ruct
ure
need
s an
d pr
iorit
isat
ion
of in
frast
ruct
ure
proj
ects
; an
d pr
omot
e be
st p
ract
ice
infra
stru
ctur
e pl
anni
ng, f
inan
cing
, del
iver
y an
d op
erat
ion.
Nat
iona
l Tra
nspo
rt C
omm
issi
on
1 Im
prov
ed tr
ansp
ort p
rodu
ctiv
ity, e
ffici
ency
, saf
ety
and
envi
ronm
enta
l per
form
ance
and
regu
lato
ry e
ffici
ency
in
Aus
tralia
thro
ugh
deve
lopi
ng, m
onito
ring
and
mai
ntai
ning
nat
iona
lly c
onsi
sten
t reg
ulat
ory
and
oper
atio
nal
arra
ngem
ents
rela
ting
to ro
ad, r
ail a
nd in
term
odal
tran
spor
t.
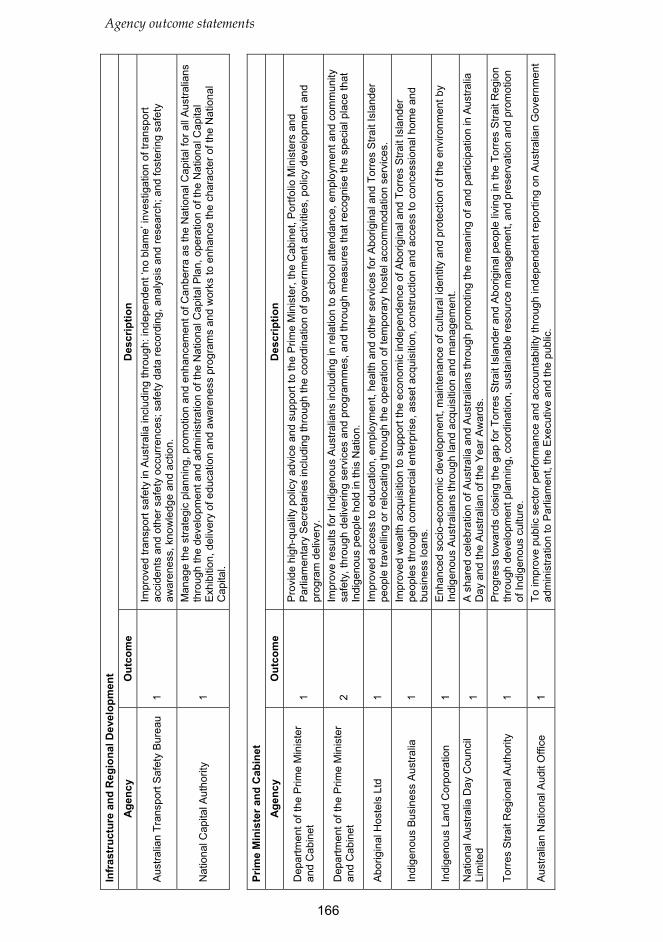
166
Agency outcome statements
Infr
astr
uctu
re a
nd R
egio
nal D
evel
opm
ent
Age
ncy
Out
com
e D
escr
iptio
n
Aus
tralia
n Tr
ansp
ort S
afet
y B
urea
u 1
Impr
oved
tran
spor
t saf
ety
in A
ustra
lia in
clud
ing
thro
ugh:
inde
pend
ent ‘
no b
lam
e’ in
vest
igat
ion
of tr
ansp
ort
acci
dent
s an
d ot
her s
afet
y oc
curr
ence
s; s
afet
y da
ta re
cord
ing,
ana
lysi
s an
d re
sear
ch; a
nd fo
ster
ing
safe
ty
awar
enes
s, k
now
ledg
e an
d ac
tion.
Nat
iona
l Cap
ital A
utho
rity
1
Man
age
the
stra
tegi
c pl
anni
ng, p
rom
otio
n an
d en
hanc
emen
t of C
anbe
rra
as th
e N
atio
nal C
apita
l for
all
Aus
tralia
ns
thro
ugh
the
deve
lopm
ent a
nd a
dmin
istra
tion
of th
e N
atio
nal C
apita
l Pla
n, o
pera
tion
of th
e N
atio
nal C
apita
l E
xhib
ition
, del
iver
y of
edu
catio
n an
d aw
aren
ess
prog
ram
s an
d w
orks
to e
nhan
ce th
e ch
arac
ter o
f the
Nat
iona
l C
apita
l.
Prim
e M
inis
ter a
nd C
abin
et
Age
ncy
Out
com
e D
escr
iptio
n
Dep
artm
ent o
f the
Prim
e M
inis
ter
and
Cab
inet
1
Pro
vide
hig
h-qu
ality
pol
icy
advi
ce a
nd s
uppo
rt to
the
Prim
e M
inis
ter,
the
Cab
inet
, Por
tfolio
Min
iste
rs a
nd
Par
liam
enta
ry S
ecre
tarie
s in
clud
ing
thro
ugh
the
coor
dina
tion
of g
over
nmen
t act
iviti
es, p
olic
y de
velo
pmen
t and
pr
ogra
m d
eliv
ery.
Dep
artm
ent o
f the
Prim
e M
inis
ter
and
Cab
inet
2
Impr
ove
resu
lts fo
r Ind
igen
ous
Aus
tralia
ns in
clud
ing
in re
latio
n to
sch
ool a
ttend
ance
, em
ploy
men
t and
com
mun
ity
safe
ty, t
hrou
gh d
eliv
erin
g se
rvic
es a
nd p
rogr
amm
es, a
nd th
roug
h m
easu
res
that
reco
gnis
e th
e sp
ecia
l pla
ce th
at
Indi
geno
us p
eopl
e ho
ld in
this
Nat
ion.
Abo
rigin
al H
oste
ls L
td
1 Im
prov
ed a
cces
s to
edu
catio
n, e
mpl
oym
ent,
heal
th a
nd o
ther
ser
vice
s fo
r Abo
rigin
al a
nd T
orre
s S
trait
Isla
nder
pe
ople
trav
ellin
g or
relo
catin
g th
roug
h th
e op
erat
ion
of te
mpo
rary
hos
tel a
ccom
mod
atio
n se
rvic
es.
Indi
geno
us B
usin
ess
Aus
tralia
1
Impr
oved
wea
lth a
cqui
sitio
n to
sup
port
the
econ
omic
inde
pend
ence
of A
borig
inal
and
Tor
res
Stra
it Is
land
er
peop
les
thro
ugh
com
mer
cial
ent
erpr
ise,
ass
et a
cqui
sitio
n, c
onst
ruct
ion
and
acce
ss to
con
cess
iona
l hom
e an
d bu
sine
ss lo
ans.
Indi
geno
us L
and
Cor
pora
tion
1
Enh
ance
d so
cio-
econ
omic
dev
elop
men
t, m
aint
enan
ce o
f cul
tura
l ide
ntity
and
pro
tect
ion
of th
e en
viro
nmen
t by
Indi
geno
us A
ustra
lians
thro
ugh
land
acq
uisi
tion
and
man
agem
ent.
Nat
iona
l Aus
tralia
Day
Cou
ncil
Lim
ited
1 A
sha
red
cele
brat
ion
of A
ustra
lia a
nd A
ustra
lians
thro
ugh
prom
otin
g th
e m
eani
ng o
f and
par
ticip
atio
n in
Aus
tralia
D
ay a
nd th
e A
ustra
lian
of th
e Ye
ar A
war
ds.
Torr
es S
trait
Reg
iona
l Aut
horit
y
1 P
rogr
ess
tow
ards
clo
sing
the
gap
for T
orre
s S
trait
Isla
nder
and
Abo
rigin
al p
eopl
e liv
ing
in th
e To
rres
Stra
it R
egio
n th
roug
h de
velo
pmen
t pla
nnin
g, c
oord
inat
ion,
sus
tain
able
reso
urce
man
agem
ent,
and
pres
erva
tion
and
prom
otio
n of
Indi
geno
us c
ultu
re.
Aus
tralia
n N
atio
nal A
udit
Offi
ce
1 To
impr
ove
publ
ic s
ecto
r per
form
ance
and
acc
ount
abili
ty th
roug
h in
depe
nden
t rep
ortin
g on
Aus
tralia
n G
over
nmen
t ad
min
istra
tion
to P
arlia
men
t, th
e E
xecu
tive
and
the
publ
ic.

167
Agency outcome statements
Prim
e M
inis
ter a
nd C
abin
et
Age
ncy
Out
com
e D
escr
iptio
n A
ustra
lian
Pub
lic S
ervi
ce
Com
mis
sion
1
Incr
ease
d aw
aren
ess
and
adop
tion
of b
est p
ract
ice
publ
ic a
dmin
istra
tion
by th
e pu
blic
ser
vice
thro
ugh
lead
ersh
ip,
prom
otio
n, a
dvic
e an
d pr
ofes
sion
al d
evel
opm
ent,
draw
ing
on re
sear
ch a
nd e
valu
atio
n.
Offi
ce o
f Nat
iona
l Ass
essm
ents
1
Adv
ance
men
t of A
ustra
lia’s
nat
iona
l int
eres
ts th
roug
h in
crea
sed
gove
rnm
ent a
war
enes
s of
inte
rnat
iona
l de
velo
pmen
ts a
ffect
ing
Aus
tralia
.
Offi
ce o
f the
Com
mon
wea
lth
Om
buds
man
1
Fair
and
acco
unta
ble
adm
inis
trativ
e ac
tion
by A
ustra
lian
Gov
ernm
ent e
ntiti
es a
nd p
resc
ribed
priv
ate
sect
or
orga
nisa
tions
, by
inve
stig
atin
g co
mpl
aint
s, re
view
ing
adm
inis
trativ
e ac
tion
and
stat
utor
y co
mpl
ianc
e in
spec
tions
an
d re
porti
ng.
Offi
ce o
f the
Insp
ecto
r-G
ener
al o
f In
telli
genc
e an
d S
ecur
ity
1 In
depe
nden
t ass
uran
ce fo
r the
Prim
e M
inis
ter,
seni
or m
inis
ters
and
Par
liam
ent a
s to
whe
ther
Aus
tralia
’s
inte
llige
nce
and
secu
rity
agen
cies
act
lega
lly a
nd w
ith p
ropr
iety
by
insp
ectin
g, in
quiri
ng in
to a
nd re
porti
ng o
n th
eir
activ
ities
.
Offi
ce o
f the
Offi
cial
Sec
reta
ry to
th
e G
over
nor-
Gen
eral
1
The
perfo
rman
ce o
f the
Gov
erno
r-G
ener
al’s
role
is fa
cilit
ated
thro
ugh
orga
nisa
tion
and
man
agem
ent o
f offi
cial
du
ties,
man
agem
ent a
nd m
aint
enan
ce o
f the
offi
cial
hou
seho
ld a
nd p
rope
rty a
nd a
dmin
istra
tion
of th
e A
ustra
lian
Hon
ours
and
Aw
ards
sys
tem
.
Soci
al S
ervi
ces
Age
ncy
Out
com
e D
escr
iptio
n
Dep
artm
ent o
f Soc
ial S
ervi
ces
1 Fi
nanc
ial s
uppo
rt fo
r ind
ivid
uals
and
fam
ilies
who
are
una
ble
to fu
lly s
uppo
rt th
emse
lves
by
prov
idin
g a
sust
aina
ble
paym
ents
and
con
cess
ions
sys
tem
.
Dep
artm
ent o
f Soc
ial S
ervi
ces
2 S
trong
er fa
mili
es a
nd m
ore
resi
lient
com
mun
ities
by
deve
lopi
ng c
ivil
soci
ety
and
by p
rovi
ding
fam
ily a
nd
com
mun
ity s
ervi
ces.
Dep
artm
ent o
f Soc
ial S
ervi
ces
3 Im
prov
ed w
ellb
eing
for o
lder
Aus
tralia
ns th
roug
h ta
rget
ed s
uppo
rt, a
cces
s to
qua
lity
care
and
rela
ted
info
rmat
ion
serv
ices
.
Dep
artm
ent o
f Soc
ial S
ervi
ces
4 In
crea
sed
hous
ing
supp
ly, i
mpr
oved
com
mun
ity h
ousi
ng a
nd a
ssis
ting
indi
vidu
als
expe
rienc
ing
hom
eles
snes
s th
roug
h ta
rget
ed s
uppo
rt an
d se
rvic
es.
Dep
artm
ent o
f Soc
ial S
ervi
ces
5 Im
prov
ed in
depe
nden
ce o
f, an
d pa
rtici
patio
n by
, peo
ple
with
dis
abili
ty, i
nclu
ding
impr
oved
sup
port
for c
arer
s, b
y pr
ovid
ing
targ
eted
sup
port
and
serv
ices
.
Nat
iona
l Dis
abili
ty In
sura
nce
Age
ncy
1 To
impl
emen
t a N
atio
nal D
isab
ility
Insu
ranc
e S
chem
e th
at p
rovi
des
indi
vidu
al c
ontro
l and
cho
ice
in th
e de
liver
y of
re
ason
able
and
nec
essa
ry c
are
and
supp
orts
to im
prov
e th
e in
depe
nden
ce, s
ocia
l and
eco
nom
ic p
artic
ipat
ion
of
elig
ible
peo
ple
with
dis
abili
ty, t
heir
fam
ilies
and
car
ers,
and
ass
ocia
ted
refe
rral
ser
vice
s an
d ac
tiviti
es.

168
Agency outcome statements
Soci
al S
ervi
ces
Age
ncy
Out
com
e D
escr
iptio
n
Aus
tralia
n A
ged
Car
e Q
ualit
y A
genc
y 1
Hig
h-qu
ality
car
e fo
r per
sons
rece
ivin
g A
ustra
lian
Gov
ernm
ent s
ubsi
dise
d re
side
ntia
l age
d ca
re a
nd a
ged
care
in
the
com
mun
ity th
roug
h th
e ac
cred
itatio
n of
resi
dent
ial a
ged
care
ser
vice
s, th
e qu
ality
revi
ew o
f age
d ca
re s
ervi
ces
incl
udin
g se
rvic
es p
rovi
ded
in th
e co
mm
unity
, and
the
prov
isio
n of
info
rmat
ion,
edu
catio
n an
d tra
inin
g to
the
aged
ca
re s
ecto
r. A
ustra
lian
Inst
itute
of F
amily
S
tudi
es
1 In
crea
sed
unde
rsta
ndin
g of
fact
ors
affe
ctin
g ho
w fa
mili
es fu
nctio
n by
con
duct
ing
rese
arch
and
com
mun
icat
ing
findi
ngs
to p
olic
y m
aker
s, s
ervi
ce p
rovi
ders
, and
the
broa
der c
omm
unity
.
Dep
artm
ent o
f Hum
an S
ervi
ces
1 S
uppo
rt in
divi
dual
s, fa
mili
es a
nd c
omm
uniti
es to
ach
ieve
gre
ater
sel
f-suf
ficie
ncy;
thro
ugh
the
deliv
ery
of p
olic
y ad
vice
and
hig
h qu
ality
acc
essi
ble
soci
al, h
ealth
and
chi
ld s
uppo
rt se
rvic
es a
nd o
ther
pay
men
ts; a
nd s
uppo
rt pr
ovid
ers
and
busi
ness
es th
roug
h co
nven
ient
and
effi
cien
t ser
vice
del
iver
y.
Trea
sury
A
genc
y O
utco
me
Des
crip
tion
Dep
artm
ent o
f the
Tre
asur
y 1
Info
rmed
dec
isio
ns o
n th
e de
velo
pmen
t and
impl
emen
tatio
n of
pol
icie
s to
impr
ove
the
wel
lbei
ng o
f the
Aus
tralia
n pe
ople
, inc
ludi
ng b
y ac
hiev
ing
stro
ng, s
usta
inab
le e
cono
mic
gro
wth
, thr
ough
the
prov
isio
n of
adv
ice
to g
over
nmen
t an
d th
e ef
ficie
nt a
dmin
istra
tion
of fe
dera
l fin
anci
al re
latio
ns.
Cle
an E
nerg
y Fi
nanc
e C
orpo
ratio
n 1
Faci
litat
e in
crea
sed
flow
s of
fina
nce
into
Aus
tralia
’s c
lean
ene
rgy
sect
or, a
pply
ing
com
mer
cial
rigo
ur to
inve
stin
g in
re
new
able
ene
rgy,
low
-em
issi
ons
and
ener
gy e
ffici
ency
tech
nolo
gies
, bui
ldin
g in
dust
ry c
apac
ity, a
nd d
isse
min
atin
g in
form
atio
n to
indu
stry
sta
keho
lder
s.
Cor
pora
tions
and
Mar
kets
Adv
isor
y C
omm
ittee
1
Info
rmed
dec
isio
ns b
y G
over
nmen
t on
issu
es re
latin
g to
cor
pora
tions
regu
latio
n an
d fin
anci
al p
rodu
cts,
ser
vice
s an
d m
arke
ts th
roug
h in
depe
nden
t and
exp
ert a
dvic
e.
Aus
tralia
n B
urea
u of
Sta
tistic
s
1 In
form
ed d
ecis
ions
, res
earc
h an
d di
scus
sion
with
in g
over
nmen
ts a
nd th
e co
mm
unity
by
lead
ing
the
colle
ctio
n,
anal
ysis
and
pro
visi
on o
f hig
h qu
ality
, obj
ectiv
e an
d re
leva
nt s
tatis
tical
info
rmat
ion.
Aus
tralia
n C
ompe
titio
n an
d C
onsu
mer
Com
mis
sion
1
Law
ful
com
petit
ion,
con
sum
er p
rote
ctio
n, a
nd r
egul
ated
nat
iona
l in
frast
ruct
ure
mar
kets
and
ser
vice
s th
roug
h re
gula
tion,
in
clud
ing
enfo
rcem
ent,
educ
atio
n,
pric
e m
onito
ring
and
dete
rmin
ing
the
term
s of
ac
cess
to
in
frast
ruct
ure
serv
ices
.
Aus
tralia
n O
ffice
of F
inan
cial
M
anag
emen
t 1
The
adva
ncem
ent o
f mac
roec
onom
ic g
row
th a
nd s
tabi
lity,
and
the
effe
ctiv
e op
erat
ion
of fi
nanc
ial m
arke
ts, t
hrou
gh
issu
ing
debt
, inv
estin
g in
fina
ncia
l ass
ets
and
man
agin
g de
bt, i
nves
tmen
ts a
nd c
ash
for t
he A
ustra
lian
Gov
ernm
ent.
Aus
tralia
n P
rude
ntia
l Reg
ulat
ion
Aut
horit
y 1
Enh
ance
d pu
blic
con
fiden
ce in
Aus
tralia
’s fi
nanc
ial i
nstit
utio
ns th
roug
h a
fram
ewor
k of
pru
dent
ial r
egul
atio
n w
hich
ba
lanc
es fi
nanc
ial s
afet
y an
d ef
ficie
ncy,
com
petit
ion,
con
test
abili
ty a
nd c
ompe
titiv
e ne
utra
lity.

169
Agency outcome statements
Trea
sury
A
genc
y O
utco
me
Des
crip
tion
Aus
tralia
n S
ecur
ities
and
In
vest
men
ts C
omm
issi
on
1 Im
prov
ed c
onfid
ence
in A
ustra
lia’s
fina
ncia
l mar
kets
thro
ugh
prom
otin
g in
form
ed in
vest
ors
and
finan
cial
co
nsum
ers,
faci
litat
ing
fair
and
effic
ient
mar
kets
and
del
iver
ing
effic
ient
regi
stry
sys
tem
s.
Aus
tralia
n Ta
xatio
n O
ffice
1
Con
fiden
ce in
the
adm
inis
tratio
n of
asp
ects
of A
ustra
lia’s
taxa
tion
and
supe
rann
uatio
n sy
stem
s th
roug
h he
lpin
g pe
ople
und
erst
and
thei
r rig
hts
and
oblig
atio
ns, i
mpr
ovin
g ea
se o
f com
plia
nce
and
acce
ss to
ben
efits
, and
m
anag
ing
non-
com
plia
nce
with
the
law
. C
omm
onw
ealth
Gra
nts
Com
mis
sion
1
Info
rmed
Gov
ernm
ent d
ecis
ions
on
fisca
l equ
alis
atio
n be
twee
n th
e S
tate
s an
d Te
rrito
ries
thro
ugh
advi
ce a
nd
reco
mm
enda
tions
on
the
dist
ribut
ion
of G
ST
reve
nue
and
heal
th c
are
gran
ts.
Insp
ecto
r-G
ener
al o
f Tax
atio
n 1
Impr
oved
tax
adm
inis
tratio
n th
roug
h co
mm
unity
con
sulta
tion,
revi
ew, a
nd in
depe
nden
t adv
ice
to G
over
nmen
t.
Nat
iona
l Com
petit
ion
Cou
ncil
1 C
ompe
titio
n in
mar
kets
that
are
dep
ende
nt o
n ac
cess
to n
atio
nally
sig
nific
ant m
onop
oly
infra
stru
ctur
e, th
roug
h re
com
men
datio
ns a
nd d
ecis
ions
pro
mot
ing
the
effic
ient
ope
ratio
n of
, use
of a
nd in
vest
men
t in
infra
stru
ctur
e.
Offi
ce o
f the
Aud
iting
and
A
ssur
ance
Sta
ndar
ds B
oard
1
The
form
ulat
ion
and
mak
ing
of a
uditi
ng a
nd a
ssur
ance
sta
ndar
ds th
at a
re u
sed
by a
udito
rs o
f Aus
tralia
n en
tity
finan
cial
repo
rts o
r for
oth
er a
uditi
ng a
nd a
ssur
ance
eng
agem
ents
. O
ffice
of t
he A
ustra
lian
Acc
ount
ing
Sta
ndar
ds B
oard
1
The
form
ulat
ion
and
mak
ing
of a
ccou
ntin
g st
anda
rds
that
are
use
d by
Aus
tralia
n en
titie
s to
pre
pare
fina
ncia
l re
ports
and
ena
ble
user
s of
thes
e re
ports
to m
ake
info
rmed
dec
isio
ns.
Pro
duct
ivity
Com
mis
sion
1
Wel
l-inf
orm
ed p
olic
y de
cisi
on-m
akin
g an
d pu
blic
und
erst
andi
ng o
n m
atte
rs re
latin
g to
Aus
tralia
’s p
rodu
ctiv
ity a
nd
livin
g st
anda
rds,
bas
ed o
n in
depe
nden
t and
tran
spar
ent a
naly
sis
from
a c
omm
unity
-wid
e pe
rspe
ctiv
e.
Roy
al A
ustra
lian
Min
t 1
The
coin
age
need
s of
the
Aus
tralia
n ec
onom
y, c
olle
ctor
s an
d fo
reig
n co
untri
es a
re m
et th
roug
h th
e m
anuf
actu
re
and
sale
of c
ircul
atin
g co
ins,
col
lect
or c
oins
and
oth
er m
inte
d lik
e pr
oduc
ts.