Embed Size (px)
DESCRIPTION
Estadistica
Citation preview
Cardiorespiratory and autonomic responses to 30-15
Intermittent Fitness Test in team sport players
Running title: Cardiorespiratory and autonomic responses to 30-15IFT
M. Buchheit1, H. Al Haddad1, G. P. Millet2, P.M. Lepretre3, M. Newton3, and S. Ahmaidi1
1 Laboratoire de Recherche, EA 3300 «APS et conduites motrices : « Adaptations
Réadaptations », Faculté des Sciences du Sport d’Amiens, Université de Picardie Jules Verne,
80025 Amiens – France.
2Aspire, Academy for Sports Excellence, PO Box 2287, Doha, Qatar.
3 Laboratoire de Biomécanique et Physiologie, Institut National du Sport et de l'Education
Physique, 11, Av. du Tremblay, 75012 Paris – France.
4 School of Exercise, Biomedical and Health Sciences, Edith Cowan University, Joondalup,
WA, Australia
Address for correspondence: Martin Buchheit, PhD Laboratoire de Recherche Adaptations Réadaptations (APS et conduites motrices) Faculté des Sciences du Sport Allée P. GROUSSET 80025 AMIENS CEDEX 1 France Tel : +333.22.82.89.36 Fax : +333.22.82.79.10 Email :[email protected]
Abstract
Objective: The 30-15 Intermittent Fitness Test (30-15IFT) is as an attractive alternative to
classic continuous incremental field tests for defining a reference velocity for interval training
prescription in team sport athletes. The aim of the present study was to compare
cardiorespiratory and autonomic responses to 30-15IFT with those observed during a standard
continuous test (CT).
Methods: In 20 team-sport players (20.9 ± 2.2 y), cardiopulmonary parameters were
measured during exercise and for 10 min after both tests. Final running velocity, peak lactate
([La]peak) and rating of perceived exertion (RPE) were also measured. Parasympathetic
function was assessed during the post-exercise recovery phase via heart rate (HR) recovery
time constant (HRRτ) and HR variability (HRV) vagal-related indices.
Results: At exhaustion, no difference was observed in mean oxygen uptake (V O2),
respiratory exchange ratio, HR or RPE between 30-15IFT and CT. In contrast, 30-15IFT led to
significantly higher minute ventilation, [La]peak, and final velocity than CT (p<0.05 for all
parameters). Regarding ventilatory thresholds (VThs), all cardiorespiratory measurements
were similar and well correlated between the two tests. Parasympathetic function was lower
after 30-15IFT than after CT, as indicated by significantly longer HHRτ (81.9 ± 18.2 vs. 60.5 ±
19.5, for 30-15IFT and CT, respectively, p<0.001) and lower HRV vagal-related indices (i.e.,
the root mean square of successive R-R intervals differences (rMSSD): 4.1 ± 2.4 and 7.0 ± 4.9
ms, p<0.05).
&
Conclusions: The 30-15IFT is accurate for assessing VThs and V O2 peak, but alters post-
exercise parasympathetic function more than a continuous incremental protocol.
&
Keywords: intermittent exercise, aerobic capacity, field test, heart rate variability,
parasympathetic reactivation.
Introduction
High intensity aerobic training performed in team sports often include intermittent and
shuttle runs in order to reproduce running patterns specific to competition.[1, 2] The 30-15
Intermittent Fitness Test (30-15IFT),[3] a graded intermittent and shuttle field test, leads to a
maximal running velocity (VIFT) that is determined through an effort involving physiological
variables similar to those solicited during shuttle interval training sessions (i.e. ability to
change direction and both aerobic and anaerobic energy systems). The use of VIFT has been
shown to be more accurate than individual vV O2max (defined as the lowest running velocity
that elicits V O2max during a continuous graded test [4]) for getting players with different
physiological profiles to a similar level of cardiorespiratory demand, and thus for
standardizing training content at a team level.[3] Nevertheless, the physiological responses
induced by the 30-15IFT have not been compared to a gold-standard continuous incremental
test (CT) [5] for identifying submaximal (i.e.; ventilatory thresholds) and maximal
cardiorespiratory variables. To date, it has only been shown that VIFT is very well related to
maximal oxygen uptake determined in the laboratory and that maximal heart rate (HR) [3] is
achieved.
&
&
Assessment of post-exercise autonomic regulation has recently emerged as an original
way to estimate the short-term physiological strain of exercise, since it can indirectly provide
insight into perturbation of body regulatory processes and homeostasis.[6, 7] Post-exercise
autonomic assessment can also transiently highlight increased cardiovascular risk [8-10] in
specific populations (i.e.; sedentary individuals engaging in rehabilitation programs). Post-
exercise parasympathetic activity has never been described after any graded intermittent
exercise. Nevertheless, since supramaximal and intermittent exercise has been shown to
strongly impair post-exercise autonomic function [6] and body’s homeostasis,[11] it could be
expected that the 30-15IFT, leading to higher running velocities than vV O2max,[3] would
have a more depressive effect on post-exercise autonomic function that CT.
&
The aim of the present study was thus to compare cardiorespiratory and autonomic
responses between the 30-15IFT and a graded continuous field test.
METHODS
Subjects. Twenty moderately-trained healthy male team-sport players (20.9 ± 2.2 yr, 179.8 ±
5.8 cm and 76.4 ± 9.4 kg, playing soccer, handball or basketball and training 4.9 ± 1.9
hrs.week-1) participated in the study, which conformed to the recommendations of the
Declaration of Helsinki and was approved by the local institutional research ethics committee.
Incremental procedures
All subjects were familiar with field exercise evaluation and were tested on two separate days
on a synthetic indoor track (temperature ~22 °C). The 30-15IFT consists of 30-s shuttle runs
interspersed with 15-s passive recovery periods. Velocity was set at 8 km.h-1 for the first 30-s
run and speed was increased by 0.5 km.h-1 every 30-s stage thereafter.[3] Subjects were
required to run back and forth between two lines set 40 m apart at a pace which was governed
by a pre-recorded beep. During the 15-s recovery period, subjects walked in a forward
direction towards the closest line (at either the middle or end of the running area, depending
on where their previous run had stopped) and commenced the next run stage from this line.
The graded continuous field test was adapted from the extensively used test of Léger at al.
:[12] initial speed of 10 km.h-1 increased by 0.5 km.h-1 per 1-min stage with subjects running
at a pace which was governed by a pre-recorded beep.
The velocity (km.h-1) attained during the last completed stages of each test was determined as
the subject’s VIFT and VCT for 30-15IFT and CT, respectively.
Physiological measurements.
Respiratory gas exchange and HR were measured using an automated breath-by-breath
system (K4b2, Cosmed, Rome, Italy [13]), which was calibrated as recommended by the
manufacturer before each test. Cardiorespiratory data (oxygen uptake (V O2), carbon dioxide
production (V CO2), breathing frequency (BF), tidal volume (VT), minute ventilation (V E),
respiratory exchange ratio (RER), O2 pulse, end tidal volume PO2 (PETO2 %), PCO2 (PETCO2
%)) and HR were filtered and averaged on a 5-s basis. For both tests, peak oxygen uptake
(V O2peak) was arbitrarily defined as the highest V O2 values attained in one 20-sec period.
CO2, BF, VT, V E, RER at V O2peak were retained as V CO2peak, BFpeak, VTpeak,
Epeak, RERpeak and O2pulse peak. A HR peak attained coincident with the maximal
predicted value, [La]peak > 8 mmol.l-l , respiratory exchange ratio (RER) > 1.1 and volitional
fatigue were required to confirm the maximal nature of the test. The velocity associated with
O2 peak (vV O2peak30-15IFT and vV O2peakCT) were the lowest running velocities which
elicited a V O2 value equal to V O2peak during the 30-15IFT and CT, respectively [4]. Three
minutes after the end of each exercise set a fingertip blood sample (5 μL) was collected in the
20 subjects ([La]bpeak, Lactate Pro, Arkray Inc, Kyoto, Japan). Additionally, every four
stages during the 30-15ITF (i.e., every 2 km.h-1, during the 15-s recovery periods), lactate
profile was determined in 11 of the 20 subjects. The accuracy of the analyzer was checked
before each test using standards.
&
& &
&
V&
V&
V&
&
& & &
& &
& &
Ventilatory thresholds assessment.
Cardiorespiratory data were averaged at each stage level. For the 30-15IFT, data from the 30-s
exercise and the successive 15-s recovery periods were averaged to produce a single 45-s
stage value. As described by Whipp et al.,[14] the first ventilatory threshold (VTh1) was
established as the velocity at which V E /V O2 and PETO2 began to increase without a
simultaneous increase in PETCO2. The second ventilatory threshold (VTh2 [also called RCP,
respiratory compensation point]), was determined as the velocity corresponding to the first
& &
decrease in PETCO2, with a corresponding increase in V E /V CO2 following the steady-state
phase after the VTh1. All thresholds measurements were made by visual inspection of graphs
of time plotted against each relevant respiratory variable measured in the testing. The visual
inspections were made by two experienced exercise physiologists and the results were
compared and then averaged. The difference in the values determined by the two assessors
was < 2%.
& &
Beat-to-beat HR recordings
Beat-to-beat HR data were additionally recorded with a Polar S810 HR monitor (Polar
Electro, Kempele, Finland).[15] All R-R interval series were extracted (Polar Protrainer 5.1,
Polar Electro, Kempele, Finland) and occasional ectopic beats were visually identified and
manually replaced with interpolated adjacent R-R interval values. As previously described,[7]
parasympathetic function was assessed during the 10 min period following both CT and 30-
15IFT, by 1) analysing the first 30 s (from the 10th to the 40th s) of HR recovery (HRR) via
semi-logarithmic regression analysis (T30, short-term time constant), 2) by taking the
complete time constant of the HR decay obtained by fitting the 10-min post-exercise HR
recovery into a first-order exponential decay curve (HRRτ), 3) by calculating a time-varying
vagal-related index (the root-mean-square difference of successive normal R-R intervals on
subsequent 30-s non overlapped segments, rMSSD30s), or 4) by analysing usual stationary
vagal-related HRV indices,[7] calculated as the last 5 min of the 10-min recovery period in
the seated position. Mean HR (HR5-10min), standard deviation of normal R-R intervals
(SDNN5-10min), RMSSD5-10min, power densities in the low (LF, 0.04-0.15 Hz) and the high
frequency band (HF, > 0.15-0.50 Hz), LnHF5-10min (natural-log of HF) and the normalized LF
power (LFnu5-10min, calculated as the LF/(LF+HF) ratios) were computed.[16] All indices
were considered to provide insight into parasympathetic activity, except LFnu5-10min, which
was used as a relative index of the sympathetic component of sympathovagal balance.[16]
Statistical analyses
Descriptive data are presented as mean and standard deviation (±SD). Normality of the
distribution was verified via the Shapiro Wilk’s test. Student T-test for paired data, Pearson’s
coefficient correlation (r) calculated from linear regressions and Bland & Altman limits of
agreement [17] were used to compare ventilatory measures, [La]bpeak and RPE measures
between 30-15IFT and CT at the three intensities (VTh1, VTh2 and O2peak). Bland & Altman
plots were presented to illustrate the intra-individual agreement in V O2peak and HRpeak for
the 30-15IFT and CT [17]. HR(V)-derived indices and running velocity were compared with
paired-student T-test and Pearson’s coefficient correlation. For time-varying rMSSD30s, a 2-
factor repeated measures ANOVA with one between factor (test type; 30-15IFT versus CT)
and a within factors (time; 19 repeated measures during the recovery) was used to examine
the main effects and/or interactions of test type and time during recovery. For each ANOVA,
if a significant interaction was identified, a Tukey‘s post hoc test was used to further delineate
differences between training type, period and time. The level of significance was set at P <
0.05. Statistical analyses were carried out using Minitab 14 Software (Minitab Inc, Paris,
France).
V&
&
Results
Velocities at exhaustion, and first and second ventilatory thresholds were all higher
during 30-15IFT compared to CT : 19.4 ± 0.9 vs. 15.4 ± 1.1 km.h-1 (p<0.001) for VIFT and VCT,
respectively; 18.3 ± 1.3 vs. 14.1 ± 1.4 km.h-1 (p<0.001) for VIFTV O2peak and VCTV O2peak; 16.9
± 1.3 vs. 13.6 ± 1.3 km.h-1 (p<0.001) for 30-15IFT and CT at VTh1; and 13.1 ± 1.2 vs. 10.1 ±
0.6km.h-1 (p<0.001) for 30-15IFT and CT at VTh2, respectively.
& &
Mean maximal cardiorespiratory responses of both tests are presented in Table 1.
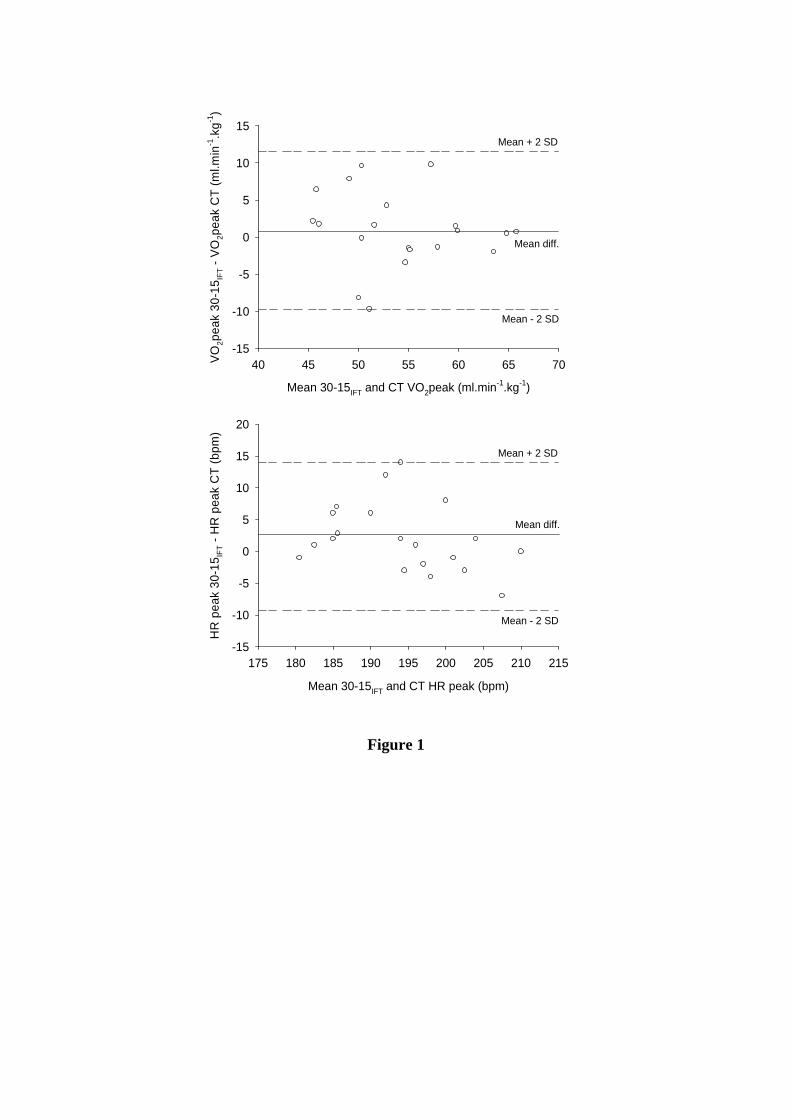
Figure 1 illustrates the Bland & Altman plot for V O2peak and HR. All values remained in the
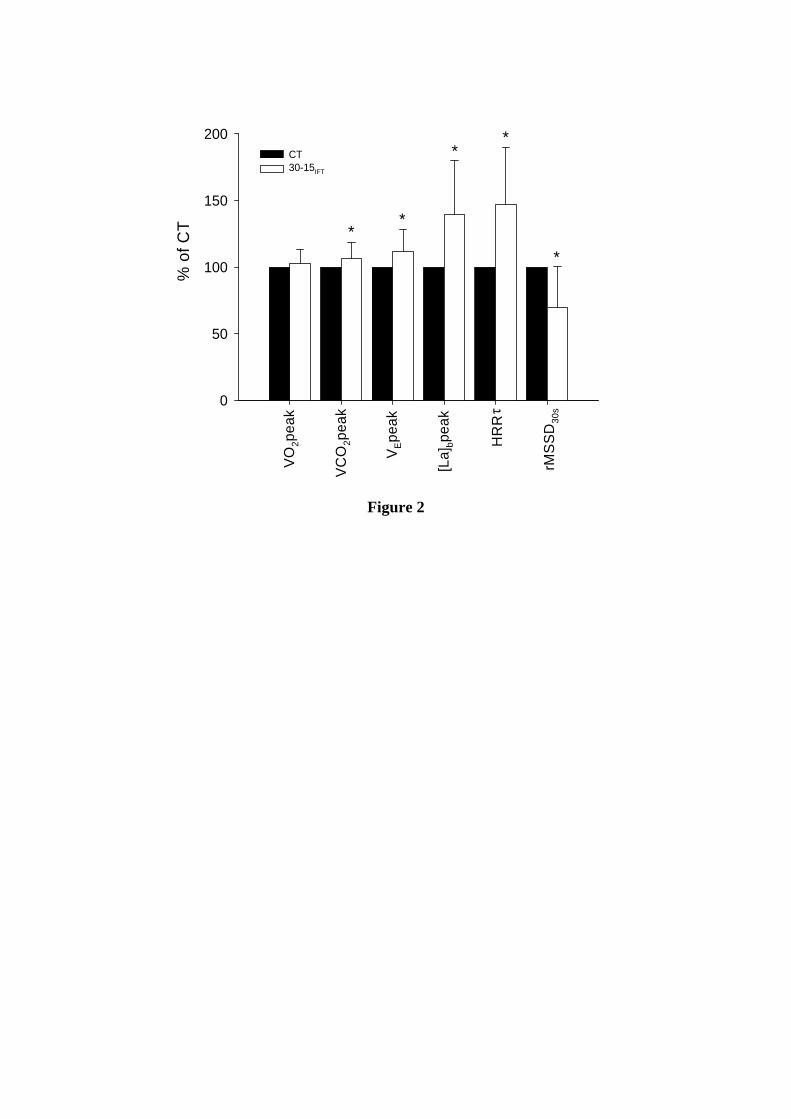
95% confidence interval. V O2 peak, V CO2 peak, E peak and [La]b peak measured for 30-
15IFT as a percentage of CT are shown in Figure 2. It appears that whereas V O2 peak was
similar, V CO2 peak, V E peak and [La]b were significantly higher in 30-15IFT compared to CT
(all p<0.05). There were no differences in absolute values for V O2 peak, VT peak, RER peak,
O2pulse peak, HR peak and RPE between 30-15IFT and CT. In contrast, 30-15IFT led to
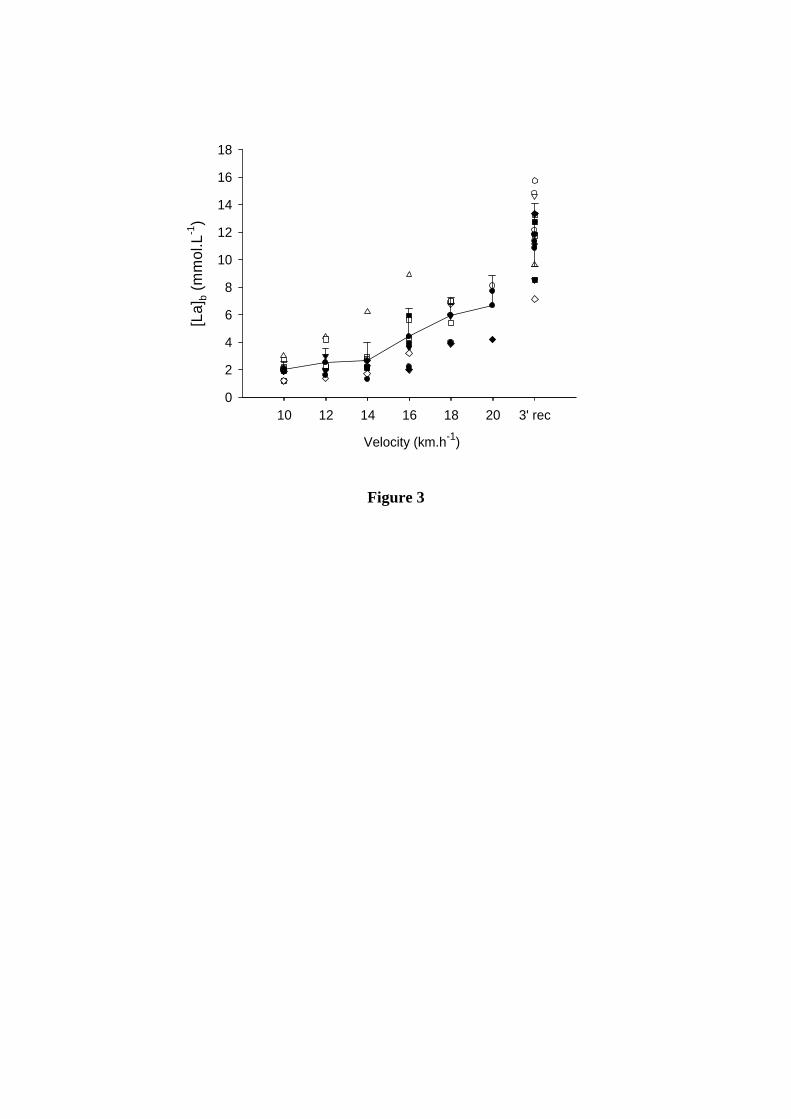
significantly higher BF peak, V E peak and [La]b peak than CT. For the 11 subjects in whom
blood samples were collected during the 30-15IFT, mean blood lactate concentration was 1.1 ±
0.1 mmol.l-1 at rest and increased with running velocity to reach 12.3 ± 2.8 mmol.l-1 3 min
after the end of exercise (Figure 3).
&
& & V&
&
& &
&
&
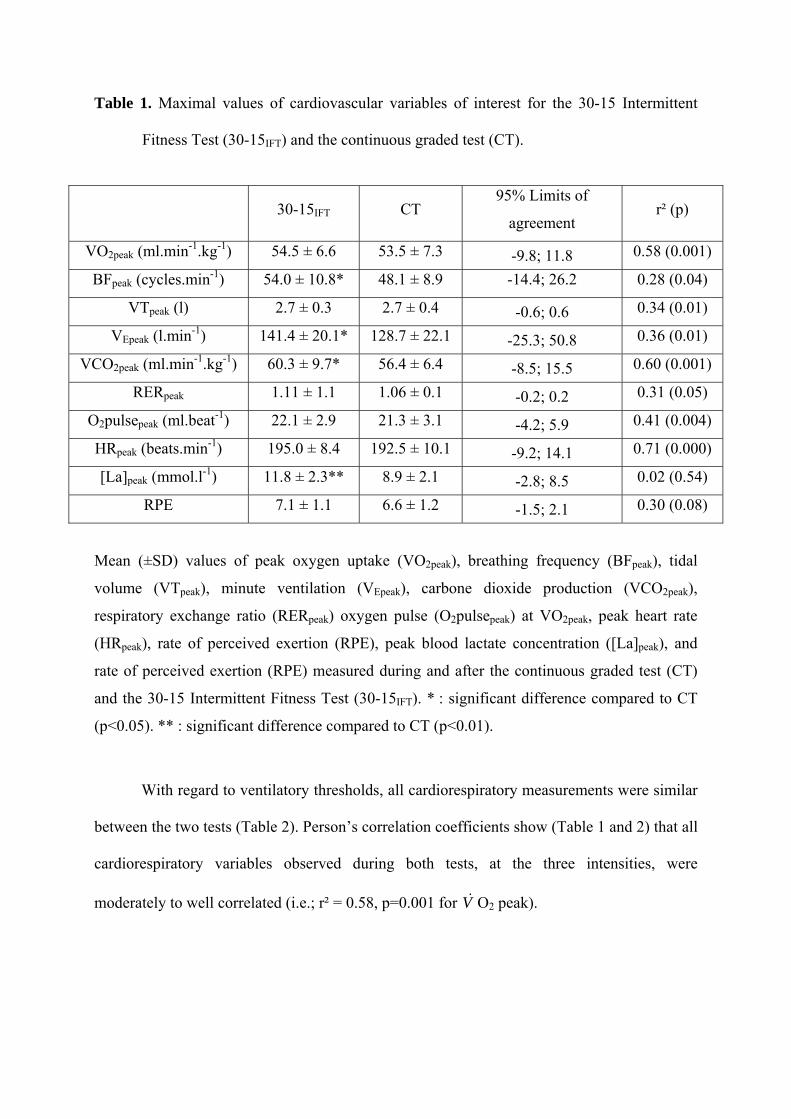
Table 1. Maximal values of cardiovascular variables of interest for the 30-15 Intermittent
Fitness Test (30-15IFT) and the continuous graded test (CT).
30-15IFT CT 95% Limits of
agreement r² (p)
VO2peak (ml.min-1.kg-1) 54.5 ± 6.6 53.5 ± 7.3 -9.8; 11.8 0.58 (0.001)
BFpeak (cycles.min-1) 54.0 ± 10.8* 48.1 ± 8.9 -14.4; 26.2 0.28 (0.04)
VTpeak (l) 2.7 ± 0.3 2.7 ± 0.4 -0.6; 0.6 0.34 (0.01)
VEpeak (l.min-1) 141.4 ± 20.1* 128.7 ± 22.1 -25.3; 50.8 0.36 (0.01)
VCO2peak (ml.min-1.kg-1) 60.3 ± 9.7* 56.4 ± 6.4 -8.5; 15.5 0.60 (0.001)
RERpeak 1.11 ± 1.1 1.06 ± 0.1 -0.2; 0.2 0.31 (0.05)
O2pulsepeak (ml.beat-1) 22.1 ± 2.9 21.3 ± 3.1 -4.2; 5.9 0.41 (0.004)
HRpeak (beats.min-1) 195.0 ± 8.4 192.5 ± 10.1 -9.2; 14.1 0.71 (0.000)
[La]peak (mmol.l-1) 11.8 ± 2.3** 8.9 ± 2.1 -2.8; 8.5 0.02 (0.54)
RPE 7.1 ± 1.1 6.6 ± 1.2 -1.5; 2.1 0.30 (0.08)
Mean (±SD) values of peak oxygen uptake (VO2peak), breathing frequency (BFpeak), tidal
volume (VTpeak), minute ventilation (VEpeak), carbone dioxide production (VCO2peak),
respiratory exchange ratio (RERpeak) oxygen pulse (O2pulsepeak) at VO2peak, peak heart rate
(HRpeak), rate of perceived exertion (RPE), peak blood lactate concentration ([La]peak), and
rate of perceived exertion (RPE) measured during and after the continuous graded test (CT)
and the 30-15 Intermittent Fitness Test (30-15IFT). * : significant difference compared to CT
(p<0.05). ** : significant difference compared to CT (p<0.01).
With regard to ventilatory thresholds, all cardiorespiratory measurements were similar
between the two tests (Table 2). Person’s correlation coefficients show (Table 1 and 2) that all
cardiorespiratory variables observed during both tests, at the three intensities, were
moderately to well correlated (i.e.; r² = 0.58, p=0.001 for V O2 peak). &
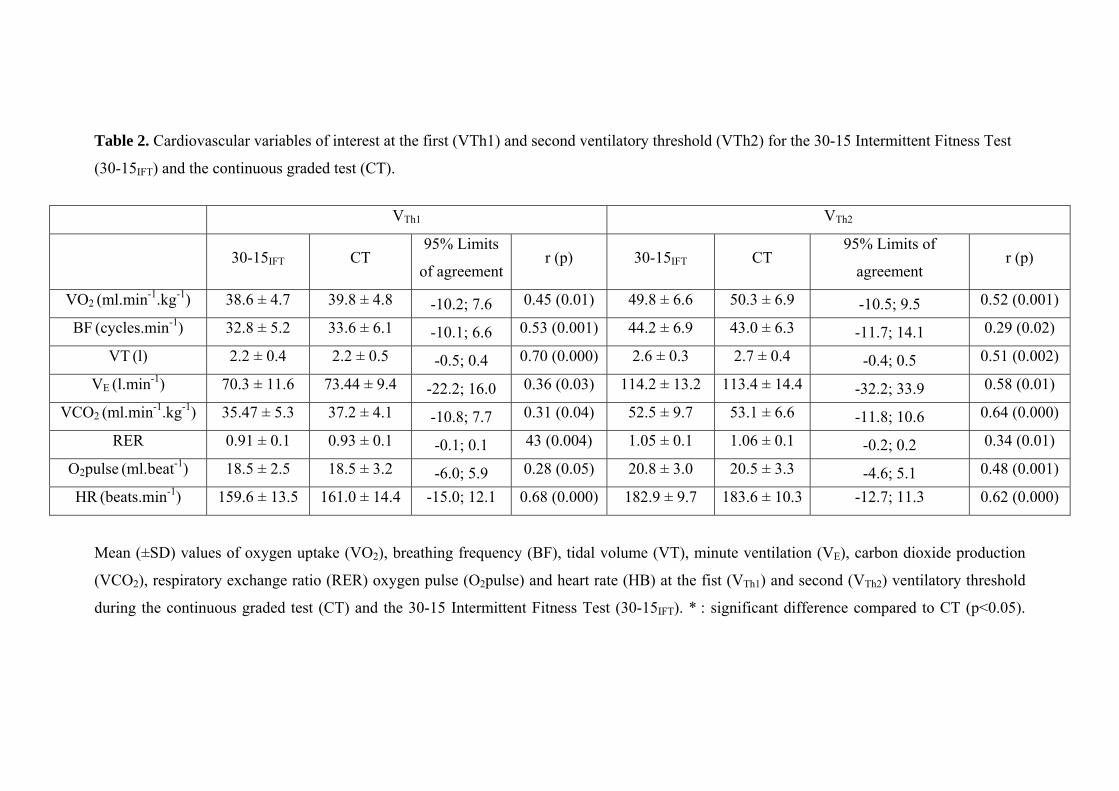
Table 2. Cardiovascular variables of interest at the first (VTh1) and second ventilatory threshold (VTh2) for the 30-15 Intermittent Fitness Test
(30-15IFT) and the continuous graded test (CT).
V VTh1 Th2
30-15IFT CT 95% Limits
of agreementr (p) 30-15IFT CT
95% Limits of
agreement r (p)
VO2 (ml.min-1.kg-1) 38.6 ± 4.7 39.8 ± 4.8 -10.2; 7.6 0.45 (0.01) 49.8 ± 6.6 50.3 ± 6.9 -10.5; 9.5 0.52 (0.001)
BF (cycles.min-1) 32.8 ± 5.2 33.6 ± 6.1 -10.1; 6.6 0.53 (0.001) 44.2 ± 6.9 43.0 ± 6.3 -11.7; 14.1 0.29 (0.02)
VT (l) 2.2 ± 0.4 2.2 ± 0.5 -0.5; 0.4 0.70 (0.000) 2.6 ± 0.3 2.7 ± 0.4 -0.4; 0.5 0.51 (0.002)
VE (l.min-1) 70.3 ± 11.6 73.44 ± 9.4 -22.2; 16.0 0.36 (0.03) 114.2 ± 13.2 113.4 ± 14.4 -32.2; 33.9 0.58 (0.01)
VCO2 (ml.min-1.kg-1) 35.47 ± 5.3 37.2 ± 4.1 -10.8; 7.7 0.31 (0.04) 52.5 ± 9.7 53.1 ± 6.6 -11.8; 10.6 0.64 (0.000)
RER 0.91 ± 0.1 0.93 ± 0.1 -0.1; 0.1 43 (0.004) 1.05 ± 0.1 1.06 ± 0.1 -0.2; 0.2 0.34 (0.01)
O2pulse (ml.beat-1) 18.5 ± 2.5 18.5 ± 3.2 -6.0; 5.9 0.28 (0.05) 20.8 ± 3.0 20.5 ± 3.3 -4.6; 5.1 0.48 (0.001)
HR (beats.min-1) 159.6 ± 13.5 161.0 ± 14.4 -15.0; 12.1 0.68 (0.000) 182.9 ± 9.7 183.6 ± 10.3 -12.7; 11.3 0.62 (0.000)
Mean (±SD) values of oxygen uptake (VO2), breathing frequency (BF), tidal volume (VT), minute ventilation (VE), carbon dioxide production
(VCO2), respiratory exchange ratio (RER) oxygen pulse (O2pulse) and heart rate (HB) at the fist (VTh1) and second (VTh2) ventilatory threshold
during the continuous graded test (CT) and the 30-15 Intermittent Fitness Test (30-15IFT). * : significant difference compared to CT (p<0.05).
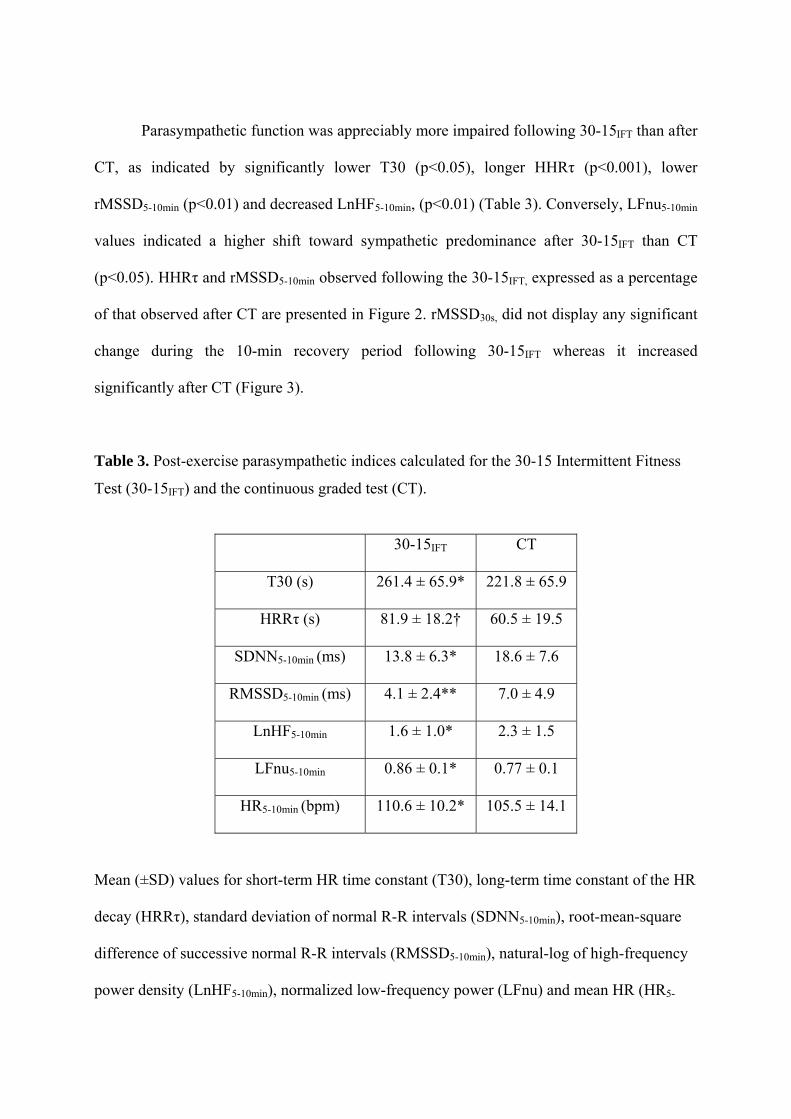
Parasympathetic function was appreciably more impaired following 30-15IFT than after
CT, as indicated by significantly lower T30 (p<0.05), longer HHRτ (p<0.001), lower
rMSSD5-10min (p<0.01) and decreased LnHF5-10min, (p<0.01) (Table 3). Conversely, LFnu5-10min
values indicated a higher shift toward sympathetic predominance after 30-15IFT than CT
(p<0.05). HHRτ and rMSSD5-10min observed following the 30-15IFT, expressed as a percentage
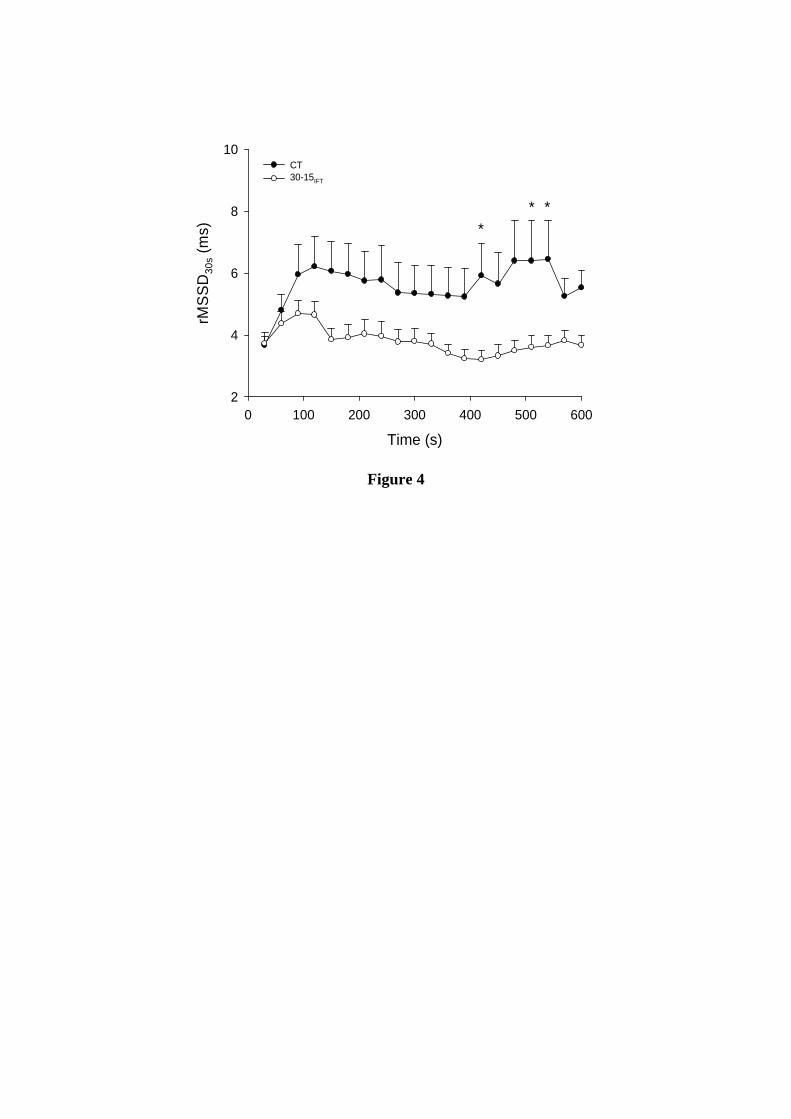
of that observed after CT are presented in Figure 2. rMSSD30s, did not display any significant
change during the 10-min recovery period following 30-15IFT whereas it increased
significantly after CT (Figure 3).
Table 3. Post-exercise parasympathetic indices calculated for the 30-15 Intermittent Fitness
Test (30-15IFT) and the continuous graded test (CT).
30-15IFT CT
T30 (s) 261.4 ± 65.9* 221.8 ± 65.9
HRRτ (s) 81.9 ± 18.2† 60.5 ± 19.5
SDNN5-10min (ms) 13.8 ± 6.3* 18.6 ± 7.6
RMSSD5-10min (ms) 4.1 ± 2.4** 7.0 ± 4.9
LnHF5-10min 1.6 ± 1.0* 2.3 ± 1.5
LFnu5-10min 0.86 ± 0.1* 0.77 ± 0.1
HR5-10min (bpm) 110.6 ± 10.2* 105.5 ± 14.1
Mean (±SD) values for short-term HR time constant (T30), long-term time constant of the HR
decay (HRRτ), standard deviation of normal R-R intervals (SDNN5-10min), root-mean-square
difference of successive normal R-R intervals (RMSSD5-10min), natural-log of high-frequency
power density (LnHF5-10min), normalized low-frequency power (LFnu) and mean HR (HR5-
10min) calculated for the 5-min period. *: significant difference versus CT (P < 0.05); **:
significant difference versus CT (P < 0.01). †: significant difference versus CT (P < 0.001).
DISCUSSION
The present study is the first to describe cardiorespiratory and autonomic responses to
a shuttle and intermittent field test, the 30-15IFT. Peak oxygen uptake and most
cardiorespiratory parameters at the two ventilatory thresholds were similar for the 30-15IFT
and classic graded continuous field test. In contrast, the 30-15IFT elicited higher peak minute
ventilation and maximum carbon dioxide production, which could be related to the final
higher running velocity reached and the increased anaerobic contribution in 30-15IFT
compared to CT. Finally, post-exercise autonomic function was characterized by a decreased
parasympathetic activity and a greater sympathetic predominance following the 30-15IFT than
after CT.
Continuous and linear exercise testing is not the optimal method for determining a
reference velocity for scheduling shuttle interval training sessions in team sport players.[3]
Therefore, there is a need for designing protocols such as the 30-15IFT that reproduce the
characteristics of specific intermittent exercises practiced in those sports (i.e.; change of
direction, acceleration, deceleration and rest periods).
Our results demonstrate the validity of the 30-15IFT for assessing maximal aerobic
power. We observed that the 30-15IFT elicits similar peak O2 uptake, VT, RER, O2pulse and
HR to a classic graded continuous field test, which we used as a standard reference of aerobic
power assessment (Table 1).[5, 18] The parameters obtained for the two tests were all
moderately-to-well correlated and 95% intervals of agreement (i.e., Figure 1 for V O2peak
and HR peak) were similar to those usually reported for field tests comparison.[19, 20] Mean
&
O2 bias (-1.60; 3.01 ml.-1min.kg-1) was within the range of V O2peak interdian variations (2.4
to 5.9%) [21] or that of technical error measurement (≈3% [13]). The present results can be
compared to previous studies of young soccer players [19, 20] that have shown incremental
intermittent testing (i.e.; the Yo-Yo intermittent endurance test, which employs a protocol
similar to the 30-15IFT) to elicit similar V O2 peak or HR peak values to those observed during
standard treadmill CT. Our results contrast however with those reported by Girard et al. [22,
23] using specific intermittent tennis and squash tests, since V O2 peak was higher during
intermittent racket tests than those on a treadmill. The higher oxygen consumption observed
in the racket sport tests [16, 17] may be due to the involvement of upper body muscles
required for the simulated ball hitting action. We, however, observed significantly higher BF
peak, E peak and V CO2 peak during the 30-15IFT than the CT. One may assume that the
discontinuous or shuttle [24] nature of the 30-15IFT explains in part the higher ventilatory
parameters observed, since the coupling of locomotion-ventilation is altered by the changes in
direction, stride patterns and velocity. Signals from neural afferents in contracting muscles as
a result of increased VIFT compared to VCT may have also led to an excitatory effect on central
respiratory drive.
&
&
&
V& &
Although blood lactate may not be the best measure to demonstrate the relative
contribution of anaerobic energy supply in sports with discontinuous exercise of long
duration,[25] its significantly higher concentration observed after the 30-15IFT could also
account for the increase in ventilation parameters. Metabolic acidosis may have contributed to
an enhancement of peripheral chemoreceptor activity resulting in increased ventilation.[26]
The significant higher CO2 production observed for 30-15IFT may also be directly related to
higher blood buffering of protons (H+) compared to CT.
In terms of assessment of ventilatory thresholds, the present results show that the 30-
15IFT produced comparable values to CT. All cardiorespiratory parameters were similar and
well correlated at the two ventilatory thresholds, and the confidence intervals were acceptable
(Table 2). With the exception of the two specific racket test studies,[22, 23] that reported
similar VThs values for field intermittent and treadmill tests, previous running studies paid
exclusive attention to maximal cardiorespiratory values.[19, 20] As the intermittent nature of
exercise is known to increase anaerobic participation,[27, 28] the accuracy of the 30-15IFT to
predict VThs was difficult to gauge. However, data suggest that anaerobic participation
during intermittent work might only affect ventilatory measures at high intensities (higher
than VTh2). Thus, the present results may also encourage the use of the 30-15IFT for VThs
assessments.
This is also the first study to describe HR recovery and post-exercise autonomic
function following a graded intermittent test. The time-varying vagal-related rMSSD30s did
not display any significant increase during the 10-min recovery period after 30-15IFT, whereas
it showed a time-effect increase after CT, indicative of effective parasympathetic reactivation
(Figure 3). This apparently reduced parasympathetic modulation (and conversely increased
sympathetic activity) after the 30-15 IFT compared to CT was corroborated by the significantly
slower HRR time constants (T30 and HRRτ), the lower vagal-related HRV indices and higher
sympathetic-related data (Table 3). Nevertheless, present inference to parasympathetic effect
on HR should be considered with caution. Various investigations have demonstrated,
especially at high workloads, complex interactions between the sympathetic and vagal
systems with respect to heart rate regulation resulting in reduced [29] or amplified vagal
stimulation.[30, 31]
The reduced parasympathetic modulation after 30-15IFT is in agreement with previous
data showing that anaerobic participation and muscle power engagement, rather than aerobic
intensity per se, influence the post-exercise parasympathetic reactivation.[6] Although the
direct link between HRV and homeostasis has not been objectively determined, we can
suggest that the particular autonomic status observed after the 30-15IFT might be related to a
more disturbed post-exercise homeostasis (i.e., increased system stress metabolite
accumulation [32]) as confirmed by the higher blood lactate concentration after the 30-15IFT.
This is in line with results reported earlier, where frequent changes in exercise intensity
during 40 min cycling were shown to disturb homeostasis and increase post-exercise
metabolism to a greater extent than constant exercise conducted at a similar mean
intensity.[28] All vagal HR-derived indices observed here were higher than those reported
after 12-min of high-intensity exercise [6] (HIT, 30 s running at 90% of VIFT, interspersed
with 30 s of passive recovery) in comparable subjects using extremely similar methods (i.e.,
T30 = 81.9 ± 18.2 and 100.99 ± 7.02 s after 30-15IFT and HIT [6]). This indicates that the 30-
15IFT has an important impact on homeostasis and autonomic nervous system activity but that
it is of lower magnitude than traditional interval-training exercises.[33, 34] Since it is believed
that a background low in parasympathetic activity following exercise is related to a transiently
increased risk for adverse cardiovascular invents,[8-10, 16] the present data suggest limiting
the use of the 30-15IFT to team sports athletes and to employ the traditional CT in sedentary or
unfit subjects for aerobic function assessment. However, as per exercise intensity
prescription,[33, 34] the use of the 30-15IFT could be indicated for the latter stages of a
(rehabilitation) training program in sedentary individuals or patients.
To conclude, by using the 30-15IFT protocol, the assessment of peak oxygen uptake
and ventilatory thresholds appear to be as accurate as a classic graded continuous test. These
data support the use of the 30-15IFT, not only as an accurate training instrument but also as
valid tool to explore aerobic function. Nevertheless, the slower HR recovery and increased
sympathetic predominance after the 30-15IFT suggests that its physiological strain is higher
than that of CT. The appreciably depressed post-exercise parasympathetic activity encourages
reserving its use to already trained athletes.


Acknowledgements
The authors would like to thank Anne-Lyse Behaegel for her help in data collection, the
subjects for their participation in the study, as well as Irmant Cadjjiov for his helpful
comments during the preparation of this manuscript.
References
1 Dupont G, Akakpo K and Berthoin S. The effect of in-season, high-intensity interval
training in soccer players. J Strength Cond Res 2004;18:584-9.
2 Hoff J and Helgerud J. Endurance and strength training for soccer players: physiological
considerations. Sports Med 2004;3:165-80.
3 Buchheit M. The 30-15 Intermittent Fitness Test: accuracy for individualizing interval
training of young intermittent sport players. J Strength Cond Res 2007;In press.
4 Billat LV and Koralsztein JP. Significance of the velocity at VO2max and time to
exhaustion at this velocity. Sports Med 1996;22:90-108.
5 ATS/ACCP Statement on cardiopulmonary exercise testing. Am J Respir Crit Care Med
2003;167:211-77.
6 Buchheit M, Laursen PB and Ahmaidi S. Parasympathetic reactivation after repeated sprint
exercise. Am J Physiol Heart Circ Physiol 2007;293:H133-H41.
7 Buchheit M, Papelier Y, Laursen PB, et al. Noninvasive assessment of cardiac
parasympathetic function: post-exercise heart rate recovery or heart rate variability? Am J
Physiol Heart Circ Physiol 2007;293:H8-H10.
8 Billman GE. Heart rate response to onset of exercise: evidence for enhanced cardiac
sympathetic activity in animals susceptible to ventricular fibrillation. Am J Physiol Heart Circ
Physiol 2006;291:H429-35.
9 Billman GE. Aerobic exercise conditioning: a nonpharmacological antiarrhythmic
intervention. J Appl Physiol 2002;92:446-54.
10 Cole CR, Blackstone EH, Pashkow FJ, et al. Heart-rate recovery immediately after
exercise as a predictor of mortality. N Engl J Med 1999;341:1351-7.
11 Hunter GR, Byrne NM, Gower BA, et al. Increased resting energy expenditure after 40
minutes of aerobic but not resistance exercise. Obesity (Silver Spring) 2006;14:2018-25.
12 Leger LA and Boucher R. An indirect continuous running multistage field test: the
Universite de Montreal track test. Can J Appl Sport Sci 1980;5:77-84.
13 Duffield R, Dawson B, Pinnington HC, et al. Accuracy and reliability of a Cosmed K4b2
portable gas analysis system. J Sci Med Sport 2004;7:11-22.
14 Whipp BJ, Davis JA and Wasserman K. Ventilatory control of the 'isocapnic buffering'
region in rapidly-incremental exercise. Respir Physiol 1989;76:357-67.
15 Gamelin FX, Berthoin S and Bosquet L. Validity of the polar S810 heart rate monitor to
measure R-R intervals at rest. Med Sci Sports Exerc 2006;38:887-93.
16 Task Force. Heart rate variability: standards of measurement, physiological interpretation
and clinical use. Task Force of the European Society of Cardiology and the North American
Society of Pacing and Electrophysiology. Circulation 1996;93:1043-65.
17 Bland JM and Altman DG. Statistical methods for assessing agreement between two
methods of clinical measurement. Lancet 1986;1:307-10.
18 Meyer T, Welter JP, Scharhag J, et al. Maximal oxygen uptake during field running does
not exceed that measured during treadmill exercise. Eur J Appl Physiol 2003;88:387-9.
19 Castagna C, Impellizzeri FM, Belardinelli R, et al. Cardiorespiratory responses to Yo-yo
Intermittent Endurance Test in nonelite youth soccer players. J Strength Cond Res
2006;20:326-30.
20 Metaxas TI, Koutlianos NA, Kouidi EJ, et al. Comparative study of field and laboratory
tests for the evaluation of aerobic capacity in soccer players. J Strength Cond Res 2005;19:79-
84.
21 Midgley AW and Mc Naughton LR. Time at or near VO2max during continuous and
intermittent running. A review with special reference to considerations for the optimisation of
training protocols to elicit the longest time at or near VO2max. J Sports Med Phys Fitness
2006;46:1-14.
22 Girard O, Chevalier R, Leveque F, et al. Specific incremental field test for aerobic fitness
in tennis. Br J Sports Med 2006;40:791-6.
23 Girard O, Sciberras P, Habrard M, et al. Specific incremental test in elite squash players.
Br J Sports Med 2005;39:921-6.
24 Ahmaidi S, Collomp K and Prefaut C. The effect of shuttle test protocol and the resulting
lactacidaemia on maximal velocity and maximal oxygen uptake during the shuttle exercise
test. Eur J Appl Physiol 1992;65:475-9.
25 Smekal G, von Duvillard SP, Pokan R, et al. Changes in blood lactate and respiratory gas
exchange measures in sports with discontinuous load profiles. Eur J Appl Physiol
2003;89:489-95.
26 Mateika JH and Duffin J. A review of the control of breathing during exercise. Eur J Appl
Physiol Occup Physiol 1995;71:1-27.
27 Astrand I, Astrand PO, Christensen EH, et al. Intermittent muscular work. Acta Physiol
Scand 1960;48:448-53.
28 Kang J, Mangine GT, Ratamess NA, et al. Influence of intensity fluctuation on exercise
metabolism. Eur J Appl Physiol 2007;100:253-60.
29 Miyamoto T, Kawada T, Takaki H, et al. High plasma norepinephrine attenuates the
dynamic heart rate response to vagal stimulation. Am J Physiol Heart Circ Physiol
2003;284:H2412-8.
30 Levy MN. Sympathetic-parasympathetic interactions in the heart. Circ Res 1971;29:437-
45.
31 Kawada T, Ikeda Y, Sugimachi M, et al. Bidirectional augmentation of heart rate
regulation by autonomic nervous system in rabbits. Am J Physiol 1996;271:H288-95.
32 Perini R, Orizio C, Comande A, et al. Plasma norepinephrine and heart rate dynamics
during recovery from submaximal exercise in man. Eur J Appl Physiol Occup Physiol
1989;58:879-83.
33 Billat LV. Interval training for performance: a scientific and empirical practice. Special
recommendations for middle- and long-distance running. Part II: anaerobic interval training.
Sports Med 2001;31:75-90.
34 Midgley AW, McNaughton LR and Wilkinson M. Is there an optimal training intensity for
enhancing the maximal oxygen uptake of distance runners?: empirical research findings,
current opinions, physiological rationale and practical recommendations. Sports Med
2006;36:117-32.
Figure legends
Figure 1. Bland & Altman plot of peak oxygen uptake (V O2peak) and peak heart rate (HR
peak) measured for the 30-15IFT vs. continuous test (CT).
&
Figure 2. Mean (±) value of peak oxygen uptake (V O2 peak), carbon dioxide uptake (V CO2
peak) and minute ventilation (V E peak) at V O2peak, peak blood lactate concentration
([La]b), long-term heart rate recovery time constant (HRRτ) and root mean square of
successive R-R interval differences (rMSSD) for 30-15IFT (white bars), expressed as a
percentage of values observed for CT (black bars). *: significant difference versus CT (P <
0.05).
& &
& &
Figure 3. Evolution of blood lactate concentration ([La]b) during the 30-15IFT and 3 min after
test termination. Means ± SD and individual values for 11 subjects are reported.
Figure 4. Average (±SD) root mean square of successive differences in the R-R intervals
measured on successive 30-s segments (rMSSD30s) during the 10-min recovery period after
the 30-15 Intermittent fitness test (30-15IFT) or the graded continuous one (CT)*: significant
difference vs. rMSSD30s at 30s after the end of exercise during the same test session (P <
0.05).
Mean 30-15IFT and CT VO2peak (ml.min-1.kg-1)
40 45 50 55 60 65 70VO2p
eak
30-1
5 IFT
- VO
2pea
k C
T (m
l.min
-1.k
g-1)
-15
-10
-5
0
5
10
15Mean + 2 SD
Mean - 2 SD
Mean diff.
Mean 30-15IFT and CT HR peak (bpm)
175 180 185 190 195 200 205 210 215
HR
pea
k 30
-15 IF
T - H
R p
eak
CT
(bpm
)
-15
-10
-5
0
5
10
15
20
Mean + 2 SD
Mean - 2 SD
Mean diff.
Figure 1
0
50
100
150
200CT 30-15IFT
VO
2pea
k
VC
O2p
eak
V Epe
ak
[La]
bpea
k
rMS
SD30
s
HR
R
% o
f CT *
*
**
*
Figure 2
Velocity (km.h-1)
[La]
b (m
mol
.L-1
)
0
2
4
6
8
10
12
14
16
18
10 12 14 16 18 20 3' rec
Figure 3
Time (s)0 100 200 300 400 500 600
rMSS
D30
s (m
s)
2
4
6
8
10CT 30-15IFT
***
Figure 4