Embed Size (px)
Citation preview

Rec. ITU-R BS.1194-2 1
RECOMMENDATION ITU-R BS.1194-2
SYSTEMS FOR MULTIPLEXING FREQUENCY MODULATION (FM) SOUNDBROADCASTING WITH A SUB-CARRIER DATA CHANNEL HAVING
A RELATIVELY LARGE TRANSMISSION CAPACITYFOR STATIONARY AND MOBILE RECEPTION
(Question ITU-R 71/10)
(1995-1998)Rec. ITU-R BS.1194-2
The ITU Radiocommunication Assembly,
considering
a) that many countries use the Radio Data System (RDS) according to Recommendation ITU-R BS.643;
b) that although RDS is able to accommodate many of the data services required, the data capacity is nevertheless limited;
c) that it is a fundamental requirement that compatibility be achieved between FM stereophonic services including RDS and any new additional sub-carrier system;
d) that a much larger data capacity may be needed for some applications;
e) that sub-carrier data radio channel systems can provide a much larger capacity compared to RDS and are capable of meeting the requirement stated in § c) as regards protection ratios and interference levels;
f) that high speed data systems have already been put into operation;
g) that the diversity of applications as described in ITU-R BS.1350 precludes the suitability of a single system for all applications,
recommends
1 that one of the following 3 systems be used for multiplexing frequency modulation (FM) sound broadcasting with a sub-carrier data channel having a relatively large transmission capacity for stationary and mobile reception:– the Data Radio Channel (DARC) System, as specified in Annex 1, which is best suited for its high level of
compatibility with the main broadcast audio channel and for Intelligent Transportation Services; or– the High Speed Data System (HSDS) as specified in Annex 2, which is best suited for its minimum duty cycle for
power savings and for paging services; or– the Sub-carrier Transmission Information Channel (STIC) system as specified in Annex 3, which is best suited for
its long message reliability in multipath and for Intelligent Transportation Services particularly when a high level of audio processing is used on the main broadcast audio channel.
NOTE 1 – Recommendation ITU-R BS.1350 specifying the system requirements will assist broadcasters in evaluating how to meet their service requirements with the available high speed data systems.NOTE 2 – A comparison of systems is provided in Appendix 1. Appendix 2 provides test results for 3 systems, tested side-by-side by an independent body in the United States.

2 Rec. ITU-R BS.1194-2
ANNEX 1
System description: System A, Data Radio Channel (DARC)
The DARC system provides a highly acceptable balance of throughput, robustness and occupied bandwidth to support multiple applications of a standardized data sub-carrier. The system is designed to minimize the effects of multipath and fading on the channel in both stationary and mobile environments. Three dimensional error correction/detection provides virtually error-free data reception on all types of receiver.
Some multiplexed applications that DARC supports are:– receiver displayed information in the form of multiple page text and graphics including, but not limited to, audio
program information, news, sport, weather, navigational data and travel information;– computer database refreshing and file transfer;– portable paging/messaging and conditional access (receiver addressability);– DGPS correction data for portable and mobile receivers.
DARC's Level-controlled Minimum Shift Keying (LMSK) modulation method allows easy, inexpensive receiver implementation.
The DARC FM sub-carrier specifications are a matter of ETSI Standard ETS 300 751.
1 Modulation characteristics (physical layer)
1.1 Sub-carrier frequency
The sub-carrier frequency is 76 kHz locked in phase to the fourth harmonic and, in the case of stereophonic services, is of pilot tone.
The frequency tolerance shall be within 76 kHz 7.6 Hz (0.01%) and the phase difference shall not exceed 5° for the phase of pilot tone.
1.2 Method of modulation
LMSK modulation is used with a spectrum shaping according to Figure 1. LMSK is a form of MSK in which the amplitude is controlled by stereo sound signals of left minus right. A frequency of 76 kHz 4 kHz is used when the input data is 1 and 76 kHz – 4 kHz is used when the input data is 0.
1.3 Bit rate
The bit rate is 16 kbit/s 1.6 bit/s.
1.4 Sub-carrier level
The sub-carrier level is varied depending on the level of the stereo L-R signals (see Figure 2). If the deviation of the main FM carrier when modulated by the stereo L-R signals is less than 2.5%, the sub-carrier is deviated by 4% (3 kHz) of the main FM carrier. If the deviation of the main FM carrier when modulated by the stereo L-R signals is more than 5%, the sub-carrier is deviated by up to 10% (7.5 kHz) of the main carrier. Between these limits the deviation has a linear relation.

Rec. ITU-R BS.1194-2 3
1194-01
– 80
– 60
– 40
– 20
0
20
50 60 70 80 90 100
56 58 64 88 94 97
0.5
– 0.5
FIGURE 1
Spectrum-shaping filter
Baseband frequency (kHz)
Rel
ativ
e am
plitu
de (d
B)
Lower boundUpper bound
1194-02
0
5
10
0 1 2 3 4 5 6 7 8
FIGURE 2
Sub-carrier deviation
Inje
ctio
n le
vel (
%)
Deviation of left-rightstereo sound (%)
2 Frame structure (data link)
2.1 General features
The largest element of the structure is called a “frame” and consists normally of 78 336 bits in total, organized as 190 information blocks of 288 bits each and 82 parity blocks of 288 bits each.
An information block comprises a Block Identification Code (BIC) of 16 bits, information of 176 bits, a Cyclic Redundancy Check (CRC) of 14 bits and parity of 82 bits.

4 Rec. ITU-R BS.1194-2
A parity block comprises a BIC of 16 bits and parity of 272 bits.
There are four different types of BIC (see Table 1) to generate block synchronization and frame synchronization.
There are three methods to organize data, methods A and B, which both use product coding (272,190) (272,190) and method C that uses only block code (272,190).
All three methods are identified and distinguished by the sequence of BICs.
TABLE 1
Block Identification Code (BIC)
2.2 Method A
This method limits the transmission delay on the transmitter side. In method A the frame (called Frame A) consists normally of 190 information blocks followed by 82 parity blocks (see Figure 3) but, for services with strong demand for real-time transmission it is possible to insert 12 additional information blocks (block coded only) among the parity blocks in the product coded frame.
1194-03
CRC
FIGURE 3
Frame according to method A, without insertion of real-time blocks
BIC3
BIC2
BIC1
BIC4
60blocks
70blocks
82blocks
60blocks
Information
Information
Information Horizontalparity
Vertical parity
The 12 inserted blocks are not a part of the product coded frame. They are placed at fixed positions, four blocks at a time at three positions (see Figure 4). The first four blocks are placed after 20 parity blocks, the next four after another 21 parity blocks and the last four blocks after another 21 parity blocks.
The BIC for the inserted blocks is BIC2. The receiver extracts such blocks and decodes them immediately.
BIC1 0001 0011 0101 1110
BIC2 0111 0100 1010 0110
BIC3 1010 0111 1001 0001
BIC4 1100 1000 0111 0101

Rec. ITU-R BS.1194-2 5
1194-04
CRC
CRC
CRC
CRC
Vertical parity
FIGURE 4
Frame according to method A, with static insertion of real-time blocks
60blocks
70blocks
60blocks
82+12
blocks
Information
Information
Information Horizontalparity
BIC2 ParityReal time information blocks
BIC2 ParityReal time information blocks
BIC2 ParityReal time information blocks
BIC4
BIC4
Vertical parity
BIC4 Vertical parity
BIC4 Vertical parity
BIC3
BIC2
BIC1
2.3 Method B
To allow an almost uniform transmission during the whole frame (called Frame B), the parity blocks are interleaved with the information blocks (see Figure 5). This method causes a delay (about 5 s) on the transmitter side.
2.4 Method C
Method C comprises only information blocks of 288 bits. BIC3 is used within this method. This method is intended for services with a strong demand for real-time transmission, but at a lower level of error protection, e.g. for real-time services, stationary reception or repetitive information.
2.5 Error correction code
A product code (272,190) (272,190) is used for the frame in methods A and B to enable the receiver/decoder to detect and correct errors which occur in reception. A block code (272,190) is used for method C.
The (272,190) code is a shortened majority logic decodable difference set cyclic code. The generator polynomial for the (272,190) code is given by:
g(x) x82 x77 x76 x71 x67 x66 x56 x52 x48 x40 x36 x34 x24 x22 x18 x10 x4 1
2.6 Error detection
14 bits of CRC are used to enable the receiver/decoder to detect errors. From the 176 information bits, a CRC is calculated using the generator polynomial:
g(x) x14 x11 x2 1

6 Rec. ITU-R BS.1194-2
2.7 Scrambling
To avoid restrictions on the data input format and to spread the modulation spectrum, data should be scrambled by the Pseudo-Noise (PN) sequence specified by:
g(x) x9 x4 1
1194-05
CRCCRC
CRCCRCCRCCRC
CRCCRC
CRCCRC
CRCCRC
CRCCRCCRCCRC
CRCCRC
CRCCRC
FIGURE 5
Frame according to method B, with block interleaving
13blocks
123blocks
123blocks
13blocks
Information 1Information 2
Information 12Information 13Information 14Information 15
Parity 1Information 16Information 17
Parity 2
Information 95Information 96
Parity 41Information 97Information 98
Information 108Information 109Information 110Information 111
Parity 42Information 112Information 113
Parity 43
Information 189Information 190
Parity 82
BIC1BIC1
BIC1BIC1BIC3BIC3BIC4BIC3BIC3BIC4
BIC3BIC3BIC4BIC2BIC2
BIC2BIC2BIC3BIC3BIC4BIC3BIC3BIC4
BIC3BIC3BIC4
Parity
Parity
Parity
Parity
1194-06
CRC
FIGURE 6
Frame according to method C, block code only
BIC3 ParityInformation

Rec. ITU-R BS.1194-2 7
3 Operational characteristics of the Data Radio Channel (DARC)
3.1 Transmission characteristics
3.1.1 Laboratory transmission tests
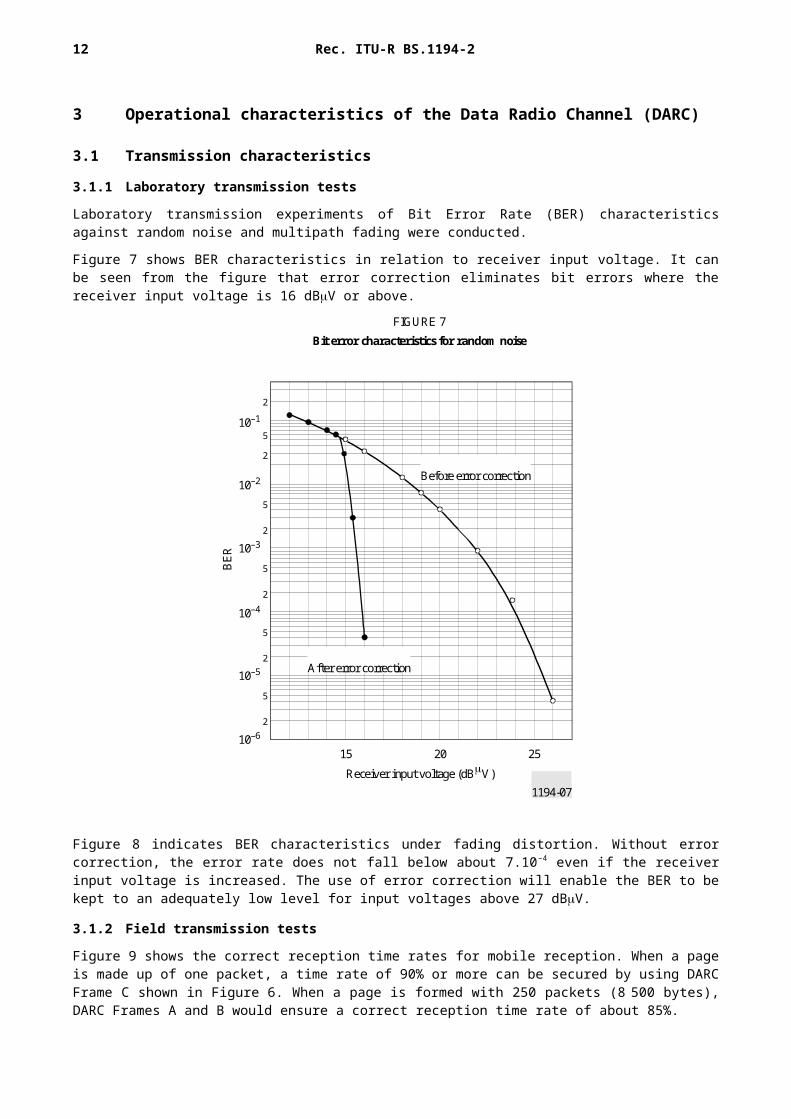
Laboratory transmission experiments of Bit Error Rate (BER) characteristics against random noise and multipath fading were conducted.
Figure 7 shows BER characteristics in relation to receiver input voltage. It can be seen from the figure that error correction eliminates bit errors where the receiver input voltage is 16 dBV or above.
1194-07
15 20 25
10–1
2
5
2
5
2
5
2
5
2
5
2
10–2
10–3
10–4
10–5
10–6
Before error correction
After error correction
Receiver input voltage (dBV)
FIGURE 7
Bit error characteristics for random noise
BER
Figure 8 indicates BER characteristics under fading distortion. Without error correction, the error rate does not fall below about 7.10–4 even if the receiver input voltage is increased. The use of error correction will enable the BER to be kept to an adequately low level for input voltages above 27 dBV.
3.1.2 Field transmission tests
Figure 9 shows the correct reception time rates for mobile reception. When a page is made up of one packet, a time rate of 90% or more can be secured by using DARC Frame C shown in Figure 6. When a page is formed with 250 packets (8 500 bytes), DARC Frames A and B would ensure a correct reception time rate of about 85%.

8 Rec. ITU-R BS.1194-2
1194-08
20 30 40 50
10–1
2
5
10–2
10–3
10–4
2
5
2
5
Before error correction
After error correction
FIGURE 8
Bit error characteristics for fading distortion
BER
Receiver input voltage (dBV
Fading frequency:Multipath D/U:Delay time:
3.3 Hz10 dB5 s
1194-09
0
20
40
60
80
100
1 102102 5 2 5 2
FIGURE 9
Effect of error correction code in the FM service area
Cor
rect
rece
ptio
n tim
e ra
te (%
)
Number of packets per one page
No coding
Frame C
Frames A and B

Rec. ITU-R BS.1194-2 9
3.2 Compatibility with stereo sound broadcasting
3.2.1 Questionnaire survey
Compatibility with stereo sound broadcasting is important in deciding the multiplexing level of multiplex signals. A mail questionnaire survey of more than 2 000 people was conducted by changing the multiplexing level of the LMSK signals which were experimentally multiplexed with the stereo sound signals. Speech and piano music were used as stereo sound signals.
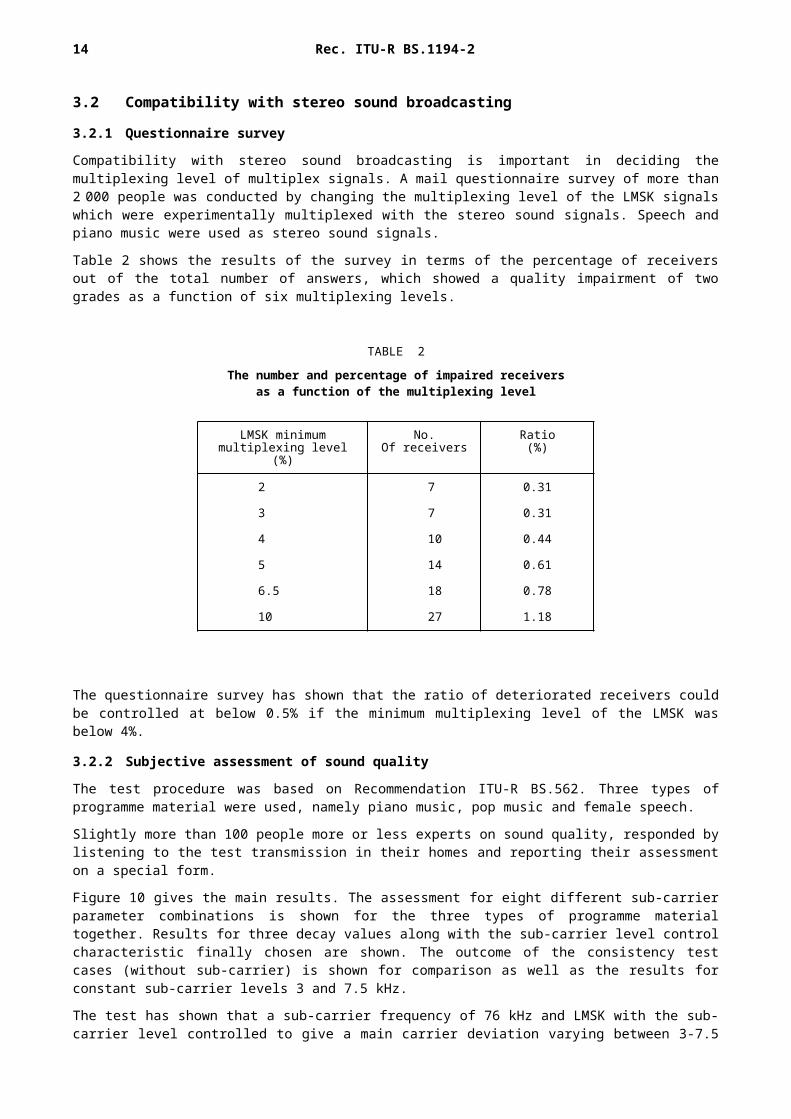
Table 2 shows the results of the survey in terms of the percentage of receivers out of the total number of answers, which showed a quality impairment of two grades as a function of six multiplexing levels.
TABLE 2
The number and percentage of impaired receiversas a function of the multiplexing level
The questionnaire survey has shown that the ratio of deteriorated receivers could be controlled at below 0.5% if the minimum multiplexing level of the LMSK was below 4%.
3.2.2 Subjective assessment of sound quality
The test procedure was based on Recommendation ITU-R BS.562. Three types of programme material were used, namely piano music, pop music and female speech.
Slightly more than 100 people more or less experts on sound quality, responded by listening to the test transmission in their homes and reporting their assessment on a special form.
Figure 10 gives the main results. The assessment for eight different sub-carrier parameter combinations is shown for the three types of programme material together. Results for three decay values along with the sub-carrier level control characteristic finally chosen are shown. The outcome of the consistency test cases (without sub-carrier) is shown for comparison as well as the results for constant sub-carrier levels 3 and 7.5 kHz.
The test has shown that a sub-carrier frequency of 76 kHz and LMSK with the sub-carrier level controlled to give a main carrier deviation varying between 3-7.5 kHz and with a decay time of 5 ms gives the best result. The mean assessment grade is 4.96 on the five-grade impairment scale and the system is therefore considered to be compatible with the FM stereophonic sound-broadcasting system at VHF.
LMSK minimummultiplexing level (%)
No.Of receivers
Ratio(%)
2 7 0.31
3 7 0.31
4 10 0.44
5 14 0.61
6.5 18 0.78
10 27 1.18

10 Rec. ITU-R BS.1194-2
1194-10
5
543210 0.5 1.5 2.5 3.5 4.5
4.93
4.96
4.91
4.8
4.94
4.98
4.95
FIGURE 10
Test results from subjective assessment of sound quality
Subjective assessment of sound quality
Five-grade impairment scale
Standard deviation
Mean
Subc
arrie
r mod
ulat
ion
Assessment consistency 3
Assessment consistency 2
Assessment consistency 1
L-MSK: Fix 3 kHz
L-MSK: Fix 7.5 kHz
L-MSK: 3-7.5 kHz decay 25 ms
L-MSK: 3-7.5 kHz decay 5 ms
L-MSK: 3-7.5 kHz decay 1 ms
3.2.3 Multipath distortion
The above compatibility tests have not assessed the effects of multipath propagation. It is to be expected that such conditions may cause some interference to the main programme signal, as well as, perhaps, the RDS signal if this is transmitted simultaneously. In such circumstances, however, the received programme signal is also expected to be impaired by multipath distortion.
In this section, compatibility tests of the DARC signal with the main programme under the conditions of multipath propagation are described.
Inter-modulation between a DARC signal and the pilot tone of 19 kHz causes interference within the audio frequency band.
Figure 11 indicates the audio signal-to-noise (S/N) ratio for various sub-carrier frequencies in which the bit rate of 16 kbit/s and LMSK modulation scheme are used under multipath conditions. This figure shows that a better S/N ratio can be obtained when the centre sub-carrier frequency is higher than 73 kHz. This result shows that the DARC has a good performance since its sub-carrier frequency is specified as 76 kHz.
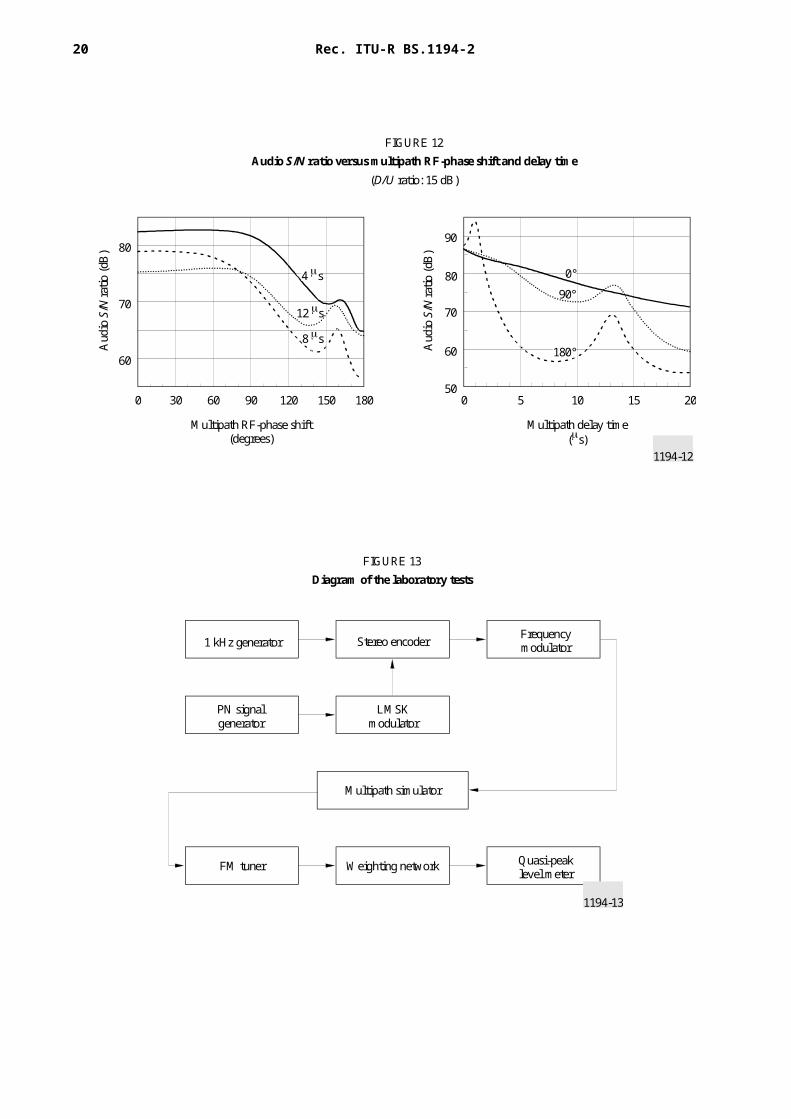
Figure 12 shows the simulation results of the audio S/N ratio. These figures indicate that the worst S/N ratio occurs at an RF-phase shift of 180° and a multipath delay time of 9 s.

Rec. ITU-R BS.1194-2 11
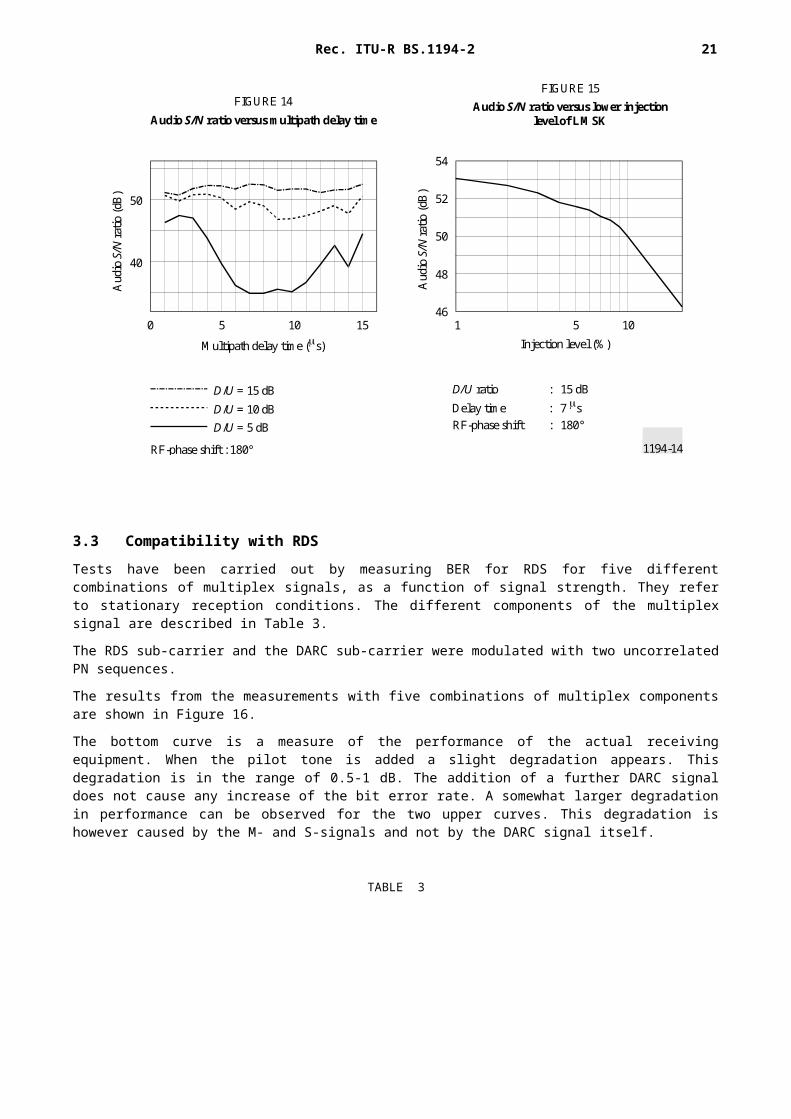
Figure 13 shows the diagram of the laboratory tests. The receiver input level was set to –60 dBm and the noise level measured by a quasi-peak level metre with a weighting network in accordance with Recommendation 468. Figure 14 shows the audio S/N ratio versus multipath delay time. Delay times of between 7 s and 10 s gives the worst S/N ratios. From the measurement of delay spread in the Tokyo area, it has been revealed that the D/U ratio of a 7 s delay multipath signal is greater than 15 dB and the 9 s case is greater than 19 dB for 99% area ratio. This indicates that the 99% worst multipath condition for audio S/N ratio is a D/U ratio of 15 dB, for a delay time of 7 s and an RF-phase shift of 180°. Figure 15 shows the audio S/N ratio versus a lower injection level of LMSK under the worst multipath conditions. DARC uses LMSK with the lower injection level of 4%. Figure 15 indicates that the degradation of audio S/N ratio due to multiplexing DARC is controlled to a level below 1.5 dB in the 9% worst multipath conditions.
The compatibility tests of the DARC signal with the main programme under conditions of multipath propagation show that, under the 99% worst multipath condition of D/U ratio of 15 dB, delay time of 7 s and an RF-phase difference of 180° in Tokyo area, less than 1.5 dB degradation of audio S/N ratio was observed when the DARC signal was multiplexed.
1194-11
70
60
50
40
50 60 70 80 90 100DARC
FIGURE 11Audio S/N ratio for various sub-carrier frequencies
Sub-carrier frequency (kHz)
Aud
io S
/N ra
tio (d
B)
Injection level : 4%Desired-to-undesired signal (D/U) :15 dBDelay time : 8 sRF-phase shift : 0°, 10°, 20°, ..., 180°
12 Rec. ITU-R BS.1194-2
1194-12
0 30 60 90 120 150 180 0 5 10 15 20
80
70
60
90
80
70
60
50
4 s
8 s
12 s
0°
90°
180°
FIGURE 12Audio S/N ratio versus multipath RF-phase shift and delay time
(D/U ratio: 15 dB)
Multipath delay time (s)
Aud
io S
/N ra
tio (d
B)
Aud
io S
/N ra
tio (d
B)
Multipath RF-phase shift (degrees)
1194-13
Multipath simulator
1 kHz generator Stereo encoderFrequencymodulator
LMSKmodulator
PN signalgenerator
Weighting network Quasi-peaklevel meter
FM tuner
FIGURE 13Diagram of the laboratory tests

Rec. ITU-R BS.1194-2 13
1194-14
1 5 1046
48
50
52
54
40
50
0 5 10 15
D/U = 15 dBD/U = 10 dBD/U = 5 dB
Multipath delay time (s)
RF-phase shift : 180°
Aud
io S/N
ratio
(dB
)FIGURE 14
Audio S/N ratio versus multipath delay time
FIGURE 15Audio S/N ratio versus lower injection
level of LMSK
Aud
io S/N
ratio
(dB
)
Injection level (%)
D/U ratio : 15 dBDelay time : 7 sRF-phase shift : 180°
3.3 Compatibility with RDS
Tests have been carried out by measuring BER for RDS for five different combinations of multiplex signals, as a function of signal strength. They refer to stationary reception conditions. The different components of the multiplex signal are described in Table 3.
The RDS sub-carrier and the DARC sub-carrier were modulated with two uncorrelated PN sequences.
The results from the measurements with five combinations of multiplex components are shown in Figure 16.
The bottom curve is a measure of the performance of the actual receiving equipment. When the pilot tone is added a slight degradation appears. This degradation is in the range of 0.5-1 dB. The addition of a further DARC signal does not cause any increase of the bit error rate. A somewhat larger degradation in performance can be observed for the two upper curves. This degradation is however caused by the M- and S-signals and not by the DARC signal itself.
TABLE 3
MPX component Description
RDS RDS deviates the main carrier 3 kHz (4%)
Pilot tone Pilot tone deviates the main carrier 6.75 kHz (9%)
Stereo signal (M&S) “Normal” stereophonic M- and S-signal created by representative levels of noise weighted in accordance with Rec. ITU-R BS.559. The deviation thus corresponds to the present-day practice (see Rec. ITU-R BS.641)
DARC The deviation of the main carrier caused by DARC varies between 3 kHz (4%) and 7.5 kHz (10%), controlled by the S-signal (a feature inherent in the DARC system)
14 Rec. ITU-R BS.1194-2
1194-16
– 97 – 96 – 95 – 94 – 93
10–1
10–2
10–3
10–4
10–5
10–6
– 96.5 – 95.5 – 94.5 – 93.5– 93,5– 94,5– 95,5– 96,5
FIGURE 16RDS BER as a function of receiver input level for
different multiplex content
Receiver input level (dBm)
RD
S B
ER
RDSRDS + PilotRDS + Pilot + DARC(L)RDS + Pilot + M and SRDS + Pilot + M and S + DARC(L)

Rec. ITU-R BS.1194-2 15
The measuring arrangement is shown in Figure 17. The DARC modulator used is made by EIDEN. The receiver used was a STUDER A764 with an external filter and a special product demodulator. For the recovery of RDS data (clock and data) a special bi-phase demodulator has been used.
1194-17
T D T C T CT D
R D
R C
R C
R D
FIGURE 17
Measuring arrangement for compatibility with RDS
BER BER
DARC RDS
6 dB 0 dB
attenuator
Noise
Mixer
Stereocoder
FMmodulator
FMtuner
Filterdetector
RDSdemodulator
L
R
LR
The measurements presented in this Recommendation show that the RDS performance is not affected by the introduction of another sub-carrier system in accordance with the DARC specification.

16 Rec. ITU-R BS.1194-2
3.4 Protection ratios
Note that some tests have indicated that at certain sub-carrier amplitudes, the ability of the receivers to reject interference from adjacent channels is affected by the presence of the DARC signal on the interfering source. For example, when an interfering signal on an adjacent channel was carrying a DARC signal which deviated the main FM carrier by 7.5 kHz, as well as an RDS signal which deviated the main FM carrier by 3 kHz, the required level of C/I for the range of receivers tested increased by up to 3 dB, but this was still below the criteria given in Recommendation ITU-R BS.412. In the case of high injection levels, attention will need to be paid to levels of deviation of sub-carriers to ensure conformance with protection ratios on which service planning is based.
3.4.1 Protection ratio for FM sound signals
The measurements were made in accordance with Recommendation ITU-R BS.641. Figure 18 shows the diagram of the measuring system. The unwanted signals comprised monaural coloured noise and the DARC signal.
1194-18
FIGURE 18
Diagram of the measuring system
Wanted signal
Unwanted signal
500 Hz
Coloured noise
PN generator
Stereo encoder(monaural or stereo)
Stereo encoder(monaural)
LMSKmodulator
MixerFrequencymodulator
B
Psophometer Tuner
Frequencymodulator
AATT
ATT
Mixer
Figure 19 shows the result of measurement for monaural sound signals. Figure 20 shows the result of measurement for stereo sound signals. The measurement results show that the interference from the DARC signal can be controlled to a level below the standard specified in Recommendation ITU-R BS.412 for various tuners.
Figure 21 shows the results of measurements for stereo sound signals interfered with by either the DARC signal or the RDS signal. Frequency components deteriorated by interference from the DARC signal are higher than those for the RDS signal.

Rec. ITU-R BS.1194-2 17
1194-19
a
a
0 100 200 300 400
40
20
0
– 20
– 40
– 60
FIGURE 19
Protection ratios of monaural sound signals interfered with by DARC signalsR
adio
-fre
quen
cy p
rote
ctio
n ra
tio (d
B)
Difference between the wanted andinterfering carrier frequency (kHz)
Rec. ITU-R BS.412
Curve corresponding to the receiver used in Fig. 16
18 Rec. ITU-R BS.1194-2
1194-20
a
a
0 100 200 300 400
40
20
0
– 20
– 40
– 60
60
FIGURE 20
Protection ratios of stereo sound signals interfered with by DARC signals
Rad
io-f
requ
ency
pro
tect
ion
ratio
(dB
)
Difference between the wanted andinterfering carrier frequency (kHz)
Rec. ITU-R BS.412
Curve corresponding to the receiver used in Fig. 16

Rec. ITU-R BS.1194-2 19
1194-21
– 20
0
20
40
60
0 100 200
ABC
D
ABCD
In this measurement, the receiver correspondingto curve a in Figs. 14 and 15 was used.
DARC
RDS (3 kHz)
RDS (2 kHz)
No multiplexing signals
FIGURE 21
Protection ratios of stereo sound signals interfered with by multiplexed signals
Rad
io-f
requ
ency
pro
tect
ion
ratio
(dB
)
Difference between the wanted andinterfering carrier frequency (kHz)
Rec. ITU-R BS.412
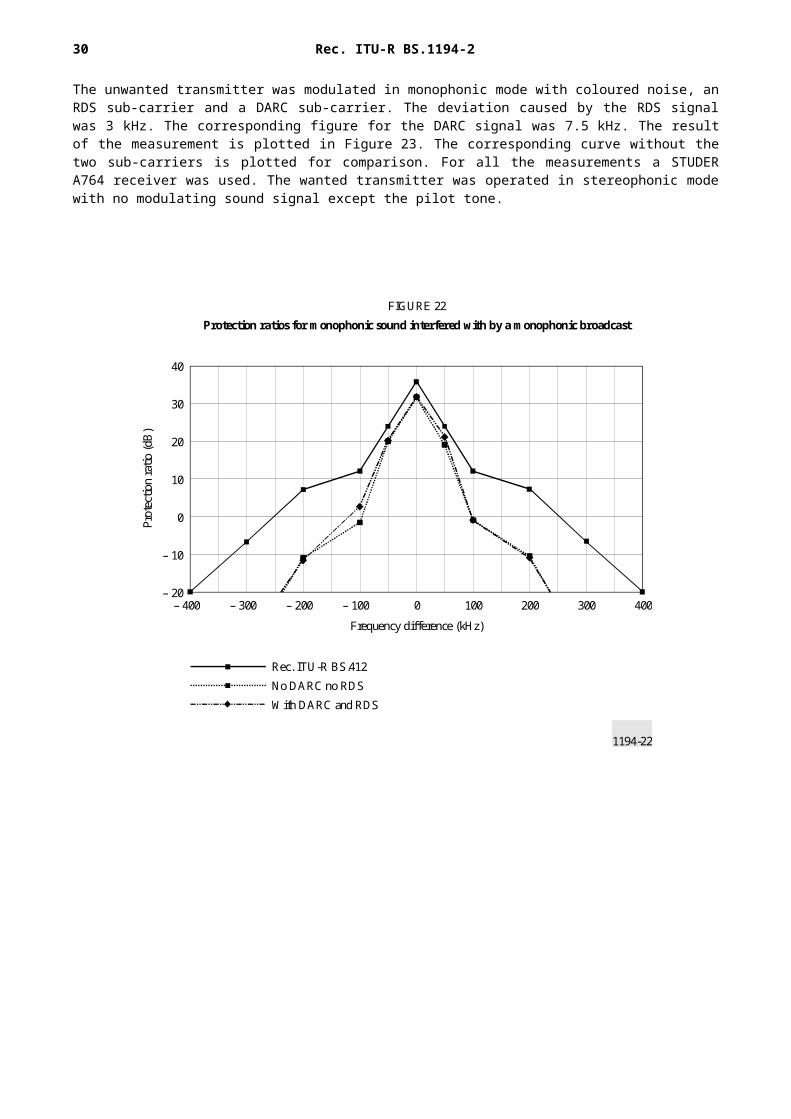
The wanted transmitter was operated in monophonic mode with no sound modulation. The unwanted transmitter was modulated in monophonic mode with coloured noise, an RDS sub-carrier and a DARC sub-carrier. The deviation caused by the RDS signal was 3 kHz. The corresponding figure for the DARC signal was 7.5 kHz. The result of the measurement is plotted in Figure 22. The corresponding curve without the two sub-carriers is plotted for comparison. For all the measurements a STUDER A764 receiver was used.
20 Rec. ITU-R BS.1194-2
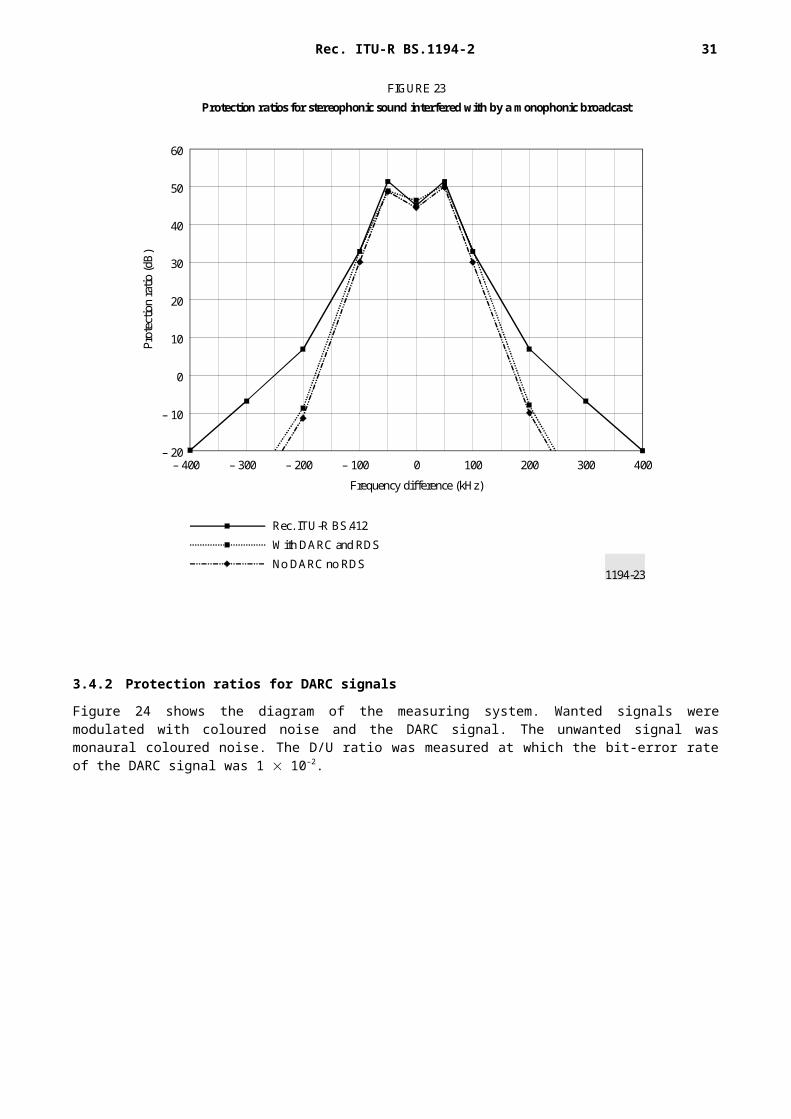
The unwanted transmitter was modulated in monophonic mode with coloured noise, an RDS sub-carrier and a DARC sub-carrier. The deviation caused by the RDS signal was 3 kHz. The corresponding figure for the DARC signal was 7.5 kHz. The result of the measurement is plotted in Figure 23. The corresponding curve without the two sub-carriers is plotted for comparison. For all the measurements a STUDER A764 receiver was used. The wanted transmitter was operated in stereophonic mode with no modulating sound signal except the pilot tone.
1194-22
– 400 – 300 – 200 – 100 0 100 200 300 400– 20
– 10
0
10
20
30
40
FIGURE 22
Protection ratios for monophonic sound interfered with by a monophonic broadcast
Prot
ectio
n ra
tio (d
B)
Rec. ITU-R BS.412
No DARC no RDS
With DARC and RDS
Frequency difference (kHz)
Rec. ITU-R BS.1194-2 21
1194-23
– 20
– 10
0
10
20
30
40
50
60
– 400 – 300 – 200 – 100 0 100 200 300 400
Prot
ectio
n ra
tio (d
B)
Frequency difference (kHz)
Rec. ITU-R BS.412
With DARC and RDS
No DARC no RDS
FIGURE 23
Protection ratios for stereophonic sound interfered with by a monophonic broadcast
3.4.2 Protection ratios for DARC signals
Figure 24 shows the diagram of the measuring system. Wanted signals were modulated with coloured noise and the DARC signal. The unwanted signal was monaural coloured noise. The D/U ratio was measured at which the bit-error rate of the DARC signal was 1 10–2.

22 Rec. ITU-R BS.1194-2
1194-24
FIGURE 24
Diagram of the measuring system
Wanted signal
Unwanted signal
Coloured noise Stereo encoder
PN generator LMSKmodulator
Mixer
Frequencymodulator B
Mixer
Error rateanalyser Tuner
Coloured noise Stereo encoder(monaural)
Frequencymodulator A Attenuator
Attenuator
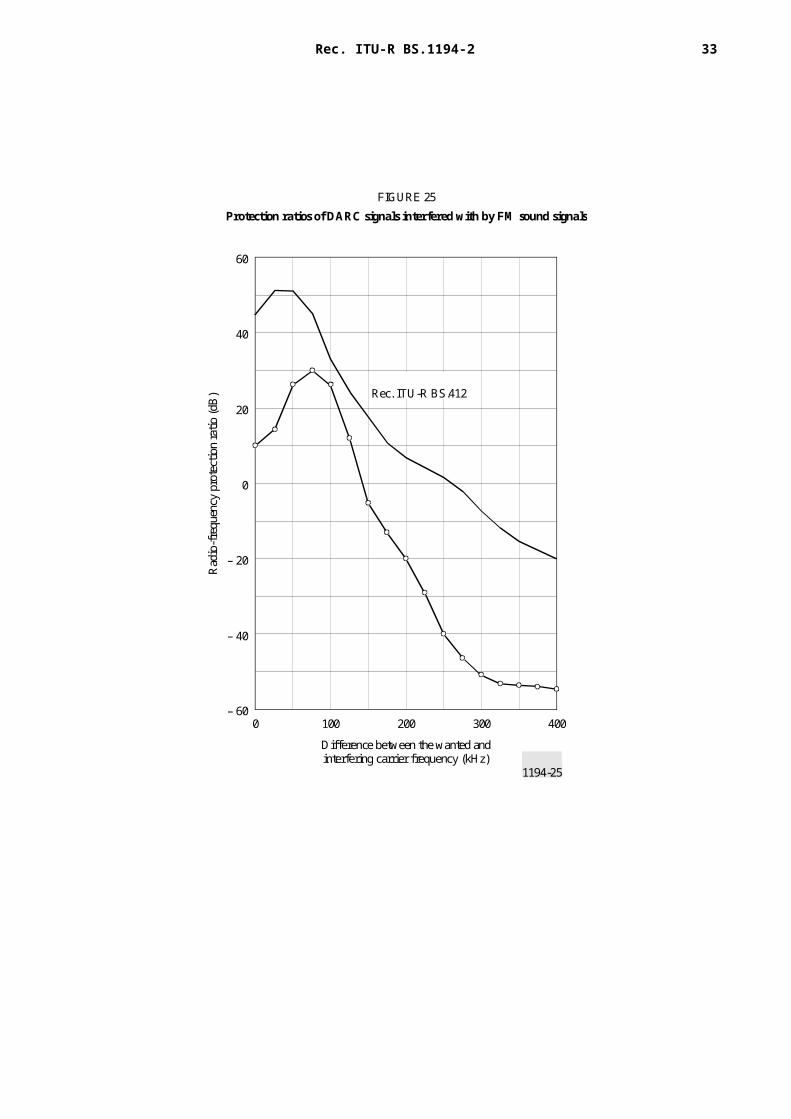
Figure 25 shows the result of measurements taken. The deterioration could also be controlled to a level below the criteria.
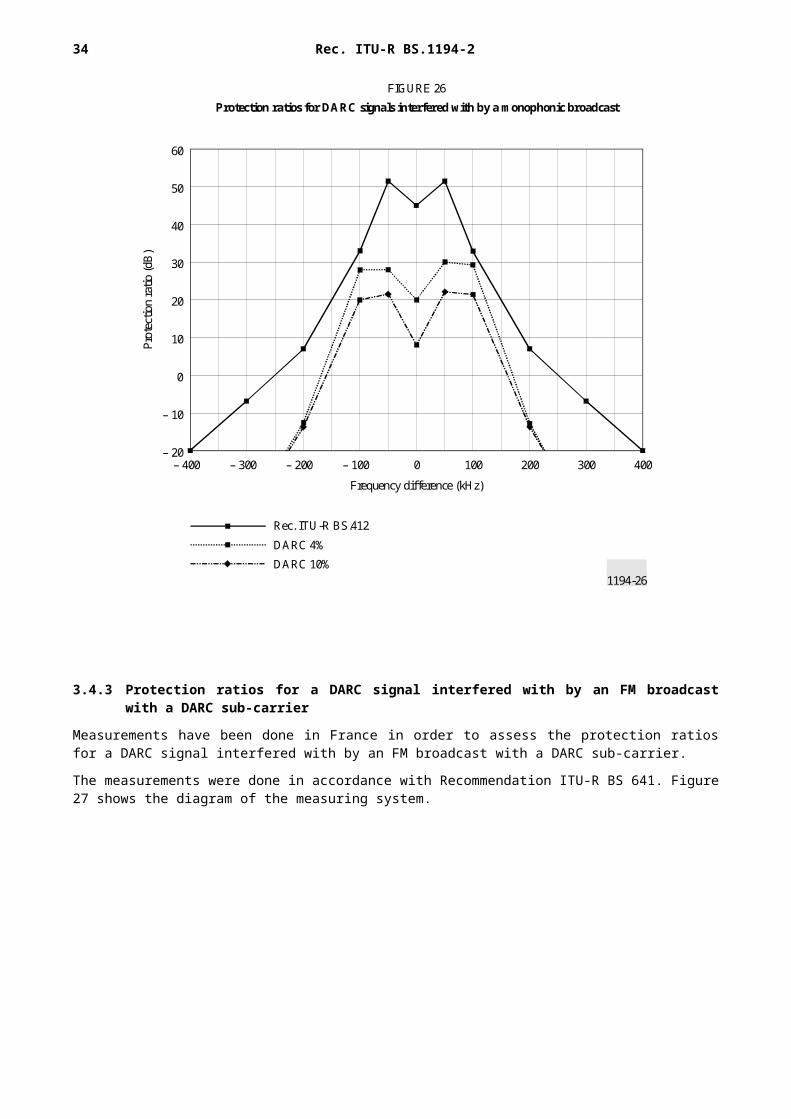
The stereophonic sound and RDS parameters of the wanted VHF/FM channel, which also was carrying the wanted DARC signal, were in accordance with Recommendations ITU-R BS.450 and ITU-R BS.643 using 2 kHz deviation for the RDS signal. The unwanted signal was a monophonic signal without RDS or DARC. Figure 26 shows the results for DARC deviations of 3 kHz and 7.5 kHz. In both cases the protection ratio is less than that required in Recommendation ITU-R BS.412 for stereophonic broadcast.

Rec. ITU-R BS.1194-2 23
1194-25
0 100 200 300 400
60
40
20
0
– 20
– 40
– 60
FIGURE 25
Protection ratios of DARC signals interfered with by FM sound signalsR
adio
-fre
quen
cy p
rote
ctio
n ra
tio (d
B) Rec. ITU-R BS.412
Difference between the wanted andinterfering carrier frequency (kHz)

24 Rec. ITU-R BS.1194-2
1194-26
– 20
– 10
0
10
20
30
40
50
60
– 400 – 300 – 200 – 100 0 100 200 300 400
FIGURE 26
Protection ratios for DARC signals interfered with by a monophonic broadcast
Prot
ectio
n ra
tio (d
B)
Rec. ITU-R BS.412
DARC 4%
DARC 10%
Frequency difference (kHz)
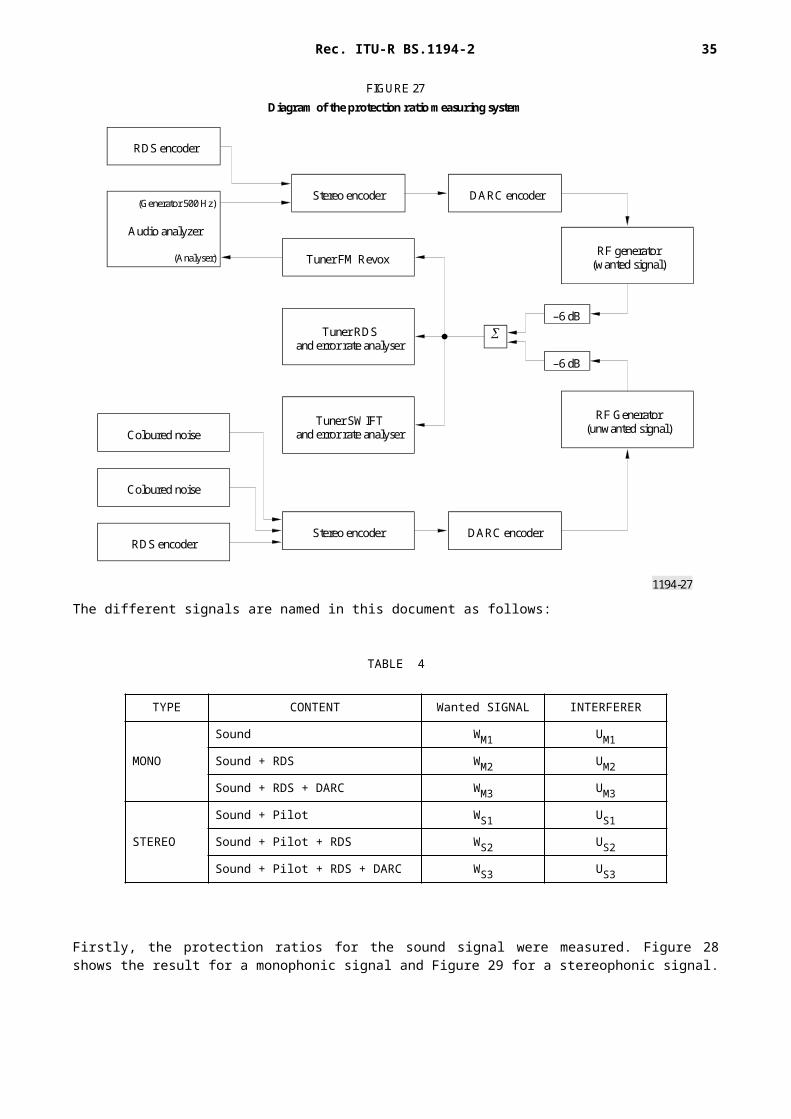
3.4.3 Protection ratios for a DARC signal interfered with by an FM broadcast with a DARC sub-carrier
Measurements have been done in France in order to assess the protection ratios for a DARC signal interfered with by an FM broadcast with a DARC sub-carrier.
The measurements were done in accordance with Recommendation ITU-R BS 641. Figure 27 shows the diagram of the measuring system.

Rec. ITU-R BS.1194-2 25
1194-27
–6 dB
–6 dB
Stereo encoder
Tuner FM Revox
DARC encoder
RDS encoder
Tuner RDSand error rate analyser
Tuner SWIFTand error rate analyser
Stereo encoder DARC encoder
Audio analyzer
(Generator 500 Hz)
(Analyser)RF generator
(wanted signal)
Coloured noise
Coloured noise
RDS encoder
RF Generator (unwanted signal)
FIGURE 27
Diagram of the protection ratio measuring system
The different signals are named in this document as follows:
TABLE 4
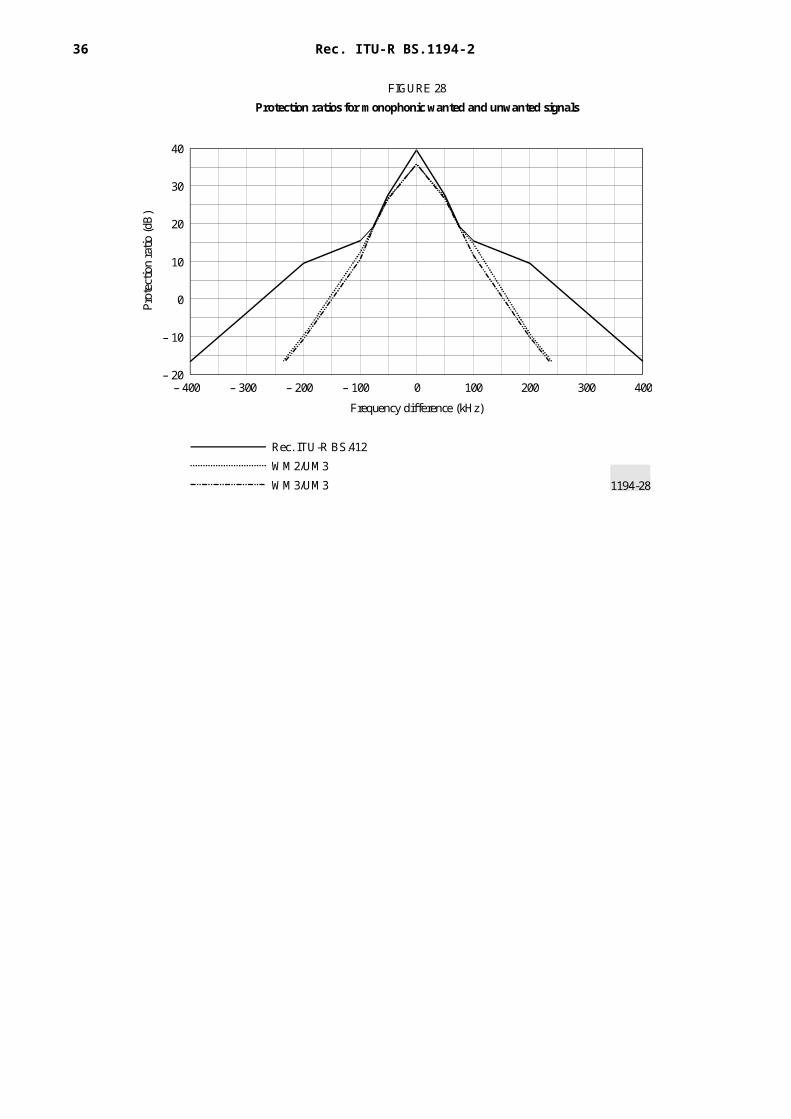
Firstly, the protection ratios for the sound signal were measured. Figure 28 shows the result for a monophonic signal and Figure 29 for a stereophonic signal.
TYPE CONTENT Wanted SIGNAL INTERFERER
Sound WM1 UM1
MONO Sound + RDS WM2 UM2
Sound + RDS + DARC WM3 UM3
Sound + Pilot WS1 US1
STEREO Sound + Pilot + RDS WS2 US2
Sound + Pilot + RDS + DARC WS3 US3
26 Rec. ITU-R BS.1194-2
1194-28
– 400 – 300 – 200 – 100 0 100 200 300 400– 20
– 10
0
10
20
30
40
FIGURE 28
Protection ratios for monophonic wanted and unwanted signals
Rec. ITU-R BS.412
WM2/UM3
WM3/UM3
Prot
ectio
n ra
tio (d
B)
Frequency difference (kHz)

Rec. ITU-R BS.1194-2 27
1194-29
– 20
– 10
0
10
20
30
40
50
60
– 400 – 300 – 200 – 100 0 100 200 300 400
FIGURE 29
Protection ratios for wanted stereophonic and unwanted monophonic signals
Rec. ITU-R BS.412
WS2/UM3
WS3/UM3
Prot
ectio
n ra
tio (d
B)
Frequency difference (kHz)

28 Rec. ITU-R BS.1194-2
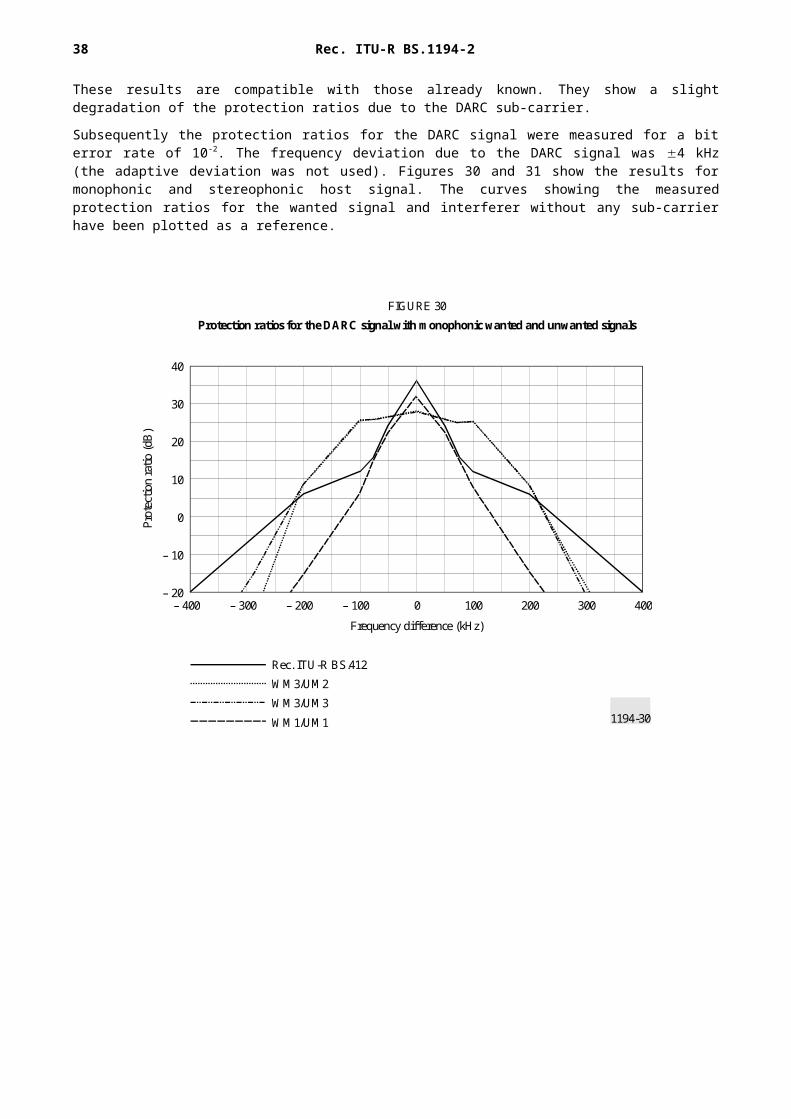
These results are compatible with those already known. They show a slight degradation of the protection ratios due to the DARC sub-carrier.
Subsequently the protection ratios for the DARC signal were measured for a bit error rate of 10-2. The frequency deviation due to the DARC signal was 4 kHz (the adaptive deviation was not used). Figures 30 and 31 show the results for monophonic and stereophonic host signal. The curves showing the measured protection ratios for the wanted signal and interferer without any sub-carrier have been plotted as a reference.
1194-30
– 400 – 300 – 200 – 100 0 100 200 300 400– 20
– 10
0
10
20
30
40
FIGURE 30
Protection ratios for the DARC signal with monophonic wanted and unwanted signals
Rec. ITU-R BS.412
WM3/UM2
WM3/UM3
WM1/UM1
Prot
ectio
n ra
tio (d
B)
Frequency difference (kHz)

Rec. ITU-R BS.1194-2 29
1194-31
– 20
– 10
0
10
20
30
40
50
60
– 400 – 300 – 200 – 100 0 100 200 300 400
FIGURE 31
Protection ratios for the DARC signal with stereophonic wanted signaland monophonic unwanted signal
Rec. ITU-R BS.412
WS3/UM2
WS3/UM3
WS1/UM1 (sound signal)
Prot
ectio
n ra
tio (d
B)
Frequency difference (kHz)
These curves show again a slight degradation of the protection ratios due to the DARC sub-carrier, in comparison with the case where only an RDS sub-carrier is inserted. Compared with the protection ratios for a signal without any sub-carrier the impairment is more significant. Recommendation ITU-R BS.412 shown in Figures 30 and 31 is there for reference because it does not apply to digital signals.
30 Rec. ITU-R BS.1194-2
ANNEX 2
System description: System B, the High Speed Data System (HSDS)
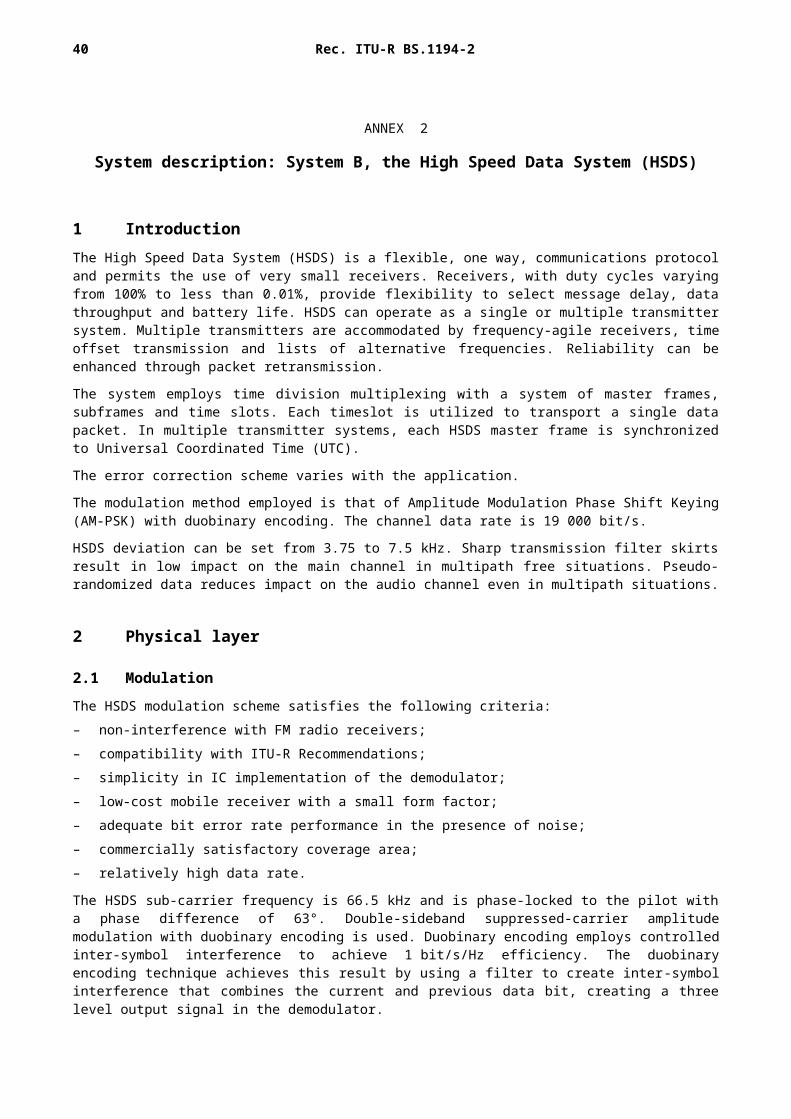
1 Introduction The High Speed Data System (HSDS) is a flexible, one way, communications protocol and permits the use of very small receivers. Receivers, with duty cycles varying from 100% to less than 0.01%, provide flexibility to select message delay, data throughput and battery life. HSDS can operate as a single or multiple transmitter system. Multiple transmitters are accommodated by frequency-agile receivers, time offset transmission and lists of alternative frequencies. Reliability can be enhanced through packet retransmission.
The system employs time division multiplexing with a system of master frames, subframes and time slots. Each timeslot is utilized to transport a single data packet. In multiple transmitter systems, each HSDS master frame is synchronized to Universal Coordinated Time (UTC).
The error correction scheme varies with the application.
The modulation method employed is that of Amplitude Modulation Phase Shift Keying (AM-PSK) with duobinary encoding. The channel data rate is 19 000 bit/s.
HSDS deviation can be set from 3.75 to 7.5 kHz. Sharp transmission filter skirts result in low impact on the main channel in multipath free situations. Pseudo-randomized data reduces impact on the audio channel even in multipath situations.
2 Physical layer
2.1 Modulation
The HSDS modulation scheme satisfies the following criteria:– non-interference with FM radio receivers;– compatibility with ITU-R Recommendations;– simplicity in IC implementation of the demodulator;– low-cost mobile receiver with a small form factor;– adequate bit error rate performance in the presence of noise;– commercially satisfactory coverage area;– relatively high data rate.
The HSDS sub-carrier frequency is 66.5 kHz and is phase-locked to the pilot with a phase difference of 63°. Double-sideband suppressed-carrier amplitude modulation with duobinary encoding is used. Duobinary encoding employs controlled inter-symbol interference to achieve 1 bit/s/Hz efficiency. The duobinary encoding technique achieves this result by using a filter to create inter-symbol interference that combines the current and previous data bit, creating a three level output signal in the demodulator.
2.2 Compatibility with main channel audio
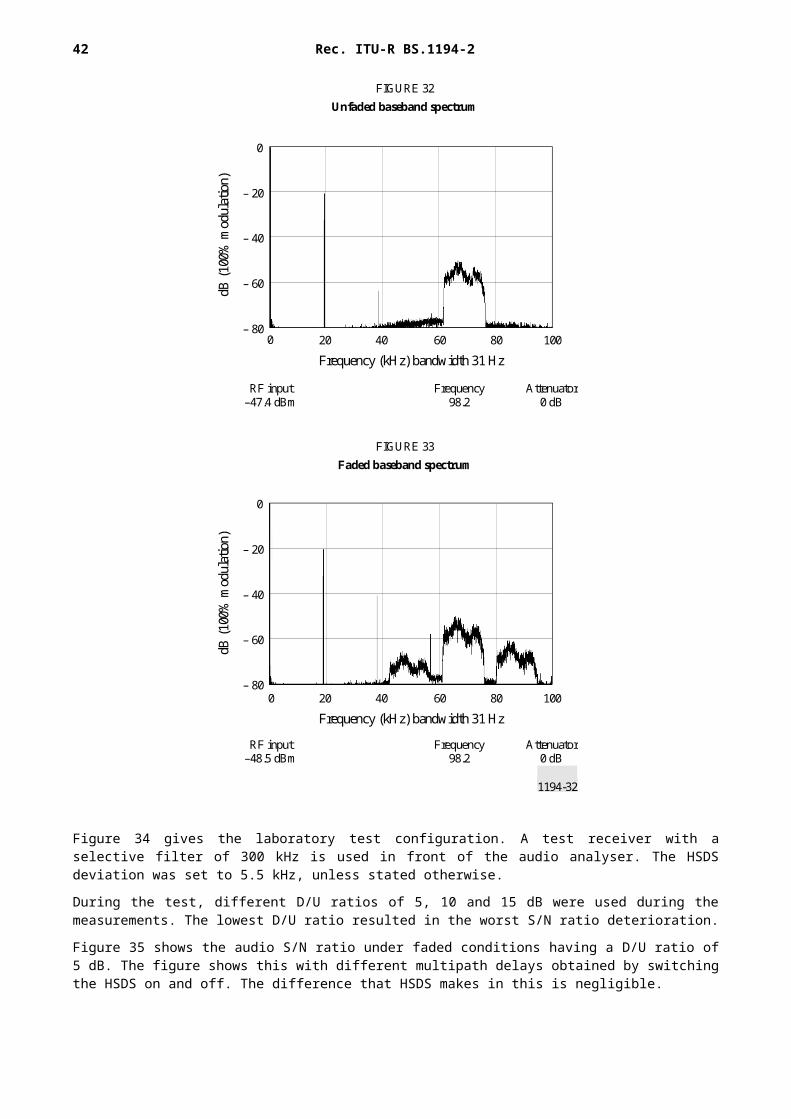
HSDS is more than 60 dB below the pilot outside the sub-carrier envelope and uses data randomization to “whiten” any otherwise audible signal elements – avoiding the generation of tones in the audio portion of the band. Lab tests showing the compatibility with main channel audio in a multipath environment are summarized below.
For these tests the RF Channel Simulator was set to assume static multipath characteristics. Figure 32 shows a screen dump of the baseband spectrum in an unfaded situation, Figure 33 shows the same baseband in a faded situation having a Desired to Undesired (D/U) ratio of 5 dB, delay of 8 s and Phase Shift of 120º.
Under these kind of conditions the audio Signal to Noise (S/N) ratio may be deteriorated by the sub-carrier.
Rec. ITU-R BS.1194-2 31
1194-32
0
– 20
– 40
– 60
– 800 20 40 60 80 100
0
– 20
– 40
– 60
– 800 20 40 60 80 100
Frequency (kHz) bandwidth 31 Hz
dB (1
00%
mod
ulat
ion)
FIGURE 32Unfaded baseband spectrum
RF input–47.4 dBm
Frequency98.2
Attenuator0 dB
Frequency (kHz) bandwidth 31 Hz
dB (1
00%
mod
ulat
ion)
FIGURE 33Faded baseband spectrum
RF input–48.5 dBm
Frequency98.2
Attenuator0 dB
Figure 34 gives the laboratory test configuration. A test receiver with a selective filter of 300 kHz is used in front of the audio analyser. The HSDS deviation was set to 5.5 kHz, unless stated otherwise.
During the test, different D/U ratios of 5, 10 and 15 dB were used during the measurements. The lowest D/U ratio resulted in the worst S/N ratio deterioration.
Figure 35 shows the audio S/N ratio under faded conditions having a D/U ratio of 5 dB. The figure shows this with different multipath delays obtained by switching the HSDS on and off. The difference that HSDS makes in this is negligible.

32 Rec. ITU-R BS.1194-2
1194-34
HSDS generator(TTM) FM exciter
Channelsimulator
StepattenuatorStereo coder
Spectrumanalyser
Test receiverR and S ESVB
Audio analyserR and S FAM
Multiplexer
Pilot
1 kHz tonegenerator
FIGURE 34Audio S/N ratio laboratory test configuration
10.7 MHz
1194-35
0 30 60 90 120 150 1800
10
20
30
40
50
60
Phase shift (degrees)
Delay = 4 s, no HSDSDelay = 4 s, with HSDSDelay = 8 s, no HSDSDelay = 8 s, with HSDSDelay = 12 s, no HSDSDelay = 12 s, with HSDS
FIGURE 35Audio S/N ratio in multipath phase shift
S/N
(dB
)
Rec. ITU-R BS.1194-2 33
During the test different phase shifts of up to 180º were used during the measurements. As expected, the greatest phase shift resulted in the worst S/N ratio deterioration.
Figure 36 shows the audio S/N ratio having a phase shift of 180º as a function of the multipath delay. This was done for three different D/U ratios.
1194-36
2 4 6 8 10 12 140
10
20
30
40
50
60
Delay time (s)
FIGURE 36Audio S/N ratio in multipath delay
Phase shift = 180°
DU = 15 dBDU = 10 dBDU = 5 dB
S/N
(dB
)
Figure 37 shows the audio S/N ratio with a phase shift of 180º as a function of the deviation. This was done for three different D/U ratios.
34 Rec. ITU-R BS.1194-2
1194-37
2 4 6 8 10 1225
30
35
40
45
50
55
S/N (dB), D/U = 15 dBS/N (dB), D/U = 10 dBS/N (dB), D/U = 5 dB
FIGURE 37Audio S/N ratio vs. deviation in multipath
Deviation (%)
Delay = 4 s, phase shift = 180°
S/N
(dB
)
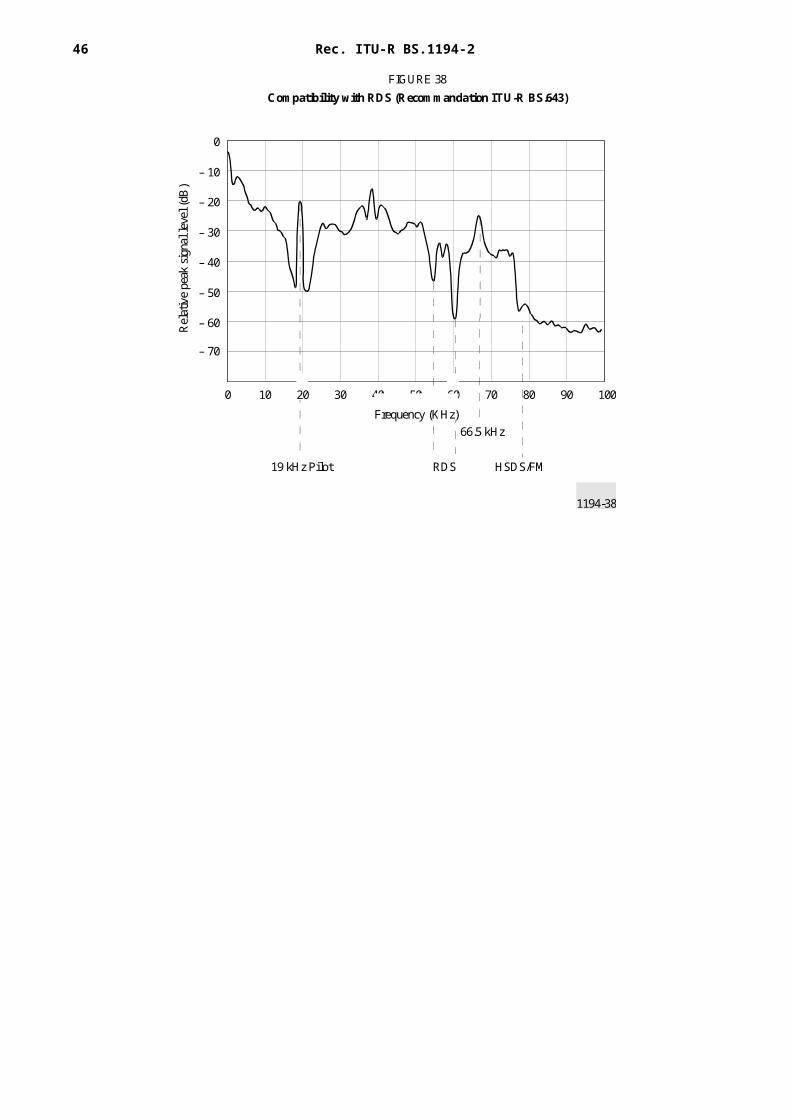
2.3 Compatibility with RDS (Recommendation ITU-R BS.643)
The chart in Figure 38 illustrates spectral compatibility with RDS.
1194-38
19 kHz Pilot RDS HSDS/FM
0 10 20 30 40 50 60 70 80 90 100
0
– 10
– 20
– 30
– 40
– 50
– 60
– 70
66.5 kHz
FIGURE 38Compatibility with RDS (Recommandation ITU-R BS.643)
Rel
ativ
e pe
ak si
gnal
leve
l (dB
)
Frequency (KHz)
Rec. ITU-R BS.1194-2 35
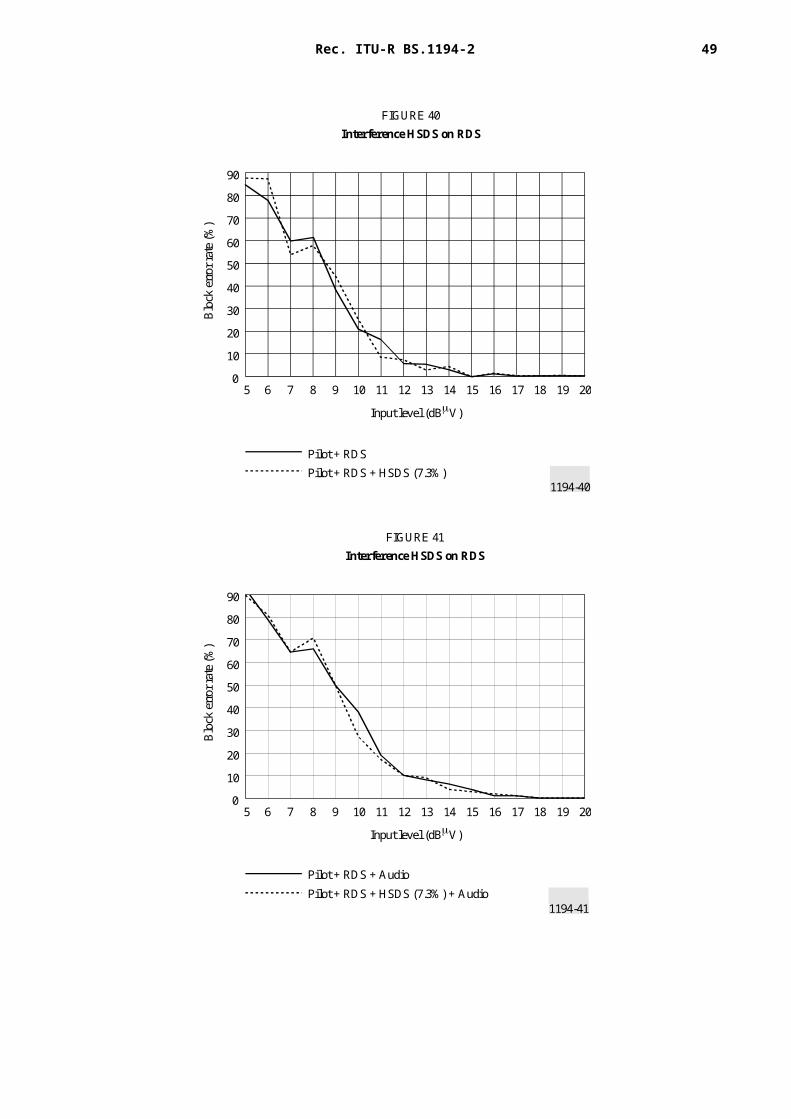
Lab tests showing the compatibility of HSDS with RDS are summarized below. Figure 39 illustrates the measuring system for a laboratory test on the HSDS compatibility with RDS. The transmitter was modulated with RDS, HSDS and coloured noise. A 6 dB attenuator caused an S-signal in the multiplex approximately 10 dB lower than the M-signal. The deviation was: audio 60 kHz, pilot 7.5 kHz and RDS 2 kHz. The multiplex output of the receiver was fed into the RDS decoder with a counter for the block error rate. The block error rate gives the percentages of fault blocks, during the preceding 100 blocks. Ten block error rates per measurement point were measured in a 20 second period and then averaged.
1194-39
6 dB
L
R
SCA SCA
RDS encoderTeli
HSDSgenerator
CCIR 559R and S SUF2
Stereo coder
TransmitterR and S SMG
Pilot
DUT receiverStuder
RDS decoderRE 331
Multiplexerout
Rood SC201
FIGURE 39RDS compatibility laboratory constellation
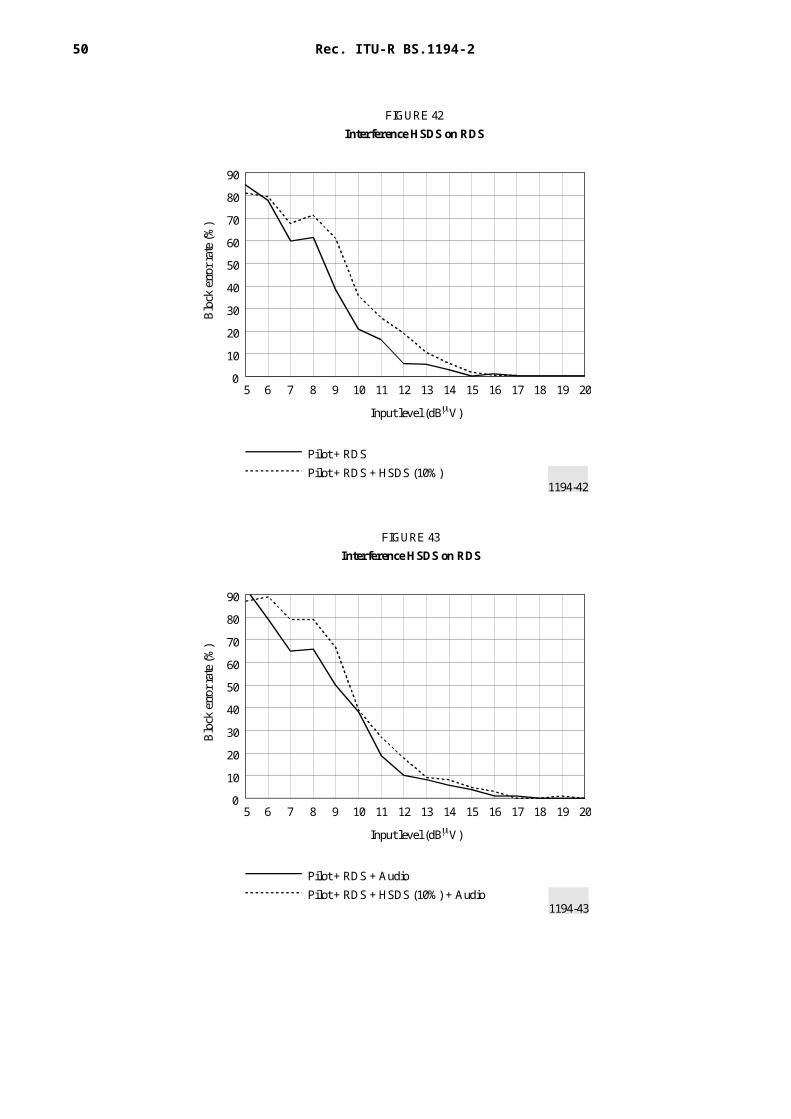
Figures 40 to 43 show the results of the test. The results show the influence of the HSDS deviation (5.5 kHz and 7.5 kHz) and the effect of the presence of the main audio channel. It can be seen that the HSDS system did not interfere with RDS.
36 Rec. ITU-R BS.1194-2
1194-40
5 6 7 8 9 10 11 12 13 14 15 16 17 18 19 20
10
20
0
30
40
50
60
70
80
90
Input level (dBV)
Blo
ck e
rror
rate
(%)
FIGURE 40Interference HSDS on RDS
Pilot + RDSPilot + RDS + HSDS (7.3%)
1194-41
5 6 7 8 9 10 11 12 13 14 15 16 17 18 19 20
10
20
0
30
40
50
60
70
80
90
Input level (dBV)
Blo
ck e
rror
rate
(%)
FIGURE 41Interference HSDS on RDS
Pilot + RDS + Audio
Pilot + RDS + HSDS (7.3%) + Audio

Rec. ITU-R BS.1194-2 37
1194-42
5 6 7 8 9 10 11 12 13 14 15 16 17 18 19 20
10
20
0
30
40
50
60
70
80
90
Input level (dBV)
Blo
ck e
rror
rate
(%)
FIGURE 42Interference HSDS on RDS
Pilot + RDSPilot + RDS + HSDS (10%)
1194-43
5 6 7 8 9 10 11 12 13 14 15 16 17 18 19 20
10
20
0
30
40
50
60
70
80
90
Input level (dBV)
Blo
ck e
rror
rate
(%)
FIGURE 43Interference HSDS on RDS
Pilot + RDS + AudioPilot + RDS + HSDS (10%) + Audio
38 Rec. ITU-R BS.1194-2
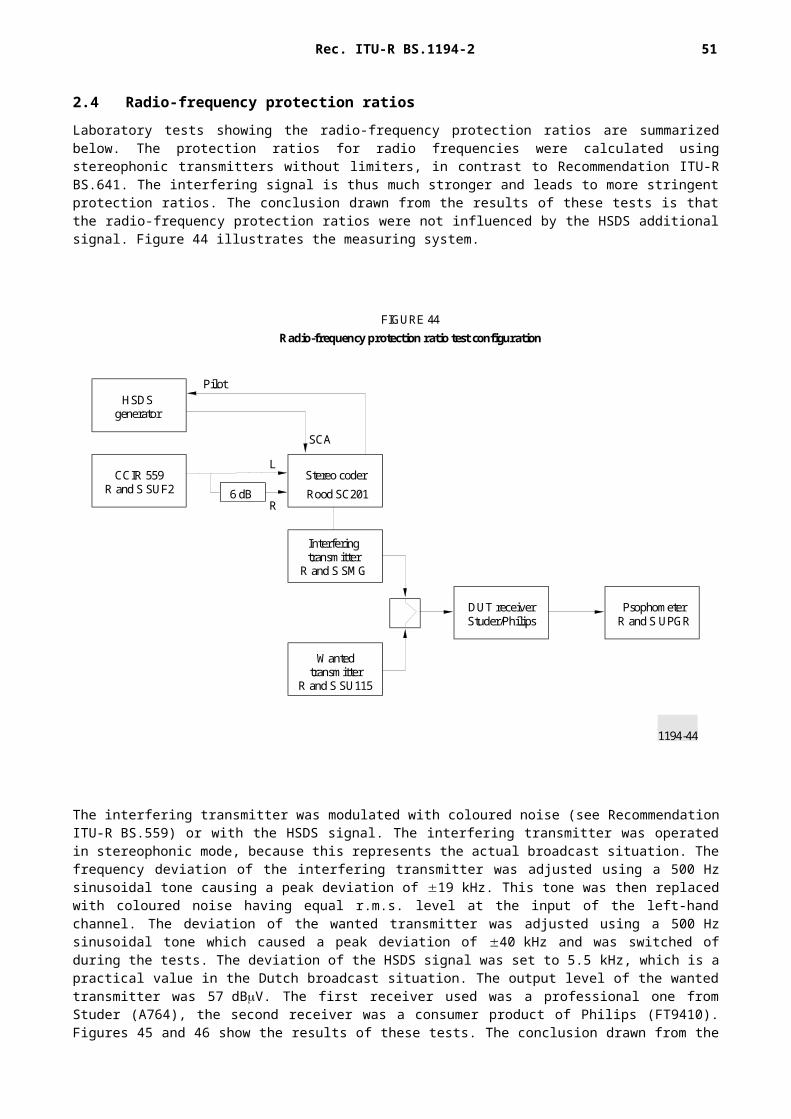
2.4 Radio-frequency protection ratios
Laboratory tests showing the radio-frequency protection ratios are summarized below. The protection ratios for radio frequencies were calculated using stereophonic transmitters without limiters, in contrast to Recommendation ITU-R BS.641. The interfering signal is thus much stronger and leads to more stringent protection ratios. The conclusion drawn from the results of these tests is that the radio-frequency protection ratios were not influenced by the HSDS additional signal. Figure 44 illustrates the measuring system.
1194-44
6 dB
L
R
SCA
HSDSgenerator
CCIR 559R and S SUF2 Rood SC201
Interferingtransmitter
R and S SMG
Pilot
DUT receiverStuder/Philips
PsophometerR and S UPGR
FIGURE 44Radio-frequency protection ratio test configuration
Wantedtransmitter
R and S SU115
Stereo coder
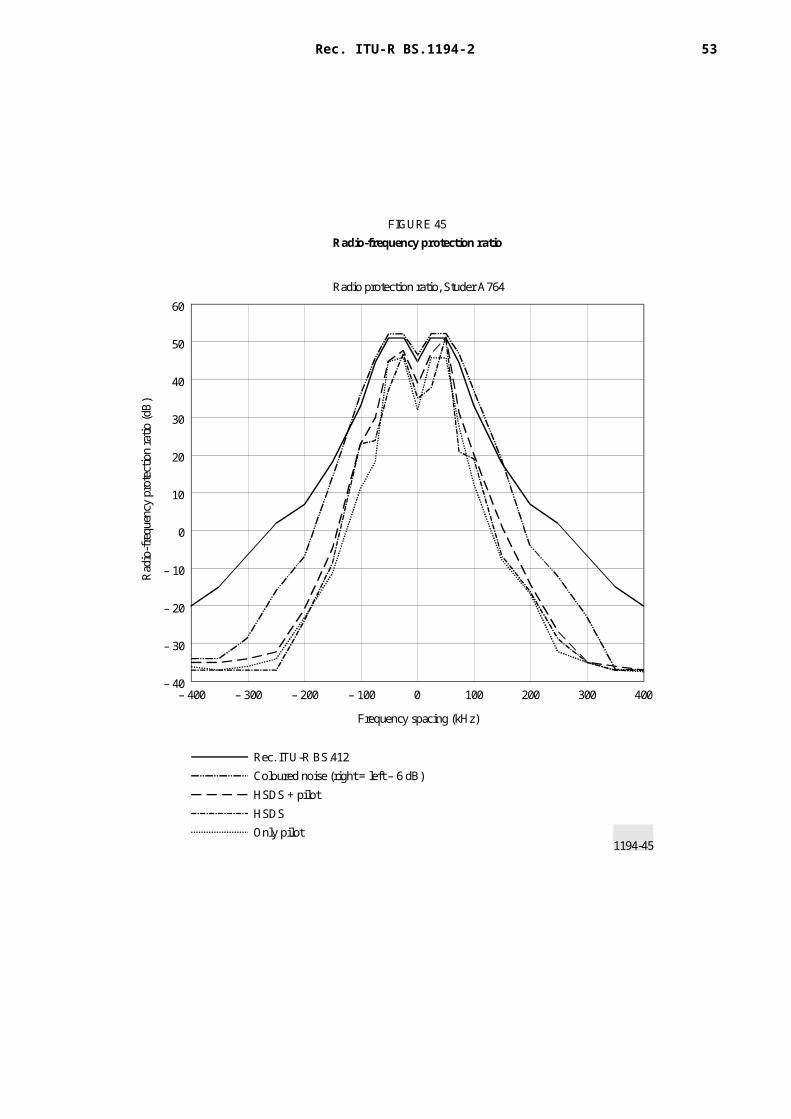
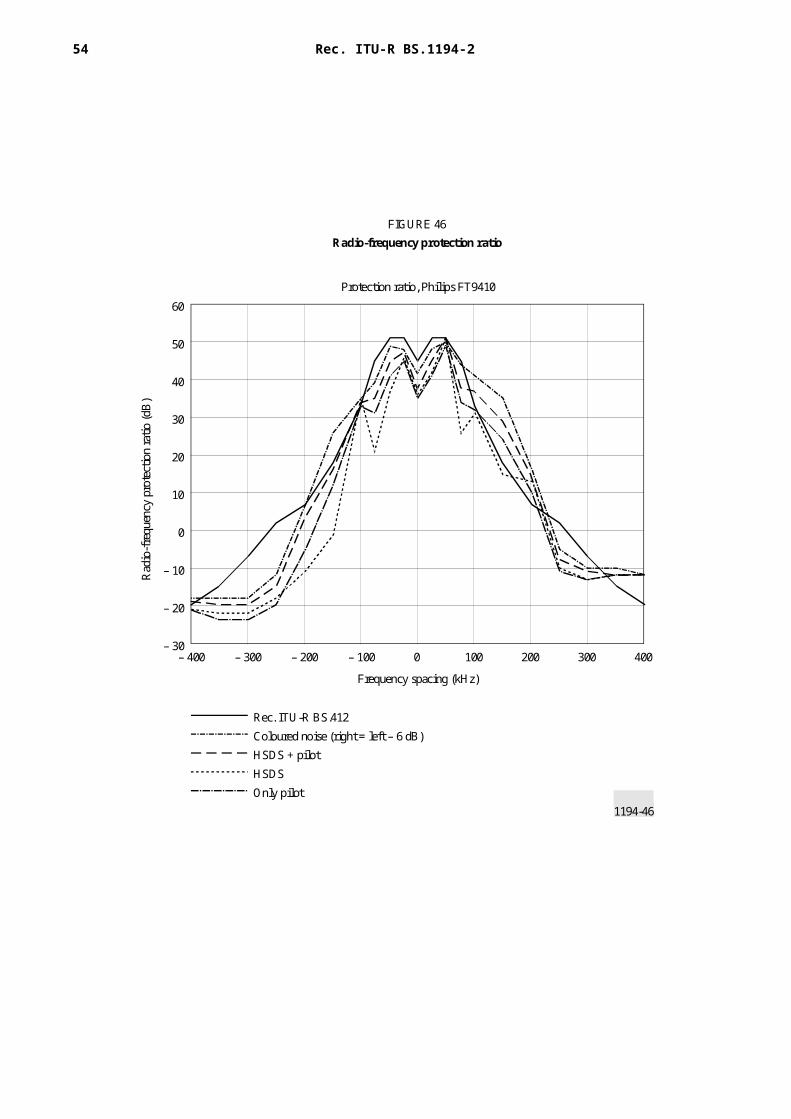
The interfering transmitter was modulated with coloured noise (see Recommendation ITU-R BS.559) or with the HSDS signal. The interfering transmitter was operated in stereophonic mode, because this represents the actual broadcast situation. The frequency deviation of the interfering transmitter was adjusted using a 500 Hz sinusoidal tone causing a peak deviation of 19 kHz. This tone was then replaced with coloured noise having equal r.m.s. level at the input of the left-hand channel. The deviation of the wanted transmitter was adjusted using a 500 Hz sinusoidal tone which caused a peak deviation of 40 kHz and was switched of during the tests. The deviation of the HSDS signal was set to 5.5 kHz, which is a practical value in the Dutch broadcast situation. The output level of the wanted transmitter was 57 dBV. The first receiver used was a professional one from Studer (A764), the second receiver was a consumer product of Philips (FT9410). Figures 45 and 46 show the results of these tests. The conclusion drawn from the results of these tests is that HSDS does not influence the radio-frequency protection ratios.

Rec. ITU-R BS.1194-2 39
1194-45
– 400 – 300 – 200 – 100 0 100 200 300 400– 40
– 30
– 20
– 10
0
10
20
30
40
50
60
Frequency spacing (kHz)
Rec. ITU-R BS.412Coloured noise (right = left – 6 dB)HSDS + pilotHSDSOnly pilot
Rad
io-f
requ
ency
pro
tect
ion
ratio
(dB
)
FIGURE 45Radio-frequency protection ratio
Radio protection ratio, Studer A764
40 Rec. ITU-R BS.1194-2
1194-46
– 400 – 300 – 200 – 100 0 100 200 300 400– 30
– 20
– 10
0
10
20
30
40
50
60
Frequency spacing (kHz)
Rec. ITU-R BS.412Coloured noise (right = left – 6 dB)HSDS + pilotHSDSOnly pilot
Rad
io-f
requ
ency
pro
tect
ion
ratio
(dB
)
FIGURE 46Radio-frequency protection ratio
Protection ratio, Philips FT9410

Rec. ITU-R BS.1194-2 41
3 Link layerThe link layer incorporates the features required for a single transmitter data link to be reliable. These features include the frame and packet structure (size, word synchronization, error detection and correction).
3.1 Packet structure
HSDS employs fixed-length data packets. Figure 47 illustrates the packet structure used in the HSDS Protocol. Each packet is 260 bits long. Packet format bits in each packet define the packet's structure. A typical packet consists of a word synchronization flag, Error Correction Code (ECC), information bits and error detection code.
1194-47
D0D1D2D3D4D5D6D7
W0
W1
W2
W3
W4
W5
W6
W7
W8
W9
W10
W11
W12
W13
W14
W15
W16
W17
W18
W19
Slot1021
Slot1022
Slot1023
Slot1
Slot0
Cntrl2
Cntrl1
Cntrl0
260 bit packet (13.68 ms) in each slot
64 s
ubfr
ames
3 control slots 1024 message slots
Subframe 0
Subframe 1
Subframe 2
Subframe 62
Subframe 63
20 bit flag
4 bits ECC
8 bitsrandomized
data
One 20 bit flag, twenty 12 bit words
FIGURE 47Frame and packet structure
ECC8ECC4ECC2ECC1
42 Rec. ITU-R BS.1194-2
Information bits from higher layers consist of 18 octets (8 bits per octet) per packet. A two octet ITU-T standard 16 bit Cyclic Redundancy Check (CRC) g(x) = x16+x12+x5+1 is generated from the 18 octets and appended to the packet, thus creating a 20 octet link data unit. The first octet (the incrementing slot number) of the 20 octet data unit is exclusive OR'ed with each of the remaining 19 octets thus creating pseudo-randomized data to minimize signal distortions due to multipath reception, etc.
Appended to each octet of randomized data is 4 bits of Hamming ECC. This error correction method provides single bit error detection and correction in 12 bits, or 8.3% correction capability, is reasonably efficient and provides for ease of decoding. The generator matrix is:
To increase burst error correction capability, data is interleaved providing immunity to 20 bit error bursts. Word synchronization is established by a 20 bit flag sequence at the beginning of the packet. Table 5 shows the steps performed by the link layer transmitter encoder and the reverse steps performed by the receiver decoder.
TABLE 5
Packet structure encode and decode steps
Double error correction on a stream of packets (small blocks) is under test for applications having less severe power constraints and with requirements for higher data reliability.
D7 D6 D5 D4 D3 D2 D1 D0 C8 C4 C2 C1
1 0 0 0 0 0 0 0 1 1 0 0
0 1 0 0 0 0 0 0 1 0 1 1
0 0 1 0 0 0 0 0 1 0 1 0
0 0 0 1 0 0 0 0 1 0 0 1
0 0 0 0 1 0 0 0 0 1 1 1
0 0 0 0 0 1 0 0 0 1 1 0
0 0 0 0 0 0 1 0 0 1 0 1
0 0 0 0 0 0 0 1 0 0 1 1
Step Transmit encoder Receive decoder
1 Compute and add CRC Find flag
2 Randomize data De-interleave data
3 Add error correction Apply error correction
4 Interleave data De-randomize data
5 Add flag Compute and compare CRC

Rec. ITU-R BS.1194-2 43
3.2 Bit error rate performance
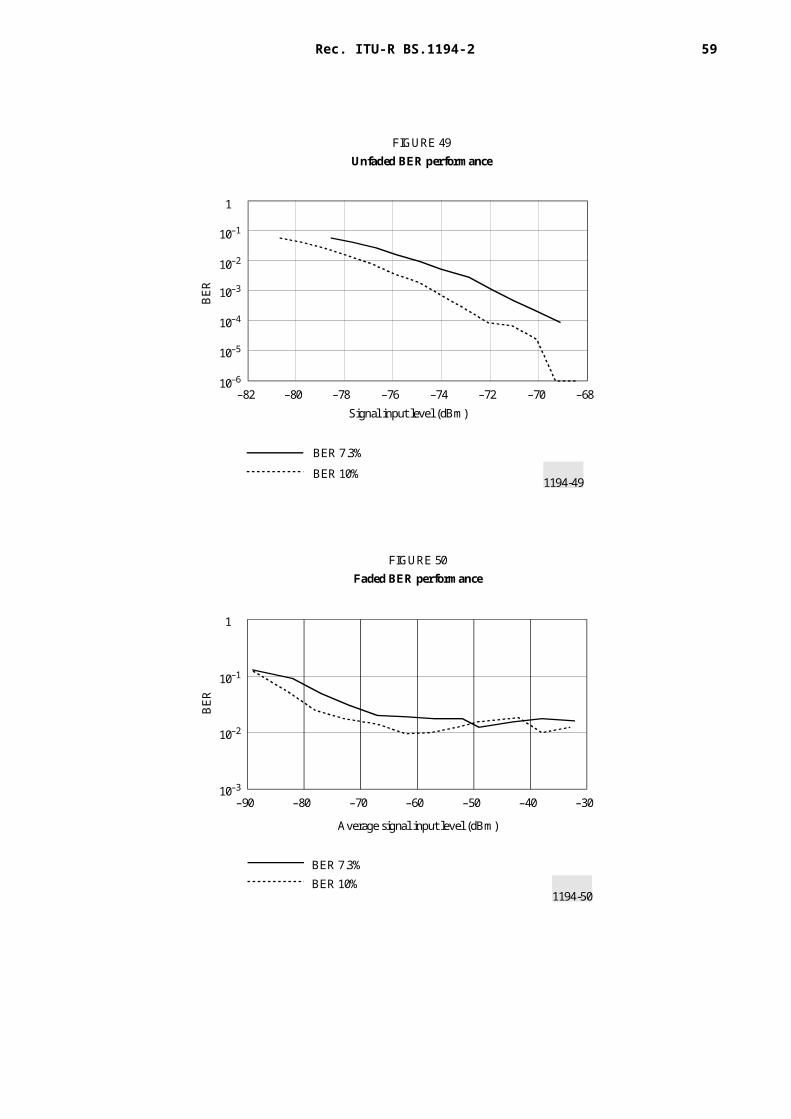
The Bit Error Rate (BER) performance under faded and unfaded conditions was evaluated using the test configuration illustrated in Figure 48. During the tests the main carrier was without audio modulation.
1194-48
HSDSGenerator (TTM)
Stereocoder
Pilot
FMexciter
Channelsimulator
Stepattenuator
Spectrumanalyser
Protocolanalyser
FIGURE 48BER laboratory test configuration
During the unfaded measurements the RF Channel Simulator (HP 11759C) was switched off. During the faded measurements a 4-tap Rayleigh channel was used, simulating a vehicle speed of 80 km/h. The tap settings are shown in Table 6 and are representative of the conditions observed whilst driving through rural Holland.
TABLE 6
RF channel simulator tap settings
Figure 49 shows the unfaded BER of the HSDS system as a function of the signal input level for deviations of 5.5 kHz and 7.5 kHz. Figure 50 shows this under faded conditions, with averaging.
Tap number Tap delay (s) Tap attenuation (dB)
1 0 0
2 0.15 6
3 0.50 7
4 3.35 15

44 Rec. ITU-R BS.1194-2
1194-49
–82 –80 –78 –76 –74 –72 –70 –68
1
10–1
10–2
10–3
10–4
10–5
10–6
Signal input level (dBm)
BER 7.3%
BER 10%
BER
FIGURE 49Unfaded BER performance
1194-50
–90 –80 –70 –60 –50 –40 –30
1
10–1
10–2
10–3
Average signal input level (dBm)
BER
FIGURE 50Faded BER performance
BER 7.3%BER 10%

Rec. ITU-R BS.1194-2 45
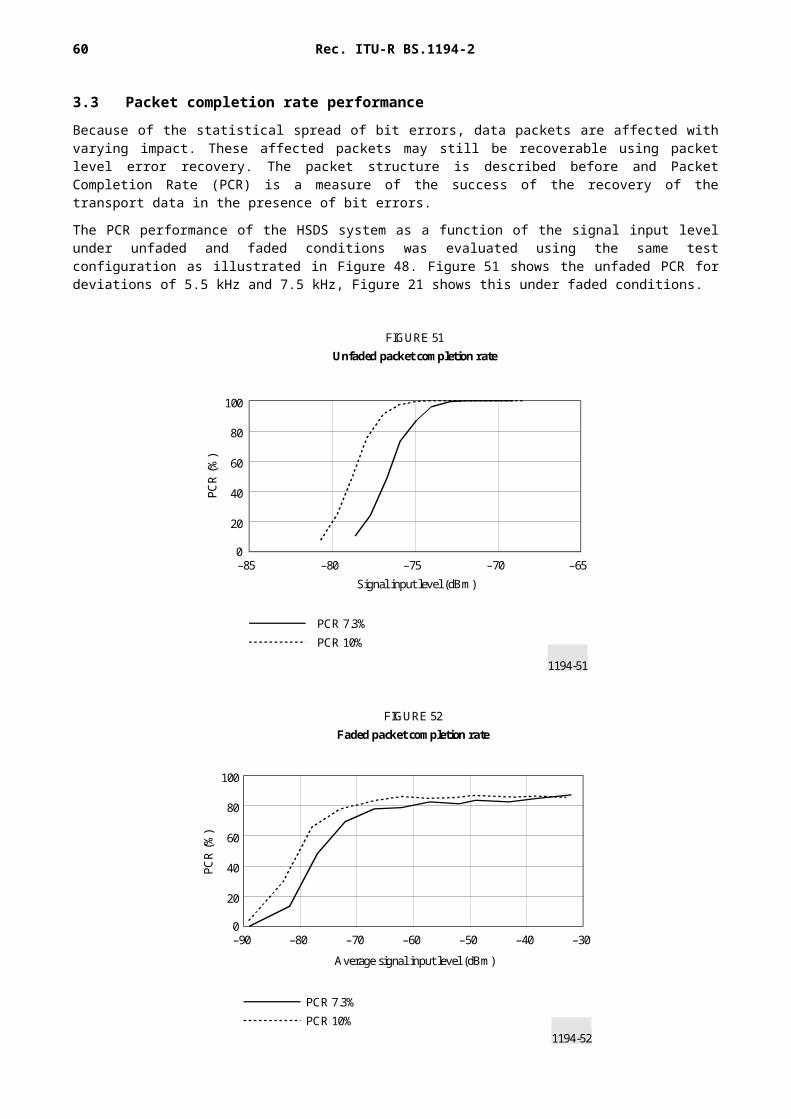
3.3 Packet completion rate performance
Because of the statistical spread of bit errors, data packets are affected with varying impact. These affected packets may still be recoverable using packet level error recovery. The packet structure is described before and Packet Completion Rate (PCR) is a measure of the success of the recovery of the transport data in the presence of bit errors.
The PCR performance of the HSDS system as a function of the signal input level under unfaded and faded conditions was evaluated using the same test configuration as illustrated in Figure 48. Figure 51 shows the unfaded PCR for deviations of 5.5 kHz and 7.5 kHz, Figure 21 shows this under faded conditions.
1194-51
–85 –80 –75 –70 –65
100
80
60
40
20
0
Signal input level (dBm)
PCR
(%)
FIGURE 51Unfaded packet completion rate
PCR 7.3%PCR 10%
1194-52
–90 –80 –70 –60 –50 –40 –300
20
40
60
80
100
Average signal input level (dBm)
PCR
(%)
FIGURE 52Faded packet completion rate
PCR 7.3%PCR 10%
46 Rec. ITU-R BS.1194-2
Combining the results from Figures 49, 50, 51 and 52 leads to an illustration of the PCR versus the BER which shows that the PCR remains within acceptable limits as the BER increases. Under the test conditions the PCR in Figure 52 never reached 100% and the BER in Figure 50 never exceeded 10-2. This is illustrated in the PCR-curve below.
Figure 53 shows the results for a deviation of 7.5 kHz under unfaded and faded conditions. Under unfaded conditions the PCR and BER change with every step of the signal input level. Under faded conditions the performance stays longer around a certain point before it drops.
1194-53
100
80
60
40
20
010 –110 –210 –310 –410 –5 1
PCR
(%)
FIGURE 53BER vs. packet completion rate
10% injection level
BER
Unfaded PCR (%)Faded PCR (%)
3.4 Message completion rate performance
Repeated reception of the same original data packet can result in a higher data quality. If the receiver can receive packets from different transmitters, each with different propagation paths, then the receiver may receive messages even if some packets get lost. The HSDS receiver has the ability to switch between “k” time-shifted transmitters, each repeating the same packets “n” times.
The Message Completion Rate (MCR) is calculated by the formula:
MCR 1 – [(1-PCR 1 )n * (1-PCR 2) n * ... * (1-PCR k)
n ]
Because only one HSDS generator was available, the laboratory test configuration of Figure 54 was used. Two real time signals of local transmitters, each having an individual PCR of 100%, were received using two Studer FM receivers. The first receiver was set to receive a 96.8 MHz signal, heavily modulated by a pop station. The second receiver was set to receive a 92.6 MHz signal, lightly modulated with light music and additional information. These multiplex signals (including audio, RDS and HSDS) were modulated again and fed to the RF Channel Simulator.

Rec. ITU-R BS.1194-2 47
1194-54
FM receiverat 96.8 MHz
FMexciter
FMexciter
FM receiverat 92.6 MHz
Channelsimulator
Stepattenuator
Spectrumanalyser
Protocolanalyser
FIGURE 54MCR laboratory test configuration
Multiplexer
Multiplexer
Figure 55 shows a screen dump of the HSDS protocol analyser. For the two transmitters the PCR and BER are shown under faded conditions for a deviation of 7.5 kHz.
The MCR was calculated. Figure 56 shows a snapshot of more than 100 seconds of the MCR under faded conditions, receiving signals from the two transmitters.
It is clear that even with quite poor average transmitter performance, an acceptable combined MCR is achieved.
3.5 Frame structure
HSDS uses a packet oriented Time Division Multiplexed (TDM) scheme. The top section of Figure 47 illustrates the relationship between the timeslots and subframes. The largest structure used by the protocol is a master frame. Each master frame contains 64 subframes. Each subframe is divided into 1 027 units called timeslots. Each timeslot contains a data packet. The first three timeslots in each subframe are Control Slots and the remaining 1 024 are data timeslots. Control Slot packets carry the time of day, date, and lists of nearby related transmitters also carrying HSDS. Data timeslot packets typically include a slot number, receiver address, data format, packet format and the message data.
The pilot signal is used as the data clock. The frame structure provides for inaccuracy of the pilot signal through anticipation of bit padding. Since the stereo pilot frequency may not be exactly 19 kHz at the time of transmission, a single bit may be added (pad bit) between packets as required to maintain synchronization. This occasional addition of a pad bit ensures proper synchronization between transmitters and the receiver.
4 Network layerThe network layer includes features required to make a number of individual transmitters act as a single system. This includes:– receiver addresses;– application multiplexing;– alternative frequency lists;– transmitter time offsets;– time synchronization between transmitters.

48 Rec. ITU-R BS.1194-2
1194-55
0
10
20
30
40
50
60
70
80
90
100
0 10 200
10
20
30
40
50
60
70
80
90
100
0 10 20
(s)
CRC: 5 436ECC: 76 264BER: 0.031381MCR: 0.998081PCR: 54.9Flag: 203RF input: – 75.5 dBmPilot phase: 67.8°Sub-carrier injection level: 7.9%Frequency: 95.2 test 2Attenuator: 0 dB
CRC: 6 097ECC: 86 942BER: 0.033651MCR: 0.998081PCR: 54.8Flag: 167RF input: – 73 dBmPilot phase: 85°Sub-carrier injection level: 7.1%Frequency: 98.2 test 1Attenuator: 0 dB
% c
ompl
ete
% c
ompl
ete
(s)
FIGURE 55Message completion rate using HSDS protocol analyser
4.1 Multiple transmitters
When multiple transmitter networks are required, master frames are synchronized and begin at the start of each quarter hour (plus an individual transmitter's time offset). The synchronized and time offset transmitters provide an opportunity for the receiver to change the tuned frequency and make subsequent packet reception attempts on the alternative frequencies with no loss of data synchronization.
4.2 System reliability
While extensive error correction techniques are useful for a moving receiver, they become ineffective when the receiver is stopped in an extremely low signal strength area or is moving very slowly through multipath nulls. HSDS addresses multipath and shielding effects with a combination of frequency, space and time diversity and, in the case of paging, message numbering.
Rec. ITU-R BS.1194-2 49
1194-56
05:52:48 05:53:05 05:53:23 05:53:40 05:53:57 05:54:14 05:54:32 05:54:490
20
40
60
80
100
MC
R %
MCR %
PC R1 (%)
PC R2 (%)
Time
FIGURE 56Faded message completion rate
5 ApplicationsHSDS implements up to 64 asynchronously multiplexed logical channels at the transport layer. The channels include 3 link packet types: Data Gram Packets, Data Stream Packets and Data Block Packets.
Data Gram Packets are stand alone packets consisting of 15 bytes of transport data. Data Gram Packets can be delivered in non-sequential order.
Data Streams are continuous streams of transparent data. Any segmentation of transport data is performed at a higher layer in this packet type. There are no transport level indications of the beginning or end of Data Stream Packets at the transport level. Order information is included in Data Stream Packets so that they may be interleaved with other data packets on the same channel. Up to 128 Data Stream Packets may be delivered in a non-sequential order on a single logical channel, at any one time. Data Stream Packets may include repeats of the same Data Stream Packet for enhanced reliability.
Data Block Packets provide the capability to send between 1 and 768 bytes of transparent transport data. Transport messages are broken down into multiple data blocks. Each data block is broken into multiple Data Block Packets. Each Data Block Packet carries up to 12 bytes of transport data. Up to 32 Data Block Packets may be delivered in a non-sequential order on a single logical channel, at any one time. Data Block Packets may be interleaved with other data packets on the same channel or other logical channels. Data Block Packets may include repeats of the same Data Block Packet for enhanced reliability.
50 Rec. ITU-R BS.1194-2
ANNEX 3
System description: System C, Sub-carrier Transmission Information Channel (STIC) System
1 Introduction The Sub-carrier Transmission Information Channel (STIC) system was developed for the United States Department of Transportation in support of its Intelligent Transportation System (ITS) activities. The system has been optimized for use in broadcasting ITS data to vehicular receivers. It uses a version of Differential Quadrature Phase Shift Keying (DQPSK) modulation on a 72.2 kHz sub-carrier with a symbol rate of 9 025 symbols per second (18 050 bits per second). A concatenated Forward Error Correction (FEC) coding approach is used which incorporates convolutional coding with Viterbi decoding, Reed-Solomon coding and two interleavers. Modulation and coding parameters are summarized in Table 7.
Because of the powerful concatenated code, this system exhibits robustness in multipath reception conditions and noise, especially for long messages. The system provides a net throughput of 7 600 bits per second, plus some capacity for short delay data, depending on the frame structure selected. (This short delay data path is intended for Differential GPS (DGPS) and/or other high priority messages of an emergency nature.)
The system is compatible with, but does not explicitly include, conditional access and receiver addressability features.
The ability to support multiple service providers is made possible by the packet structure defined for the system. Because of the long packets used, service provider identification is highly efficient in terms of the data rate capacity.
Enhancements to the system are planned which will provide power saving features and options for higher data rate operation.
TABLE 7
Summary of STIC design characteristics
Further information on this system, including BER performance in the presence of Gaussian noise or multipath fading and also the message error rate, can be obtained from Fig. 62, Annex 2, Appendix 2. Enhancements to the system are planned which will provide power saving features and options for higher data rate operation.
Characteristic Description
1 Modulation /4 shifted DQPSK
2 Baseband centre frequency 72.2 kHz
3 Baseband frequency spectrum See spectrum analyser plot
4 Sub-carrier injection levels Nominally 7.5 kHz
5 Sub-carrier channel symbol rate 9 025 symbols per second
6 Word synchronization See frame structure
7 Error correction/detection Reed-Solomon and convolutional coding with soft decision Viterbi decoding
8 Delay Variable depending on interleaver depth and frame size
9 Information bit rate 7.6 kbit/s plus short delay data
Rec. ITU-R BS.1194-2 51
2 Transmit end processingThe STIC system provides two data paths: a main data path and a data path reserved for short delay data. The main data path has four optional interleaver depths which correspond to four superframe durations: 46.08, 23.04, 11.52 and 5.76 seconds. These options allow trade-offs between system delay and system robustness in slow fading conditions.
From the point of view of the signals at the transmitter, the following processes are carried out for the main data path:– An input data rate of 7 600 bit/s is assumed, and considered to be a continuous data stream based on one 228-byte
data packet every 240 ms. Each byte consists of 8 bits.– The message is block encoded using a (243, 228) shortened Reed Solomon 256-ary code.– The Reed Solomon coded message is block interleaved by writing 8-bit bytes to a memory with 243 rows and 6
columns. Each cell in the memory contains one 8-bit byte and the message is written by columns and read by rows. – The block interleaved message is convolutional encoded using a 1/2 rate, constraint length 7 code with generator
polynomial coefficients 554 and 744 (octal). The coder runs continuously without flushing.– The encoded message is interleaved using a convolutional interleaver with 72 different paths. Each path has a
different length shift register with an integer multiple of “J” stages as given in Table 6. Each stage represents one bit. The first path has 71*J stages, the second path has 70*J stages, ..., and the last path has zero stages. The switch arm changes once for each input bit and at the same time, the bits in the shift registers in that path shift one bit.
– The interleaved message is exclusive-OR'ed with a repeating Pseudo-Noise (PN) random pattern. The length of the PN pattern is given in Table 8. The PN pattern is synchronized to the interleaving and to the superframe. This process is called covering.
– The covered message is divided into subframes, frames and superframes. There are 72 data bits per subframe. The number of subframes per frame is given in Table 8. There are 72 frames per superframe. Framing is synchronized with the interleaver so that the first bit in a subframe comes from the first path in the convolutional interleaver. Four bits are appended as a suffix to each subframe to make each subframe 76 bits long. These four additional bits are called channel state bits.
– Each frame is provided with a 76-bit synchronization subframe as a prefix. This synchronization subframe consists of a 56-bit “correlation word”, a 15-bit frame identification word plus one unused bit and 4 channel state bits. The 56-bit correlation word is the same for every frame. The 15-bit frame identification word is the encoded frame number using a Bose, Chaudhuri and Hocquenghem (BCH) (15, 7) code. There is always one synchronization subframe per frame.
– Some subframes are reserved for the short delay data path. The number of subframes reserved in this way depends on the interleaver/superframe option as shown in Table 6. The number of total subframes per frame is also given in Table 8. There are always 72 frames per superframe.
– The formatted message is modulated on a 72.2 kHz sub-carrier using /4 shifted DQPSK. The transmitted symbol rate is 9 025 symbols per second.
– The modulated signal is filtered using Square Root Raised Cosine (SRRC) filtering with a roll-off factor of 0.684. This results in a nominal bandwidth of 15.2 kHz (from 64.6 kHz to 79.8 kHz baseband).
Short delay subframes are provided to allow the transmission of data which must be processed quickly for applications which cannot tolerate the delay associated with interleaving. These subframes contain 76 bits and are multiplexed prior to covering as shown in Figure 57. The data rate available in the short delay data path is shown in Table 8.
The process described above produces the sub-carrier waveform that is frequency division multiplexed with the other signals prior to FM modulation at the broadcast transmitter. An injection level (in terms of the peak amplitude of the sub-carrier) of 7.5 kHz is envisioned as typical. Other injection levels are possible with trade-offs in terms of BER performance and the performance of other sub-carriers sharing the transmission.

52 Rec. ITU-R BS.1194-2
TABLE 8
Interleaver and framing options
1350-261194-57
1 2 3 4 72
4
4
Superframe
SubframeFrame
Data subframe
Sync subframe
56 bits 16 bits
Uniqueword
BCH codedframe No.
Channel-state bits
72 data bits Channel-state bits
data 1 data 2 data 3Sync data 35 data 36 reserved
FIGURE 57Example frame structure
Figure 57 shows an example frame for the case of the 11.52-second superframe. The channel state bits are used for soft decision decoding. The inner convolutional code makes use of these bits by correlating them with the known sequence and estimating the quality of the channel. This quality estimate helps in the Viterbi algorithm decoding process.
superframe duration (seconds) 5.76 11.52 23.04 46.08
data packets per superframe 24 48 96 192
convolutional interleaver, “J” = 18 36 72 144
# stages in m-sequence 17 18 19 20
# bits from m-sequence 93 312 186 624 373 248 746 496
total subframes per frame 19 38 76 152
Short delay subframes per frame 0 1 3 7
Short delay data rate (bit/s) 0 475 712.5 831.25
synchronization subframes per frame 1 1 1 1
data subframes per frame 18 36 72 144
Rec. ITU-R BS.1194-2 53
The Reed Solomon Code used for the STIC system is capable of correcting as many as 7-symbol errors but can also detect all 8-symbol errors. This feature is used in place of a Cyclic Redundancy Code (CRC) to reliably determine whether a packet has been received correctly.
Figure 58 shows a spectrum analyser plot of the FM baseband from 50 kHz to 100 kHz. The baseband spectrum in this plot includes a 57 kHz RDS signal, the 72.2 kHz STIC signal injected at ±7.5 kHz and a 92 kHz analogue sub-carrier. The 50 dB attenuation at 64 and 81 kHz, is adequate to ensure that the STIC waveform does not impinge on the adjacent 57 kHz RDS or the 92 kHz sub-carriers.
1194-58
50 60 70 80 90 100
0
– 10
– 20
– 30
– 40
– 50
– 60
Frequency (kHz)
FIGURE 58STIC spectral characteristics
Rel
ativ
e pe
ak si
gnal
leve
l (dB
)
3 Quantitative audio interference tests (same channel) This test measured the degradation in stereo audio performance when the STIC sub-carrier is introduced. The results of this test are summarized in Table 9. Measurements were accomplished using a 15 kHz Low Pass Filter (LPF) as well as a psophometric weighted filter. The results show that a degradation of approximately 1 dB would be perceived. This level of degradation is not objectionable as it was validated by the qualitative test.
TABLE 9
STIC effects on main channel
Psophometric Filter 15 kHz LPF
Active Signals SINAD (dB) SINAD (dB)
1 kHz Tone 42.15 59.73
1 kHz Tone + STIC 41.02 55.01
54 Rec. ITU-R BS.1194-2
4 Effect of RDS on STIC error rate performanceSTIC channel error rate measurements were made with the RDS sub-carrier both on and off. The results are shown in Figure 59. This result indicates that the degradation due to RDS is insignificant.
1194-59
1
10–1
10–2
10–3
10–4
10–5
–100 –98 –96 –94 –92 –90 –88 –86 –84
Input level (dBm)
FIGURE 59Error degradation due to RDS
CERCER (W/RDS)
5 Radio-frequency protection ratiosThe STIC system performs well in terms of protection ratios, as shown in Figures 60 and 61. Protection Ratio performance for monophonic reception is shown in Figure 60 using an Alpine model 7502 car radio receiver.
The STIC system is also robust in the presence of alternate channel interference. Figure 61 shows protection ratios for the case of an alternate channel interfering with the STIC transmission at a 1% uncorrected channel error rate.
6 Error performance (faded)Laboratory measurements of STIC CER under fading conditions were made using with the Hewlett Packard (HP) 11759C RF Channel Simulator. Figure 62 below shows the laboratory configuration used to conduct the tests. The test was conducted with the STIC signal modulating the carrier at 7.5 kHz deviation. A 6-tap Rayleigh fading scenario was used with 6.7 Hz fade rate which corresponds to a 82.5 km/hr vehicle speed at the 87.7 MHz test frequency. Tap delays and attenuations are as shown in Table 10. In Figure 62 the first car stereo receiver was turned off for this test so that no audio modulation was used. Also, the pilot tone was turned off for this test. Results of the test are shown in Figure 63.

Rec. ITU-R BS.1194-2 55
1194-60
40
30
20
10
0
–10
–20
–30
–400 50 100 150 200 250 300 350 400
Frequency offset (kHz)
Prot
ectio
n ra
tio (d
B)
FIGURE 60Protection ratios for main channel
Rec. ITU-R BS.412, M1, 75 kHzWith STICWithout STIC
Protection ratio curves

56 Rec. ITU-R BS.1194-2
1350-301194-61
50 100 150 200 250 300 350 400
30
20
10
0
– 10
– 20
– 30
– 40
0– 50
FIGURE 61Protection ratios for STIC sub-carrier
Frequency offset (kHz)
Prot
ectio
n ra
tio (d
B)
STIC protection ratio from interferer

Rec. ITU-R BS.1194-2 57
TABLE 10
Fading channel tap parameters
1194-62
AttenAtten
FIGURE 62Faded BER laboratory test configuration
STICTX
StereoGenerator
FMExciter
HP RFChannel
Simulator Car Stereo
STICRX
Car Stereo
Atten Atten
7 Field test resultsTo date the STIC prototype has undergone numerous on-the-air field tests. One of the major objectives of the field test was to validate the compatibility of the STIC waveform with the FM broadcast system and to measure system error performance in a real world environment. Some of these tests are summarized in Table 11. There are two general conclusions based on these test; one, the STIC system can provide good data performance in the mobile environment; two, the STIC system is compatible with the FM broadcast systems and equipment.
Tap delay (s) Tap attenuation (dB)
0.0 3.0
0.2 0.0
0.5 2.0
1.6 6.0
2.3 8.0
5.0 10.0

58 Rec. ITU-R BS.1194-2
1194-63
–93 –92 –91 –90 –89 –88 –87 –86 –85 –84 –83
10–1
10–3
10–2
1
Average signal power (dBm)
CERBERPER
FIGURE 63Results using fading channel simulator
7.1 STIC compatibility in field tests
The method for validation was strictly qualitative and although the results are anecdotal they strongly support the finding that STIC is compatible. The key results which support this finding are listed as follows:– The STIC system has been tested on the air numerous times. Of these, five tests on four different stations are listed
in the table above. Each station had at least one other sub-carrier along with STIC including, 92 kHz aural, 57 kHz Paging, and 57 kHz RDS. Additionally, the cumulative air time for the tests listed, approaches 170 days.
– In each of the field tests the degradation of the main entertainment channel was monitored regularly by the station engineer and was judged to have no significant degrading effects.
– There were no listener reports of loss of coverage or audio degradation.– There were no reports of service degradation on any of the sub-carriers.
Rec. ITU-R BS.1194-2 59
TABLE 11
Summary of STIC field tests
7.2 STIC error performance in field tests
A sample of performance results for one of the more comprehensive field tests is shown in Figure 64. This result is taken from data collected throughout the radio station coverage area using a mobile receive platform. The station used for this test has a 22 kW Effective Radiated Power (ERP) and an antenna Height Above the Average Terrain (HAAT) of 232 metres. In this result the coverage area is divided into grids that are 6.4 square kilometres. Packet Error Rates (PER) in each grid cell visited by the mobile receiver are accumulated based on the number of packets correctly received while the vehicle was in this cell compared to the total number sent while the vehicle was in the cell. Figure 64 is a plot of percentage of cells with accumulated error rates in the ranges shown on the horizontal axis. Several data sets are shown for different subsets of grid cells consisting of all cells within a range of distances from the transmitter.
Location Date Station Antenna HAAT8*(Metres)
EIRP(kiloWatts)
Duration of Test(Days)
FayettevilleNorth Carolina
March 1993 WQSM 249 100 3
Washington DC
April 1993 WPGC 152 50 3
Washington DC
February 1994 WXTR 232 22 14
MinneapolisMinnesota
October 1994 KBEM 113 2.2 48
Washington DC
August 1994 WXTR 232 22 43
AtlantaGeorgia
April 1995 WRFG 61 21.5 30+
DenverColorado
May 1995 KYGO 555 100 30+
* Height above the average terrain.
60 Rec. ITU-R BS.1194-2
1194-64
100
90
80
70
60
50
40
30
20
10
0
d d d d d
FIGURE 64Grid cell packet error performance as a function of distance
Packet error rate range
Grid
cel
ls (%
)
0
d = distance from transmitter (kilometers)

Rec. IT
U-R
BS.1194-2
59
APPENDIX 1
This Appendix provides a comparison of the three systems described in Annexes 1 through 3. Table 12 provides an overview summary of the three systems.
TABLE 12
Summary of systems
System A (DARC) System B (HSDS) System C (STIC)
Parameters
Sub-carrier frequency 76 kHz 66.5 kHz 72.2 kHz
Bandwidth 44 kHz (–40 dB) 16 kHz (60 to 76 kHz at –60 dB) 16 kHz (-50 dB)
Channel data bit rate 16 kbit/s 19 kbit/s 18.05 kbit/s
Information data rate Method A – 6.83 kbit/sMethod B – 6.95 kbit/sMethod C – 9.78 kbit/s
Single Packets – 10.51 kbit/sSmall blocks – 8.3 kbit/s
7.6 kbit/s + short delay data
Modulation method LMSK duobinary double-sideband suppressed-carrier amplitude modulation
/4 shifted DQPSK
Error correction (272, 190) product code Packets – interleaved Hamming (12, 8) Small Blocks – time spread packets with additional Hamming
Reed-Solomon (243, 228) + 1/2 convolutional code
Error detection 14 bits of CRC 16 bits of CRC Accomplished by Reed Solomon decoding
Injection level varies from 3 kHz up to 7.5 kHz 3.75 kHz to 7.5 kHz nominally 7.5 kHz nominally 7.5 kHz
Additional features
Power saving Yes, in current receivers Yes, duty cycles from 0.01% to 100%
Receiver addressability Yes Yes Yes
Support of different data types Yes Yes Yes
Possibility for additional sub-carrier services
No, see Appendix 2 section 9 Yes, see Appendix 2 section 9 Yes, see Appendix 2 section 9
Multiple station access Yes Yes, including time offset transmission for paging type data
Yes
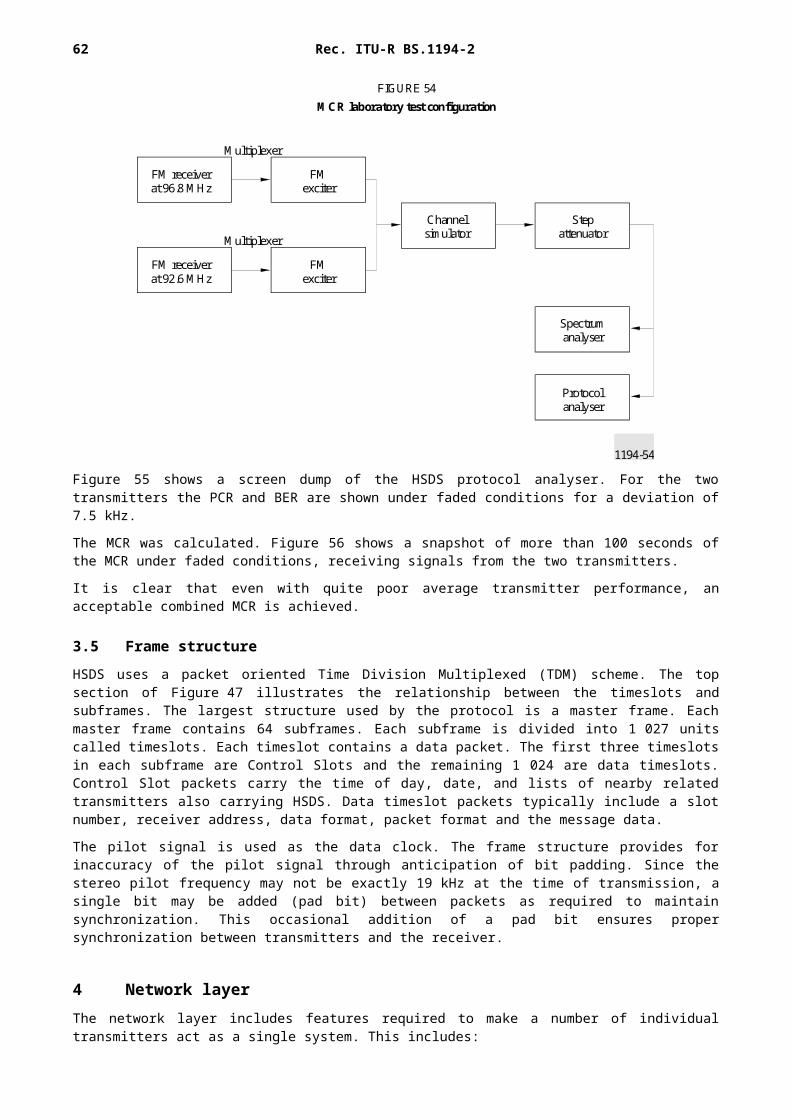
60R
ec. ITU
-R B
S.1194-2
TABLE 12 (continued)
System A (DARC) System B (HSDS) System C (STIC)
Compatibility characteristics
Audio programme, see Appendix 2 section 7 Table 10
see Annex 1, Section 3.2 see Annex 2, Section 2.2 see Annex 3, Section 3
Protection ratio, see Appendix 2 section 6 and section 10
see Annex 1, Section 3.4 see Annex 2, Section 2.4 see Annex 3, Section 5
RDS, see Appendix 2 section 8 see Annex 1, Section 3.3 see Annex 2, Section 2.3 see Annex 3, Section 4
Rec. ITU-R BS.450 (sub-carrier frequency, see NOTE 1)
completely
Aeronautical radio navigation services
To be studied To be studied To be studied
Audio in multipath, see Appendix 2 section 7 Table 11
see Annex 1, Section 3.2 see Annex 2, Section 2.2
Handle rebroadcasting Yes Yes Yes
System A (DARC) System B (HSDS) System C (STIC)
Performance characteristics
Error rates (Gaussian), see Appendix 2 section 2
see Annex 1, Section 3.1 see Annex 2, Sections 3.2, 3.3 and 3.4
Error rates (multipath and fading), see Appendix 2 section 3
see Annex 1, Section 3.1 see Annex 2, Sections 3.2, 3.3 and 3.4See Annex 3, Section 6
Error rates (impulse noise), see Appendix 2 section 4
End-to-end delay 36 ms for method 9.8 seconds for methods A and B
13 ms for single packets and 3.28 seconds for small blocks
160 ms for short delay messages. Other delays vary depending on interleaving option.
Message error rate for various length messages in multipath conditions, see Appendix 2 section 3
see Annex 2, Section 3.4
NOTE 1 – Guidelines for sub-carrier frequencies and injection levels can be found in Recommendation ITU-R BS.450.
Rec. IT
U-R
BS.1194-2
59

64 Rec. ITU-R BS.1194-2
APPENDIX 2
Comparison of the three FM sub-carrier data systems
1 IntroductionDuring 1996, tests were conducted on the three FM sub-carrier data systems in the United States. The results of these tests are quoted here. Tests were conducted at the NASA Lewis Research Center in Cleveland, Ohio by an independent test team. Documents describing the results in detail are voluminous and are not duplicated here. This report provides a summary of some of the results.
The systems that were tested correspond very nearly to systems described in this Recommendation. Some modifications had been made to the systems tested, relative to the descriptions found here. First, the HSDS system had additional Forward Error Correction (FEC) coding and interleaving. Some tests were conducted with this additional coding and others used the standard HSDS coding. Second, the DARC system was operated both with fixed and variable injection level. The DARC system tested here used Method B for data organization.
Tests were done with several different combinations of various sub-carriers and main channel modulation. Some tests were done only with the proponent systems (i.e. the systems under test) along with main channel modulation and a pilot signal. Other tests were done with combinations of RDS and another analogue sub-carrier at a frequency of 92 kHz. Deviations for two groups are provided in Tables 13 and 14 as a function of the particular proponent system under test. Except where identified differently, one or the other of the combinations shown in Tables 13 and 14 were used during the tests. Implementation of the tests did not comply strictly with ITU-R BS.450, since multiple sub-carriers were used in some tests and deviation limits provided in Recommendation ITU-R BS.450 were exceeded.NOTE – The results in Section 3 of this Appendix are under evaluation in other countries.
TABLE 13
Peak deviation for sub-carrier Group A (kHz)
DARC STIC HSDS
L+R 66.00 60.75 60.75
Pilot 6.75 6.75 6.75
L-R 0 0 0
RDS 2.25 2.25 2.25
System under Test Fixed 7.5 kHz, orvariable 3.0 kHz to 7.5 kHz
7.50 7.50
92 kHz Analogue sub-carrier 0 5.25 5.25
Aggregate peak deviation 82.5 82.5 82.5

Rec. ITU-R BS.1194-2 65
TABLE 14
Peak deviation for sub-carrier Group B (kHz)
Tests with sub-carrier groups A and B typically also utilize some main channel modulation. Some tests were also done with “proponent only”. For these, only the pilot, the L+R, and the sub-carrier of the system under test provide modulation. Unless identified to the contrary, the following conditions apply:– aggregate peak deviation was set to 82.5 kHz by adjusting the main channel audio modulation level;– the DARC system was operated in a fixed modulation mode;– the signal level was set to –65 dBm.
The following test results are described below:– Packet Loss Rate (PLR) in Additive White Gaussian Noise (AWGN);– PLR in multipath;– PLR in impulse noise;– synchronization acquisition;– co-channel interference;– host audio interference;– RDS interference;– 92 kHz interference;– adjacent channel interference.
2 PLR in AWGNThe ability to receive messages reliably in noise is an important feature of any system. This involves more than simply maintaining low BER. Complete packets must be received. This section provides PLR performance in AWGN for two different packet sizes. Figure 65 shows the PLRs for the three systems in AWGN for a 20-byte packet size. The DARC system is shown for two cases: operation with fixed and variable deviation. Tests were done at a signal level of
DARC STIC HSDS
L+R 60.75 60.75 60.75
Pilot 6.75 6.75 6.75
L-R 0 0 0
RDS 7.50 7.50 7.50
System under Test Fixed 7.5 kHz, or variable 3.0 kHz to 7.5 kHz
7.50 7.50
92 kHz Analogue sub-carrier 0 0 0
Aggregate peak deviation 82.5 82.5 82.5
66 Rec. ITU-R BS.1194-2
-65 dBm. Noise was added to achieve the C/N0 values on the horizontal axis in the figure. C/N0 is defined as the ratio of total RF power relative to the noise spectral density of the added noise (in a 1 Hz bandwidth). Conversions from C/N0 to signal strength dB(V) can be made with the following equation:
C/N0 + F – 65.25 S
Where:S: signal strength (dB(V)) assuming 75 impedanceF: noise figure of the receiver (dB)C/N0: RF power to noise spectral density ratio (dB/Hz).
The tests were done with “Proponent Only” modulation levels. In other words, no other sub-carriers were used, other than the system under test. The main channel was modulated with monaural Clipped Pink Noise (CPN) except in the case of the DARC system with variable modulation. In this latter case, the main channel was modulated in stereo with a specific audio passage from the song ABBA. Data was collected for 5 minutes to obtain the error rates indicated. Zero measured PLR values are plotted as 0.0001 on the graph, since zero cannot be plotted on a logarithmic scale. Note that one 20-byte packet lost in 5 minutes corresponds approximately to 0.0001 PLR. Curves which are to the lower left of the graph indicate better performance.
1194-65
70 72 74 76 78 8010–4
10–1
10–3
10–2
1
FIGURE 65PLR in AWGN for 20 byte packets
C/No (dB Hz)
PLR
STIC
DARC variable
HSDS
DARC fixed
Figure 66 shows the PLR performance for packet sizes of 220 bytes, including two cases for the DARC system and two cases for the HSDS system. The double error correction coding version of the HSDS system also has additional interleaving. The double error correction version of the HSDS system was developed especially for the High Speed Sub-Carrier (HSSC) systems tests. Data was collected for 5 minutes to obtain the error rates indicated. Zero measured PLR values are plotted as 0.001 on the graph, since zero cannot be plotted on a logarithmic scale. Note that one 220-byte packet lost in 5 minutes corresponds approximately to 0.001 PLR. All other conditions are the same as for Figure 65.

Rec. ITU-R BS.1194-2 67
1194-66
70 72 74 76 78 8010–4
10–1
10–3
10–2
1
FIGURE 66PLR in AWGN for 220 byte packets
C/No (dB Hz)
PLR
HSDS single
DARC variable
STIC
DARC fixed
HSDS double
3 PLR performance in multipath fadingFor mobile receivers, PLR performance under multipath conditions is extremely important. Tests were conducted on the three systems under four different multipath conditions. Multipath was simulated by using a pair of HP 11759C fading channel simulators. These were used in the Rayleigh mode, with a total of 9 multipath taps. These delay and attenuation values for each tap are summarized in Table 15 for the various multipath scenarios modelled during the test.
Test results for the three systems are given in Figures 67 – 70. The figures show PLR plotted against C/No for each of the three systems and for each of the four multipath scenarios. For the DARC system, a fixed injection level of 7.5 kHz peak deviation was used.
Measurements were made by increasing the noise until the Onset of Message Errors (OME). However, in many some cases, errors occurred even without added noise. In this situation, C/No was estimated by grossly determining the approximate noise figure of the receiver used in the system under test. Consequently, C/No values above 85 dB Hz are estimated values with less accuracy than the measured C/No values. Those below 85 dB Hz were based on actual measurements calculated from the level of added noise needed to induce OME. Since only the OME was measured, a full characterization of performance is not available. Such a characterization would consist of a curve similar to those in Figures 65 and 66. These curves would generally start in the upper left of the figures and proceed to the lower right. In the figures, data points connected by lines indicated results during the same test. As for the AWGN tests, zero measured PLR is plotted as 0.0001 and 0.001 for the 20-byte and 220-byte tests respectively. Multiple data points not connected by a line indicate data taken at different times during the test, but under virtually the same conditions. Differences in results are due, at least in part, to statistical variations. As for the AWGN tests, curves and/or values which are toward the lower left of the graphs indicate better performance.
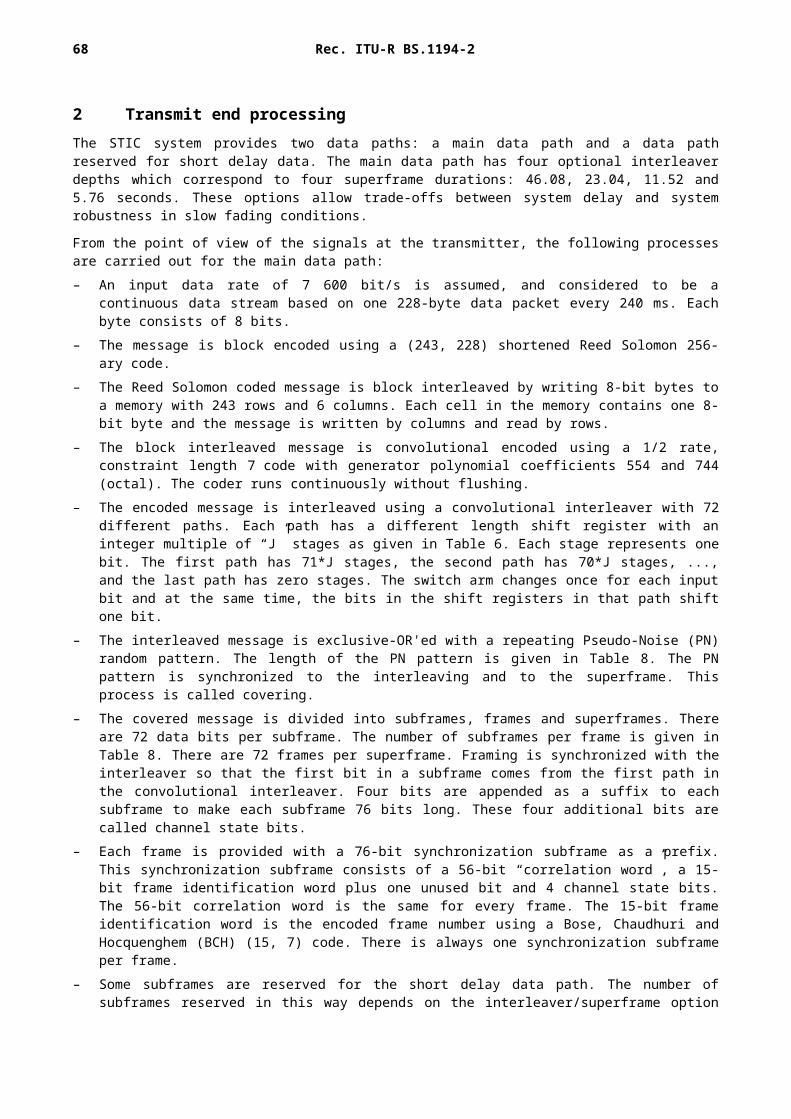
68 Rec. ITU-R BS.1194-2
TABLE 15
Multipath conditions
Tests were done with a nominal signal level of –65 dBm. Main channel modulation was monaural CPN. The signal also had an RDS signal at 2.25 kHz peak deviation, and a 92 kHz analogue sub-carrier at 5.25 kHz peak deviation. The deviation for the system under test was 7.5 kHz. For the 220-byte tests of the HSDS system, the double error correction option was used. Error measurements were done for 5 minutes. Note that with no program material, errors were greatly reduced.
1194-67
10–4
10–1
10–3
10–2
1
75 80 85 90 95 10010–4
10–1
10–3
10–2
1
75 80 85 90 95 100
FIGURE 67PLR performance in urban slow multipath fading
HSDSDARC fixed
STIC
C/No (dB Hz)
PLR
Measured C/No Estimated C/No
Urban slow, 20 byte
C/No (dB Hz)
PLR
Measured C/No Estimated C/No
Urban slow, 220 byte
Urban slow Urban fast Rural fast Obstructed
Doppler 0.1744 Hz 5.23 Hz 13.08 Hz 5.23 Hz
Tap # Delay (s) Atten. (dB) Delay (s) Atten. (dB) Delay (s) Atten. (dB) Delay (s) Atten. (dB)
1 0.0 2 0.0 2 0.0 4 0 10
2 0.2 0 0.2 0 0.3 8 1 4
3 0.5 3 0.5 3 0.5 0 2.5 2
4 0.9 4 0.9 4 0.9 5 3.5 3
5 1.2 2 1.2 2 1.2 16 5 4
6 1.4 0 1.4 0 1.9 18 8 5
7 2.0 3 2.0 3 2.1 14 12 2
8 2.4 5 2.4 5 2.5 20 14 8
9 3.0 10 3.0 10 3.0 25 16 5

Rec. ITU-R BS.1194-2 69
1194-68
10–4
10–1
10–3
10–2
1
75 80 85 90 95 10010–4
10–1
10–3
10–2
1
75 80 85 90 95 100
FIGURE 68PLR performance in urban fast multipath fading
HSDSDARC fixed
STIC
C/No (dB Hz)
PLR
Measured C/No Estimated C/No
Urban fast, 20 byte
C/No (dB Hz)
PLR
Measured C/No Estimated C/No
Urban fast, 220 byte
1194-69
10–4
10–1
10–3
10–2
1
75 80 85 90 95 10010–4
10–1
10–3
10–2
1
75 80 85 90 95
FIGURE 69PLR performance in rural fast multipath fading
HSDSDARC fixed
STIC
C/No (dB Hz)
PLR
Measured C/No Estimated C/No
Rural fast, 20 byte
C/No (dB Hz)
PLR
Measured C/No Estimated C/No
Rural fast, 220 byte
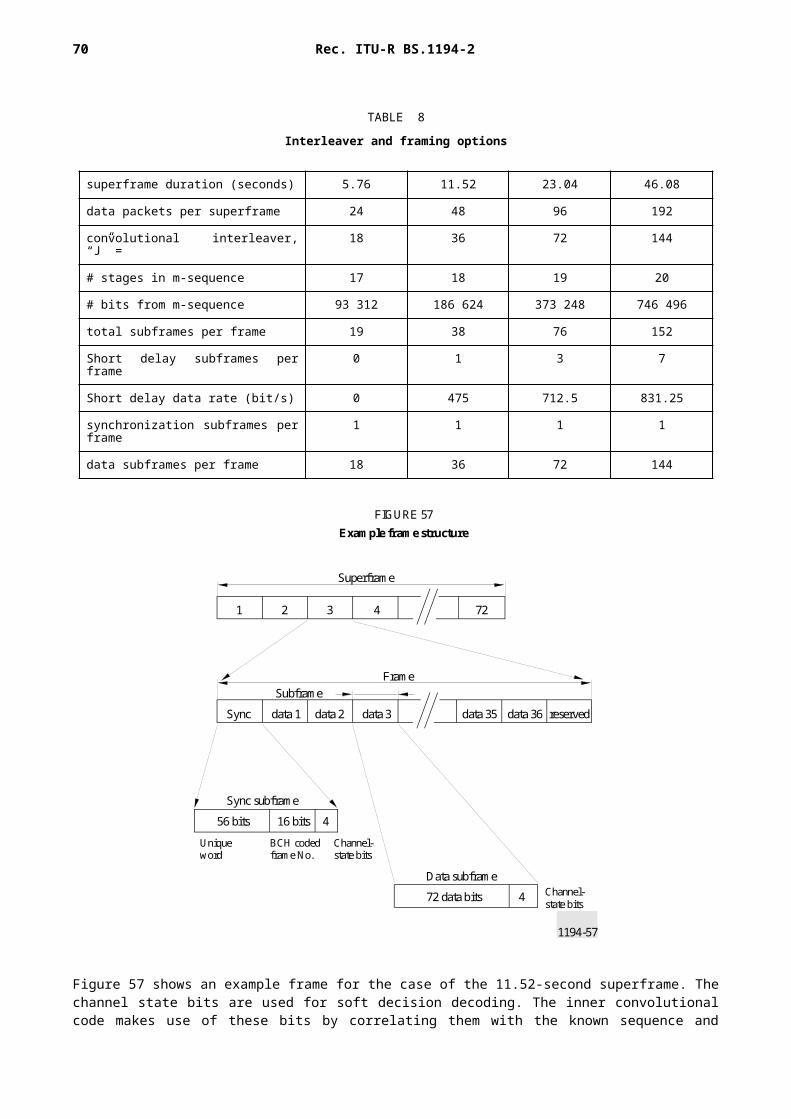
70 Rec. ITU-R BS.1194-2
1194-70
10–4
10–1
10–3
10–2
1
75 80 85 90 95 10010–4
10–1
10–3
10–2
1
75 80 85 90 95 100
FIGURE 70PLR performance in obstructed multipath fading
HSDSDARC fixed
STIC
C/No (dB Hz)
PLR
Measured C/No Estimated C/No
Obstructed, 20 byte
C/No (dB Hz)
PLR
Measured C/No Estimated C/No
Obstructed, 220 byte
4 Impulse noiseThe purpose of this test was to characterize the behaviour of the HSSC systems in the presence of impulse noise. Impulse noise energy was added to the modulated FM signal (modulated with sub-carrier group A) with the parameters of the impulse waveform being altered to see the effects, if any, on the message error rate of the HSSC system. The signal level was set to –65 dBm and a 10-nanosecond wide pulse was utilized. This test was meant to simulate the effect of real-world impulse noise sources such as automobile ignitions and heavy machinery. Testing was done as follows:1) Starting with a pulse frequency (repetition rate) of 100 Hz and a pulse amplitude of 1.0 Vp-p, look for message
errors in the HSSC system at rep. rates of 100, 200, 300, 600, and 1 000 Hz, and with both no modulation (pilot only) and monaural CPN modulation in the main channel.
2) If message errors are found, then while keeping the rep. rate constant (at the interfering frequency), reduce the pulse amplitude (in 5 dB increments) until the message error rate is reduced to zero.
Performance varied very little as a function of main channel modulation (pilot only versus clipped pink noise). No message errors were observed at rep. rates of 100 Hz and 600 Hz. Message errors were observed at the other rep. rates (200 Hz, 300 Hz, and 1 kHz) in all three systems, with HSDS performing the best and STIC performing the worst for rep. rates in this range. Typical results are shown below in Figure 71 (DARC), Figure 72 (STIC), and Figure 73 (HSDS), for the 220 byte message length and CPN main channel modulation.
The HSDS results also included measurements at rep. rates of 1.3 kHz and 1.6 kHz (the results of which are included in Figure 73). These results represent the most severely degraded performance measured in this test overall, with a maximum message loss rate of 47.2%.
Additional data was taken using the STIC system, at 198 Hz, 202 Hz, 297 Hz, and 303 Hz, and in those cases no message errors were observed. These frequencies are just above and below those frequencies where its performance was degraded in the original data. Apparently the results at 200 Hz and 300 Hz were degraded due to a harmonic relationship between these rep. rates and the frame structure of the STIC system.

Rec. ITU-R BS.1194-2 71
1194-71
0
5
10
15
20
25
30
35
40
45
50
1 000
600
300200
100
FIGURE 71HSSC performance with impulse noise - DARC
Mes
sage
err
or ra
te (%
) Pulse amplitude (V)
Pulse frequency (Hz)1
0.3160.178
0.1
220 byte message lengthMain channel audio modulated with CPN

72 Rec. ITU-R BS.1194-2
1194-72
0
5
10
15
20
25
30
35
40
45
50
1 000
600
300200
100
FIGURE 72HSSC performance with impulse noise - STIC
Mes
sage
err
or ra
te (%
) Pulse amplitude (V)
Pulse frequency (Hz)1
0.3160.178
0.1
220 byte message lengthMain channel audio modulated with CPN
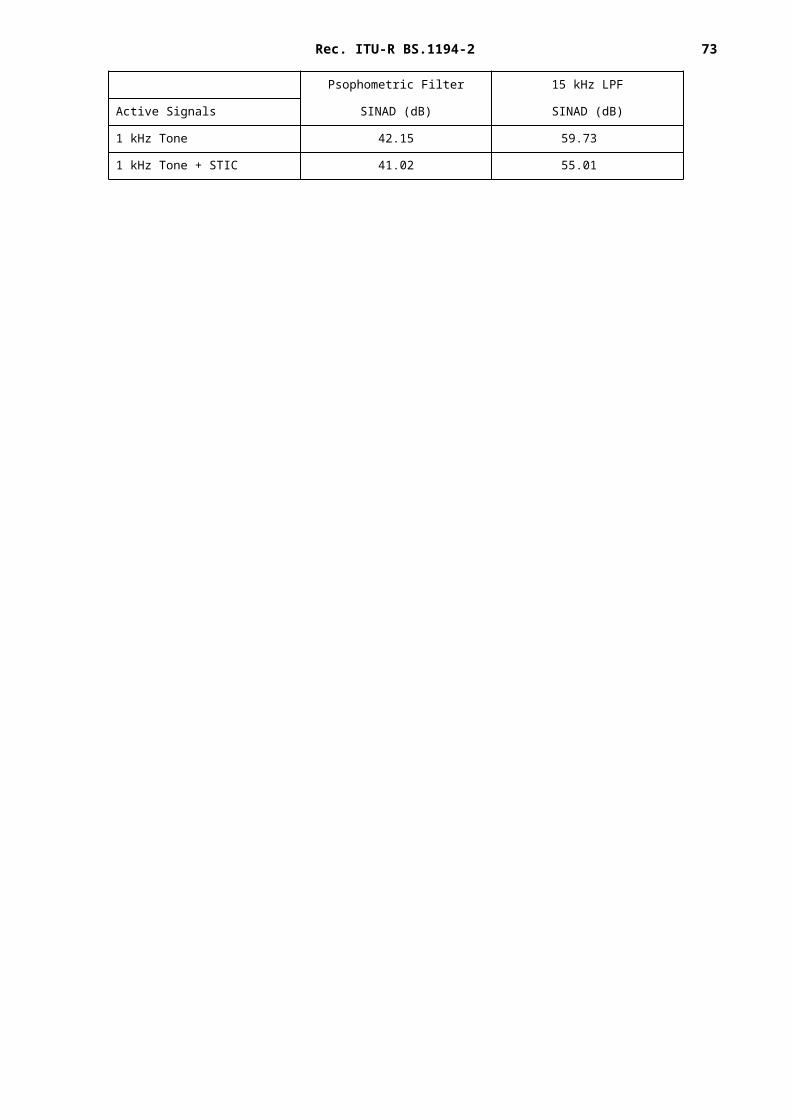
Rec. ITU-R BS.1194-2 73
1194-73
0
5
10
15
20
25
30
35
40
45
50
1 000
600
300200
100
FIGURE 73HSSC performance with impulse noise - HSDS
Me s
sage
err
or ra
te (%
)
Pulse amplitude (V)
Pulse frequency (Hz)
10.316
0.1780.10.0562
220 byte message lengthMain channel audio modulated with CPN
During testing of the performance in impulse noise, it was noted that the pulse frequencies repetition rates chosen for the tests, were integer multiples of the frame rate of the STIC system. In order to investigate this further, other tests were done at repetition rates that were slightly offset from 200 and 300 Hz. Results of these additional tests are shown in Figure 74 for repetition rates near 200 Hz and in Figure 75 for frequencies rates near 300 Hz. Note the different vertical scale in Figure 74. Specifically, additional data was taken using the STIC system, at 198 Hz, 202 Hz, 297 Hz, and 303 Hz, and in those cases no message errors were observed.

74 Rec. ITU-R BS.1194-2
1194-74
0
5
10
202200
198
FIGURE 74HSSC performance with impulse noise - STIC near 200 Hz
Me s
sage
err
or ra
te (%
)
0.10.178
0.31620.562
1
Pulse amplitude (V)Pulse frequency (Hz)
220 byte message lengthMain channel audio modulated with CPN
1194-75
303
300297
0
5
10
15
20
25
30
40
45
50
35
FIGURE 75HSSC performance with impulse noise - STIC near 300 Hz
Me s
sage
err
o r ra
te (%
)
Pulse amplitude (V)0.3160.178
0.1
0.5621
Pulse frequency (Hz)
220 byte message lengthMain channel audio modulated with CPN

Rec. ITU-R BS.1194-2 75
5 Re-acquisition of synchronization and dataThis test measured the time required for the systems to acquire synchronization after a period of signal loss. The test was conducted by increasing the noise level until 90% PLR occurred for the 220-byte packets. This represents the Point Of Failure (POF) for the system. This condition was maintained for 30 seconds. The noise was then reduced by a specified number of decibels. The time required to achieve synchronization and again begin collecting good data was recorded. The test was conducted 5 times for each test condition. Values that are reported in Table 16 below represent an average of the five results. Note that the HSDS system tested had been modified for double error correction, and it was this modified version of HSDS that was tested for re-acquisition.
TABLE 16
Re-acquisition time (seconds)
Note that the acquisition times measured here are associated with the prototypes supplied for the testing. Other versions of the system may exhibit different acquisition time performance. For example, acquisition time for a version of the HSDS system operating at a sub-carrier frequency of 85.5 kHz, was measured at about 2.5 seconds during another phase of laboratory tests. Actual acquisition times may be significantly lower than the test results shown in Table 16, and should coincide with the time between synchronization patterns. However, the time required to receive good data correctly is also related to the duration of any interleaving.
6 Co-channel interferenceCo-channel interference tests were done in two ways. First, a carrier modulated with the system under test was used as the undesired signal. Tests were conducted to determine the desired to undesired (D/U) ratio required to bring the main channel Signal to Noise Ratio (SNR) of another carrier (desired signal) to 45 dB. These results were compared to a reference value: the D/U ratio using an undesired signal with a 67 kHz and a 92 kHz analogue sub-carrier, each using 7.5 kHz peak deviation. The differences between the results using the system being tested and the reference values are given in Tables 17 and 18 for two different receivers. Table 17 is for mobile receiver #1, and Table 18 is for a high quality receiver. Note that small delta values are desirable and since all the delta values are quite small, the differences among proponents are considered to be very minor.
TABLE 17
Co-channel performance using mobile receiver #1
Noise reduction below POF DARC STIC HSDS
2 dB 2.5 19.0 25.8
4 dB 2.4 17.6 27.1
6 dB 2.0 18.4 26.1
Co-channel D/U for 45 dB S/N (dB)
DARC STIC HSDS
Reference D/U value 25.84 25.81 25.1
Delta using SCA group A 0.0 0.0 0.0
Delta using SCA group B 0.0 0.0 0.0
Delta using proponent only 0.25 0.0 0.0

76 Rec. ITU-R BS.1194-2
TABLE 18
Co-channel performance using High Quality Receiver
The second type of co-channel test addresses the impact of another interfering modulated carrier on the systems under test. For this type of test the level of the interfering carrier was increased until OME occurred. Results are shown in Table 19. Smaller values indicate better performance.
TABLE 19
Co-channel D/U values
7 HSSC interference into host analogueIt is important that the system does not interfere with the host analogue signal. This test measured the level of system interference in the host analogue signal. Tests were done at a RF level of –50 dBm. Baseband SNR was measured psophometricly weighted. No other sub-carriers were present on the carrier. Results are presented in Table 20.
TABLE 20
Main channel SNR (dB)
Subjective tests were also conducted by two experienced evaluators under multipath conditions. Each system was evaluated based on identical passages of classical music, rock music, silence and spoken voice. Results are summarized in Table 21. Possible grades ranged from –3 (much worse) to +3 (much better). Entries of “0” indicate that the audio interference was judged to be about the same as the reference (i.e. with no proponent system). An entry of “–1” indicates that the perceived audio was considered slightly worse. Evaluations were made after listening to classical music, rock music, silence and spoken voice. The same passages were used for all systems and the reference.
Co-channel D/U for 45 dB S/N (dB)
DARC STIC HSDS
Reference D/U value 30.84 30.81 29.6
Delta using SCA group A 0.0 0.0 0.0
Delta using SCA group B 0.0 0.0 0.0
Delta using proponent only 0.5 0.0 0.0
DARC STIC HSDS
4.59 dB 7.06 dB 13.6 dB
Reference DARC fixed DARC variable STIC HSDS
Mobile RX #2 Radio
56.7 56.5 56.7 54.1 51.6
Home RX Pioneer Radio
60.9 59.4 60.4 59.5 56.4

Rec. ITU-R BS.1194-2 77
TABLE 21
Subjective evaluation of interference in multipath fading
8 HSSC interference into RDSInterference into the RDS was also tested. This was done at two injection levels for the RDS signal. Results are shown in Table 22 for two RF power levels. For these tests, the main channel had monaural CPN modulation and there was no added noise at RF. Group A and Group B modulation levels were used for the sub-carriers.
TABLE 22
RDS block error rate (%)
9 HSSC interference into 92 kHz analogue sub-carriersInterference from the proponent systems into the 92 kHz analogue sub-carrier was also tested. Results are in Table 23. Note that the DARC system has no claims for compatibility with 92 kHz sub-carriers. However, test results with this combination are provided here for completeness. Measurements of SNR were done based on RMS measurements of baseband audio without spectral weighting. The Group A modulation levels were used, except that the 92 kHz sub-carrier had 5.25 kHz peak deviation for all three systems, including the DARC system.
DARC fixed STIC HSDS
Mobile RX #1 Delco Radio
Urban Slow 0 0 0
Urban Fast 0 0 0
Rural Fast 0 0 0
Obstructed 0 0 0
Mobile RX #2 Ford Radio
Urban Slow 0 –1 –1
Urban Fast 0 –1 –1
Rural Fast 0 – 0.5 –1
Obstructed 0 0 0
RDS deviation RF signal power Reference DARC STIC HSDS
2.25 kHz peak – 75 dBm 5 7 6 6
– 65 dBm 5 5 4 6
7.50 kHz peak – 75 dBm 2 2 2 2
– 65 dBm 1 1 1 2

78 Rec. ITU-R BS.1194-2
TABLE 23
92 kHz analogue sub-carrier SNR (dB)
10 Adjacent channel interferenceThe impacts of the HSSC systems on adjacent channel signals were also tested. D/U values were measured at different frequency offsets in order to achieve 45 dB SNR in the main channel audio. Results are shown in Tables 24 and 25 for mobile receiver #1 and a home receiver, respectively. Lower values indicate better performance. The reference values are for an interfering carrier using 7.5 kHz deviation on each of two analogue sub-carriers at 67 and 92 kHz respectively.
TABLE 24
Required D/U (dB) for 45 dB main channel SNR: mobile receiver #1 Radio
TABLE 25
Required D/U (dB) for 45 dB main channel SNR: home receiver Radio
Impacts on other sub-carriers on the desired victim carrier were also measured. The SNR values for these victim analogue sub-carriers are shown in Tables 26 and 27 for mobile receiver #1 and a home receiver, respectively. SNR values were measured at the D/U values given in Tables 24 and 25, respectively. Larger values are better, but only in the case of equivalent D/U values.
RF signal power Reference DARC STIC HSDS
– 75 dBm 41.5 39.5 41.3 41.2
– 65 dBm 49.0 43.1 48.7 48.7
Frequency offset Reference DARC STIC HSDS
+400 kHz – 40 – 40 – 40 – 40
+200 kHz 0 – 1 – 1 – 1
– 200 kHz 5 5 5 5
– 400 kHz – 40 – 40 – 40 – 40
Frequency offset Reference DARC STIC HSDS
+400 kHz – 14 – 14 – 14 – 14
+200 kHz 21 21 21 21
– 200 kHz 32.5 32.5 32.5 32.5
– 400 kHz – 13 – 13 – 14 – 15

Rec. ITU-R BS.1194-2 79
TABLE 26
Alternate channel sub-carrier SNR (dB): mobile receiver #1 Radio
TABLE 27
Alternate channel sub-carrier SNR (dB): home receiver Radio
Freq. Offset (kHz) Analogue Sub-carrier
Reference DARC STIC HSDS
+400 67 kHz 24 24 24 24
92 kHz 10 7 8 9
+200 67 kHz 15 15 16 18
92 kHz 24 25 25 26
– 200 67 kHz 17 17 17 18
92 kHz 33 34 34 34
– 400 67 kHz 10 13 14 16
92 kHz 7 6 6 7
Freq. offset (kHz)
Analogue sub-carrier Reference DARC STIC HSDS
+400 67 kHz 37 37 37 37
92 kHz 39 41 41 41
+200 67 kHz 34 34 34 35
92 kHz 46 46 47 47
– 200 67 kHz 36 36 36 36
92 kHz 52 52 52 52
– 400 67 kHz 37 37 37 37
92 kHz 48 48 48 48