Embed Size (px)
Citation preview

Brownsea Island Lagoon Condition Assessment –
Interpretative Survey Report 2015

APEM Ltd Unit 2 Ravenscroft House
61 Regent Street Cambridge
CB2 1AB
Tel: 01223 346804
Registered in England No. 2530851
Thomas, P. M. D and Worsfold, T. M., 2016. Brownsea Island Lagoon Condition Assessment – Interpretative Survey Report. APEM Scientific Report 414247.
Cover Image: Brownsea Island Lagoon © APEM ltd
Registered in England No. 2530851, Registered Address Riverview A17 Embankment Business Park, Heaton Mersey, Stockport, SK4 3GN
Contents
1. Executive Summary ......................................................................................................... 1
2. Introduction ...................................................................................................................... 3
2.1 Background............................................................................................................... 3
2.2 Objectives ................................................................................................................. 3
2.3 Historical data ........................................................................................................... 4
3. Methods ........................................................................................................................... 4
3.1 Survey permissions ................................................................................................... 4
3.2 Survey design ........................................................................................................... 4
3.2.1 Sampling locations ............................................................................................. 4
3.3 Survey design ........................................................................................................... 7
3.3.1 Phase I survey ................................................................................................... 7
3.3.2 Phase II survey .................................................................................................. 7
3.4 Laboratory processing ............................................................................................ 10
3.4.1 Macrobiota ....................................................................................................... 10
3.4.2 Particle Size Analysis ....................................................................................... 11
3.5 Data analysis .......................................................................................................... 11
3.5.1 Particle Size Distribution .................................................................................. 11
3.5.2 Macrobiota ....................................................................................................... 12
3.5.3 Univariate analysis ........................................................................................... 13
3.5.4 Multivariate analysis ......................................................................................... 13
4. Results ........................................................................................................................... 15
4.1 Phase I survey ........................................................................................................ 15
4.1.1 Physical structure and management ................................................................ 15
4.1.2 Ecological characteristics ................................................................................. 18
4.1.3 Anthropogenic influences ................................................................................. 19
4.2 Phase II survey ....................................................................................................... 21
4.2.1 Physico-chemical characteristics ..................................................................... 21

4.2.2 SACFOR data from sweep nets ....................................................................... 22
4.2.3 Population summary statistics from core samples ............................................ 22
4.3 Multivariate analysis of biological assemblages ...................................................... 24
4.4 Notable species ...................................................................................................... 26
4.4.1 Non-native species .......................................................................................... 26
4.4.2 Species of conservation importance ................................................................ 27
4.4.3 Other noted species ......................................................................................... 27
4.5 Comparison with historic data ................................................................................. 27
4.6 Assessment of change ............................................................................................ 28
5. Discussion ..................................................................................................................... 33
6. References .................................................................................................................... 35
Appendix 1 – Raw data from Particle Size Analysis samples ................................................ 37
Appendix 2 – Water quality data ........................................................................................... 38
Appendix 3 – Raw data from sweep net samples .................................................................. 40
Appendix 4 – Raw data from core samples ........................................................................... 40
Appendix 4 – SIMPER analysis outputs ................................................................................ 43

List of Figures
Figure 1: Locations of sampling stations within the Brownsea Island lagoon ........................... 6
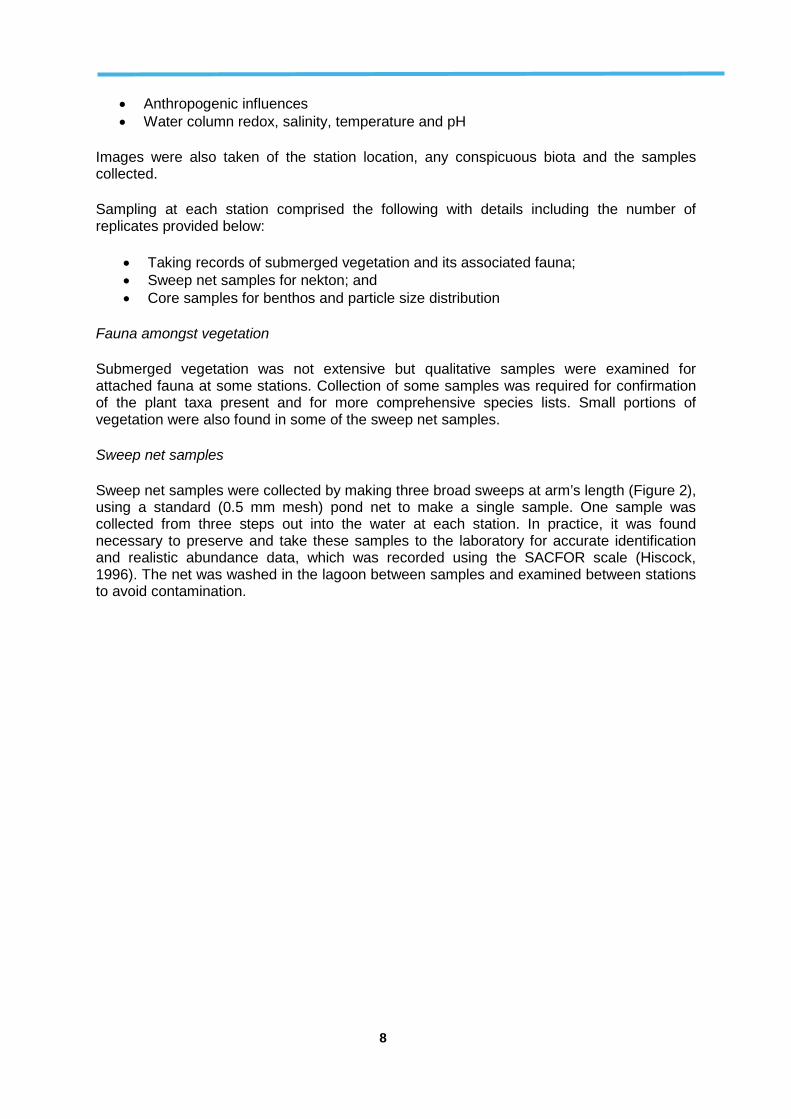
Figure 2: Sweep net sampling at Station BS9 ......................................................................... 9
Figure 3: PSA sample from Station BS2................................................................................ 10
Figure 4: Folk sediment classification pyramid (Folk, 1954). ................................................. 12
Figure 5: A sluice at Brownsea Island Lagoon....................................................................... 17
Figure 6: Freshwater input at Brownsea Island Lagoon ......................................................... 17
Figure 7: Biotopes recorded within the Brownsea Island lagoon ........................................... 20
Figure 8: SIMPROF cluster dendrogram based on mean abundance data for each station .. 25
Figure 9: SIMPROF 2D MDS ordination based on mean abundance data for each station ... 25
Figure 10: Gracilariaceae observed at Station BS2 ............................................................... 26
List of Tables
Table 1: Final sampling locations for Brownsea Island lagoon survey ..................................... 5
Table 2: Biotopes recorded during the survey ....................................................................... 15
Table 3: Physicochemical data recorded at each sample station. ......................................... 22
Table 4: Particle Size Analysis data recorded at each sample station. .................................. 22
Table 5: Population summary statistics data for each sample station .................................... 23
Table 6: Comparison of current and historic abundances of Nematostella vectensis............. 28
Table 7: Condition for attributes of the Brownsea lagoon ...................................................... 29

1. Executive Summary
Natural England (NE) commissioned APEM to carry out a biological survey of the saline lagoon on Brownsea Island, within the Poole Harbour SPA and SSSI. Coastal lagoon communities are a key attribute of the SPA and SSSI coastal lagoon features
The aim of this survey is to make a preliminary assessment of change within the lagoon absed on historical data. The methods employed within this study followed previous monitoring activities reporting on quantitative and qualitative characteristics of five key lagoonal quality features: benthos, nekton, flora & fauna amongst vegetation, epifauna and physicochemical condition.
Results of sampling were compared with the previous survey of the lagoon undertaken by Herbert et al. (2010). These data were then used to indicate whether any changes in physicochemical parameters or biota were evident to make a preliminary assessment of change since this prevous survey.
Six sampling stations were selected to correspond with historical sampling stations whilst a further six were added to provide greater coverage and detail on the condition of the lagoon. The sampling consisted of qualitative Phase I and quantitative Phase II survey. For the Phase I survey, the main biota present in and around the lagoon were recorded including the main vegetation taxa present, and records were taken of conspicous invertebrate fauna and megafauna (e.g. insects and birds). Preliminary biotope maps for the lagoon were produced in situ based on observed sediment types and biota which were further refined based on the results of the quantitative sampling. During the Phase I survey, notes were also taken relating to the nature of any isolating barriers and the presence of any potential anthropogenic pressures.
The Phase II survey consisted of recording physicochemical parameters in the water column, collecting and analysing in situ semi-quantitative sweep net samples of the nekton, recording taxa found on vegetation, collecting benthic core samples for subsequent laboratory analysis (enumeration and biomass) and obtaining samples for particle size analysis. Core data were analysed to determine simiarity across invertebrate communities recorded at different stations using SIMPROF in PRIMER v6. The communtiy of organisms present in the lagoon was discussed and the presence of any lagoon specialists and/or non-native species was highlighted.
Across the lagoon physicochemical data were found to be within the range expected of lagoonal systems and broadly comparable with the findings of Herbert et al. (2010), although sediments were found to be slightly coarser in nature in the current survey.
Brownsea Island lagoon is a percolation lagoon with movement of water through the gravel below the dyke between the lagoon and adjacent littoral habitats. There were also two sluices to the southeast that provided more direct connection to the sea and woodland, marsh and freshwater pools to the west. The extent of the lagoon basin determined from aerial imagery was calculated in GIS to be 16.7 Ha.
The main body of the lagoon was dominated by a biotope in the complex: Sublittoral mud in low or reduced salinity (lagoons) SS.SMu.SMuLS (Connor et al. 2004) that included large numbers of the Starlet anemone (Nematostella vectensis). The lagoon margin especially along the western boundary of the lagoon included the biotope Phragmites australis swamp
1

and reed beds’ SS.SMP.Ang.S4. Following Bamber et al. (1997) the subtidal biotopes in the lagoon would be ENLag.IMS.Ann and ENLag.Veg.
The biological communities appear to have remained relatively similar between the current survey and that of Herbert et al. (2010). There appears to have been a slight increase in biodiversity manifested through higher taxon counts at comparable stations, although given the increased number of sampling stations a full comparison across the entire lagoon was not feasible. Station BS8 appeared notably impoverished in regards to the biotic community relative to other sampling stations, which likely derives from its partial separation from the main lagoon. The presence of Capitella as a main species here suggests organic enrichment, possibly a result of bird excrement. Station BS12 was close to a sluice and to a site previously sampled qualitatively; it included species that reflect greater saline influence.
This preliminary condition of assessment based on historical data from Herbert et al. (2010) indicated that the lagoon has remained in similar condition over the last five or so years. The increased sampling stations in the current survey indicated a greater range of species than previously recorded and the results confirm that the lagoon is home to a range of lagoonal specialist taxa as well as a significant population of the nationally rare starlet anemone (N. vectensis).
2

2. Introduction
2.1 Background
Coastal saline lagoons are a Priority Habitat under the EU Council Directive 92/43/EEC on the Conservation of Natural Habitats and of Wild Fauna and Flora (the “Habitats Directive”). As such, they can be features of sites conservation importance such as Special Areas of Conservation (SACs).
Natural England (NE) commissioned APEM to carry out a biological survey of the saline lagoon on Brownsea Island, within the Poole Harbour SPA and SSSI. Coastal lagoon communities are a key attribute of the SPA and SSSI coastal lagoon features and include lagoon specialist species and habitats for birds. Coastal lagoons have been recognised as habitat of biodiversity importance and as such recognised by the UK former Biodiversity Action Plan.
Brownsea Island is located within the centre of Poole Harbour. The saline lagoon is on the north east side of Brownsea Island and extends about 800 m north to south, adjacent to the coast (Main Channel of Poole Harbour); it is about 400 m wide. The island is a particularly important feeding and roosting area for wintering birds as well as the only known nesting site for sandwich terns and common terns in the harbour.
The lagoon is primarily managed by the Dorset Wildlife Trust. Water exchange within the lagoon is managed via a sluice in the south-eastern corner of the lagoon and on the east side by a wind-pump. The lagoon is fed by small streams that discharge through reed beds into the west side of the lagoon. Water levels rarely exceed 0.3m across the lagoon.
This interpretative report outlines the methods used, survey area and sampling design, the results of the sampling undertaken and provides an initial assessment of feature condition against historical data.
2.2 Objectives
The aim of the Project was to establish the condition of the biotopes and communities of the lagoon and compare with previous studies, with reference to Common Standards Monitoring (CSM) (lagoons). The survey plan was to record and map marginal and submerged biotopes, species composition of conspicuous biota, open water nekton, vegetation and associated fauna and benthic habitats, as well as granulometry and salinity data from the subtidal habitats. The specific objectives of the survey were to:
i) carry out a Phase I habitat and biotope survey;ii) carry out quantitative (Phase II) sampling of the lagoon at suitable locations;iii) conduct a range of water quality measurements;iv) undertake in situ counts of marine megafauna such as birds and fish;v) record any species amongst the vegetation; andvi) record anthropogenic influences impacting on identified features.
3

2.3 Historical data
The most recent biological survey of Brownsea Island Lagoon was by Bournemouth University in 2009 (Herbert et al., 2010). At each of six stations across the lagoon, they made in situ records of salinity and biota from submerged vegetation and sweep net samples, and collected three 10 cm diameter cores for benthos and a 6 cm diameter core for granulometry. English saline lagoons including Brownsea Island Lagoon were reviewed by Smith & Laffoley (1992) and Downie (1996) and Bamber (1997).
3. Methods
The proposed survey approach focused on developing a cost effective sampling strategy using qualitative Phase I and quantitative (Phase II) sampling techniques. The survey design aimed to obtain standardized information on the features of the lagoon including extent, barrier condition, sources of freshwater or saline inputs and also the habitat features and marine communities present within the lagoon environment.
The surveys were completed on the 15th and 16th September 2015.
3.1 Survey permissions
Access permissions for the survey were initially researched by Natural England. APEM liaised with Dorset Wildlife Trust manager Chris Thain for site access, use of their punt and to agree survey timing. It was agreed to mitigate disturbance to local wildlife, bird watchers and tourists visiting the island by avoiding intensive activity during midday (between 10.30 and 16.00).
A license (L/2015/00303) to collect protected species (Nematostella vectensis, Gammarus insensibilis, Victorella pavida, Tenellia adspersa), that may potentially have been present in the lagoon samples, was obtained from the Marine Management Organization (MMO). Another license (2015-14687-SCI-SCI) was obtained from Natural England for potential intertidal disturbance.
3.2 Survey design
3.2.1 Sampling locations
Aerial imagery, provided by Natural England, was used to produce preliminary wire-frame maps of the distribution of broad scale habitats in preparation for Phase I mapping (Wyn et al., 2006). They also helped to identify appropriate sampling points and help consider access locations across the sites for the field team to use.
Phase I biotope mapping was carried out to provide 100% coverage of the lagoon. Detailed records and samples were collected from 12 stations via Phase II survey. A preliminary map of proposed sampling stations was provided to Natural England before the survey. Further details can be found in the full field report (Worsfold et al., 2015).
4

The final design included some flexibility in case more suitable or interesting locations were noted in the field during the Phase I survey work. Additionally it was noted that some station positions may require alteration in the field, in preference to those originally proposed, due to considerations of access. The final station array was therefore decided by the lead surveyor in situ and all final sampling locations were located using a handheld GPS. Additionally the Dorset Wildlife Trust site manager for Brownsea Island Lagoon, Chris Thains, joined the survey team to provide detailed local knowledge, including advice for any relocation of sampling locations.
The 12 actual stations that were sampled are indicated below in Figure 1 with coordinates presented in Table 1. Projected coordinate system for the eastings and northings was British National Grid (OSGB 1936).
Table 1: Final sampling locations for Brownsea Island lagoon survey
Station Easting Northing BS1 402753 88373 BS2 402964 88378 BS3 403070 88238 BS4 403098 87952 BS5 403153 87890 BS6 402767 88142 BS7 402931 88291 BS8 403109 88101 BS9 403019 87747 BS10 402764 87983 BS11 402792 87959 BS12 403141 87786
5

Figure 1: Locations of sampling stations within the Brownsea Island lagoon
6

3.3 Survey design
3.3.1 Phase I survey
The Phase I survey recorded the range and extent of biotopes present in intertidal areas by assigning biotopes in situ with reference to standard guidance (Wyn et al. 2006) and using standard biotope descriptions, as applicable (Connor et al. 2004, Parry 2015). A hand held GPS (accuracy 5 m or better) was used to plot the positions of biotope boundaries, photographs, in situ records and sampling points.
A broad habitat description was provided for the lagoon, using standard JNCC Marine Nature Conservation Review (MNCR) survey and site forms. Photographs were taken to show the entire perimeter, as well as survey activity, samples, conspicuous biota and any anthropogenic influences.
Notes were made on the wire frame maps providing details including location, main habitat and substratum types, depth range, aspect, perimeter, and conspicuous biota. A hand-held refractometer (Barsoom Automatic Temperature Compensation Salinity Refractometer) was used to measure salinity and a calibrated multiparameter probe (HM Digital ORP-200 Waterproof Meter) to measure temperature, pH and water column redox potential. Biotopes were mapped using GPS and photographs and additional qualitative salinity and species records were also made on the maps.
The type of lagoon and the condition of the sluice gates were recorded as part of the site assessment. This included an indication of sluice gate location, water inputs/outputs, directions of water flow and characteristics of the isolating barrier. These records were supplemented with input from the management teams of each lagoon, either in the field or by telephone. In addition to recording salinity, pH, temperature and redox within the lagoon and at significant points around the lagoon; measurements were also taken from the sea outside of the lagoon (i.e. within Poole Harbour to provide a comparison).
Potential anthropogenic pressures were identified and recorded (where applicable, GPS coordinates of the potential pressures were noted).
Conspicuous biota were recorded in the field, on a SACFOR scale, for submerged and emergent habitats. Target notes were made regarding the presence of any megafauna (e.g. birds, dragonflies). Habitats not targeted for quantitative sampling, such as logs and reeds at the water’s edge, were examined for conspicuous biota. Particular attention was given to protected, invasive and non-native species, such as starlet sea anemones (Nematostella vectensis) (Reitzel et al., 2008). Species that could not be readily identified in the field were retained for later identification in APEM’s laboratories.
3.3.2 Phase II survey
At each Phase II sampling station, the following data were recorded:
• Date;• Time;• Position (using hand held GPS);• Depth (recorded for each core sample);• Substratum type;
7
• Anthropogenic influences• Water column redox, salinity, temperature and pH
Images were also taken of the station location, any conspicuous biota and the samples collected.
Sampling at each station comprised the following with details including the number of replicates provided below:
• Taking records of submerged vegetation and its associated fauna;• Sweep net samples for nekton; and• Core samples for benthos and particle size distribution
Fauna amongst vegetation
Submerged vegetation was not extensive but qualitative samples were examined for attached fauna at some stations. Collection of some samples was required for confirmation of the plant taxa present and for more comprehensive species lists. Small portions of vegetation were also found in some of the sweep net samples.
Sweep net samples
Sweep net samples were collected by making three broad sweeps at arm’s length (Figure 2), using a standard (0.5 mm mesh) pond net to make a single sample. One sample was collected from three steps out into the water at each station. In practice, it was found necessary to preserve and take these samples to the laboratory for accurate identification and realistic abundance data, which was recorded using the SACFOR scale (Hiscock, 1996). The net was washed in the lagoon between samples and examined between stations to avoid contamination.
8

Figure 2: Sweep net sampling at Station BS9
Coring survey
Quantitative subtidal core samples were collected using a 0.01 m2 hand held core pushed into the sediment to a depth of 15 cm (Dalkin & Barnett 2001). Core sampling was based on the methodologies within the Marine Monitoring Handbook (Davies et al. 2001) which are directly referenced within the CSM guidance. Three core samples were taken the same depth at each station for biological analysis.. The corer was washed in the lagoon between samples and examined between stations to avoid contamination. Each sample was placed into a robust plastic bag, labeled and photographed before being sealed for later processing. Within 24 hours of collection, the biological core samples were sieved over a BS410 standard 0.5 mm mesh and preserved in buffered 4% formaldehyde solution. Samples were processed in accordance with the National Marine Biological Analytical Quality Control Scheme (NMBAQC) best practice guidance for sample collection, preservation, tracking and transportation for invertebrate samples (Worsfold & Hall 2010). The samples were then couriered to the third party analytical laboratories.
9

APEM Scientific Report 414247
Figure 3: PSA sample from Station BS2
One additional core sample was collected at each station for particle size analysis (PSA). This sample was collected from one step in from the margin and placed into a dedicated, labelled sample container, supplied by National Laboratory Services (NLS). The PSA samples were frozen within 24 hours of collection and kept frozen until transportation to NLS for analysis. NMBAQC guidance for sample collection, preservation, tracking and transportation for PSA samples was followed (Mason 2011).
3.4 Laboratory processing
3.4.1 Macrobiota
To standardise the sizes of organisms recorded, and to separate preservative from the biota, all samples were washed over a 0.5 mm sieve in a fume cupboard. All biota retained in the sieve were then extracted, identified and enumerated, where applicable.
Taxa were identified to the lowest possible practicable taxonomic level using the appropriate taxonomic literature. For certain taxonomic groups (e.g. nemerteans, nematodes, and certain oligochaetes), higher taxonomic levels were used due to the widely acknowledged lack of appropriate identification tools for these groups. The National Marine Biological Analytical Quality Control (NMBAQC) Scheme has produced a Taxonomic Discrimination Protocol (TDP) (Worsfold & Hall 2010) which gives guidance on the most appropriate level to which different marine taxa should be identified, and this guidance was adhered to for the laboratory analysis. Where required, specimens were also compared with material maintained within the laboratory reference collection. Nomenclature followed the World Register of Marine Species (WoRMS), except where more recent revisions were known to supersede WoRMS.
All samples were subject to internal quality assurance procedures and, following analysis, were subject to formal Analytical Quality Control (AQC).
10

3.4.2 Particle Size Analysis
Sub-sampling and PSA was performed in accordance with NMBAQC Best Practice Guidance (Mason 2011), with the modification that the wet separation was performed at 2 mm rather than 1 mm, to determine the ‘gravel’ to ‘sand and mud’ proportions by weight. A combination of dry sieving and laser diffraction was used depending upon the characteristics of the sediment.
3.5 Data analysis
3.5.1 Particle Size Distribution
The particle size data from all survey replicates were combined as consistent size fractions and entered into GRADISTAT (Blott & Pye 2001) to produce sediment classifications, following Wentworth (1922) and Folk (1954) (Figure 4). Summary statistics were also calculated including mean particle size and sorting (Table 4). The full raw data set is presented in Appendix 1.
11

Figure 4: Folk sediment classification pyramid (Folk, 1954).
3.5.2 Macrobiota
Truncation of the macrobiota data was undertaken before calculation of univariate and multivariate statistics. Juveniles were combined with adults of the same recorded taxon name for calculation of numbers of taxa and epitokes were also combined for the same taxon name.
For analyses based on numbers of individuals, non-countable taxa, copepods, fish and fragments of individuals were also omitted from analysis.
12

3.5.3 Univariate analysis
Univariate community analyses were undertaken using the PRIMER (version 6) software package. Biological diversity within a community was assessed based on taxon richness (total number of taxa present) and evenness (considers relative abundances of different taxa). The following metrics were calculated:
• Shannon-Wiener Diversity Index (H’(loge): This is a widely used measure ofdiversity accounting for both the number of taxa present and the evenness ofdistribution of the taxa (Clarke & Warwick 2006).
• Margalef’s species richness (d): This is a measure of the number of speciespresent for a given number of individuals.
• Pielou’s Evenness Index (J’): This represents the uniformity in distribution ofindividuals spread between species in a sample. High values indicate more evennessor more uniform distribution of individuals. The output range is from 0 to 1.
• Simpson's Dominance Index (1-λ): This is a dominance index derived from theprobability of picking two individuals from a community at random that are from thesame species. Simpson’s dominance index ranges from 0 to 1 with lower valuesrepresenting a more diverse community without dominant taxa.
Where mean values have been calculated per station, the standard deviation has been provided.
3.5.4 Multivariate analysis
Macrofaunal data were subjected to multivariate analysis using the PRIMER (version 6) software package (Clarke & Warwick 2006).
Multivariate analyses were computed from resemblance or similarity matrices. The particle size data resemblance matrix was calculated using Euclidean Distance following normalisation. For the macrofaunal data set, the Bray-Curtis measure of similarity was used following a square root transformation of the data to reduce the influence of highly abundant or dominant species.
Cluster Analysis
CLUSTER analysis was utilised to provide a visual representation of sample similarity in the form of a dendrogram. CLUSTER analysis was conducted in conjunction with a SIMPROF (similarity profile) test to determine whether groups of samples were statistically indistinguishable at the 5% significance level, or whether any trends in groupings were apparent. Black lines on the dendrogram indicate statistical distinctions between sampling stations, whilst red lines indicate that the samples were statistically inseparable.
Non-Metric Multidimensional Scaling (nMDS)
Non-metric multidimensional scaling (MDS) is a type of ordination method which creates a 2- or 3-dimensional ‘map’ or plot of the samples from the Primer resemblance matrix. The plot generated is a representation of the dissimilarity of the samples (or replicates), with
13

distances between the replicates indicating the extent of the dissimilarity. For example, replicates that are more dissimilar are further apart on the MDS plot. No axes are present on the MDS plots as the scales and orientations of the plots are arbitrary in nature.
Each MDS plot provides a stress value which is a broad-scale indication of the usefulness of plots, with a general guide indicated below (Clarke & Warwick, 2006):
<0.05 Almost perfect representation of rank similarities; 0.05 to <0.1 Good representation; 0.1 to <0.2 Useful representation; 0.2 to <0.3 Should be treated with caution; >0.3 Random.
SIMPER
Where differences between groups of samples were found, SIMPER analysis (in Primer v6) was used to determine which taxa were principally responsible for the differences between the statistically distinct groups of stations. The aim was to characterise the typical assemblage responsible for the grouping.
14

4. Results
4.1 Phase I survey
Across the lagoon and its margins, a total of eight biotopes were recorded (Table 2) with further detail of their distribution provided in Section 4.1.2.
Table 2: Biotopes recorded during the survey
JNCC Biotope
EUNIS Code
EUNIS Level 2
EUNIS Level 3
EUNIS Level 4
EUNIS Level 5
EUNIS Level 6
Area (Ha) Name
LS.LMu.# A2.3# A2 A2.3 - - - 0.675 Littoral mud. Undescribed lagoonal biotope
LS.LMx.# A2.4# A2 A2.4 - - - 0.003
Littoral mixed sediments. Undescribed lagoonal biotope
LS.LMp Sm.SM8 A2.5513 A2 A2.5 A2.55 A2.551 A2.5513 1.359
Salicornia spp. pioneer saltmarshes
LS.LMp.Sm.# A2.547 A2 A2.5 A2.54 A2.547 - 0.164
Sub-communities of Puccinellia maritima saltmarsh with Limonium vulgare and [Armeria maritima. Variant dominated by Armeria maritima
SS.SMu.SMuLS A5.31 A5 A5.3 A5.31 - - 15.833
Sublittoral mud in low or reduced salinity (lagoons)
SS.SMp.Ang.NVC S4 and LS.LMp.Sm.#
A5.541 and
A2.53C
A5 and A2
A5.5 and A2.5
A5.54 and
A2.53
A5.541 and
A2.53C - 6.220
Phragmites australis swamp and reed beds / Marine saline beds of Phragmites australis
SS.SMp.KSwSS.# A5.52# A5 A5.5 A5.52 - - 1.315
Kelp and seaweed communities on sublittoral sediment (undescribed biotope with Gracilaria sp. on lagoonal mud)
LS.LMp.Sm.# A2.53# A5 A5.5 A5.53 - - 1.295 Saltmarsh (Bolboschoenus maritimus stands)
‘#’ = variant biotope
15

4.1.1 Physical structure and management
Brownsea Island lagoon is a percolation lagoon with movement of water through the gravel below the dyke between the lagoon and adjacent littoral habitats. The dyke extended along about half the perimeter of the lagoon to the north and east. The lagoon was originally created by the building of this dyke to enclose an area that was previously agricultural or estuarine. There were also two sluices to the southeast (Figure 5) that provided more direct connection to the sea. There was woodland, marsh and freshwater pools to the west with several inputs of fresh water along the western margin of the lagoon (Figure 6). The extent of the lagoon basin determined from aerial imagery was calculated in GIS to be 16.7 Ha.
16

Figure 5: A sluice at Brownsea Island Lagoon
Figure 6: Freshwater input at Brownsea Island Lagoon
17

4.1.2 Ecological characteristics
The main body of the lagoon was dominated by a biotope in the complex: Sublittoral mud in low or reduced salinity (lagoons) SS.SMu.SMuLS (Connor et al. 2004) that included large numbers of the Starlet anemone (Nematostella vectensis) (Figure 7). There were also patches of Gracilaria embedded in and growing out from the mud that represented an undescribed biotope in the complex SS.SMp.KSwSS: kelp and seaweed communities on sublittoral sediment.
The lagoon margin especially along the western boundary of the lagoon included the biotope Phragmites australis swamp and reed beds’ SS.SMP.Ang.S4, where there was standing water around the reeds; this graded into LS.LMp.Sm (A2.53C) marine saline beds of Phragmites australis in the drier areas. The lagoon margins also included occasional patches of sea club rush (Bulboschoenus maritimus), as a biotope not yet defined in the literature. There were also areas with two other saltmarsh communities; some were dominated by samphire (Salicornia ramosissima), a biotope closest to LS.LMp Sm.SM8: Salicornia spp. pioneer saltmarshes; another was dominated by Armeria maritima and did not fit any described biotope well but was close to A2.547: Sub-communities of Puccinellia maritima saltmarsh with Limonium vulgare and Armeria maritima. At the waters edge, there were patches of bare mud and muddy sand, particularly in areas intensively used by water birds. These have been recorded as littoral, although the variability in their cover by water was more likely to have been determined by weather conditions or management systems than by the tides.
An alternative classification system is referred to in the Condition Assessment Guidance for lagoons based on Bamber et al. (1997) which refers to lagoon biotopes as ENLag.Veg or ENLag.IMS.Ann and variations thereof (for full detailed list of classification see Appendix 2) . Following Bamber et al. (1997) the subtidal biotopes in the lagoon would be ENLag.IMS.Ann and ENLag.Veg. ENLag.IMS.Ann is characterised by an annelid worm dominated community. The annelids Baltidrilus costatus and Tubificoides benedii were abundant at most core sample stations and Hediste diversicolor was also common at several stations (see Section 3.2.4). The amphipod Corophium volutator and starlet anemone (N. vectensis) were also widespread and common.
The biotope ENLag.Veg is characterised by a community associated with submerged vegetation, irrespective of substratum or plant species. Submerged vegetation comprised patches of Chaetomorpha linum and Gracilaria cf. vermiculophylla, with occasional Ulva spp. on the margins. These supported cryptofauna, such as Monocorophium insidiosum, Idotea chelipes and Melita palmata. Sweep net samples also included I. chelipes, starlet anemone (Nematostella vectensis) and other benthic species (incidental catches from the sediment), as well as the lagoon prawn Palaemon varians.
There were many birds in and around the lagoon, including spoonbills, oystercatchers, mute swans, moorhens, common and sandwich terns. There were occasional pieces of wood at the margin with talitrids (Orchestia gammarellus) and enchytraeid oligochaetes. Data for the sweep net and core samples are provided in Section 4.2.2 below.
18

4.1.3 Anthropogenic influences
Anthropogenic influences were not great at Brownsea lagoon. The lagoon was separated from marine habitats to the north and east by a narrow dyke. There were walkways around many parts of the lagoon and many visitors. There was evidence of restructuring of islands for bird use and bird hides were present. There was very occasional litter, including fishing tackle.
19

Figure 7: Biotopes recorded within the Brownsea Island lagoon
20

4.2 Phase II survey
Three core samples and single PSA samples were obtained and photographed at twelve sample sites, along with sweep net samples. Five stations (BS1 to BS5) were repeated from the previous survey. Although also targeted, Station BS6 could not be sampled as it was positioned at the end of a jetty; the jetty was entirely fenced off to create a secluded bird hide so that the original station could only have been accessed by wading from the shore; it was also disturbed by dredging (C. Thain pers comm.). Six new stations (BS7 to BS12) were added to cover a range of habitats.
The new Station BS8 provides characterisation of a pool that was partially separated from the main lagoon, with a different character. The new Stations BS10 and BS11 characterised a point of freshwater input: one in the input channel, one near it in the main lagoon. Samples were collected at water depths between 3 cm and 20 cm.
4.2.1 Physico-chemical characteristics
Salinity ranged from 3 at Station BS11 to 30 at Station BS8. Lower salinity was recorded at Stations BS9 and BS10 (5 and 4 respectively). These lower salinity stations were typically furthest from the sea and had some freshwater inputs in places. In contrast, all other stations were ≥20, except Station BS6 (15). To provide context, salinity recorded outside of the lagoon (see Figure 1 for location) at 16:20 on the 15th September on a falling tide was 35.
Temperature across the lagoon sampling stations varied from 13.3°C at Station BS5 to 18.9°Cat Station BS1. Higher temperatures were also recorded at BS2 (17.8°C) and BS12 (18.8°C) with all remaining stations ≤15.2°C.
Redox measurements taken across the lagoon were shown to be variable in nature, ranging from -63 mV at Station BS5 to 160 mV at Station BS1. Stations BS8 and BS9 were the only other two locations to record negative values for redox. Overall redox values were typically highest amongst those stations located around the North West area of the lagoon. Full water quality data is presented in Appendix 3.
Mean particle size ranged from 3508.0 µm at Station BS4 to 36.0 µm at Station BS9. Very high mean particle size was also recorded at Station BS3 (2417.2 µm) with all other stations below <200µm mean particle diameter. Both BS3 and BS4 were extremely poorly sorted and found to comprise 56.5% and 57.1% gravel with all other stations ≤15.8%, and the majority below 1%. These locations were either poor or very poorly sorted. All stations except BS3 and BS4 were described as either gravelly or slightly gravelly sandy mud or muddy sand. Station BS3 was found to be muddy gravel and BS4 was muddy sandy gravel. Raw sediment sample data is presented in full in Appendix 1.
21

Table 3: Physicochemical data recorded at each sample station.
Station Water depth (cm) Salinity Redox (mV) Temp (°C) BS1 9 20 160 18.9 BS2 12 22 132 17.8 BS3 15 22 103 13.1 BS4 11 20 57 15.2 BS5 3 35 -63 13.3 BS6 3 15 141 13.6 BS7 6 22 89 14 BS8 9 30 -13 14.7 BS9 7 5 -11 14.2 BS10 20 4 40 14 BS11 16 3 19 14 BS12 - 20 79 18.8
Table 4: Particle Size Analysis data recorded at each sample station.
Station Mean (µm) Gravel (%) Sand (%) Mud (%) Folk* Sorting
BS1 59.3 0.8 49.3 49.9 (g)sM Very poor BS2 41.2 0.5 38.9 60.6 (g)sM Poor BS3 2417.2 56.5 19.1 24.5 mG Extremely poor BS4 3508.0 57.1 26.8 16.1 msG Extremely poor BS5 121.9 2.7 61.8 35.5 (g)mS Very poor BS6 43.8 0.4 38.9 60.7 (g)sM Very poor BS7 199.3 0.8 76.0 23.1 (g)mS Very poor BS8 165.7 15.8 49.4 34.9 gmS Very poor BS9 36.0 0.3 33.8 65.9 (g)sM Very poor BS10 116.1 12.3 49.3 38.4 gmS Very poor BS11 59.9 0.4 49.2 50.4 (g)sM Poor BS12 117.4 10.3 50.2 39.5 gmS Very poor
* Folk (1954) classifications: mG = muddy gravel; msG = muddy sandy gravel; (g)sM = Slightlygravelly sandy mud; gsM = gravelly sandy mud; (g)mS = Slightly gravelly muddy sand
4.2.2 SACFOR data from sweep nets
The number of taxa recorded in sweep net samples at stations ranged from three to nine (Appendix 4). The most commonly sampled species in sweep net samples from Brownsea Island lagoon was the cryptogenic lagoonal specialist Monocorophium insidiosum (recorded in ten samples), whilst the nationally rare starlet anemone Nematostella vectensis, Corophium volutator and Ecrobia ventrosa (spire snail) were recorded across eight samples. Both the latter two taxa are known lagoonal specialists. M. insidiosum was found to be superabundant at Stations BS1, BS4 and BS5 but was absent from BS6, BS10 and BS11. Nematostella was present in superabundance at Stations BS1, BS5 and BS9 but absent entirely from BS2, BS6 and BS10 through BS12. The full raw data from the sweep net samples are provided in Appendix 4.
4.2.3 Population summary statistics from core samples
Raw data from the core samples are provided in Appendix 5.
22

The mean number of taxa within the Brownsea Island lagoon stations ranged from 2.7 ± 1.5 SD at Station BS8 to 14.7 ± 4.0 SD at Station BS3. The mean number of taxa remained >10.0 at almost 50% of sampling stations (BS1, BS4, BS5 and BS12). Low taxon abundance was also recorded at Stations BS10 and BS11, both located along the western perimeter of the lagoon and targeting freshwater input areas.
Trends in mean abundance broadly followed trends in taxon richness across most stations. One exception was that, despite having by far the lowest taxon richness, Station BS8 had a greater mean abundance than either Station BS10 or BS11. However, despite an abundance of 3,733 individuals per m2, Station BS8 also had an extremely high SD relative to other sampling stations (± 3,731 SD). Shannon-Weiner index values for diversity suggested that, within the lagoon, communities were generally not particularly diverse and in some instances were notably impoverished. The greatest diversity was recorded at Stations BS3 and BS4 (2.0 ± 0.2 and 0.1 SD respectively) to just 0.3 ± 0.2 SD at BS8.
The results for the Pielou’s Evenness and Simpson’s dominance indices indicated that the evenness of the benthic communities varied with low evenness recorded at Station BS8, providing evidence that a small number of taxa dominated assemblages at this location (Table 5). With the exception of Station BS8, both evenness and dominance values became much more comparable amongst remaining sampling stations. This indicated that across much of the lagoon benthic communities were generally well distributed, but within the vicinity of BS8, which was partially separated from the main body of the lagoon, the community was less well distributed.
Table 5: Population summary statistics data for each sample station. SD, Standard Deviation
Station Mean no.
taxa (number ±
SD)
Mean abundance (m2, ± SD)
Margalef’s species richness
(d)
Mean Pielou’s
Evenness (J’)
Mean Shannon Wiener
Diversity (H’(loge))
Mean Simpson’s Dominance
(1-λ)
BS1 10.0 ± 3.0 20,400± 10,484 1.7 ± 0.4 0.73 ± 0.04 1.7 ± 0.2 0.76 ± 0.07
BS2 9.0 ± 2.6 24,567 ± 11,558 1.5 ± 0.4 0.75 ± 0.08 1.6 ± 0.2 0.74 ± 0.05
BS3 14.7 ± 4.0 20,700 ± 9,379 2.5 ± 0. 0.76 ± 0.05 2.0 ± 0.2 0.82 ± 0.05
BS4 11.7 ± 2.5 41,000 ± 10,315 1.8 ± 0.5 0.84 ± 0.06 2.0 ± 0.1 0.85 ± 0.02
BS5 13.7 ± 1.5 49,767 ± 9,364 2.0 ± 0.3 0.67 ± 0.06 1.7 ± 0.1 0.71 ± 0.04
BS6 5.0 ± 1.0 14,633 ± 6,417 0.8 ± 0.3 0.55 ± 0.02 0.9 ± 0.1 0.49 ± 0.02
BS7 8.3 ± 2.1 22,033 ± 2,597 1.4 ± 0.4 0.66 ± 0.11 1.4 ± 0.1 0.64 ± 0.04
BS8 2.7 ± 1.5 3,733 ± 3,731 0.4 ± 0.4 0.23 ± 0.20 0.3 ± 0.2 0.13 ± 0.12
BS9 6.0 ± 0.0 13,233 ± 4,562 1.0 ± 0.1 0.69 ± 0.09 1.2 ± 0.2 0.64 ± 0.07
BS10 3.3 ± 1.2 1,833 ± 1,361 0.9 ± 0.0 0.63 ± 0.25 0.7 ± 0.1 0.37 ± 0.07
BS11 3.3 ± 0.6 667 ± 252 1.3 ± 0.3 0.85 ± 0.09 1.0 ± 0.2 0.58 ± 0.07
BS12 13.0 ± 3.0 45,367 ± 23,093 1.9 ± 0.4 0.76 ± 0.01 1.9 ± 0.2 0.81 ± 0.03
Min 2.7 667 0.8 0.23 0.3 0.13 Max 14.7 49,767 2.6 0.85 2.0 0.85
23

4.3 Multivariate analysis of biological assemblages
Cluster analysis was initially run on the replicate data and a total of 8 SIMPROF groups were identified; in many cases replicates from the same stations were grouped together. To facilitate interpretation of the data, cluster analysis was run again using mean values per station and these results have been presented here. Cluster analysis of station data indicated that the communities of organisms present within core samples were separated into three distinct SIMPROF groups a to c (Figure 8). The accompanying MDS plot provides an alternative visual representation of the groupings observed in the cluster analysis (Figure 9). A stress value of 0.07 for the MDS plot indicates that it was a good ordination providing a useful visual representation of the data (Clarke & Warwick, 2001).
The plot indicates that Station BS8 (group a) was mostly dissimilar to all other stations sharing only circa 10% similarity; this was due to very low abundance at this station. However only 12% similarity was shared between the two remaining groups (b and c) indicating that in terms of the biological assemblages, these groups were also very dissimilar. Group c comprised Stations BS10 and BS11, which were located along the western perimeter of the lagoon and targeted sources of freshwater inputs. The remaining nine stations belonged to a single cluster group (b).
Only a handful of taxa were recorded across Stations BS10 and BS11 and SIMPER analysis indicated that Chironomidae, Baltidrilus costatus and Tubificoides benedii were important for the similarity of these two stations. Similarity within stations belonging to group b derived mainly from similar trends in Nematotsella vectensis, B. costatus, Corophiidae and Hediste diversicolor, contributing 64% of similarity. Differences in trends of these taxa thereby accounted for much of the dissimilarity between different clusters of stations. The most dissimilar Station of group b (BS12) was noticeably different in its biota, with a higher diversity of polychaete worms. The increased diversity of polychaetes may suggest some form of organic enrichment, although this was not visually apparent and remains difficult to verify absent any sediment chemistry analysis. It may also be that the mixed sediment type, in combination with other environmental parameters has created favourable conditions for more polychaete species.
Full data from the SIMPER analysis output is presented in Appendix 6.
24

Figure 8: SIMPROF cluster dendrogram based on the square root transformed mean abundance data for each station
Figure 9: SIMPROF 2D Multidimensional Scaling (MDS) ordination based on the square root transformed mean abundance data for each station
BS
8
BS
12
BS
6
BS
9
BS
7
BS
5
BS
1
BS
2
BS
3
BS
4
BS
10
BS
11
Station
100
80
60
40
20
0%
Sim
ilarit
y
Transform: Square rootResemblance: S17 Bray Curtis similarity
SIMPROFabc
Transform: Square rootResemblance: S17 Bray Curtis similarity
SIMPROFabc
BS1BS2BS3BS4
BS5
BS6
BS7
BS8
BS9
BS10
BS11
BS12
2D Stress: 0.07
25

4.4 Notable species
4.4.1 Non-native species
New records of non-native species are made for British waters in most years and the native status of many known species requires further research (Katsanevakis et al., 2013). An initial review (Eno et al., 1997) required update, using newly published papers and reviews for other countries (e.g. Gollasch & Nehring, 2006). The most recent review for Britain and Ireland (Minchin et al., 2013) contains omissions; references to other information are necessary. The starlet anemone (Nematostella vectensis), found in the lagoon, has been shown to be non-native (Reitzel et al., 2008) and the amphipod Monocorophium insidiosum should be considered cryptogenic, as it has a wide global distribution (Prato & Biandolino, 2006), including areas where it is considered non-native (Heiman et al., 2008) and it is often associated with artificial habitats (Minchin, 2007). The polychaete genus Streblospio includes a non-native species (S. benedicti) that is very similar to the native S. shrubsolii and external confirmation would be desirable. The polychaetes Polydora cornuta and Tharyx ‘species A’ should also be considered cryptogenic. The New Zealand mud snail (Potamopyrgus antopodarum) was recorded at several stations. Confirmation of identity is needed for an alga recorded as Gracilariopsis longissima in 2009 (Herbert et al., 2010), and found during the present survey (Figure 10), but which may be the non-native Gracilaria vermiculophylla (see Thomsen et al., 2007).
Figure 10: Gracilariaceae observed at Station BS2
26

4.4.2 Species of conservation importance
The conservation value of many species is continually under review and more information on distribution and ecology is needed for most. Of the species found in the current survey, the starlet anemone (N. vectensis) is protected and classed as nationally rare (Sanderson, 1996). The Crustacea Idotea chelipes, Monocorophium insidiosum and Palaemon varians and the mollusc Ecrobia ventrosa are considered to be lagoon specialists.
4.4.3 Other noted species
The polychaete Capitella, found particularly at Station BS8 is considered representative of organic enrichment.
4.5 Comparison with historic data
The previous survey acquired samples from sampling locations BS1 to BS6; as BS6 was relocated during the current survey, discussions relating to changes since 2010 will focus primarily on Stations BS1 to BS5 (unless otherwise stated) which were sampled in the exact same location during 2015.
Salinity measurements from the current survey were found to be broadly comparable with those from the Herbert et al. (2010) survey with salinity across Stations BS1 to BS5 was found to range between 22 and 29 in 2010 (Herbert et al., 2010). The range was slightly expanded for the current survey, between 20 and 35. The salinity range remained acceptable for supporting N. vectensis populations but remains close to the overall threshold at which mortality may be induced – 16 to 35 (Herbert et al., 2010).
The previous study undertaken by Herbert et al. found sediment composition within the lagoon to be variable, with coarser sediments present along the eastern edge, whilst Station BS2 possessed finer sediments. Overall Herbert et al. (2010) concluded that stations were classified as either sand or muddy sand. Although many of the sampling stations within the current survey were either muddy or sandy in nature, there was an increase in gravel content with most sediments described as being slightly gravelly sandy mud or muddy sand, with Stations BS3 and BS4 classed as muddy gravel and muddy sandy gravel, respectively.
The current survey results indicated that 33 taxa were recorded from the acquired core samples across the entire survey area but, for Stations BS1 to BS5, this was reduced to 27 species. This was broadly comparable with the 23 species recorded from the core samples of Station BS1 to BS6 during the Herbert et al. (2010) survey, suggesting that diversity has remained relatively unchanged within the last five years. The slight increase may simply be a product of natural variation or may reflect the slightly greater variation in sediment types providing additional niche space to be occupied by a few new species.
Additionally, the 2010 report found an additional 4 species recorded in samples of seaweed and in net samples around the sluice. However, these were not noted to occur within the current survey data at Station BS12 located near the sluice. Within the re-
27

sampled stations (BS1 to BS5) the fauna comprised 9 annelids, 10 crustacea, 3 mollusca and 4 other species including insect larvae and the Schedule 5 protected anemone species N. vectensis. The current data recorded a higher number of annelid taxa (10) but fewer crustacean taxa (seven) and the same number of mollusc taxa. However, there was an increase in the contributions of other taxonomic groups which included bryozoans, insects, nematodes and nemerteans. Overall the taxonomic composition has remained broadly similar since 2010.
In 2010 lagoonal specialist species such as N. vectensis, Ecrobia ventrosa (formerly Ventrosia ventrosa) and the amphipod crustaceans Monocorophium insidiosum (formerly Corophium insidiosum) and C. volutator were recorded. These lagoonal specialists were also recorded within the current survey.
Populations of N. vectensis were found to be greater during the current survey than was observed in 2010. Across Stations BS1 to BS5 in 2010 the mean abundance of N. vectensis was 3,217 per m2, whereas for the current survey, it was 7,307 per m2. Notably, there was significantly higher abundance for Stations BS3 and BS4 (almost ten times greater than in 2010), although all stations recorded increases of at least three times (Table 6).
Table 6: Comparison of current and historic abundances of Nematostella vectensis
Survey Year BS1 BS2 BS3 BS4 BS5 Mean
2010 4,444 4,825 254 762 5,799 3,217 2015 2,933 1,367 2,033 6,000 24,200 7,307
Regarding the biotopes present within the Brownsea lagoon, using the ENLAG classification (Bamber et al., 1997) the 2010 report identified two biotopes to be present; ENLag.Veg and ENLag.IMS.Ann. The same biotopes were also determined to be present for the current survey.
4.6 Assessment of change
The Brownsea lagoon lies within the Poole Harbour SPA and SSSI (Unit 57), but is not a SAC supporting habitat for a SPA and is not a SSSI of itself, and as such a formal assessment of condition could not be undertaken. However, based on the previous study by Herbert et al. (2010) as discussed above, an initial assessment of change can be formally made. This is presented below in Table 7.
28

Table 7: Standards for defining favourable condition for attributes of the Brownsea lagoon based on common Standards Monitoring Guidance against previous historical reports (Herbert et al. 2010)
Attribute Common Standards Monitoring Target
Actual Value for Brownsea Island Lagoon
Is target met? Justification & Notable Comments (incl. comparisons with previous data)
Extent of feature Maintain the following extents of lagoon feature:
The extent of the lagoon identified by Herbert et al. in 2010 was 17.8 Ha.
The extent recorded in a GIS based on interpretation of aerial imagery collected in June 2014 was 16.7 Ha.
Yes.
The extent recorded for the lagoon was slightly reduced compared to historical extent values but likely to be within the expected natural variability for the system.
Furthermore, as the historic report did not clearly define how area was measured or calculated this result may be a product of considered this is likely due to human variability in interpretation/measurement of lagoon extent boundaries. Overall it should perhaps be considered that the extent of the lagoons has remained stable.
Extent of water At least 60% of the basin filled with water at all states of the tide and all year.
There is little tidal fluctuation in the lagoon. Water depth is managed on site by the Dorset Wildlife Trust via a sluice in the south-eastern corner of the lagoon and on the east side by a wind-pump. The lagoon is fed by small streams that discharge through reed beds into the west side of the lagoon.
Yes
At least 60% of the water of the lagoon persisting at all times of year and states of tide.
Isolating barrier – presence and nature
No change in structure of dyke. This will maintain the percolation route into the lagoon system. Sluices in good condition
The dyke appears stable and to be maintaining percolation into the lagoons. Sluices in good condition
Yes.
The integrity of all sluices, connecting pipework and drains for the lagoon has been maintained and they are in good working condition. Percolation flow has been maintained where required.
29

Attribute Common Standards Monitoring Target
Actual Value for Brownsea Island Lagoon
Is target met? Justification & Notable Comments (incl. comparisons with previous data)
Salinity regime Average seasonal salinity, and seasonal maxima and minima, should not deviate significantly from an established baseline.
Average salinity throughout a site would be expected to lie within a range of between 15 and 40.
Salinity within Brownsea lagoon ranged from 15 to 35.
Yes.
Salinity within lagoons was within the range 15-40.
It should also be noted that the salinity readings only indicate the conditions during the day of survey; the community living in the lagoon will be the result of an integration of the conditions over a longer period of time.
Water Depth Average water depth should not deviate significantly from an established baseline, subject to natural change:
Water depth at Brownsea lagoon not specified within the historic report.
Water depth was recorded at stations within the lagoon margins and was determined to be <30cm. Although sampling within the centre of the lagoon was not feasible, visual observations indicated water level to be even lower – with access restricted due to the muddy conditions and a lack of water preventing use of a punt to access the centre of the lagoon.
Consequently, depth data indicates a maximum depth of 30cm, with average depth impossible to determine
Cannot be confirmed.
Data collected not sufficient to assess as a reference baseline was not available. Data produced by the current study can be used as partial evidence to define baseline in the future.
Biotope composition of lagoon
Maintain the variety of biotopes identified for the site, allowing for succession/ known cyclical change:
Herbert et al. (2010) observed ENLag.IMS.Ann and ENLag.Veg biotopes to be present.
ENLag.IMS.Ann and ENLag.Veg biotopes present.
Yes. The historically recorded biotopes are still the dominant biotopes within the lagoons.
Extent of sub-feature or representative/ notable biotopes
No change in extent of the biotope(s) identified for the site, allowing for succession/known cyclical change.
Extents of biotopes mapped during the survey based on aerial imagery and in situ Phase I and Phase II survey can be calculated from the GIS outputs of the project.
Unknown, cannot be confirmed.
Insufficient previous extent data are available to enable a robust comparison of sub-feature/biotope extent. The current study will form a baseline with
30
Attribute Common Standards Monitoring Target
Actual Value for Brownsea Island Lagoon
Is target met? Justification & Notable Comments (incl. comparisons with previous data) which to assess this target in the future.
Distribution of biotopes
Maintain the distribution of biotopes, allowing for succession/known cyclical change.
Distribution of biotopes mapped during the survey based on aerial imagery and in situ Phase I and Phase II survey can be calculated from the GIS outputs of the project.
Unknown, cannot be confirmed.
No previous data are available to enable a robust comparison of sub-feature/biotope distribution. The current study will form a baseline with which to assess this target in the future.
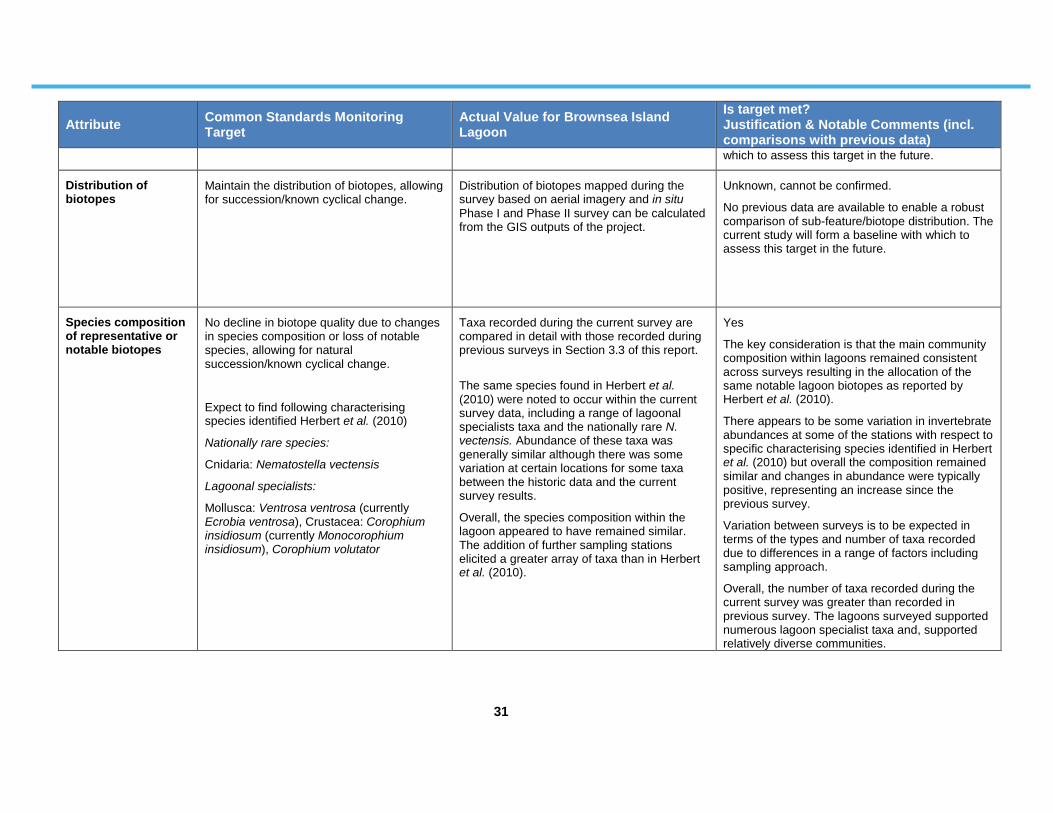
Species composition of representative or notable biotopes
No decline in biotope quality due to changes in species composition or loss of notable species, allowing for natural succession/known cyclical change.
Expect to find following characterising species identified Herbert et al. (2010)
Nationally rare species:
Cnidaria: Nematostella vectensis
Lagoonal specialists:
Mollusca: Ventrosa ventrosa (currently Ecrobia ventrosa), Crustacea: Corophium insidiosum (currently Monocorophium insidiosum), Corophium volutator
Taxa recorded during the current survey are compared in detail with those recorded during previous surveys in Section 3.3 of this report.
The same species found in Herbert et al. (2010) were noted to occur within the current survey data, including a range of lagoonal specialists taxa and the nationally rare N. vectensis. Abundance of these taxa was generally similar although there was some variation at certain locations for some taxa between the historic data and the current survey results.
Overall, the species composition within the lagoon appeared to have remained similar. The addition of further sampling stations elicited a greater array of taxa than in Herbert et al. (2010).
Yes
The key consideration is that the main community composition within lagoons remained consistent across surveys resulting in the allocation of the same notable lagoon biotopes as reported by Herbert et al. (2010).
There appears to be some variation in invertebrate abundances at some of the stations with respect to specific characterising species identified in Herbert et al. (2010) but overall the composition remained similar and changes in abundance were typically positive, representing an increase since the previous survey.
Variation between surveys is to be expected in terms of the types and number of taxa recorded due to differences in a range of factors including sampling approach.
Overall, the number of taxa recorded during the current survey was greater than recorded in previous survey. The lagoons surveyed supported numerous lagoon specialist taxa and, supported relatively diverse communities.
31

Attribute Common Standards Monitoring Target
Actual Value for Brownsea Island Lagoon
Is target met? Justification & Notable Comments (incl. comparisons with previous data) It was notable that the starlet anemone Nematostella vectensis (a protected lagoon specialist) was recorded in abundance.
Species population measures - Population structure of a species
Not specified No data collected Unknown, cannot be confirmed.
No data were collected to assess this attribute.
32

5. Discussion
In general, based on comparison of taxon lists with the previous assessment in 2010 (Herbert et al.), the biological communities appear to have remained relatively similar. There appears to have been a slight increase in biodiversity manifested through higher taxon counts at comparable stations, although given the increased number of sampling stations a full comparison across the entire lagoon was not feasible. Station BS8 appeared notably impoverished in regards to the biotic community relative to other sampling stations, which likely derives from its partial separation from the main lagoon. The presence of Capitella as a main species here suggests organic enrichment, possibly a result of bird excrement. Station BS12 was close to a sluice and to a site previously sampled qualitatively; it included species that reflect greater saline influence. It would be beneficial to confirm the identity of the possibly non-native Streblospio and gracilariacean taxa.
It is recommended that future surveys continue to use the 12 sampling stations, rather than just the six from Herbert et al. (2010), as the extra coverage yielded greater detail and reliability of results and was also able to highlight subtle spatial variations in both physico-chemical and faunal characteristics. The sampling strategy applied during the current survey provides a fully repeatable method for future survey of the lagoon to enable direct comparison of both qualitative and quantitative data, and this design will facilitate the application of robust statistical techniques for future assessments.
As the main exchange of the lagoon with the sea is via percolation, Brownsea lagoon is relatively isolated and self-contained and therefore expected to be subject to variation in physico-chemical parameters throughout the year e.g. temperature changes, or changes in salinity due to heavy rainfall events. Such natural variability is expected to influence the taxa present within lagoons and, where available, sluicing can provide a management option to modify water levels within lagoons and influence water quality including salinity levels. The physicochemical measurements taken during the current survey were generally in line with those expected in lagoonal systems and were broadly comparable with values obtained during previous studies. For the current study, measurements were taken on a single occasion, however, it is recommended that, where possible, water chemistry is measured across the year to determine more long term trends (especially for salinity), as the communities of organisms within the lagoon are determined by physico-chemical conditions over an extended period of time. For example, reduced salinity at Station BS6 may have derived from various freshwater inputs or could have been a product of other influences, but this remained unclear based on a single measurement.
Consideration of natural temporal variation in lagoon communities is important when assessing their status, but the single sampling event for the current and previous studies is likely sufficient to determine the broad biotopes present within lagoons based on both the JNCC classification system of Connor et al. (2004) and the lagoon specific classification system of Bamber (1997). There are expected to be considerable fluctuations in relative abundances of different taxa throughout the year and across years.
The current study also provides a baseline for biotope extent and distribution for the lagoon based on GIS mapping. Utilising updated aerial imagery and the GIS outputs of future surveys it will be possible to rapidly compare basin extent and the extent and distribution of specific biotopes within each lagoon system to assess future change.
33

In summary, the current report sets out a logical and methodical approach to repeat future survey work in Brownsea Island Lagoon and provides extensive data on the current condition of the lagoon. This preliminary condition of assessment based on historical data from Herbert et al. (2010) indicated that the lagoon has remained in similar condition over the last five or so years. The increased sampling stations in the current survey indicated a greater range of species than previously recorded and the results confirm that the lagoon is home to a range of lagoonal specialist taxa as well as a significant population of the nationally rare starlet anemone (N. vectensis).
34

6. References
Bamber, R.N., 1997. Assessment of saline lagoons within Special Areas of Conservation. English Nature Research Report 235, Peterborough.
Barnes, R.S.K., 1985. Coastal saline lagoons of East Anglia, U.K. (Contractor: University of Cambridge, Department of Zoology, Cambridge.) Nature Conservancy Council, CSD Report, No. 600.
Barnes, R.S.K. & Villiers, C.J. de, 2000. Animal abundance and food availability in coastal lagoons and intertidal marine sediments. Journal of the Marine Biological Association of the United Kingdom, 80(2), 193-202.
Connor, D.W., Allen, J.H., Golding, N., Howell, K.L., Lieberknecht, L.M., Northen, K.O. & Reker, J.B., 2004. The marine habitat classification for Britain and Ireland Version 04.05. JNCC, Peterborough, ISBN 1 861 07561 8 (internet version).
Dalkin, M. & Barnett, B., 2001. Procedural Guideline No. 3-6-Quantitative Sampling of Intertidal Sediment Species using Cores. Marine Monitoring Handbook, UK Marine SAC Project, Joint Nature Conservation Committee, Peterborough.
Downie, A.J., 1996. Saline lagoons and lagoon-like saline ponds in England. An update of the lagoons and lagoon-like habitats recommended for conservation. English Nature Science Series No. 29.
Eno, N.C., Clark, R.A. & Sanderson, W.G. 1997. Non-native marine species in British waters: a review and directory. Joint Nature Conservation Committee, 152 pp.
Gollasch, S. & Nehring, S. 2006. National checklist for aquatic alien species in Germany. Aquatic Invasions, 1 (4), 245-269.
Heiman, K.W., Vidargas, N. & Micheli, F., 2008. Non-native habitat as home for non-native species: comparison of communities associated with invasive tubeworm and native oyster reefs. Aquatic Biology, 2, 47-56.
Herbert, R.J.H., Ross, K., Hübner, R. & Stillman, R.A., 2010. Intertidal invertebrates and biotopes of Poole Harbour SSSI and survey of Brownsea Island Lagoon. Bournemouth University report to Natural England, March 2010.
Hiscock, K. (ed.), 1996. Marine Nature Conservation Review: rationale and methods. Peterborough. Joint Nature Conservation Committee. (Coasts and seas of the United Kingdom. MNCR series).
JNCC, 2004. Common Standards Monitoring Guidance for Lagoons. http://jncc.defra.gov.uk/PDF/CSM_marine_lagoons.pdf
Katsanevakis, S., Gatto, F., Zenetos, A. & Cardoso, A.C. 2013. How many marine aliens in Europe? Management of Biological Invasions, 4(1), 37-42.
35

Mason, C., 2011. Particle Size Analysis (PSA) for Supporting Biological Analysis. NMBAQC’s Best Practice Guidance. National Marine Biological Analytical Quality Control Scheme.
Minchin, D., 2007. Rapid coastal survey for targeted alien species associated with floating pontoons in Ireland. Aquatic Invasions, 2(1), 63-70.
Minchin, D., Cook, E.J. & Clark, P.F. 2013. Alien species in British brackish and marine waters. Aquatic Invasions, 8(1), 3-19.
Natural England. Accessed 2015.
Parry, M.E.V., 2015. Guidance on Assigning Benthic Biotopes using EUNIS or the Marine Habitat Classification of Britain and Ireland. JNCC Report, 546, March 2015, 29pp.
Prato, E. & Biandolino,F., 2006. Life history of the amphipod Corophium insidiosum (Crustacea: Amphipoda) from Mar Piccolo (Ionian Sea, Italy). Scientia Marina, 70(3), 355-362.
Radashevsky, V., 2012. Tentative key to Streblospio. NMBAQC 2008 taxonomic workshop, Dove Marine Laboratory. 1p, March 2012.
Reitzel, A.M., Darling, J.A., Sullivan, J.C. & Finnerty, J.R., 2008. Global population genetic structure of the starlet anemone Nematostella vectensis: multiple introductions and implications for conservation policy. Biological invasions, 10(8), 1197-1213.
Roney, P., Rose, L. & Scott, J., 2015. RSPB Snettisham management plan 2015-2020.
Sanderson, W., 1996. Rarity of marine benthic species in Great Britain: development and application of assessment criteria. Aquatic Conservation, 6, 245-256.
Smith, B.P. & Laffoley, D., 1992. A directory of saline lagoons and lagoon like habitats in England. English Nature Science Series No. 6.
Thomsen, M.S., Stæhr, P.A., Nyberg, C.N., Schwaerter, S., Krause-Jensen, D. & Silliman, B.R., 2007. Gracilaria vermiculophylla (Ohmi) Papenfuss, 1967 (Rhodophyta, Gracilariaceae) in northern Europe, with emphasis on Danish conditions, and what to expect in the future. Aquatic Invasions, 2(2), 83-94.Wilson, D.P., 1949. The decline of Zostera marina L. at Salcombe and its effects on the shore. 28(2), 395-412.
Worsfold, T.M., Hall, D.J. & O'Reilly, M. (Ed.), 2010b. Guidelines for processing marine macrobenthic invertebrate samples: a Processing Requirements Protocol: Version 1.0, June 2010. Unicomarine Report NMBAQCMbPRP to the NMBAQC Committee 33pp.
Wyn, G., Brazier, P., Birch, K.G., Bunker, A., Cooke, A., Jones, M., Lough, N., McMath, A. & Roberts, S., 2006. CCW Handbook for Marine Intertidal Phase 1 Biotope Mapping Survey. CCW, 114pp.
36

Appendix 1 – Raw data from Particle Size Analysis samples BS1 BS2 BS3 BS4 BS5 BS6 BS7 BS8 BS9 BS10 BS11 BS12
Analyst comment Gravelly sandy mud
Gravelly sandy mud
Muddy gravel
Muddy sandy gravel
Gravelly muddy sand
Gravelly sandy mud
Gravelly muddy sand
Gravelly muddy sand
Gravelly sandy mud
Gravelly mud
Gravelly sandy mud
Gravelly muddy sand
Sorting Coefficient 2.58 1.8 4.43 4.23 2.45 2.23 2.32 3.62 2.07 3.14 1.92 2.96Particle Diameter : Median 0.0443 0.0325 11.4 11.4 0.144 0.0281 0.274 0.122 0.0242 0.082 0.0436 0.0879Grain Size Inclusive Mean 0.0419 0.0291 1.71 2.46 0.0863 0.031 0.141 0.117 0.0254 0.0821 0.0424 0.083Particle Diameter : Mean 0.155 0.0739 10.7 13.4 0.583 0.0945 0.318 2.31 0.0744 1.51 0.107 0.845Kurtosis 0.756 0.993 0.578 0.73 0.745 0.899 0.981 1.1 0.958 1.25 1.01 0.97Grain Size Inclusive Kurtosis 0.592 0.503 0.67 0.603 0.597 0.536 0.507 0.467 0.515 0.421 0.495 0.511Inclusive Graphic Skewness :- {SKI} -0.065 -0.0947 -0.793 -0.704 -0.412 0.0903 -0.593 0.0586 0.0656 0.145 -0.0305 0.0556<0.98 microns : {>10 phi} 1.45 0.336 0.173 0.123 0.34 0.515 0.314 0.942 0.636 0.19 0.208 0.149 0.98 to 1.38 microns : {10 to 9.5 phi} 1.06 0.445 0.203 0.136 0.369 0.595 0.304 0.637 0.725 0.303 0.357 0.264 1.38 to 1.95 microns : {9.5 to 9 phi} 1.37 0.663 0.315 0.216 0.573 0.912 0.471 0.843 1.11 0.494 0.536 0.466 1.95 to 2.76 microns : {9 to 8.5 phi} 2.3 1.34 0.66 0.453 1.14 1.83 0.923 1.39 2.12 0.926 0.982 0.958 2.76 to 3.91 microns : {8.5 to 8 phi} 3.83 2.77 1.35 0.92 2.23 3.66 1.7 2.36 3.99 1.77 1.88 1.94 3.91 to 5.52 microns : {8 to 7.5 phi} 4.8 4.24 2.01 1.36 3.19 5.3 2.28 3.1 5.53 2.59 2.74 2.925.52 to 7.81 microns : {7.5 to 7 phi} 5.77 5.87 2.75 1.85 4.17 6.99 2.84 3.89 7.12 3.64 3.87 4.09 7.81 to 11.1 microns : {7 to 6.5 phi} 6.25 6.99 3.29 2.2 4.73 8.02 3.04 4.3 8.25 4.66 5.21 5.1411.1 to 15.6 microns : {6.5 to 6 phi} 6.01 7.34 3.39 2.23 4.6 8.02 2.72 4.11 8.6 5.3 6.58 5.6315.6 to 22.1 microns : {6 to 5.5 phi} 6.05 8.46 3.51 2.26 4.6 8.34 2.54 4.13 9.37 6.02 8.39 6.1322.1 to 31.3 microns : {5.5 to 5 phi} 5.82 10.2 3.48 2.2 4.64 8.43 2.69 4.35 9.56 6.28 9.64 6.1131.3 to 44.2 microns : {5 to 4.5 phi} 5.23 11.9 3.37 2.15 4.89 8.12 3.27 4.83 8.85 6.21 10 5.7244.2 to 62.5 microns : {4.5 to 4 phi} 4.71 12 3.31 2.07 5.05 7.52 3.63 5.32 7.79 6.35 10.2 5.4262.5 to 88.4 microns : {4 to 3.5 phi} 4.79 9.86 3.2 1.84 4.34 6.57 2.98 5.3 6.65 6.74 10 5.1488.4 to 125 microns : {3.5 to 3 phi} 5.93 6.55 3.01 1.76 3.22 5.48 2.06 4.8 5.39 7 9 4.75125 to 177 microns : {3 to 2.5 phi} 7.73 3.99 2.81 2.63 4.57 4.75 3.87 4.65 4.18 6.9 6.88 4.93177 to 250 microns : {2.5 to 2 phi} 8.46 2.75 2.54 4.29 9.7 4.51 9.87 5.57 3.47 6.57 4.72 6.29250 to 354 microns : {2 to 1.5 phi} 7.5 1.97 2.11 5.49 14.7 4.37 17 7.27 3.12 6.21 3.38 8.05354 to 500 microns : {1.5 to 1 phi} 5.3 0.96 1.27 4.76 13.1 3.41 18.6 7.67 2.16 5 2.48 7.71500 to 707 microns : {1 to 0.5 phi} 3.21 0.218 0.38 2.69 6.23 1.65 12.7 5.41 0.686 2.84 1.58 4.76707 to 1000 microns : {0.5 to 0 phi} 1.22 0 0.0129 0.729 0.66 0.129 4.26 1.8 0.0397 0.632 0.536 1.29>1000 microns : {<0 phi} 1.19 1.09 56.8 57.6 2.92 0.891 1.89 17.3 0.648 13.4 0.813 12.1<1000 microns : {>0 phi} 98.8 98.9 43.2 42.4 97.1 99.1 98.1 82.7 99.4 86.6 99.2 87.91000 to 1400 mic : {0 to -0.5phi} 0.433 0.594 0.414 0.583 0.203 0.482 1.04 1.59 0.326 1.11 0.385 1.811400 to 2000 mic : {-0.5 to -1.0phi} 0.296 0.251 0.387 0.562 0.125 0.261 0.374 1.43 0.194 0.832 0.202 1.832000 to 2800 mic : {-1.0 to -1.5phi} 0.148 0.133 0.28 0.415 0.107 0.105 0.17 1.25 0.052 0.863 0.0734 1.542800 to 4000 mic : {-1.5 to -2.0phi} 0.148 0.118 0.37 0.386 0.117 0.0201 0.168 1.06 0 1.11 0.0673 1.34000 to 5600 mic : {-2.0 to -2.5phi} 0.0686 0 0.208 0.744 0.0955 0.0226 0.0286 0.663 0.0757 1.39 0.0306 0.9515600 to 8000 mic : {-2.5 to -3.0phi} 0.0329 0 1.06 1.81 0.0545 0 0.108 1.14 0 1.51 0 0.7978000 to 11200 mic : {-3.0 to -3.5phi} 0.0658 0 3.26 2.78 0.037 0 0 1.81 0 0.356 0.055 2.3711200 to 16000 mic : {-3.5 to -4.0phi} 0 0 15.4 7.82 0.803 0 0 3.61 0 1.59 0 0.85816000 to 22400 mic : {-4.0 to -4.5phi} 0 0 17.8 17.3 1.38 0 0 0 0 4.64 0 0.68122400 to 31500 mic : {-4.5 to -5.0phi} 0 0 17.7 10.6 0 0 0 4.79 0 0 0 031500 to 45000 mic : {-5.0 to -5.5phi} 0 0 0 14.7 0 0 0 0 0 0 0 045000 to 63000 mic : {-5.5 to -6.0phi} 0 0 0 0 0 0 0 0 0 0 0 0>63000 microns : {< -6.0 phi} 0 0 0 0 0 0 0 0 0 0 0 0
37

Appendix 2 – Bamber et al. (1997) lagoon biotope classification
Biotope Definition
ENLag.Veg
Community associated with submerged vegetation (irrespective of plant species and substratum), characterized by Idotea chelipes, Corophium insidiosum, Sphaeroma spp., Gammarus spp. and Hydrobia spp. The lagoonal Lineus viridis occur amongst vegetation, as do juvenile Cerastoderma glaucum and all of the gastropods at some point their life cycle. The vegetation is commonly not attached, but drifts within the lagoon.
Characterising species – Ruppia spp. and/or Ulva lactuca and/or Enteromorpha spp. and/or Chaetomorpha linum with I. chelipes, Sphaeroma spp., C.insidiosum, Gamamrus spp. and Ecrobia ventrosa.
Sporadically occurring associates – L. viridis, Nematostella vectensis, Conopeum seuratti, Hydrobia acuta negelctum (formerly Hydrobia neglecta), C. glaucum and Rissoa membranacea
ENLag.Veg.Pot Low salinity (normally <10%) variant of ENLag.Veg wherein the predominant macrophytes is Pomatogen pectinatus. The diversity of associated animals is low, coroxids are more common.
ENLag.Veg.Zos Variant biotope of ENLag.Veg with substantial beds of Zostera spp.
ENLag.IMS.Ann
Fine sediment biotope characterized by Tubificoides pseudogaster (or possibly T. diazi or T. benedii), C. glaucum, Corophium volutator, Abra tenuis and chironomids, with Arenicola marina where the sediment depth is sufficient. This is the preferred biotope for N. vectensis.
Characterising species – T. psudogaster, C. glaucum, C. volutator, A. tenuis, Nereis diversicolor, Captiella captitata, chironomids and hydrobiids
Sporadically occurring associates – N. vectensis, T. benedii, Microdeutopus gryllotalpa, Polydora ciliata and Pygospio elegans.
ENLag.IMS.Ann.Soft
Where the muddy fraction of the superficial sediment is deep enough (approx. 1-0cm) the lugworm A. marina becomes dominant and associated species, notably annelids and C. glaucum occur at a higher density. Sagartia troglodytes is a sporadically occurring associate taxon.
ENLag.IMS.Ann.Hard Where the superficial softer sediment is minimal, and therefore the substratum constitutes firm sands, the annelids and chironomids tend to disappear and the fauna is dominated by C. volutator and A. tenuis.
ENLag.IMS.Ann.Imp
A number of lagoons have impoverished benthic infauna (either few taxa or very low abundance of individuals), typically deriving from recent disturbance events in small lagoons (anthropogenic) or due to low salinity conditions. In the case of the latter Potamopyrgus antipodarum may be the only hydrobiid. Prediminatly gravel substrata can also have an impoverished ENLag.IMS.Ann community, often with only C. glaucum or no fauna at all.
CMU.Beg Occurs sporadically in very small patches in association with decaying plant matter at lagoonal margins in the Autumn. The biotope is temporary only and has no associated species
Others
Opportunistic taxa associated with the water column, notably Palaemonetes varians, mysids, Pomatischistus microps, Gasterosteus aculeatus and corixids, are of sporadic occurrence on most lagoon systems. Both prawns and mysids decline with reductions in salinity.
38

Appendix 3 – Water quality data
Station Depth (cm) Temperature (°C) Salinity Redox Potential (mV)
BS1 9 18.9 20 160 BS2 12 17.8 22 132 BS3 15 13.1 22 103 BS4 11 15.2 20 57 BS5 3 13.3 35 -63 BS6 3 13.6 15 141 BS7 6 14 22 89 BS8 9 14.7 30 -13 BS9 7 14.2 5 -11
BS10 20 14 4 40 BS11 16 14 3 19 BS12 - 18.8 20 79
39

Appendix 4 – Raw data from sweep net samples
Taxa ID BS1 BS2 BS3 BS4 BS5 BS6 BS7 BS8 BS9 BS10 BS11 BS12 BS1 VEG
BS2 VEG
BS3 VEG
Animalia eggs P
Philaenus RGerris odontogaster R
Pyralidae larva RNematostella vectensis S R A S F R S A
Turbellaria FNematoda R R
Hediste diversicolor R RStreblospio R R R A
Manayunkia aestuarina RNais R
Paranais litoralis O F SBaltidrilus costatus R
Tubificoides benedii REnchytraeidae F A
Acari ROrchestia gammarellus R R R
Melita palmata R O RMonocorophium
insidiosum S O A S S C R C O A
Corophium volutator S C R S C F F AIdotea chelipes S O A
Palaemon varians O RChironomidae larva O C R
Chironomidae pupa O
Dolichopodidae larva OEcrobia ventrosa S R F S A O R R
Abra tenuis FGracilaria P P P
Ulva intestinalis PUlva P P
Chaetomorpha linum P PLemna P
40

Appendix 5 – Raw data from core samples
41

WCS Code Taxa Identifier BS
1A
BS
1A
BS
1B
BS
1B
BS
1C
BS
1C
BS
2A
BS
2A
BS
2B
BS
2B
BS
2C
BS
2C
BS
3A
BS
3A
BS
3B
BS
3B
BS
3C
BS
3C
BS
4A
BS
4A
BS
4B
BS
4B
BS
4C
BS
4C
BS
5A
BS
5A
BS
5B
BS
5B
BS
5C
BS
5C
BS
6A
BS
6A
BS
6B
BS
6B
BS
6C
BS
6C
CnidariaD0662 ACTINIARIA 1 1 2D0761 Nematostella vectensis 4 43 6 33 2 9 1 7 6 15 3 3 15 12 20 11 58 5 49 32 23 13 213 11 182 53 187 80 58 95 137 2
NemerteaG0001 Nemertea 1
NematodaHD0001 Nematoda 1 1 1 6
AnnelidaP0458 Nereididae Juvenile 1 1 5 7 5 58 1 9 3 8 5P0462 Hediste diversicolor 6 11 13 3 6 5 6 13 8 1 31 23 29 5 3 6 2 4 2P0753 Polydora cornuta 3 8 4 7 2 1P0776 Pygospio elegans 1P0797 Streblospio 1 2 5 24 2 4 7 1 3 5 2 14 2 1 12 1 4 1 10 2 7 3 1 2P0847 Tharyx "species A" 1P0907 Capitella capitataP0919 Mediomastus fragilisP1294 Manayunk ia aestuarina 5 1 3 3P1425 Tubificidae 1 1 5 1 1P1498 Tubificoides pseudogaster 6 1 1 1 3 2 1P1479 Baltidrilus costatus 20 22 19 30 11 150 26 37 4 54 17 41 8 1 47 8 92 6 43 64 47 15 25 4 42 5 31 6 5 20P1490 Tubificoides benedii 12 29 64 28 24 15 14 9 14 1 16 2 1 1 2 3 4 1 27 5 34 52 17 29P1501 Enchytraeidae 1 1
CrustaceaR2412 Ostracoda 2 7 4 1 3 7 14 21 101S0604 Corophiidae 44 24 19 50 20 58 12 32 8 27 40 10 22 5 39 4 19 7 35 41 62 12 21 8 26 15 4 18 41 50S0612 Monocorophium insidiosum 1 5 2 15 3 1 11 28 3 20 33 20 10 42 6 5 34 3S0616 Corophium volutator 3 43 4 15 12 1 19 41 1 1 1 20 2 17 20 14 93 21 33 9 5 7 5 16 1S0869 Lekanesphaera hookeri 1S0934 Idotea 1 1S0938 Idotea granulosa 1 1S1321 Palaemon varians
Hexapoda- Chironomidae Larvae 1 1- Chironomidae Pupa- Diptera Larvae 1
MolluscaW0088 GastropodaW0385 Peringia ulvaeW0387 Ecrobia ventrosa 1 1 1 2 4 49 16 28 9 46 19 27 39 32 8 9 1 13 4 5W0393 Potamopyrgus antipodarum 1 1 2 4 3W1560 Bivalvia 5 6 2 33 8
BryozoaY0013 Crisia PY0172 Conopeum reticulum
42

WCS Code Taxa Identifier BS
7A
BS
7A
BS
7B
BS
7B
BS
7C
BS
7C
BS
8A
BS
8A
BS
8B
BS
8B
BS
8C
BS
8C
BS
9A
BS
9A
BS
9B
BS
9B
BS
9C
BS
9C
BS
10A
BS
10A
BS
10B
BS
10B
BS
10C
BS
10C
BS
11A
BS
11A
BS
11B
BS
11B
BS
11C
BS
11C
BS
12A
BS
12A
BS
12B
BS
12B
BS
12C
BS
12C
CnidariaD0662 ACTINIARIAD0761 Nematostella vectensis 9 3 15 4 8 2 1 44 30 1 111 8 13 1 4
NemerteaG0001 Nemertea
NematodaHD0001 Nematoda 4 4 2 3 8 1 2
AnnelidaP0458 Nereididae Juvenile 6 2 22 4 17 10 5 6 18P0462 Hediste diversicolor 7 21 26 18 25 4 18 10 1 5 1 24 1 4P0753 Polydora cornutaP0776 Pygospio elegansP0797 Streblospio 1 1 2 12 5 1 11 8 3 28 16 5 1P0847 Tharyx "species A" 67 34 137 63 8 1P0907 Capitella capitata 2 6 2 5 1P0919 Mediomastus fragilis 1P1294 Manayunk ia aestuarina 6 16P1425 Tubificidae 3 36 25P1498 Tubificoides pseudogaster 2 1 55 24 2P1479 Baltidrilus costatus 36 5 38 8 49 1 1 6 2 1 10 17 13 25 66 24P1490 Tubificoides benedii 1 1 1 2 1 1 17 47 15 79 34 33P1501 Enchytraeidae
CrustaceaR2412 Ostracoda 23 71 1 1 55 84 89S0604 Corophiidae 19 13 20 5 8 1 1 1S0612 Monocorophium insidiosum 2S0616 Corophium volutator 2 20 4 12 5 1 1 3 2S0869 Lekanesphaera hookeriS0934 IdoteaS0938 Idotea granulosaS1321 Palaemon varians 3
Hexapoda- Chironomidae Larvae 2 1 1 24 2 7 11 1 1 1 2 1 1- Chironomidae Pupa 1- Diptera Larvae 1
MolluscaW0088 Gastropoda 1W0385 Peringia ulvae 1W0387 Ecrobia ventrosa 58 76 57 66 72 30 1 53 4 41 1 28 2W0393 Potamopyrgus antipodarum 1 7W1560 Bivalvia
BryozoaY0013 CrisiaY0172 Conopeum reticulum P
43

Appendix 6 – SIMPER analysis outputs
Similarity Percentages - species contributions
One-Way Analysis
Data worksheet Name: Data5 Data type: Abundance Sample selection: All Variable selection: All
Parameters Resemblance: S17 Bray Curtis similarity Cut off for low contributions: 90.00%
Factor Groups Sample SIMPROF BS1 b BS2 b BS3 b BS4 b BS5 b BS6 b BS7 b BS9 b BS12 b BS8 a BS10 c BS11 c
Group b Average similarity: 52.52
Species Av.Abund Av.Sim Sim/SD Contrib% Cum.% Nematostella vectensis 6.81 10.72 1.86 20.41 20.41 Baltidrilus costatus 5.99 9.12 1.57 17.36 37.76 Corophiidae 4.91 7.46 1.17 14.20 51.96 Hediste diversicolor 3.97 6.33 2.37 12.05 64.01 Streblospio 2.56 4.00 2.47 7.62 71.63 Corophium volutator 3.34 3.80 1.12 7.23 78.86 Ecrobia ventrosa 4.02 3.30 0.72 6.28 85.14 Tubificoides benedii 3.50 3.02 0.78 5.76 90.90
Group a Less than 2 samples in group
Group c Average similarity: 37.55
Species Av.Abund Av.Sim Sim/SD Contrib% Cum.% Chironomidae 2.68 21.39 ####### 56.95 56.95 Baltidrilus costatus 1.15 8.08 ####### 21.53 78.47 Tubificoides benedii 0.58 8.08 ####### 21.53 100.00
Groups b & a Average dissimilarity = 89.63
44

Group b Group a Species Av.Abund Av.Abund Av.Diss Diss/SD Contrib% Cum.% Nematostella vectensis 6.81 0.58 12.44 1.42 13.88 13.88 Baltidrilus costatus 5.99 0.00 11.06 1.88 12.34 26.22 Corophiidae 4.91 0.00 9.50 1.51 10.60 36.82 Ostracoda 2.32 5.60 8.99 1.72 10.03 46.85 Hediste diversicolor 3.97 0.00 7.45 2.12 8.31 55.17 Ecrobia ventrosa 4.02 0.00 6.91 0.89 7.71 62.88 Corophium volutator 3.34 0.00 5.74 1.43 6.40 69.28 Tubificoides benedii 3.50 0.82 4.88 1.03 5.45 74.73 Streblospio 2.56 0.00 4.67 2.22 5.21 79.94 Capitella capitata 0.06 2.24 4.35 2.69 4.86 84.80 Monocorophium insidiosum 1.97 0.00 3.00 0.92 3.34 88.14 Tubificidae 1.53 0.00 2.49 0.92 2.78 90.92
Groups b & c Average dissimilarity = 87.52
Group b Group c Species Av.Abund Av.Abund Av.Diss Diss/SD Contrib% Cum.% Nematostella vectensis 6.81 0.00 14.28 1.52 16.32 16.32 Baltidrilus costatus 5.99 1.15 9.72 1.98 11.11 27.43 Corophiidae 4.91 0.29 9.56 1.54 10.92 38.35 Ecrobia ventrosa 4.02 0.00 7.19 0.91 8.22 46.57 Hediste diversicolor 3.97 0.29 7.17 2.01 8.19 54.76 Corophium volutator 3.34 0.29 5.58 1.41 6.37 61.14 Tubificoides benedii 3.50 0.58 5.19 1.03 5.93 67.07 Streblospio 2.56 0.00 4.88 2.24 5.58 72.65 Chironomidae 0.32 2.68 4.80 1.59 5.49 78.14 Ostracoda 2.32 0.29 3.33 0.89 3.80 81.94 Monocorophium insidiosum 1.97 0.00 3.10 0.95 3.54 85.48 Tubificidae 1.53 0.00 2.59 0.95 2.96 88.45 Tharyx "species A" 1.19 0.00 1.57 0.37 1.79 90.24
Groups a & c Average dissimilarity = 88.98
Group a Group c Species Av.Abund Av.Abund Av.Diss Diss/SD Contrib% Cum.% Ostracoda 5.60 0.29 32.56 16.84 36.60 36.60 Chironomidae 0.00 2.68 15.83 2.03 17.79 54.39 Capitella capitata 2.24 0.00 13.79 7.36 15.49 69.88 Baltidrilus costatus 0.00 1.15 7.46 1.24 8.39 78.27 Nematostella vectensis 0.58 0.00 3.56 7.36 4.00 82.27 Nematoda 0.00 0.50 2.79 0.71 3.13 85.40 Palaemon varians 0.00 0.50 2.79 0.71 3.13 88.53 Hediste diversicolor 0.00 0.29 1.95 0.71 2.19 90.73
45

Further information Natural England evidence can be downloaded from our Access to Evidence Catalogue. For more information about Natural England and our work see Gov.UK. For any queries contact the Natural England Enquiry Service on 0300 060 3900 or e-mail [email protected] .
Copyright
This report is published by Natural England under the Open Government Licence - OGLv3.0 for public sector information. You are encouraged to use, and reuse, information subject to certain conditions. For details of the licence visit Copyright. Natural England photographs are only available for non-commercial purposes. If any other information such as maps or data cannot be used commercially this will be made clear within the report.
© Natural England and other parties 2018
Report number RP02554ISBN 978-1-78354-476-9