Embed Size (px)
Citation preview
1
Bronx Community Health Dashboard: Diabetes Last Updated: 4/19/2019 See last slide for more information about this project.
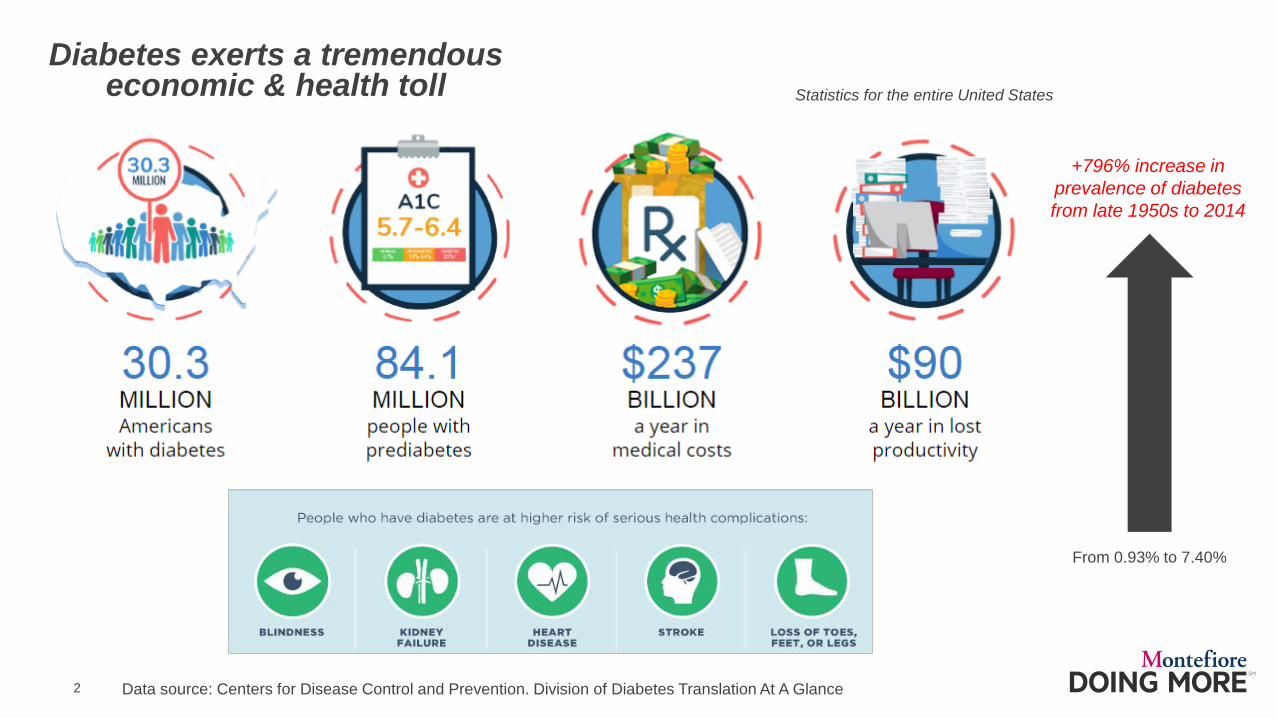
2 Data source: Centers for Disease Control and Prevention. Division of Diabetes Translation At A Glance
Diabetes exerts a tremendous economic & health toll
From 0.93% to 7.40%
+796% increase in prevalence of diabetes from late 1950s to 2014
Statistics for the entire United States
3
+1.5%
-3% -2% -1% 0% 1% 2% 3%
Ischemic heart disease
Neonatal disorders
Road injuries
Colon and rectum cancer
Lower respiratory infections
Stroke
Lung cancer
Falls
Depressive disorders
Headache disorders
Anxiety disorders
Low back pain
Hearing loss
Oth. musculoskeletal disord
COPD
Neck pain
Alzheimer's/dementia
Chronic kidney disease
Diabetes mellitus
Drug use disorders
Annual % Change in DALYs
4.0%
0%
2%
4%
6%
8%
10%Is
chem
ic h
eart
dise
ase
Dru
g us
e di
sord
ers
Low
bac
k pa
in
CO
PD
Dia
bete
s m
ellit
us
Lung
can
cer
Hea
dach
e di
sord
ers
Stro
ke
Dep
ress
ive
diso
rder
s
Alz
heim
er's
/dem
entia
Oth
. mus
culo
skel
etal
dis
ord
Nec
k pa
in
Anx
iety
dis
orde
rs
Falls
Neo
nata
l dis
orde
rs
Hea
ring
loss
Roa
d in
jurie
s
Chr
onic
kid
ney
dise
ase
Col
on a
nd re
ctum
can
cer
Low
er re
spira
tory
infe
ctio
ns
% o
f tot
al D
ALYs
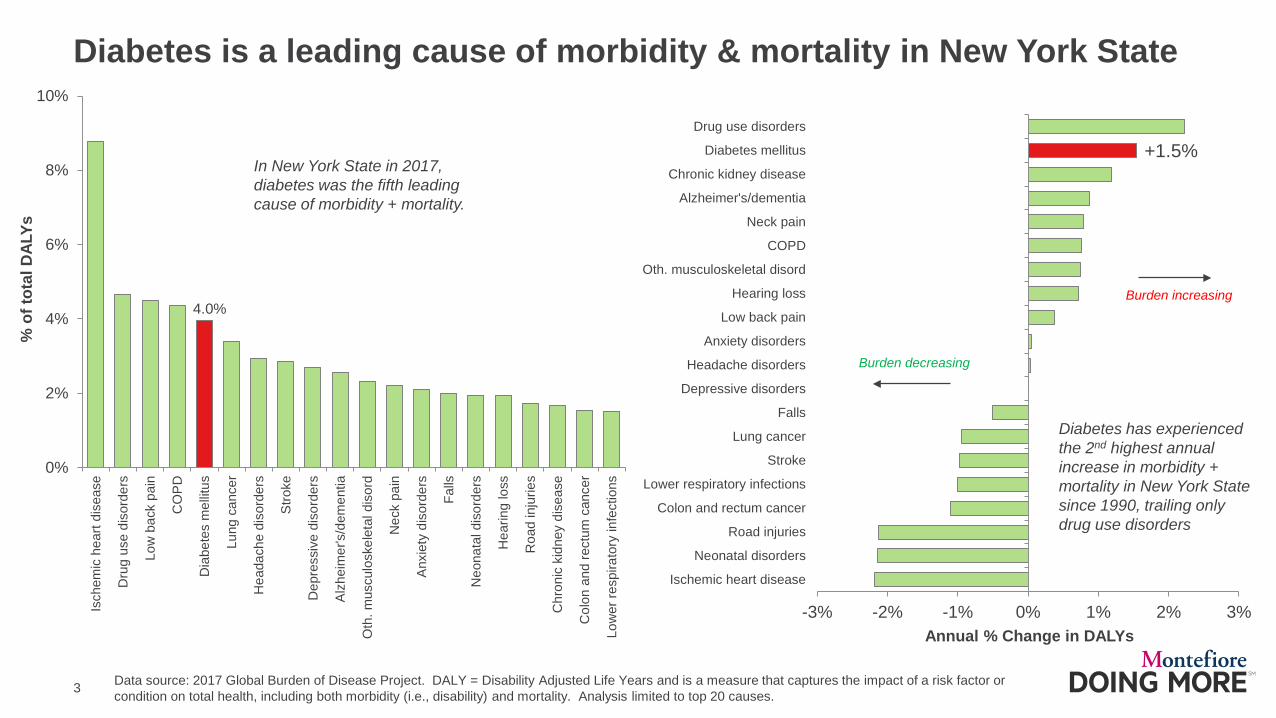
Diabetes is a leading cause of morbidity & mortality in New York State
In New York State in 2017, diabetes was the fifth leading cause of morbidity + mortality.
Data source: 2017 Global Burden of Disease Project. DALY = Disability Adjusted Life Years and is a measure that captures the impact of a risk factor or condition on total health, including both morbidity (i.e., disability) and mortality. Analysis limited to top 20 causes.
Diabetes has experienced the 2nd highest annual increase in morbidity + mortality in New York State since 1990, trailing only drug use disorders
Burden increasing
Burden decreasing
4
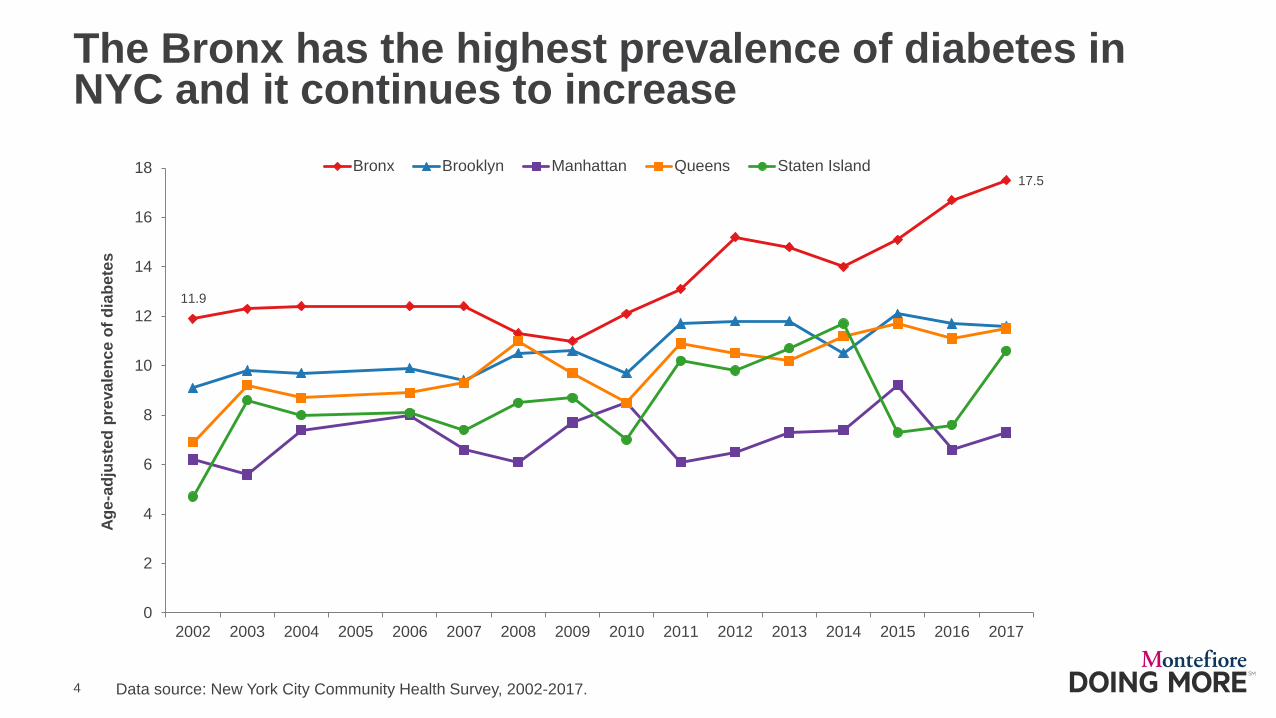
The Bronx has the highest prevalence of diabetes in NYC and it continues to increase
Data source: New York City Community Health Survey, 2002-2017.
11.9
17.5
0
2
4
6
8
10
12
14
16
18
2002 2003 2004 2005 2006 2007 2008 2009 2010 2011 2012 2013 2014 2015 2016 2017
Age-
adju
sted
pre
vale
nce
of d
iabe
tes
Bronx Brooklyn Manhattan Queens Staten Island
5
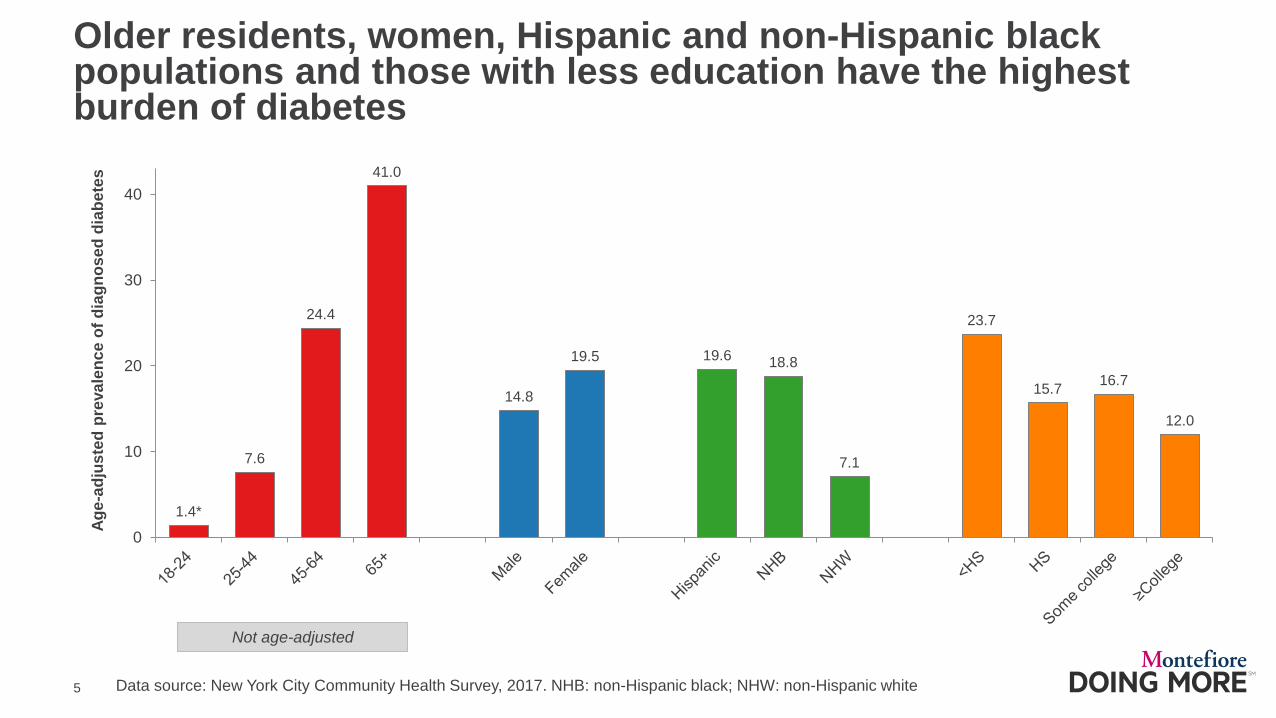
Older residents, women, Hispanic and non-Hispanic black populations and those with less education have the highest burden of diabetes
Data source: New York City Community Health Survey, 2017. NHB: non-Hispanic black; NHW: non-Hispanic white
Not age-adjusted
1.4*
7.6
24.4
41.0
14.8
19.5 19.6 18.8
7.1
23.7
15.7 16.7
12.0
0
10
20
30
40
Age-
adju
sted
pre
vale
nce
of d
iagn
osed
dia
bete
s
6
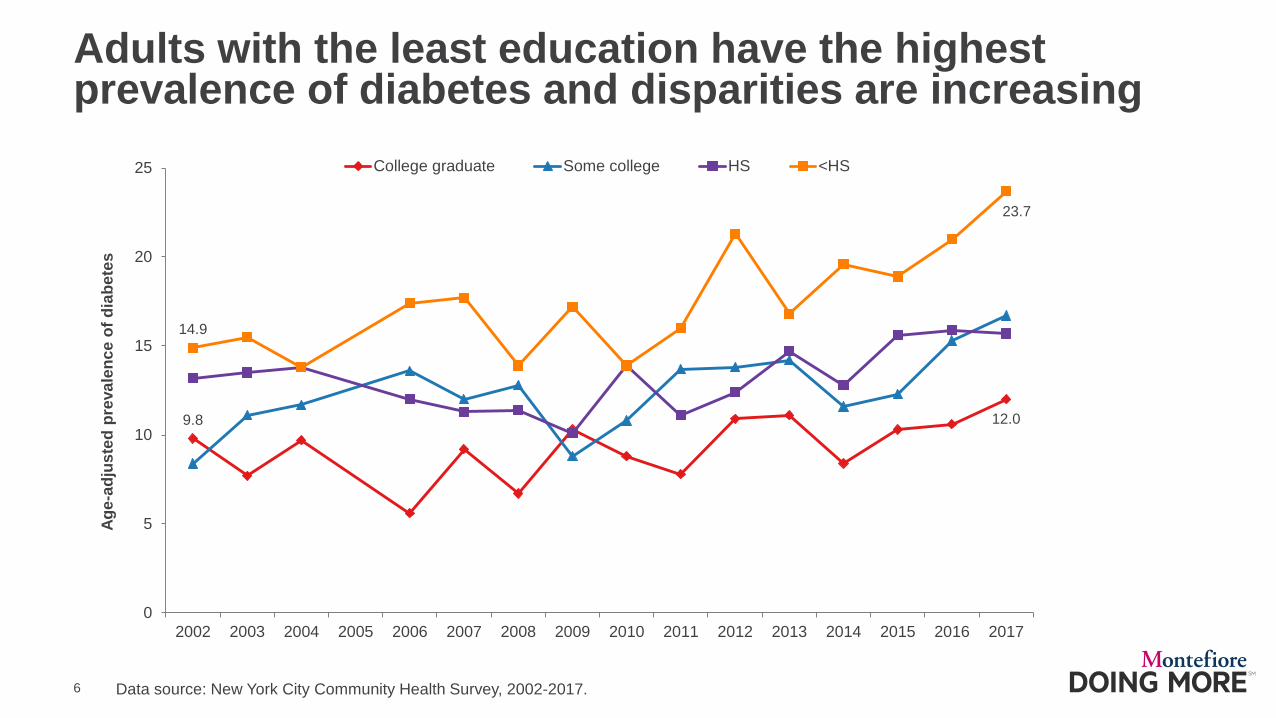
Adults with the least education have the highest prevalence of diabetes and disparities are increasing
Data source: New York City Community Health Survey, 2002-2017.
9.8 12.0
14.9
23.7
0
5
10
15
20
25
2002 2003 2004 2005 2006 2007 2008 2009 2010 2011 2012 2013 2014 2015 2016 2017
Age-
adju
sted
pre
vale
nce
of d
iabe
tes
College graduate Some college HS <HS
7
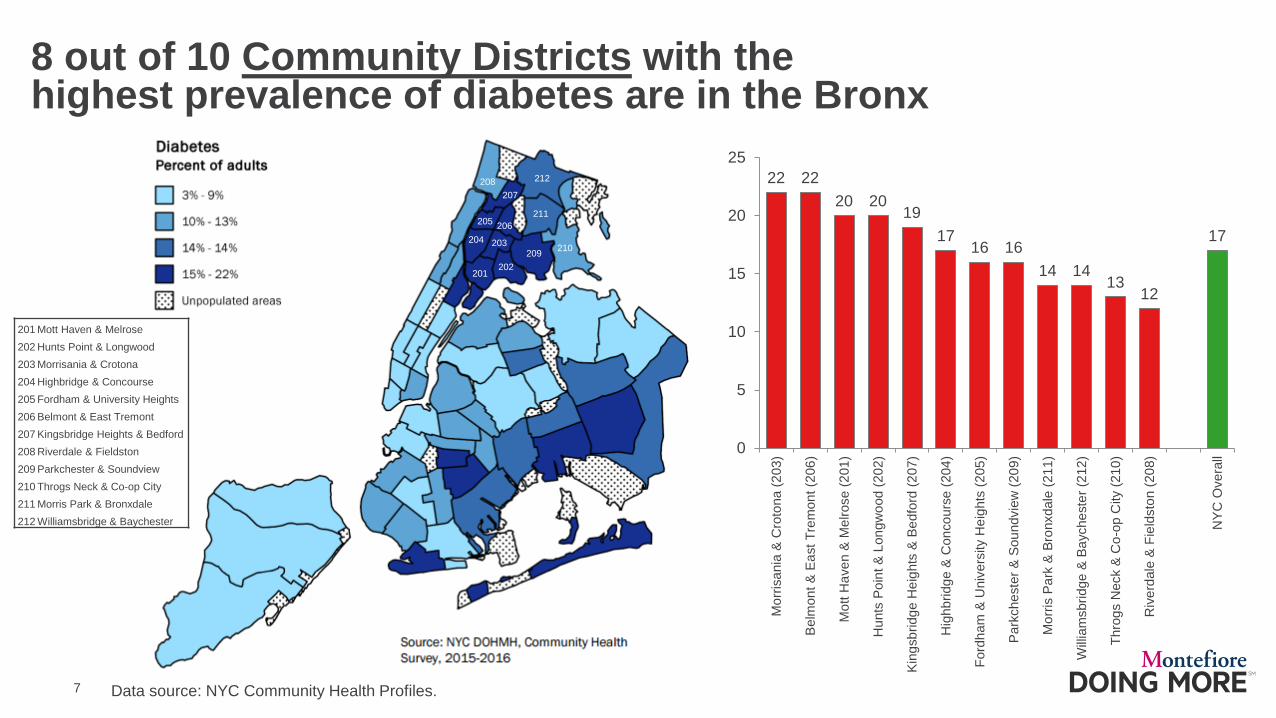
8 out of 10 Community Districts with the highest prevalence of diabetes are in the Bronx
201 202
203 204 206
207 208
209 210
211
212
205
201 Mott Haven & Melrose
202 Hunts Point & Longwood
203 Morrisania & Crotona
204 Highbridge & Concourse
205 Fordham & University Heights
206 Belmont & East Tremont 207 Kingsbridge Heights & Bedford
208 Riverdale & Fieldston
209 Parkchester & Soundview
210 Throgs Neck & Co-op City
211 Morris Park & Bronxdale
212 Williamsbridge & Baychester
Data source: NYC Community Health Profiles.
22 22 20 20
19 17
16 16 14 14
13 12
17
0
5
10
15
20
25
Mor
risan
ia &
Cro
tona
(203
)
Bel
mon
t & E
ast T
rem
ont (
206)
Mot
t Hav
en &
Mel
rose
(201
)
Hun
ts P
oint
& L
ongw
ood
(202
)
Kin
gsbr
idge
Hei
ghts
& B
edfo
rd (2
07)
Hig
hbrid
ge &
Con
cour
se (2
04)
Ford
ham
& U
nive
rsity
Hei
ghts
(205
)
Par
kche
ster
& S
ound
view
(209
)
Mor
ris P
ark
& B
ronx
dale
(211
)
Willi
amsb
ridge
& B
aych
este
r (21
2)
Thro
gs N
eck
& C
o-op
City
(210
)
Riv
erda
le &
Fie
ldst
on (2
08)
NY
C O
vera
ll
8
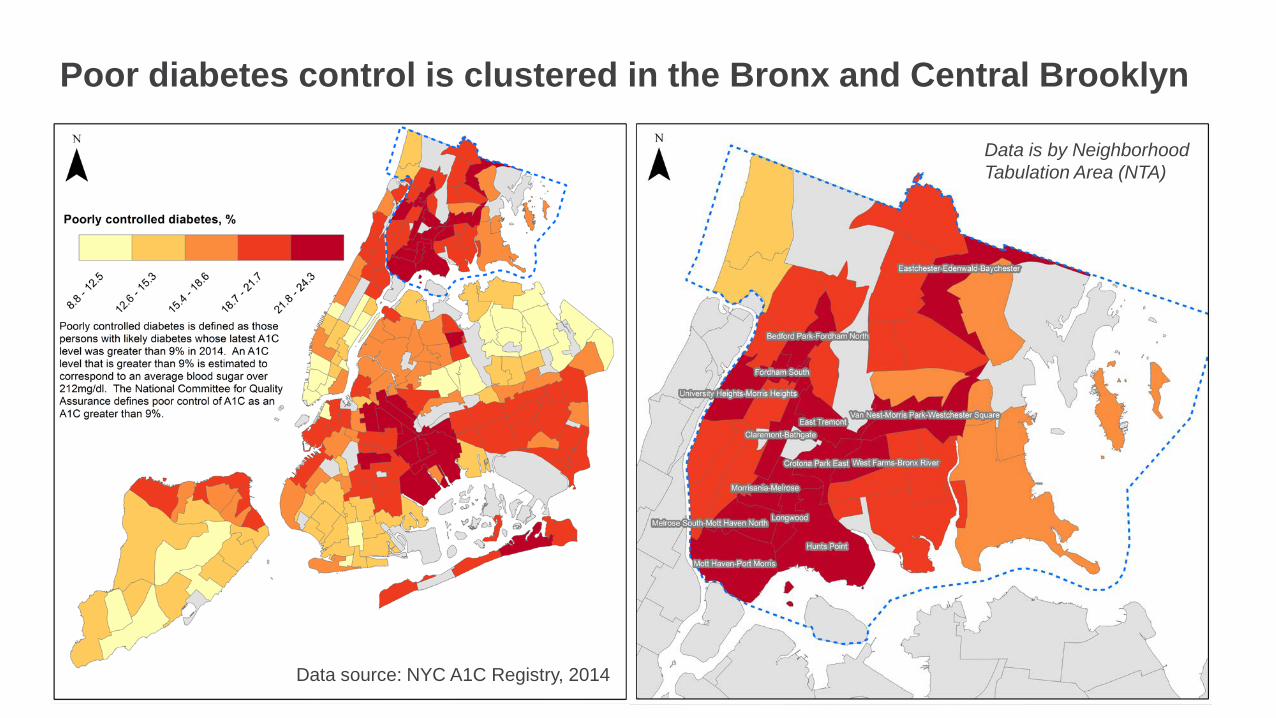
Poor diabetes control is clustered in the Bronx and Central Brooklyn
Data source: NYC A1C Registry, 2014
Data is by Neighborhood Tabulation Area (NTA)

9
Diabetes Hospitalizations
10
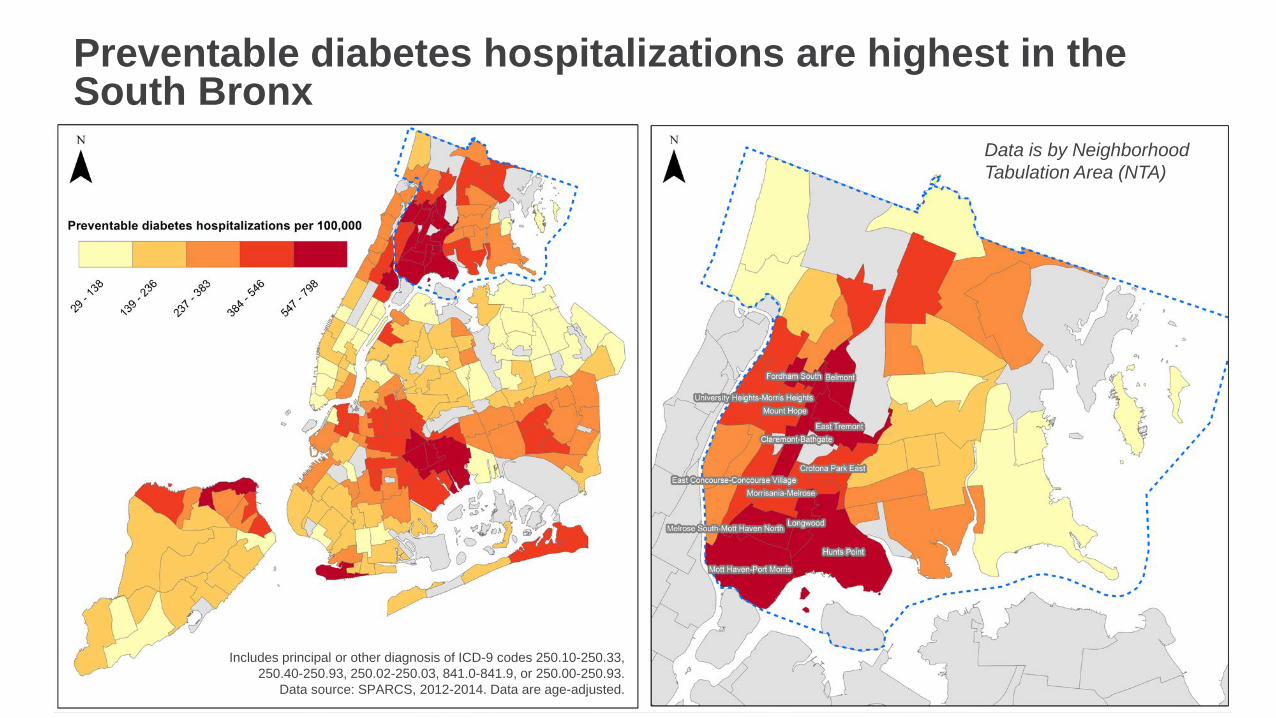
Preventable diabetes hospitalizations are highest in the South Bronx
Includes principal or other diagnosis of ICD-9 codes 250.10-250.33, 250.40-250.93, 250.02-250.03, 841.0-841.9, or 250.00-250.93.
Data source: SPARCS, 2012-2014. Data are age-adjusted.
Data is by Neighborhood Tabulation Area (NTA)
11
Diabetes Mortality
12
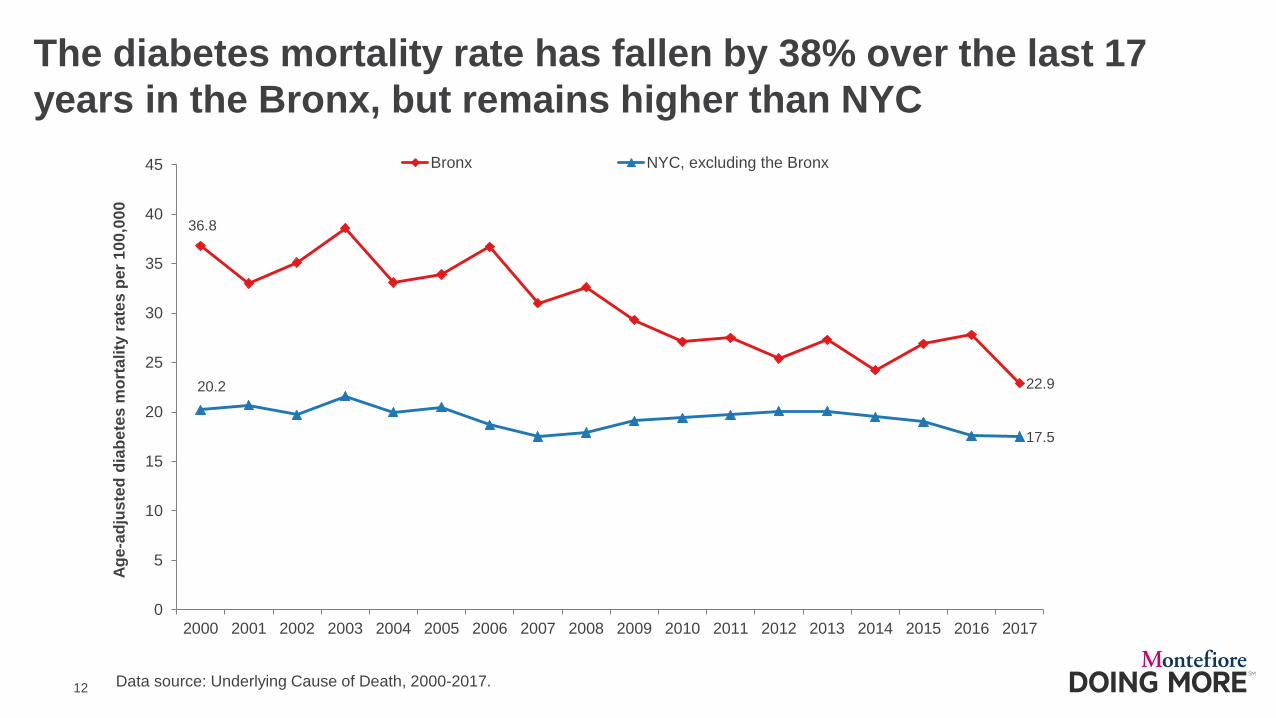
The diabetes mortality rate has fallen by 38% over the last 17 years in the Bronx, but remains higher than NYC
Data source: Underlying Cause of Death, 2000-2017.
36.8
22.9 20.2
17.5
0
5
10
15
20
25
30
35
40
45
2000 2001 2002 2003 2004 2005 2006 2007 2008 2009 2010 2011 2012 2013 2014 2015 2016 2017
Age-
adju
sted
dia
bete
s m
orta
lity
rate
s pe
r 100
,000
Bronx NYC, excluding the Bronx
13
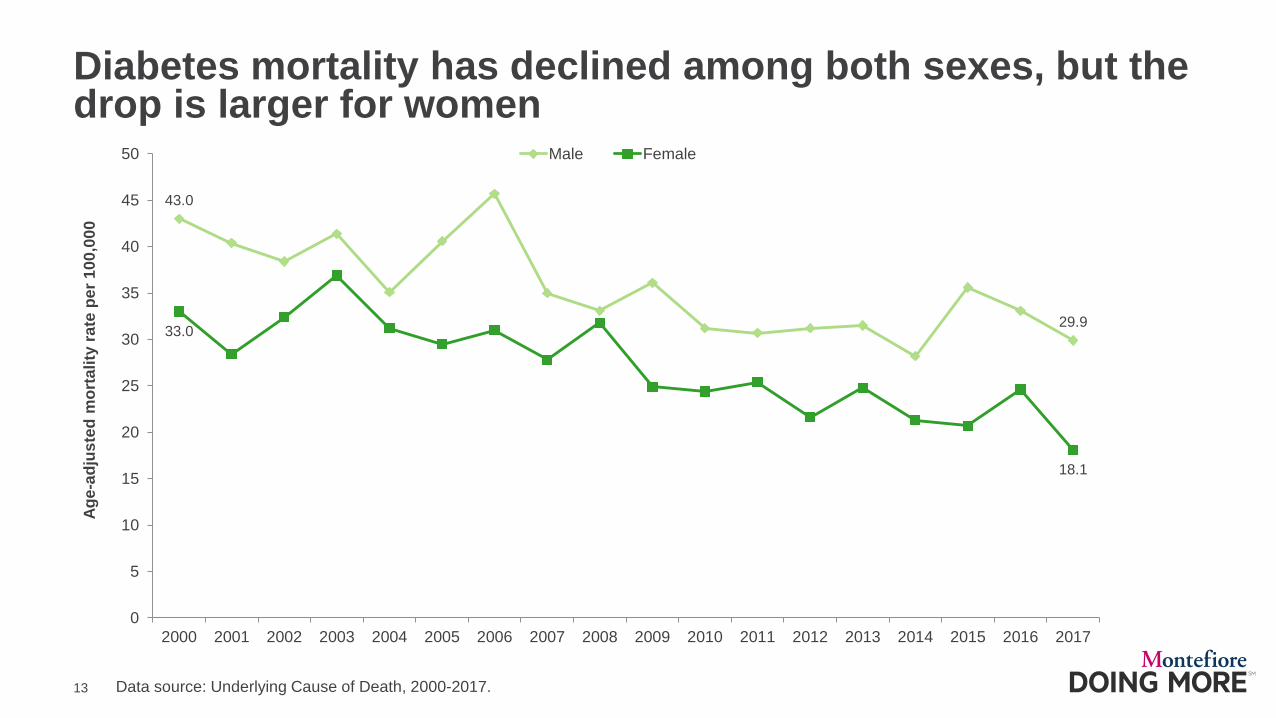
Diabetes mortality has declined among both sexes, but the drop is larger for women
43.0
29.9 33.0
18.1
0
5
10
15
20
25
30
35
40
45
50
2000 2001 2002 2003 2004 2005 2006 2007 2008 2009 2010 2011 2012 2013 2014 2015 2016 2017
Age-
adju
sted
mor
talit
y ra
te p
er 1
00,0
00
Male Female
Data source: Underlying Cause of Death, 2000-2017.
14
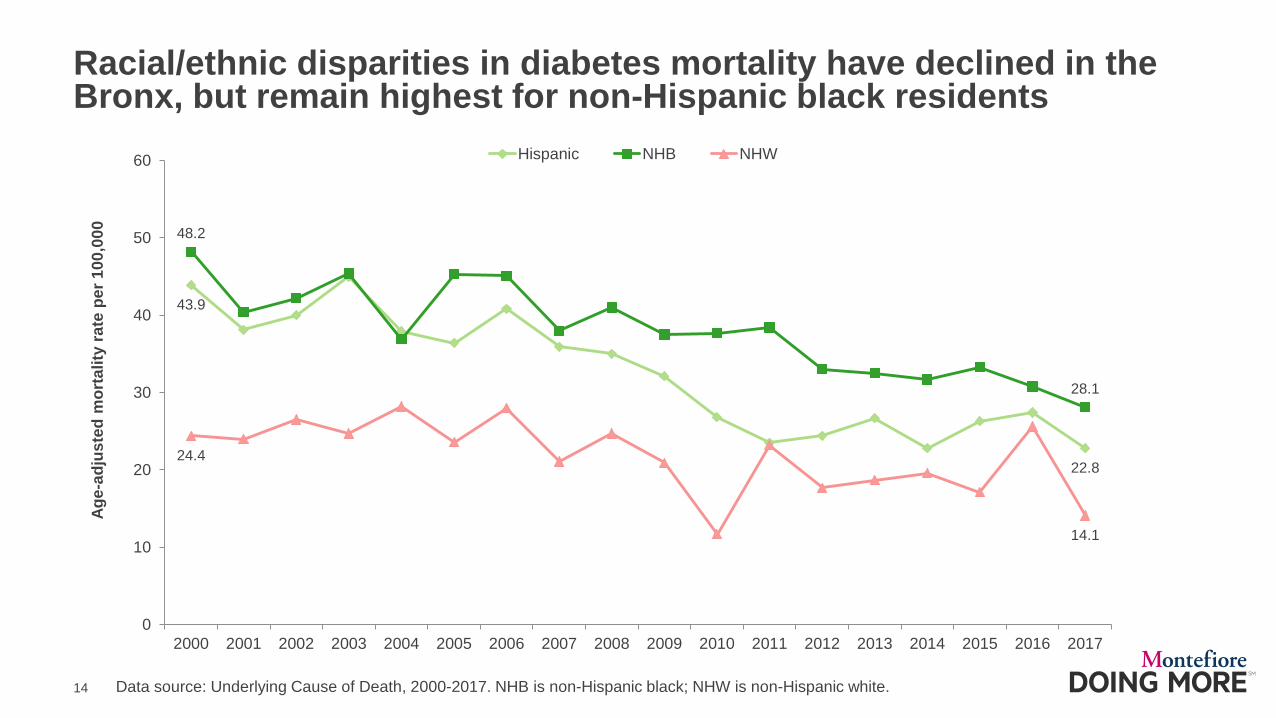
Racial/ethnic disparities in diabetes mortality have declined in the Bronx, but remain highest for non-Hispanic black residents
43.9
22.8
48.2
28.1
24.4
14.1
0
10
20
30
40
50
60
2000 2001 2002 2003 2004 2005 2006 2007 2008 2009 2010 2011 2012 2013 2014 2015 2016 2017
Age-
adju
sted
mor
talit
y ra
te p
er 1
00,0
00
Hispanic NHB NHW
Data source: Underlying Cause of Death, 2000-2017. NHB is non-Hispanic black; NHW is non-Hispanic white.
15
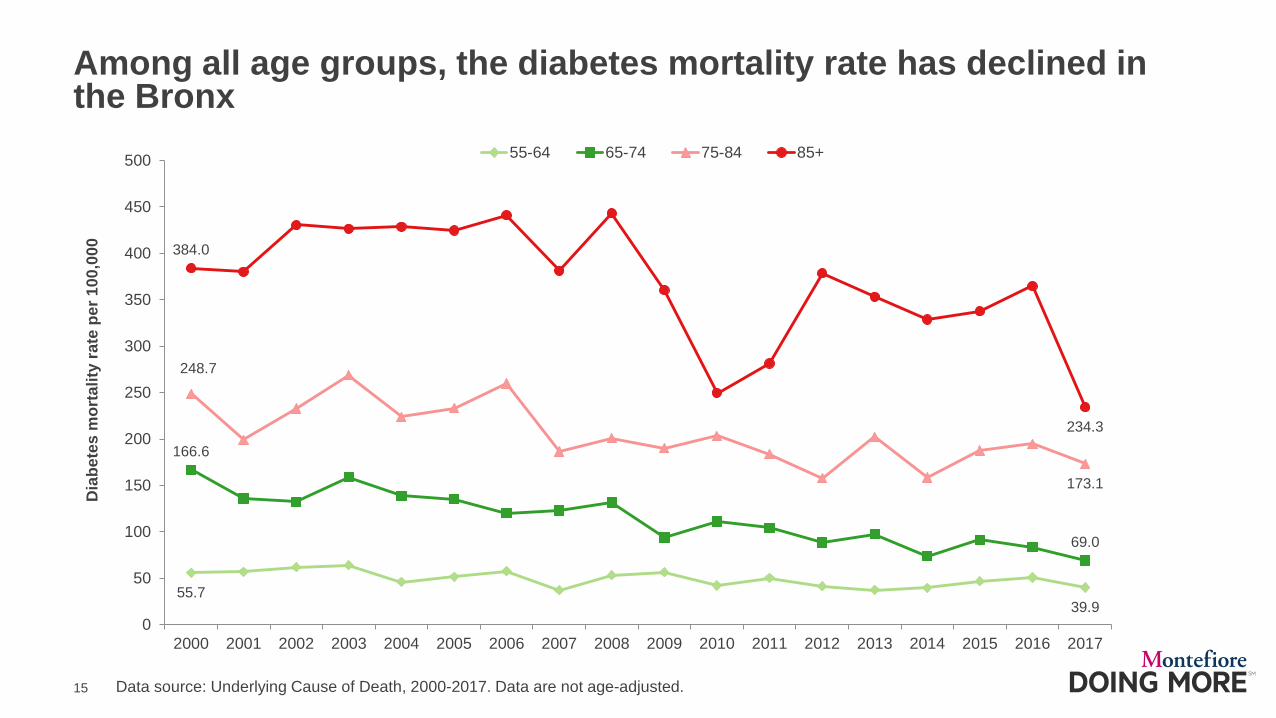
Among all age groups, the diabetes mortality rate has declined in the Bronx
55.7 39.9
166.6
69.0
248.7
173.1
384.0
234.3
0
50
100
150
200
250
300
350
400
450
500
2000 2001 2002 2003 2004 2005 2006 2007 2008 2009 2010 2011 2012 2013 2014 2015 2016 2017
Dia
bete
s m
orta
lity
rate
per
100
,000
55-64 65-74 75-84 85+
Data source: Underlying Cause of Death, 2000-2017. Data are not age-adjusted.
16
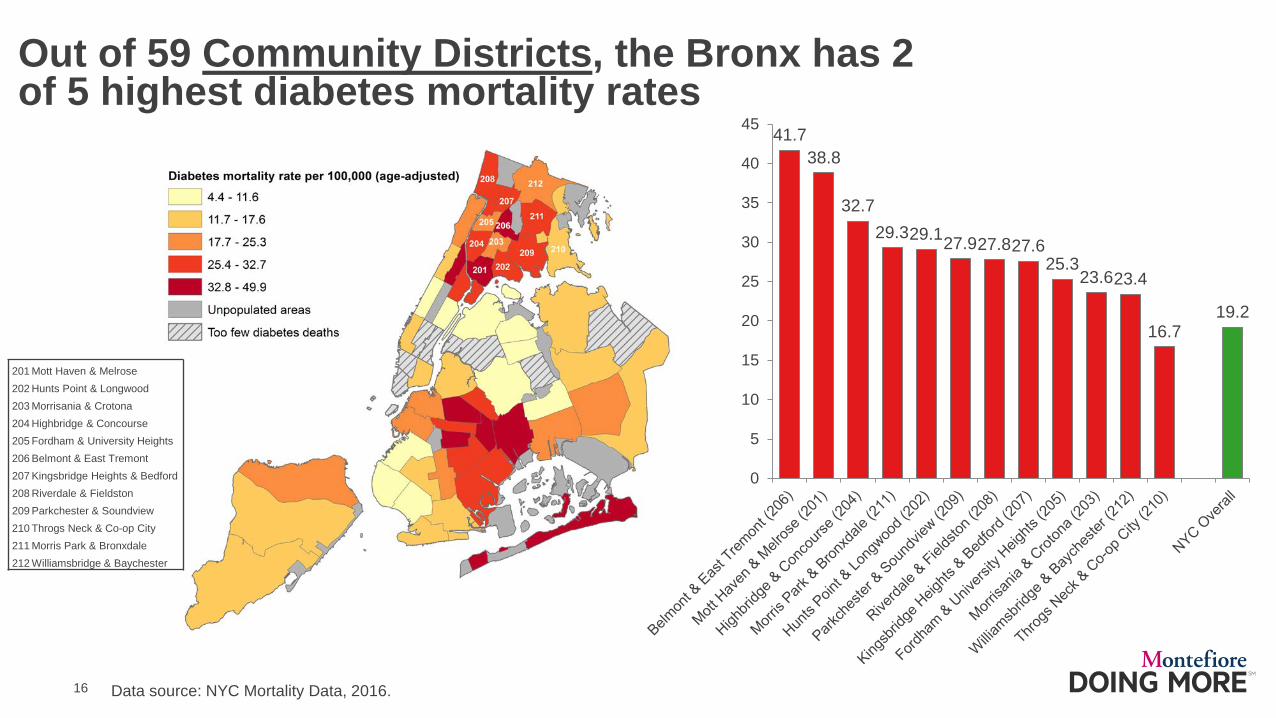
Out of 59 Community Districts, the Bronx has 2 of 5 highest diabetes mortality rates
Data source: NYC Mortality Data, 2016.
41.7 38.8
32.7 29.3 29.1 27.9 27.8 27.6
25.3 23.6 23.4
16.7 19.2
0
5
10
15
20
25
30
35
40
45
201 Mott Haven & Melrose
202 Hunts Point & Longwood
203 Morrisania & Crotona
204 Highbridge & Concourse
205 Fordham & University Heights
206 Belmont & East Tremont 207 Kingsbridge Heights & Bedford
208 Riverdale & Fieldston
209 Parkchester & Soundview
210 Throgs Neck & Co-op City
211 Morris Park & Bronxdale
212 Williamsbridge & Baychester
17
About the Community Health Dashboard Project
The goal of the project is to provide Bronx-specific data on risk factors and health outcomes with an emphasis on presenting data on trends, socio-demographic differences (e.g., by age, sex, race/ethnicity, etc.) and sub-county/neighborhood level data
Dashboards will be periodically updated as new data becomes available.
Produced by Montefiore’s Office of Community & Population Health using publicly-available data sources
For more information please contact us at [email protected]