Embed Size (px)
Citation preview

Creston House, 10 Great Pulteney Street, London W1F 9NB [email protected] | www.icmunlimited.com | +44 020 7845 8300 (UK) | +1 212 886 2234 (US)
ICM Research Ltd. Registered in England No. 2571387. Registered Address: Creston House, 10 Great Pulteney Street, London W1F 9NB A part of Creston Unlimited
British Medical Association
Survey of GPs in England
Full Report October – November 2016
A report by ICM on behalf of the BMA
V2 (20.12.2016)

214685 BMA GP’s Survey 2016
Confidential. All work in accordance with ISO 27001 and 20252 2
Contents
Contents .............................................................................................................................. 2
1. Introduction ..................................................................................................................... 3
1.1 Methodology .................................................................................................................................. 3
1.2 Interpreting the data ...................................................................................................................... 3
2. Executive Summary ........................................................................................................ 4
3. Overall Results ................................................................................................................ 8
3.1 Workload ....................................................................................................................................... 8
3.2 Workforce .................................................................................................................................... 14
3.3 Practice Finance ......................................................................................................................... 21
3.4 Working at Scale ......................................................................................................................... 26
4. Appendices.................................................................................................................... 29
4.1 Sample profile ............................................................................................................................. 29
4.2 Guide to statistical reliability ........................................................................................................ 30
©ICM Unlimited 2016 Report prepared by:
Laura Byrne (laura.byrne@icmunlimitedcom) Jennifer Bottomley ([email protected])
Alex Turk ([email protected])
Tel: 020 7845 8300
Address: ICM Unlimited, 4th
Floor, Creston House, 10 Great Pulteney St, London, W1F 9NB
Web: www.icmresearch.com

214685 BMA GP’s Survey 2016
Confidential. All work in accordance with ISO 27001 and 20252 3
1. Introduction
This report presents findings from the BMA’s survey of GPs in England 2016.
This 2016 survey was much more focussed than in previous years. Only GPs in England
were asked to complete the survey, with four main areas for coverage:
• Workload
• Workforce
• Practice Finance
• Working at Scale
The BMA commissioned ICM Unlimited to:
• Host and administer the online questionnaire;
• Report and analyse the results.
1.1 Methodology
• The data presented in this report is based on 5,025 responses to an online survey. A
profile of respondents is provided in the report appendix;
• The questionnaire was designed by the BMA, with input from ICM Unlimited;
• The BMA was responsible for contacting respondents to answer the survey;
• ICM Unlimited hosted and scripted the survey, collected data, reported and analysed results;
• Fieldwork ran from 13th October to 6th November 2016.
1.2 Interpreting the data
• We have included any ‘don’t know’ or ‘not stated’ responses in the calculation of
percentages in this report.
• All figures in this report are based on unweighted data.

214685 BMA GP’s Survey 2016
Confidential. All work in accordance with ISO 27001 and 20252 4
2. Executive Summary
Overall themes
Two themes emerged throughout the survey, and deserve to be considered as general
trends rather than just on an issue-by-issue basis.
GPs’ workload has a strong relationship with views and experiences of general practice
today. Across a range of questions, GPs describing their workload as excessive (84%)
exhibited distinct views from the one in ten GPs (10%) who said their workload is
manageable and allows quality and safe care. This was especially pronounced amongst
GPs describing their workload as excessive and significantly preventing quality and safe
care (27%). The relationship between workload and GPs’ responses is notably strong on the
role of hubs, impact of workload on professional development, partners’ perceptions of their
role, the ability of a practice to fill GP vacancies, and reasons for hiring locums.
The other consistent theme throughout these results is the distinctive views of GPs working
in different roles. It is perhaps not surprising that GPs undertaking different roles with
associated distinct experiences, responsibilities, and priorities, are likely to support different
options and views to one another. Nevertheless, these results taken as a whole serve as a
reminder that GPs are not an entirely homogenous group, with partners especially giving
distinctive responses.
Alongside the importance of different roles, some differences emerged by other
demographics. These included:
Older GPs generally give more positive responses – including in terms of their
workload being manageable and allowing them opportunity for professional
development.
Gender differences emerge on a handful of questions. Women are more likely than
men to describe their workload as excessive and significantly impacting on care. The
perceived barriers to becoming a partner are also relevant to gender, with women
more likely to cite ‘a workload without limits to demand’ or ‘the onerous
responsibilities of running a practice’ as key barriers.
There is evidence of regional variation in the experiences of GPs across the country.
Whilst it is difficult to generalise trends specific to individual regions, the significant
differences between regions on issues of workload indicates the diverse range of
experiences and challenges facing GPs across the country, and the desire for
different measures to address these different issues.

214685 BMA GP’s Survey 2016
Confidential. All work in accordance with ISO 27001 and 20252 5
Workload
Overall, a majority of GPs in England believe that their workload impacts on the
safety and quality of care that their patients receive. Only one in ten GPs (10%)
describe their workload as manageable and allowing safe and quality care. By
contrast, the majority (57%) describe their workload as unmanageable and at times
impacting quality and safe care, with over a quarter (27%) reporting that workload is
excessive and significantly prevents quality and safe care.
In order to safely manage practice workload, the most popular consideration is to
consider withdrawal of wider non-contractual services that GPs voluntarily provide
(61%). Other measures that would be considered include restricting clinical work to
contractual services and increasing use of external referrals for non-core services
(41%), and withdrawal from local CCG meetings and activities (35%).
Increased patient self-care/management to reduce demand (23%) is considered to
be the single most effective measure to reduce practice workload, followed by
increased provision of enhanced community nurses to manage vulnerable
housebound patients (15%).
A majority of GPs agree that locality hubs should provide support for local practices.
Specifically, over three in four GPs agree that there should be systems to ensure
practices use hubs equitably (78%) and there should be a limit to GP workload with
the option for overflow work to be seen in a locality hub (77%). Around two-thirds
agree that hubs should be used to provide extended access for evenings and
weekends on behalf of practices (70%).
Overall, a majority of GPs believe that their workload impacts negatively on their
professional development, with nearly four in five GPs (78%) disagreeing with the
statement that their workload allows them adequate time to keep up to date with
continuing professional development.
Workforce
Three quarters of GP partners (75%) believe that the current roles and
responsibilities of being a partner are too onerous, while one in five (19%) partners
say they are content with the current role and responsibilities of being a partner.
However, non-partners are most likely to be put off becoming a partner because of
the workload without limits to demand (75%).
The most popular reason for working as a locum GP is control over one’s own
workload, given by more than three in four locums (76%).
A majority of salaried GPs give working in one setting / providing continuity of care
(54%) and partnership as being too onerous/lacking reward (52%) as reasons for
working in their role.

214685 BMA GP’s Survey 2016
Confidential. All work in accordance with ISO 27001 and 20252 6
Looking forward to their work over the next five years, it would appear that most GPs
would like to stay in their current broad role type. Whilst almost half of GPs (47%)
wish to work as a partner within the current independent contractor model under
GMS/PMS in the next five years, this is being driven by the 3 in 5 Partners (60%)
who selected this option compared to only 8% of locums. Other popular options
include working as a partner within an at scale GP organisation (32%) or as a
portfolio GP (30%).
When it comes to recruiting for GP vacancies (excluding locum cover), three in ten
GP partners (31%) have been unable to fill vacancies in the last 12 months.
However, almost a quarter (23%) of partners report being able to fill vacancies within
a reasonable timeframe.
When it comes to hiring locum cover, partners are most likely to hire locums to cover
infrequent sessions due to short term staff sickness, absence, and leave (39%).
Other oft-cited reasons include covering long term employment vacancies (31%) and
continuing to provide a full complement of services (30%).
A clear majority of GPs – nearly four in five (79%) – believe that there should be
financial incentives to encourage GPs to work as partners or salaried GPs within
practices rather than work as locums. Half of GPs (50%) believe this should be the
case if the incentives come from new money, whereas over a quarter (28%) support
it as a principle.
Practice Finance
When asked to specify how any new funding should be invested in general practice,
the most popular priorities for any new resources are to support practices, such as
increased community nursing support integrated with the practice (46%) and for skill
mix (44%).
More than two in five GPs (42%) would support charging non-UK patients for GP
services if fees were set nationally with income paid to the NHS and practices paid
for patient registration and administration costs, while more than a third of GPs (35%)
believe practices should be allowed to treat such patients privately, set the fees, and
retain the income. One in ten (10%) would oppose charging non-UK patients on
principle.
A large majority of GPs (87%) think the Avoiding Unplanned Admission enhanced
service should be ended, with almost two thirds of GPs (65%) saying the funding
should be added to global sum to support the practice’s care of elderly/vulnerable
patients. Just under one quarter (22%) agree that it should be ended, but would
prefer that the funding be used locally within the CCG, specifically to improve care for
the most vulnerable patients in the practice.
Whilst eight in ten GPs (81%) think that changes should be made to the formula for
calculating global sum allocations, there are a range of views on how it should be
changed. Almost half of GPs (47%) feel the new formula should be implemented over

214685 BMA GP’s Survey 2016
Confidential. All work in accordance with ISO 27001 and 20252 7
five years through differential uplifts, ensuring no practice loses in cash terms, while
over a quarter (27%) believe the new formula should be implemented in a phased
way over a number of years to reduce the impact on those who gain and those who
lose.
Indemnity is the area in which most GPs (77%) think costs will increase most
significantly over the next 12 months, followed by CQC fees (56%) and locum pay
(47%).
Working at Scale
When asked about their preferred models of general practice which should be
developed for the future, just under half (47%) believe that the current independent
contractor model should be the prime model of general practices and should be
supported and invested in, while half of GPs (50%) think the current independent
contractor model should be supported and given resources for practices to
collaborate in the form of GP federations / networks.
A range of possible advantages were given for working in a collaborative GP alliance
– that it could reduce the bureaucracy of managing a practice was most popular
(39%), followed by reducing practice workload (37%), providing a sustainable way of
coping with extended access (34%) and greater security and sustainability of
practices within a larger organisation (32%).

214685 BMA GP’s Survey 2016
Confidential. All work in accordance with ISO 27001 and 20252 8
3. Overall Results
3.1 Workload
Impact of workload on safety and quality of care
Overall, a majority of GPs in England believe that their workload impacts on the safety and
quality of care that their patients receive.
Specifically, only one in ten GPs (10%) believe that their workload is manageable and
allows them to provide quality and safe care to their patients. This figure is overall highest
amongst Trainees (43%) and Locums (34%), and lowest amongst Partners (6%). Older GPs
are also more likely to agree with the statement, applying to nearly 1 in 4 (24%) of GPs aged
60+.
The majority (57%) of GPs think that their workload is excessive and at times prevents
them from providing quality and safe care to their patients. This is especially the case
amongst Salaried (67%) and Partner (59%) GPs, and those aged 30-39 (63%) and 40-49
(62%).
Over a quarter (27%) of GPs selected the most severe statement, that their workload is
excessive and significantly prevents them from providing quality and safe care to their
patients. GP Partners (31%) were the role type most likely to select this statement. There
were also regional and gender divides, with a third (33%) of male GPs agreeing with the
statement compared to 20% of females, and those working in the East of England (31%) or
East Midlands (31%) significantly more likely to select this response compared to those in
the South West (23%) or North East (23%).
Figure 3.1.1
Confidential: For research purposes only 2
Workload: Description of current workload
10%
57%
27%
5% Workload is manageable and allowsquality and safe care
Workload is excessive and at timesprevents quality and safe care
Workload is excessive andsignificantly prevents quality and safecare
None of the above
Q1. Which of these best describes the impact of your current workload on the safety and quality of care that your patients receive?
Base: All participants (n=5025)

214685 BMA GP’s Survey 2016
Confidential. All work in accordance with ISO 27001 and 20252 9
Actions considered to safely manage practice workload
When asked to select which actions they would consider in order to safely manage practice
workload, three in five (61%) of GPs say they would consider withdrawal of wider non-
contractual services that GPs voluntarily provide, with two in five (41%) restricting clinical
work to contractual services and increasing use of external referrals for non-core services.
GP Partners are the most likely to consider both options, with two-thirds (67%) considering
the withdrawal of non-contractual services and 45% increasing use of external referrals for
these non-contractual services. This latter option is most likely to be considered by GPs in
the Midlands, with over half of East (52%) and West Midlands (51%) GPs saying they would
consider increasing use of external referral for non-contractual services.
Figure 3.1.2
Other measures that would be considered by GPs include withdrawal from local CCG
meetings and activities (35%), working at scale (34%), withdrawal from enhanced services
(34%), temporary suspension of new patient registrations (34%), and application to reduce
practice boundary (26%). Just six per cent believe they don’t need to take further measures
to manage workload.
Around 1 in 4 GPs (24%) responding to the survey took the option to give a response not
already stated in the answer options available. These ‘open’ responses have been
thematically coded. The range of responses in answer to this question demonstrates the
wide variety of measures that GPs are currently considering in order to safely manage
practice workload. Of the options not already listed in the question (and displayed in figure
3.1.2 above), recruiting more staff was the most popular measure, mentioned unprompted
by 3% of GPs. This was followed in popularity by stopping the transfer of hospital work into
primary care (2%). One in fifty GPs (2%) said they were considering retirement, or early
retirement, in order to safely measure practice workload. This was mentioned by GPs of
different ages, although was highest amongst those aged 50-59 (4%) and over 60 (5%).
There are further regional differences in the interventions that GPs would consider. For
instance, those in the South East are generally more likely to consider temporary suspension
of new patient registrations (42%) or an application to reduce practice boundary and remove

214685 BMA GP’s Survey 2016
Confidential. All work in accordance with ISO 27001 and 20252 10
patients from the list (30%), whilst those in the South West are most likely to consider
withdrawal from the quality and outcomes framework (28%).
Effectiveness of measures in reducing practice workload
When prompted with a list of possible measures to reduce workload, GPs express a broad
range of preferences in terms of which would be most effective. The most popular measure
is the increased provision of enhanced community nurses to manage vulnerable
housebound patients, selected by 64% of GPs. Other popular measures include increased
patient self-care/management (59%) and increased provision for practice support mental
health workers (53%). However, only 5% said increased use of technology – including
Skype consultations, remote electronic consultations, or remote access to the practice
clinical system – would be one of the most effective options in reducing practice workload.
Figure 3.1.3:
Around one in six GPs (17%) opted to specify a most effective measure not already included
in the list presented. Many of these responses emphasised the need to hire more (qualified)
GPs. Other themes included increased funding, more nurses, and a reduction in
bureaucracy.
As shown in table 1 below, some strong regional differences are apparent in responses to
this question, indicative of differing priorities for workload management across the country.
Three in five (59%) GPs in the South West thought increased provision for practice support
mental health workers would be one of the most effective measures, compared to less than
half in London and the South East (both 47%). Around half of GPs in the North East (52%)
and Yorkshire and the Humber (48%) say the increased use of trained practice pharmacists
would be one of the most effective measures to take, compared to less than a third in the
East of England (28%), West Midlands (30%) and East Midlands (31%).

214685 BMA GP’s Survey 2016
Confidential. All work in accordance with ISO 27001 and 20252 11
Table 1:
To
tal
South
East
Lond
on
Nort
h W
est
East of
Engla
nd
West M
idla
nds
South
West
York
shire &
Hu
mb
er
East M
idla
nds
Nort
h E
ast
Increased provision of enhanced
community nurses to manage vulnerable
housebound patients
64% 67% 63% 64% 62% 64% 63% 61% 64% 69%
Increased patient selfcare/management
to reduce demand 59% 60% 60% 61% 57% 58% 56% 57% 59% 64%
Increased provision for practice support
mental health workers 53% 47% 47% 53% 50% 52% 59% 58% 58% 50%
Increased use of administrative staff to
reduce GP administration (e.g. document
workflow)
47% 49% 55% 44% 46% 49% 43% 46% 48% 47%
Increased signposting/ direct access to
extended scope practitioners (e.g.
physiotherapists)
43% 43% 39% 44% 41% 44% 43% 50% 40% 45%
Increased provision and use of nurse
practitioners 40% 40% 34% 41% 44% 37% 43% 41% 47% 37%
Increased use of trained practice
pharmacists 36% 33% 35% 40% 28% 30% 33% 48% 31% 52%
Increased use of community pharmacists
to manage minor ailments and/or certain
categories of patients
25% 22% 31% 29% 25% 26% 24% 24% 23% 28%
Increased use of telephone triage
systems to ensure appropriate use of GP
appointments
18% 19% 19% 17% 19% 20% 16% 16% 18% 19%
Increased use of physician assistants 12% 13% 14% 10% 12% 13% 13% 8% 12% 8%
Increased use of online resources for
patients booking appointments with
guided management (e.g. Askmy GP,
WebGP)
7% 9% 10% 5% 7% 8% 5% 7% 8% 3%
Increased use of technology e.g. Skype
consultations, remote electronic
consultations with patients, remote
access to practice clinical system
5% 4% 6% 5% 5% 6% 4% 5% 3% 3%
Other (please specify) 17% 18% 15% 15% 20% 20% 19% 15% 19% 15%

214685 BMA GP’s Survey 2016
Confidential. All work in accordance with ISO 27001 and 20252 12
Differences in terms of primary role are also present. Compared to other roles, partners and
salaried GPs are significantly more likely to consider increased provision of enhanced
community nurses (66% and 64% respectively) and increased patient self-care/management
(59% and 64% respectively) to be effective in reducing practice workload.
When asked to prioritise just one of the possible measures to reduce workload, a more
nuanced view of desired changes emerged. Increased patient self-care/management to
reduce demand is the clear preferred single measure to reduce workload, supported by
almost a quarter (23%) of GPs. The second most preferred single measure is increased
provision of enhanced community nurses to manage vulnerable housebound patients
(15%). Other popular measures include increased use of administrative staff to reduce GP
administration (10%), increased provision and use of nurse practitioners (10%), and
increased provision for practice support mental health workers (9%), each of which attracts
support from around one in ten GPs.
Figure 3.1.4:
Comparing the two sets of results in this section demonstrates that most GPs see a whole
package of measures as being desirable to help reduce their workload. Whilst some possible
measures are strongly supported even in isolation (e.g. increased patient self-care), there is
clear support for a broad range of measures to address this issue.
Views on hubs
The GP forward view published by NHS England has committed to developing locality hubs
throughout the country in order to provide additional clinical capacity, sustainable support for
GPs within practices to work safely, as well as a range of other useful functions. In this
survey, GPs were asked about their specific views on locality hubs and their role in
supporting individual practices.
Overall, a majority of GPs agree that hubs should provide support for local practices.
Specifically, over three in four GPs agree that there should be systems to ensure practices
use hubs equitably (78%) and there should be a limit to GP workload with the option for
Confidential: For research purposes only 5
Q3b. And of the options you selected, which ONE measure would be most effective in reducing your practice workload?
Base: All participants (n=5,025)
23%
15%
10%
10%
9%
6%
4%
4%
2%
1%
1%
13%
Increased patient self-care/management to reduce demand
Increased provision of enhanced community nurses to manage vulnerable housebound patients
Increased use of administrative staff to reduce GP administration
Increased provision and use of nurse practitioners
Increased provision for practice support mental health workers
Increased use of trained practice pharmacists
Increased use of telephone triage systems to ensure appropriate use of GP appointments
Increased signposting/ direct access to extended scope practitioners
Increased use of physician assistants
Increased use of online resources for patients booking appointments with guided management
Increased use of community pharamacists to manage minor ailments and/or certain categories of patients
Other
Workload: Reducing workload

214685 BMA GP’s Survey 2016
Confidential. All work in accordance with ISO 27001 and 20252 13
overflow work to be seen in a locality hub (77%). Around two-thirds agree that hubs
should be used to provide extended access for evenings and weekends on behalf of
practices (70%), practices should be required to provide a number and type of appointments
and if they reach a defined capacity can then refer additional patients to the hub (67%). A
similar proportion think hubs should offer wider service provision across a range of
healthcare professionals (66%), and that hubs should be managed by local
practices/network and use local or employed GPs (64%).
Whilst more GPs agreed than disagreed with any one of the statements presented, some
proved to be more polarised, attracting a sizable proportion of GPs who disagreed with the
statement. The most contentious view is that hubs should provide telephone triage for urgent
appointments on behalf of local GP practice; around one third (35%) of GPs disagree. Three
in ten GPs (29%) disagree with the view that the management of hubs should be
independently procured.
Figure 3.1.5:
Furthermore, it would appear that GPs’ opinion on the role of hubs is in part related to their
view of their own workload and its impact on the quality and safety of care. Those who
describe their workload as excessive and significantly impacting on care are more likely to
agree with a range of measures than those who feel their workload does not impact
significantly on care. For instance, they are significantly more likely to agree that:
• There should be a limit to GP workload with the option for overflow work to be seen
in a locality hub (83%);
• Practices should be required to provide a number and type of appointments and if
they reach a defined capacity can then refer additional patients to the hub (73%);
• Hubs should be responsible for appropriate in-hours urgent home visits on behalf of
practices (69%).
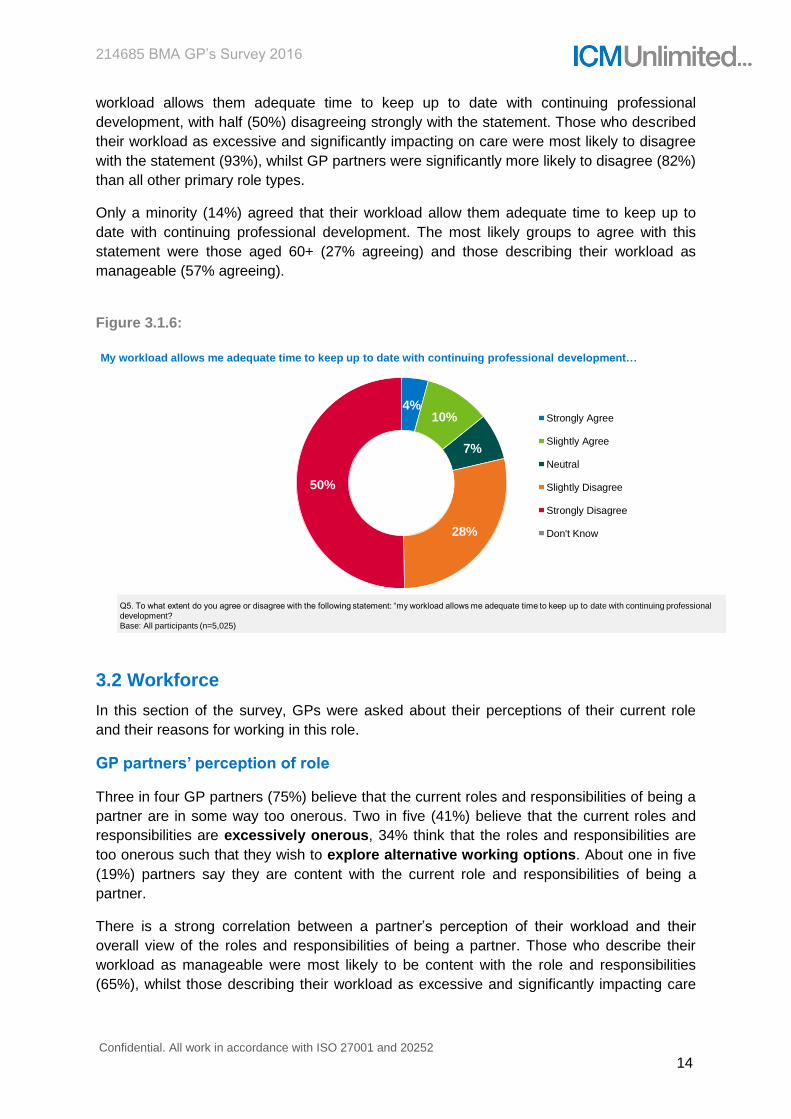
Impact of workload on professional development
Overall, a majority of GPs believe that their workload impacts negatively on their
professional development. Nearly four in five GPs (78%) disagree with the view that their
Confidential: For research purposes only 7
Workload: Agree with hubs
78%
77%
70%
67%
66%
64%
59%
58%
57%
54%
48%
44%
There should be systems to ensure practices use hubs equitably
There should be a limit to GP workload with the option for overflow work to be seen in a locality hub
Hubs should be used to provide extended access at evenings and weekends on behalf of practices (e.g.using GP Access Funds)
Practices should be required to provide a number and type of appointments and if they reach a definedcapacity can then refer additional patients to the hub
Hubs should offer wider service provision across a range of healthcare professionals
Hubs should be managed by local practices/network and use local or employed GPs
Hubs should be responsible for appropriate in-hours urgent home visits on behalf of practices
Practices should be able to use the services of a hub to manage individual practice pressures e.g. unfilledGP vacancies (at a cost to the practice)
Practices should have allocated appointments at the hub based on their list size to ensure equitable use
Hubs should provide a combination of pre-bookable and routine appointments and maintain capacity foroverflow from local practices
The management of hubs should be independently procured
Hubs should provide telephone triage for urgent appointments on behalf of local GP practices
% NET: Agree
Q4. To what extent do you agree or disagree with each of the following statements about hubs?
Base: All participants (n=5025)
214685 BMA GP’s Survey 2016
Confidential. All work in accordance with ISO 27001 and 20252 14
workload allows them adequate time to keep up to date with continuing professional
development, with half (50%) disagreeing strongly with the statement. Those who described
their workload as excessive and significantly impacting on care were most likely to disagree
with the statement (93%), whilst GP partners were significantly more likely to disagree (82%)
than all other primary role types.
Only a minority (14%) agreed that their workload allow them adequate time to keep up to
date with continuing professional development. The most likely groups to agree with this
statement were those aged 60+ (27% agreeing) and those describing their workload as
manageable (57% agreeing).
Figure 3.1.6:
3.2 Workforce
In this section of the survey, GPs were asked about their perceptions of their current role
and their reasons for working in this role.
GP partners’ perception of role
Three in four GP partners (75%) believe that the current roles and responsibilities of being a
partner are in some way too onerous. Two in five (41%) believe that the current roles and
responsibilities are excessively onerous, 34% think that the roles and responsibilities are
too onerous such that they wish to explore alternative working options. About one in five
(19%) partners say they are content with the current role and responsibilities of being a
partner.
There is a strong correlation between a partner’s perception of their workload and their
overall view of the roles and responsibilities of being a partner. Those who describe their
workload as manageable were most likely to be content with the role and responsibilities
(65%), whilst those describing their workload as excessive and significantly impacting care
Confidential: For research purposes only 9
Workload: Management
Q5. To what extent do you agree or disagree with the following statement: “my workload allows me adequate time to keep up to date with continuing professional
development?
Base: All participants (n=5,025)
4%10%
7%
28%
50%
Strongly Agree
Slightly Agree
Neutral
Slightly Disagree
Strongly Disagree
Don't Know
My workload allows me adequate time to keep up to date with continuing professional development…

214685 BMA GP’s Survey 2016
Confidential. All work in accordance with ISO 27001 and 20252 15
were most likely to think of the role and responsibilities as onerous to the extent that they
wish to explore alternative working options (48%).
Figure 3.2.1:
Reasons for working as a locum GP
Three in four locum GPs (76%) say that having control over their own workload explains
why they work as a locum. Around half cite partnership being too onerous/lacking
rewards (53%), locum work suiting their work pattern (49%) and that it gives them more
autonomy (48%) as explanations for their career choice. Forty-six percent describe being a
locum as a positive career choice, whilst 36% say that they work as a locum because
being a salaried GP is too onerous/lacking rewards. Few describe it in the negative
terms available – because they couldn’t get a job as a partner (2%) or as a salaried GP
(1%).
Figure 3.2.2:
Confidential: For research purposes only 11
41%
34%
19%
5%
I believe that the current roles and responsibilities of being a partner are excessivelyonerous
I believe that the current roles and responsibilities of being a partner are too onerous suchthat I wish to explore alternative working options
I am content with the current role and responsibilities of being a partner
None of these describe my view
Q6. Which of the following best describes how you feel about being a partner?
Base: All GP partners respondents (n=3,567)
Workforce: Reasons for being a partner

214685 BMA GP’s Survey 2016
Confidential. All work in accordance with ISO 27001 and 20252 16
Reasons for working as a salaried GP
To explain why they work in their roles, over half of salaried GPs give working in one
setting/providing continuity of care (54%) and partnership being too onerous/lacking
rewards (52%) as reasons. Approximately two in five explain their role choice in terms of
limiting their workload (43%), suiting their work pattern (42%), and providing them with
job security (41%). Three in ten describe being a salaried GP as a positive career choice
(30%), with only three percent saying it was because they cannot get a job as a partner.
Figure 3.2.3:
Reasons for not working as a partner
All GPs who were not contractors, principals, or partners were asked what puts them off
becoming a partner. The most popular response was a workload without limits to
demand, with three quarters of responses (75%). Other commonly mentioned reasons
include three in five non-partners citing excessive and onerous operational
responsibilities of running the practice (62%) and excessive regulatory responsibilities
(60%). Fifty-five percent cited the insecurity of practice finances, and half (50%) said
excessive and onerous human resource responsibilities put them off becoming a
partner. Less than a third (31%) said premises ownership was a barrier to becoming a
partner.
There were distinct differences between genders on the barriers to becoming a partner, with
female non-partners significantly more likely to cite workload without limits to demand (78%,
compared to 70% among men) and the excessive and onerous operational responsibilities of
running the practice (65% vs 57%) as reasons.

214685 BMA GP’s Survey 2016
Confidential. All work in accordance with ISO 27001 and 20252 17
Figure 3.2.4:
Looking forward: working in the next five years
When asked to prioritise how they would like to work in the next five years, almost half (47%)
of GPs wish to work as a partner within the current independent contractor model under
GMS/PMS. Also coming through strongly is the desire to work as a partner within an at
scale GP organisation (32%) or as a portfolio GP (30%).
Other commonly desired working arrangements include working as a self-employed
freelance locum (22%), as an employed GP in a MCP arrangement if offered adequate
terms (19%), as a salaried GP in a single practice (17%) or as a GP with a lead
management role (17%). A further 13% wish to work in a practice having a local contract,
whilst around one in ten wish to work as an employed GP by a hospital trust if offered
adequate terms (11%) or as a self-employed GP in a locum chambers (9%). Of the 16% of
GPs who specified a response not already included in the list of options, nearly all
mentioned no longer being a GP in the NHS. Many others mentioned retirement, emigration,
becoming a private GP or a complete career change.
Figure 3.2.5:
Confidential: For research purposes only 15
47%
32%
30%
22%
19%
17%
17%
13%
11%
9%
16%
I wish to work as a partner within the current independent contractor model under G/PMS
I wish to work as a partner within an at scale GP organisation
I wish to work as a portfolio GP
I wish to work as a self-employed freelance locum
I wish to work as an employed GP in a MCP arrangement if offered adequate terms
I wish to work as a salaried GP in a single GP practice
I wish to work as a GP with a lead management role
I wish to work in GP practice having a local contract, such as with an MCP or hospital trust
I wish to work as an employed GP by a hospital trust if offered adequate terms
I wish to work as a self-employed GP in a Locum chambers
Other
Q10a. Which of the following best describe how would you like to work in the next five years?
Base: All participants (n=5,025)
Workforce: Work in the next five years

214685 BMA GP’s Survey 2016
Confidential. All work in accordance with ISO 27001 and 20252 18
The strength of preference for working as a partner within the current independent contractor
model under GMS/PMS is apparent when GPs are asked to express just one wish for their
work in the next five years, with 35% choosing this option. This was almost three times the
number of GPs who selected the next most popular option; to work as a portfolio GP (12%).
Just over one in nine GPs (11%) prioritise the wish to work as a partner within an at scale
GP organisation. The remaining option all attracted the support of less than one in ten GPs,
as shown in figure 3.2.6 below
Figure 3.2.6:
Looking at the breakdown by primary role, it is clear that there is a tendency for GPs to want
to remain in a similar role. In the next five years, partners are most likely to wish to continue
to work as a partners within the current independent contractor model (46%) or as a partner
within an at scale GP organisation (15%). Salaried GPs are most likely to wish to work as a
salaried GP in a single practice (34%), whilst locums are most likely to wish to work as a
self-employed freelance locum (36%).
GP partners: recruiting GP vacancies
When it comes to recruiting for GP vacancies (excluding locum cover), three in ten GP
partners (31%) have been unable to fill vacancies in the last 12 months. At the other end
of the scale, almost a quarter (23%) of partners report being able to fill vacancies within a
reasonable timeframe. Twenty-seven percent of partners selected an interim option – that
they were able to eventually fill vacancies but this took up to three months (9%) or between
three and six months (18%). Thirteen percent say they have had no need to recruit to fill a
vacancy.
Confidential: For research purposes only 15
35%
12%
11%
8%
7%
4%
4%
2%
2%
1%
14%
I wish to work as a partner within the current independent contractor model under G/PMS
I wish to work as a portfolio GP
I wish to work as a partner within an at scale GP organisation
I wish to work as a salaried GP in a single GP practice
I wish to work as a self-employed freelance locum
I wish to work as an employed GP in a MCP arrangement if offered adequate terms
I wish to work as a GP with a lead management role
I wish to work in GP practice having a local contract, such as with an MCP or hospital trust
I wish to work as an employed GP by a hospital trust if offered adequate terms
I wish to work as a self-employed GP in a Locum chambers
Other
Q10b. And of the options you selected, which one best describes how you would like to work in the next five years?
Base: All participants (n=5,025)
Workforce: Work in the next five years

214685 BMA GP’s Survey 2016
Confidential. All work in accordance with ISO 27001 and 20252 19
Figure 3.2.7:
The ease of recruitment varies by region, with three in ten (30%) partners in London and
the South West having been able to fill vacancies within a reasonable timeframe, compared
to only thirteen percent in the East Midlands. The lowest need for recruitment was in the
North East, where one in five (20%) said that their practice had not had the need to recruit
for a vacancy.
There also appears to be a strong relationship between GPs’ workload and the ability of their
practice to fill vacancies. Forty-four percent of partners describing their workload as
excessive and significantly impacting on care report being unable to fill vacancies, compared
to only fourteen percent of this group who say their practice has been able to fill vacancies
within a reasonable timeframe.
Figure 3.2.8:
GP partners: reasons for hiring locums
When it comes to hiring locum cover, the most frequently cited reason that partners give for
hiring locums is to cover infrequent sessions due to short term staff sickness, absence,

214685 BMA GP’s Survey 2016
Confidential. All work in accordance with ISO 27001 and 20252 20
and leave (39%). Other oft-cited reasons include covering long term employment
vacancies (31%) and continuing to provide a full complement of services (30%). More
than a quarter of GPs said they used locums to cover short term vacancies (27%) or
maternity/paternity absence (26%), with fewer than one in five recruiting locums to
provide cover to enable them to take on other roles (19%), or to cover long term staff
sickness or absence (17%). Of the 7% of partners who specified an ‘other’ reason for
hiring locums, providing cover for holidays, sabbatical and maternity leave were frequently
cited motivations. 8% do not use locums.
Partners who describe their workload as excessive and significantly impacting on care were
significantly more likely than others to use locums to cover long term employment vacancies
(40%), continue providing a full complement of services (37%), or cover long term staff
sickness absence (22%).
Figure 3.2.9:
Financial incentives for locums to work as partners or salaried GPs
A clear majority of GPs –four in five (79%) – believe that there should be financial incentives
to encourage GPs to work as partners or salaried GPs within practices rather than work as
locums. Half of GPs (50%) believe this should be the case if the incentives come from new
money, whereas over a quarter (28%) support it as a principle. Only 12% of GPs think
there shouldn’t be such incentives offered to locums – 8% of GPs believing so as a
principle, with 4% objecting if the incentives are drawn from practice funds.
Locums themselves are the least receptive to the possibility of being offered financial
incentives to change their role. Whilst a majority (58%) of locums thought that financial
incentives should be offered for them to work as a partner or salaried GP, this was
significantly less than all other major role types, with 84% of partners, 74% of trainees and
70% of salaried GPs agreeing with the financial incentives.
GPs who describe their workload as excessive were more likely to support the incentives,
with 85% of those saying their workload significantly impacted on care in favour of

214685 BMA GP’s Survey 2016
Confidential. All work in accordance with ISO 27001 and 20252 21
incentives, and 79% whose workload impacted on care at times. This compared with only
68% of those GPs describing their workload as manageable who supported the incentives.
Figure 3.2.10:
3.3 Practice Finance
New investment in general practice
When asked to specify how any new funding should be invested in general practice, just
under half of GPs (46%) say resources should be provided to support practices, such as
increased community nursing support integrated with the practice. This is closely followed by
a call for resources to be provided for skill mix (44%).
Just under two in five GPs think resources should be provided to directly reimburse
additional staff (38%) and a similar number feel they should be provided into global sum
and others to support practices through external resources (36%). Around three in ten
(29%) think all resources should be provided into global sum.
Just over one quarter (27%) would like to see resources provided to develop locality hubs
to support practices and just under one quarter (24%) think resources should be provided
to help practices develop formal collaborative alliances.
Spending priorities show significant variation by role type. Salaried GPs are more likely to
think resources should be provided to support practices (53%), for skill mix (49%), or to
directly reimburse additional staff (43%) compared to partners. Conversely, partners are
more likely than salaried GPs to support resources being provided into global sum – either in
their entirety (33%) or in part with others to support practices through external resources
(39%).
Those in the North of England are most likely to support resources being provided for skill
mix – with the majority of GPs in Yorkshire and the Humber (54%) and the North East (51%),
and 49% in the North West, supporting this spending priority.
Confidential: For research purposes only 19
Workforce: Financial incentives to work as partners or
salaried GPs
50%
28%
4%
8%
9%Yes, if the incentives come from new money
Yes, as a principle
No, if the incentives are drawn from practicesfunds
No, as a principle
Not sure
Q13. Do you believe that there should be financial incentives to encourage GPs to work as partners or salaried GPs within practices rather than work as locums?
Base: All participants (n=5,025)

214685 BMA GP’s Survey 2016
Confidential. All work in accordance with ISO 27001 and 20252 22
Figure 3.3.1
Charging non-UK patients for general practice services
GPs were asked under what circumstances they would support a government proposal to
charge patients from outside the UK for general practice services. This would exclude
patients from countries which have a reciprocal relationship with the UK, as is currently the
case in much of Europe.
The most popular response, selected by over two in five GPs (42%), is that they would
support this proposal if fees were set nationally with income paid to the NHS and practices
paid for patient registration and administration costs. This option was especially popular with
GPs across the north of England, with just under half in Yorkshire and the Humber (49%),
North East (48%) and North West (47%) supporting it.
The second most popular scenario, chosen by more than a third of GPs (35%), is for
practices to be allowed to treat such patients privately, set the fees, and retain the
income. GPs describing their workload as excessive and significantly impacting on care
were the most likely (44%) to support this option.
Fractionally fewer (33%) chose a situation in which acute urgent problems were provided
without charge, but all non-urgent or chronic care appointments were charged.
One in ten GPs (10%) say they would not support this proposal at all on the grounds that
all patients should receive free primary healthcare, and 4% claim to have a different view
altogether.
Confidential: For research purposes only 20
46%
44%
38%
36%
29%
27%
24%
4%
Resources should be provided to support practices, such as increased community nursing supportintegrated with the practice
Resources should be provided for skill mix
Resources should be provided to directly reimburse additional staff
Some resources should be provided into global sum and others to support practices through externalresources
All resources should be provided into global sum
Resources should be provided to develop locality hubs to support practices
Resources should be provided to help practices develop formal collaborative alliances
Other
Q14a. How do you believe any new funding should be invested in general practice?
Base: All participants (n=5,025)
Finance: Investment in practices

214685 BMA GP’s Survey 2016
Confidential. All work in accordance with ISO 27001 and 20252 23
Figure 3.3.2:
Avoiding Unplanned Admission enhanced service
A large majority of GPs surveyed (87%) believe that the Avoiding Unplanned Admission
enhanced service should be ended. Fewer than one in ten (7%) believe it is worthwhile
and should be continued.
Almost two thirds (65%) believe the service should be ended and the funding added to the
global sum to support the practice’s care of elderly/vulnerable patients. Just over one in five
(22%) agree that it should be ended, but would prefer that the funding be used locally
within the CCG, specifically to improve care for the most vulnerable patients in the practice.
Figure 3.3.3
There is a stark and significant difference in views on the enhanced service by role type.
Partners are by far the most likely to think the service should be ended and the funding
added to global sum to support the practice’s care of elderly/vulnerable patients, with almost
three quarters (73%) in support. This compares to almost half of salaried GPs (48%), just
over two in five (42%) locums, and only 23% of trainees in favour of this option. Trainees
were most likely to think the enhanced service is worthwhile and should be continued, with
Confidential: For research purposes only 22
Finance: Avoiding Unplanned Admission enhanced
service
65%
22%
7%5%
It should be ended and the funding added to global sum to support the practice’s care of elderly/vulnerable patients
It should be ended and the funding usedlocally within the CCG specifically to improvecare for the most vulnerable patients in mypractice
It is worthwhile and should be continued
Don’t know
Q16. Which of the following best describes your view on the Avoiding Unplanned Admission enhanced service?
Base: All participants (n=5,025)

214685 BMA GP’s Survey 2016
Confidential. All work in accordance with ISO 27001 and 20252 24
one in five (20%) supporting the service, compared to fewer than one in ten partners (7%)
and salaried GPs (8%).
Calculating global sum allocations
GPs were also reminded that NHS England is undertaking a review of the current formula for
calculating global sum allocations, seeking a fairer solution. They were then asked how they
thought this new formula should be introduced.
Just 3% feel that there should be no change to the current formula, but the four in five
(81%) who feel changes should be made are divided on how this could best be introduced.
Almost half of GPs (47%) feel the new formula should be implemented over five years
through differential uplifts, ensuring no practice loses in cash terms. This is especially
strongly supported amongst partners – a majority of whom (51%) support this option. This is
significantly higher than among other major role types, with about two in five locums (40%)
and salaried GPs (38%) in support.
The next most popular option, selected by over a quarter (27%), is for the new formula to
be implemented in a phased way over a number of years to reduce the impact on those
who gain and those who lose.
Fewer than one in ten (7%) feel it would be best for the new formula to be implemented as
one wholesale change, accepting that there will be some practices who gain and some that
lose.
Figure 3.3.4
Expected areas of increased expenditure
More than three quarters of GPs (77%) think indemnity is likely to be the area of expense
which will increase most significantly (in percentage terms) over the next 12 months. This
was by far the most frequently chosen area of expenditure with the second most likely area –
CQC fees – chosen by over half (56%).
Confidential: For research purposes only 23
Finance: Calculating global sum allocations
47%
27%
7%
3%
15%
Implemented over five years throughdifferential uplifts ensuring no practice losesin cash terms
Implemented in a phased way over a numberof years to reduce the impact on those whogain and those who lose
Implemented as one wholesale change,accepting there will be some practices whogain and some that lose
There should be no change to the currentformula
Don’t know
Q17. NHS England is engaged in a review of the current formula for a proposed fairer way of calculating global sum allocations. How do you think a new formula should be
introduced?
Base: All participants (n=5,025)

214685 BMA GP’s Survey 2016
Confidential. All work in accordance with ISO 27001 and 20252 25
Locum pay is also expected to increase significantly by just under half of GPs (47%). This is
followed by pension contributions (both employer and employee), mentioned by over one
third (35%), and staff recruitment costs (including locum recruitment), selected by 30% of
GPs.
Several other areas were thought likely to increase in costs by around one quarter of GPs:
salaried GP pay (27%), non-clinical staff pay (27%), other clinical staff pay (25%), non-
reimbursable premises and infrastructure costs (24%) and legal and professional fees
(23%).
Areas considered less likely to increase in expense over the next 12 months include utilities
costs (13%), National Insurance contributions (10%), accountancy (8%), and staff training
(8%). Fewer than one in twenty consider imminent rise in expenses relating to postage and
stationery, travel costs, and dispensing staff pay (all 3%).
Just 1% of GPs say they do not expect any areas of expense to increase over the next 12
months.
The expected areas of increased expenditure vary by role type, potentially indicative of the
increased exposure and awareness of GPs in different roles types to different costs.
Partners are significantly more likely than salaried, locum, or trainee GPs to include CQC
fees (64%), salaried GP pay (33%), other clinical staff pay (29%) or non-clinical staff pay
(34%) as one of the areas of expense to increase the most in percentage terms. Salaried
GPs are more likely than partners to anticipate indemnity (80%), staff recruitment (including
locum recruitment costs) (37%) or legal and professional fees (33%) to be a key area of cost
increase.
Figure 3.3.5
Confidential: For research purposes only 24
77%
56%
47%
35%
30%
27%
27%
25%
24%
23%
13%
10%
8%
8%
3%
3%
3%
1%
Indemnity
CQC fees
Locum pay
Pension contributions (employer and employee)
Staff recruitment (including locum recruitment costs)
Salaried GP pay
Non-clinical staff pay
Other clinical staff pay
Non-reimbursable premises and infrastructure costs
Legal and professional fees
Other utilities costs
National insurance contributions
Accountancy
Staff training
Postage and stationery
Travel costs
Dispensing staff pay
I don't expect any areas of expense to increase
Q18. Thinking about the next 12 months, which areas of expense do you expect to increase the most (in percentage terms)?
Base: All participants (n=5,025)
Finance: Areas to increase in the next 12 months

214685 BMA GP’s Survey 2016
Confidential. All work in accordance with ISO 27001 and 20252 26
3.4 Working at Scale
Preferred models of general practice
When asked about their preferred models of general practice which should be developed for
the future, around half of GPs express their support for the current independent contractor
model. Specifically, just under half (47%) believe that the current independent contractor
model should be the prime model of general practices and should be supported and
invested in.
However, there is also support for collaboration among individual practices, with half of GPs
(50%) agreeing that the current independent contractor model should be supported, but
resources should be allocated for practices to collaborate in the form of GP
federations or networks.
Support for the current model is significantly higher among Partners compared to other GPs:
53% believe the current independent contractor model should be the prime model, while the
same proportion believe that the current model should be supported, with resources
allocated for practices to collaborate.
By contrast, a minority of GPs (17%) feel that the current independent contractor model of
individual practices is too onerous and vulnerable, and that alternatives should be explored.
In terms of alternative models of general practice, a sizeable proportion of GPs feel that
there should be alliances between individual practices. Around one in three (32%) believe
that practices should form collaborative alliances with multi-professional healthcare
staff to manage increasing care out of hospital. Similarly, over a quarter of GPs (27%)
believe that current independent contractor practices should join to form legal
alliances, such as a super partnership with sharing of clinical, management, HR and
regulatory responsibilities.
Figure 3.4.1
GPs were then asked about their single preferred model of general practice which should be
developed in future.
Confidential: For research purposes only 24
50%
47%
32%
27%
17%
4%
Current independent contractor model should be supported andgiven resources for practices to collaborate in the form of GP
federations / networks
Current independent contractor model of individual practicesshould be the prime model of general practices and should be
supported and invested in
Practices should form collaborative alliances with multi-professional healthcare staff to manage increasing care out of
hospital such as MCPs
Current independent contractor practices should join to formlegal alliances, such as a super partnership with sharing ofclinical, management, HR and regulatory responsibilities
The current independent contractor model of individual practicesis too onerous and vulnerable, and alternative arrangements
should be supported
None of the above
Q19a. What models of general practice would you like to see developed for the future?
Base: All participants (n=5025)
Future models of general practice

214685 BMA GP’s Survey 2016
Confidential. All work in accordance with ISO 27001 and 20252 27
Overall, a majority of GPs continue to support the current independent contractor model.
Specifically, one in three (33%) believe it should be the prime model of general practice
and should be supported and invested in, while a further quarter (27%) believe the
current model should be supported, with additional resources provided for practices to
collaborate in the form of GP federations or networks.
Again, support for the current model is significantly higher among Partners: 38% state that
the current independent contractor model should be the prime model for development in
future.
By contrast, one in ten GPs (10%) believe that the current model is too onerous and
vulnerable, and that alternative arrangements should be supported.
In terms of alternative models, around one in seven (14%) express support for a model of
collaborative alliances with multi-professional healthcare staff, while one in nine (11%)
support a model of current independent contractor practices joining to form legal
alliances.
There are also some regional differences in terms of preferred models for development. GPs
based in the North East are most likely to prefer the current model, with additional resources
for collaboration between practices (37%), while GPs based in the North West are most
likely to express support for a model of collaborative alliances with multi-professional
healthcare staff (18%). GPs in the West Midlands (15%) are most likely to express support
for current independent contractor practices joining to form legal alliances.
Figure 3.4.2
Advantages of working in a collaborative GP alliance
When asked about the advantages of working in a collaborative GP alliance, GPs highlight a
range of potential benefits, including the sharing of management, clinical and regulatory
responsibilities.
Confidential: For research purposes only 25
33%
27%
14%
11%
10%
4%
Current independent contractor model of individual practicesshould be the prime model of general practices and should be
supported and invested in
Current independent contractor model should be supported andgiven resources for practices to collaborate in the form of GP
federations / networks
Practices should form collaborative alliances with multi-professional healthcare staff to manage increasing care out of
hospital such as MCPs
Current independent contractor practices should join to formlegal alliances, such as a super partnership with sharing ofclinical, management, HR and regulatory responsibilities
The current independent contractor model of individual practicesis too onerous and vulnerable, and alternative arrangements
should be supported
None of the above
Q19b. And which one model of general practice would you most like to see developed for the future?
Base: All participants (n=5025)
Future models of general practice

214685 BMA GP’s Survey 2016
Confidential. All work in accordance with ISO 27001 and 20252 28
For instance, two in five (39%) believe that collaborative alliances could reduce the
bureaucracy of managing a practice, through sharing of management and administrative
functions. Similarly, 37% believe alliances could help reduce practice workload, e.g. by
providing locality hubs for overflow work, and sharing of clinical staff and services.
Around one in three believe that collaborative alliances provide a sustainable way of
coping with extended access (34%) and greater security and sustainability of
practices within a larger organisation (32%), while a quarter believe they provide greater
opportunities for integrated working with multi-professional community staff (26%) and a
reduced burden on individual practices for preparing and complying with regulatory
obligations (25%).
Figure 3.4.3
Other perceived advantages of working in a collaborative GP alliance include: creation of
locality services and diagnostic services for practices (20%), potential to share in joint
education and continuing professional learning (19%), and a way of absorbing and providing
“out of hospital” care with movement of secondary care services into the community (17%).
Just one in nine (11%) do not believe that there are any advantages to working in a
collaborative GP alliance.
Confidential: For research purposes only 26
39%
37%
34%
32%
26%
25%
20%
19%
17%
11%
Could reduce bureaucracy of managing a practice
Could help reduce practice workload
Sustainable way of coping with extended access on eveningsand weekends
Provides greater security and sustainability of practices within alarger organisation
Greater opportunities for integrated working with multi-professional community staff
Reducing burden on individual practices for preparing andcomplying with regulatory obligations
Creation of locality services and diagnostic services for practices
Potential to share in joint education and continuing professionallearning
Way of absorbing and providing "out of hospital" care withmovement of secondary care services into the community
I do not believe there are any advantages
Q20. What do you feel the advantages of working in a collaborative GP alliance are?
Base: All participants (n=5025)
Advantages of collaborative GP alliance

214685 BMA GP’s Survey 2016
Confidential. All work in accordance with ISO 27001 and 20252 29
4. Appendices
4.1 Sample profile
Current status No. of respondents % of sample
GP contractor or principal or partner 3567 71%
Practice-employed salaried GP 789 16%
Freelance GP (locum) 382 8%
GP trainee 92 2%
NHS organisation-employed salaried GP 48 1%
Retired 36 1%
Out-of-hours GP 18 <1%
Private sector-employed salaried GP 16 <1%
Part of the GP retainer scheme 10 <1%
On a career break 13 <1%
Part of the GP flexible careers scheme 1 <1%
Part of a GP returner or induction or refresher scheme
2 <1%
Prison GP 0 0%
Other 51 1%
Gender No. of respondents % of sample
Male 2489 50%
Female 2469 49%
Unanswered 63 1%
Age Number of
respondents % of sample
29 and under 315 6%
30 to 39 883 18%
40 to 49 1372 27%
50 to 59 2026 40%
60+ 429 9%
Region Number of
respondents % of sample
East of England 508 10%
East Midlands 388 8%
London 475 9%
North East 296 6%
North West 606 12%
South East 892 18%
South West 736 15%
Yorkshire and the Humber 568 11%
Unanswered 24 <1%

214685 BMA GP’s Survey 2016
Confidential. All work in accordance with ISO 27001 and 20252 30
4.2 Guide to statistical reliability
The respondents to the questionnaire are only samples of the total “population”, so we
cannot be certain that the figures obtained are exactly those we would have if every single
GP in the UK had been interviewed (the “true” values). We can, however, predict the
variation between the sample results and the “true” values from knowledge of the size of the
samples on which the results are based and the number of times that a particular answer is
given. The confidence with which we can make this prediction is usually chosen to be 95% -
that is, the chances are 95 in 100 that the “true” value will fall within a specified range. The
table below illustrates the predicted ranges for different sample sizes and percentage results
at the “95% confidence interval”.
Size of sample on which
survey result is based Approximate sampling tolerances applicable to percentages at or
near these levels
Statistical Reliability
10% / 90% 30% / 70% 50% / 50%
100 interviews 5.9 9.0 9.8
500 interviews 2.6 4.0 4.4
1,000 interviews 1.9 2.8 3.1
5,025 interviews 0.8 1.3 1.4
* For example, with a sample of 5,025 where 30% give a particular answer, the chances are
19 in 20 that the “true” value (which would have been obtained if the whole population had
been interviewed) will fall within the range of plus or minus 1.3 percentage points (+/-1.3%)
from the sample result.
Comparing percentages between subgroups and the overall totals
When results are compared between separate groups within a sample, different results may
be obtained. The difference may be “real”, or it may occur by chance (because not everyone
in the population has been interviewed). To test if the difference is a real one - i.e. if it is
“statistically significant”, we again have to know the size of the samples, the percentage
giving a certain answer and the degree of confidence chosen. If we assume the “95%
confidence interval”, the differences between the two sample results must be greater than
the values given in the table below:
Size of samples compared Differences required for significance: percentages at or near these
Statistical Reliability
10% / 90% 30% / 70% 50% / 50%
500 and 500 3.7 5.7 6.2
500 and 1,000 3.2 4.9 5.4
1,000 and 1,000 2.6 4.0 4.4
2,500 and 2,500 1.7 2.5 2.8

214685 BMA GP’s Survey 2016
Confidential. All work in accordance with ISO 27001 and 20252 31
* For example, when comparing a sample of 500 with the population of 1,000 where 30%
give a particular answer, the chances are 19 in 20 that the “true” value (which would have
been obtained if the whole population had been interviewed) will fall within the range of plus
or minus 4.9 percentage points (+/-4.9) from the sample result.