Embed Size (px)
Citation preview

British Economic Growth in the Steam Age:
Some Lessons for Today
Nick Crafts
University of Warwick

General Purpose Technologies (Lipsey et al, 1998)
• Over time are found to have many uses and complementarities … are pervasive
• Initially have much scope for improvement
• Eventually come to be widely used and lead to (large) rise in aggregate productivity growth
BUT• Initially may have no positive impact on growth or
even imply a slowdown phase

The Solow Productivity Paradox
You can see the computer age everywhere except in the productivity statistics
Robert Solow, 1987

Steam as a General Purpose Technology
• Steam Engines, Railways, Steamships
• James Watt’s Invention : 1769
• Liverpool & Manchester Railway : 1830
• Steamship crosses the Atlantic : 1838
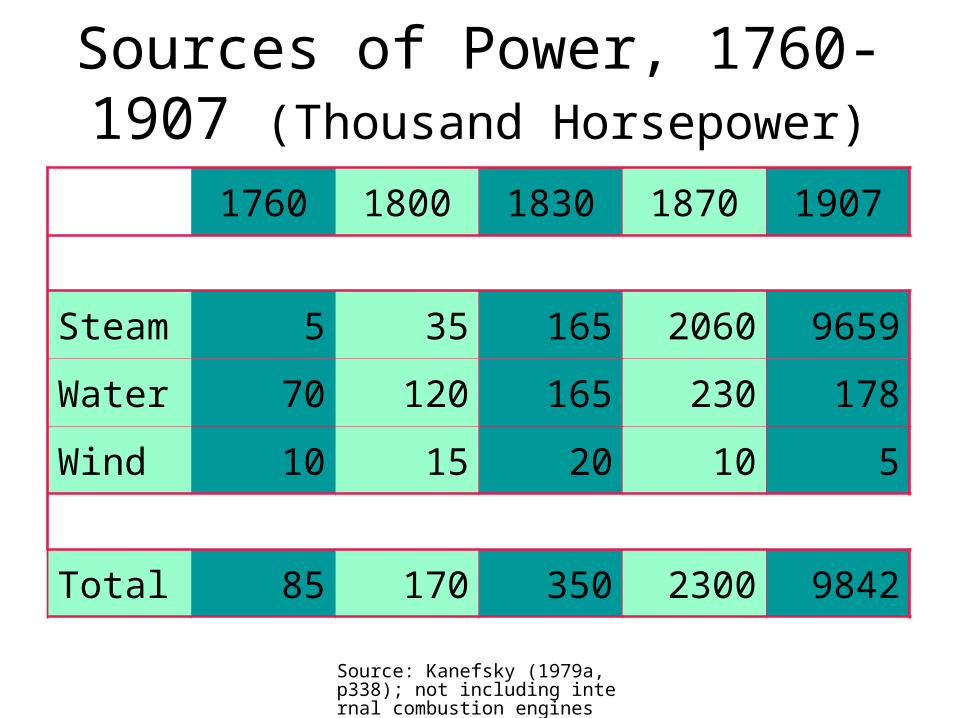
Source: Kanefsky (1979a, p338); not including internal combustion engines
Sources of Power, 1760-1907 (Thousand Horsepower)
1760 1800 1830 1870 1907
Steam 5 35 165 2060 9659
Water 70 120 165 230 178
Wind 10 15 20 10 5
Total 85 170 350 2300 9842

Steam Engine Technology
• Took a long time to become cost effective in most sectors
• Coal consumption per hp per hour fell from 30 lb pre-Watt to 12.5 lb for Watt engine to 2 lb by 1900 when psi reached 200 compared with 6 in 1770
• The big breakthrough was not James Watt but the move to the high pressure steam engine after 1850

Capital Cost and Annual Cost per Steam Horsepower per year (£ current)
Capital Cost Annual Cost
1760 42 33.5
1800 56 20.4
1830 60 20.4
1850 37 13.4
1870 25 8.0
1910 15 4.0
Note: the estimates are for a benchmark textile mill in a low coal cost region like Manchester
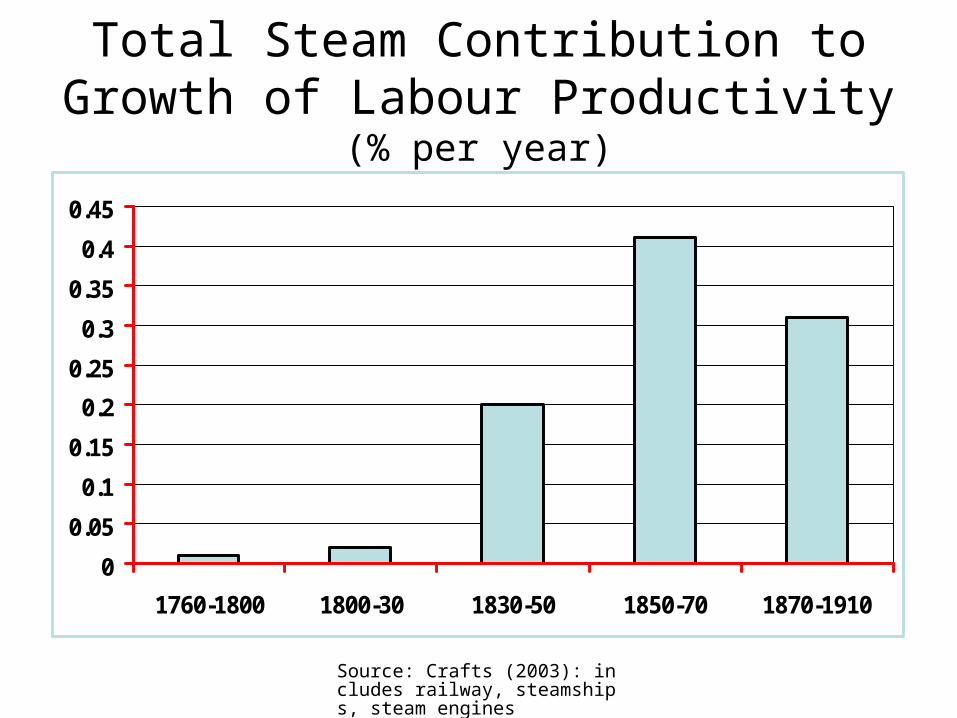
Source: Crafts (2003): includes railway, steamships, steam engines
Total Steam Contribution to Growth of Labour Productivity (% per year)
0
0.05
0.1
0.15
0.2
0.25
0.3
0.35
0.4
0.45
1760-1800 1800-30 1830-50 1850-70 1870-1910

Implications
• Small contribution of steam pre-1830 helps explain Crafts-Harley view of industrial revolution
• Strong contribution of steam power in second half of 19th century says climacteric not explained by hiatus between GPTs
• Puts Solow Paradox into perspective

Source: Oliner and Sichel (2003)
ICT Contribution to US Labour Productivity Growth (% points per year)
0 0.5 1 1.5 2
1974-90
1991-95
1996-2002

Source: Nordbaus (2001)
The Progress of ComputingReal Cost MIPS-E ($1998)
1850 1870 1890 1910 1930 1950 1970 1990 2000
1.E+10
1.E+06
1.E+04
1.E+02
1.E+00
1.E-02
1.E-04
1.E-06
1.E-08
1.E+08

Impact of GPTs on Growth
• ICT much bigger impact on American growth in recent past than steam ever had on UK growth
• Costs of computing have fallen much faster than did costs of steam power
• Society seems to be getting better at exploiting GPTs more rapidly

Source: Gayer, Rostow & Schwartz (1953)
Railway Capital Authorised (£mn)
0
20
40
60
80
100
120
140

Railway Share Prices (June 1840=100)
0
20
40
60
80
100
120
140
160

RAILWAY BENEFITS
0102030405060708090
Net Earnings Social Savings

RATES OF RETURN
• Average private rate of return = 5%, 1830-70
• Average social rate of return = 15%, 1830-70

Lessons from Railways
• Railway mania ended in tears
• Profits from railways less than optimists had hoped
• Users gained much more than investors
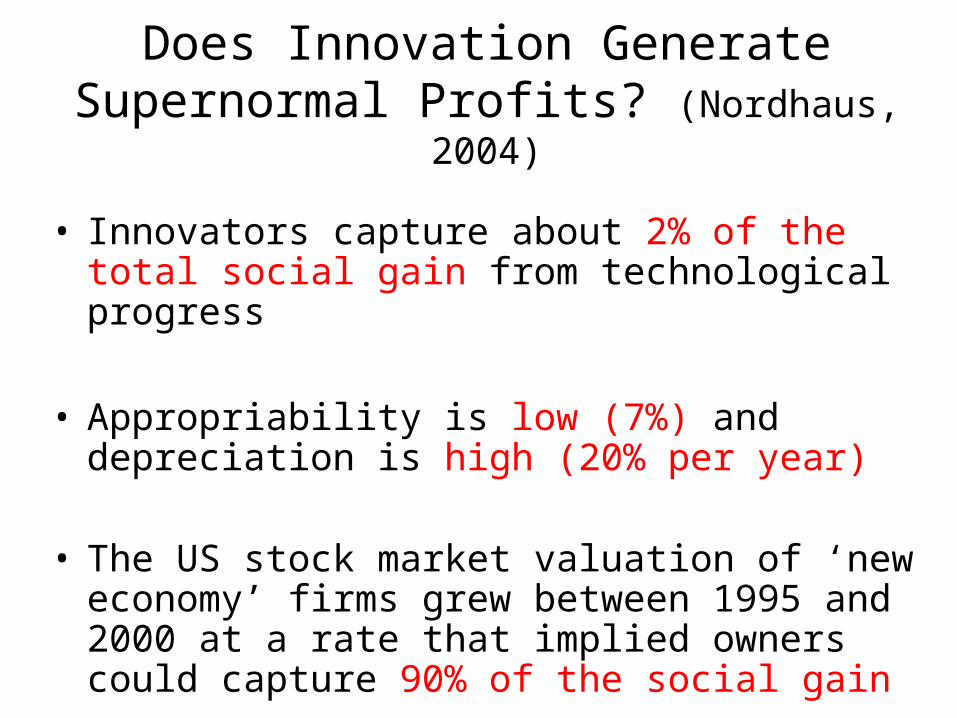
Does Innovation Generate Supernormal Profits? (Nordhaus, 2004)
• Innovators capture about 2% of the total social gain from technological progress
• Appropriability is low (7%) and depreciation is high (20% per year)
• The US stock market valuation of ‘new economy’ firms grew between 1995 and 2000 at a rate that implied owners could capture 90% of the social gain

NASDAQ Composite Index

The New Economy and Stock Prices
• It was a bubble but fundamentals (trend growth) had improved
• Dot.coms experience would not have surprised someone who lived through the 1840s
• Economic gains from ICT not a mirage but few of them will be reaped by investors

Globalization
• Enhanced integration of international markets
• Promoted by reductions in transport and communications costs ….. both steam and ICT do this
• But is the effect to centralize or disperse economic activity?...to promote divergence or convergence?

Transport/Communication Costs
• VERY HIGH: activity is dispersed
• VERY LOW: activity is dispersed
• INTERMEDIATE: agglomeration with feedback effects based on large markets and linkages

Agglomeration Benefits
• External economies of scale
• Productivity rises with city size
• Proximity to customers and suppliers
• Thick labour market
• Still very important and cannot easily be replicated

Steam Power and Industrial Location
• Reduced transport costs for goods rather than services both on land and at sea
• Industry moved closer to natural resources
• Manufacturing cities proliferated in Europe and North America
• Centralizing not dispersing

Source: Harley (1988)
Real Cost of Ocean Shipping(1910 = 100)
0
50
100
150
200
250
300
350
1750 1830 1870 1910

Steam-Powered Globalization
• Helped manufacturing and finance
• Hurt arable agriculture, especially land rents
• Lancashire cotton textiles enjoyed an Indian summer

Sources: Harley (1980); Mitchell (1988)
Wheat Prices
England and Wales (Sh/d per quarter)
Ratio of Liverpool/Chicago
1852/6 62/1 2.00
1868/72 54/8 1.49
1895/9 27/10 1.26
1910/3 32/5 1.06

Lancashire Textiles and Globalization
(Leunig, 2005)
• Lancashire a high wage industry (6 x India and Japan in 1910)
• But continued to dominate world trade (60% world market share in 1910)
• Unit costs no higher than in India or Japan even before adjusting for quality
• Lancashire flourished because of agglomeration benefits (productivity 33% higher than rest of Britain)

Regional GDP/Head (GB= 100)(Crafts, 2005)
1871 1911
London 147.3 165.6
Rest SE 88.5 86.3
East Anglia 92.0 76.8
North West 108.1 97.2
Yorks & Humbs 94.4 89.5
Wales 87.7 90.1

Source: Crafts (2005)
Coefficient of Variation of Regional GDP/Person
0
0.02
0.04
0.06
0.08
0.1
0.12
0.14
0.16
1871 1911 1971 2001

Globalization and the Regions
• Both then and now regional income inequality rises with globalization
• London then and “Greater London” now prosper while imports hurt the provinces
• East Anglia suffered in 19th century and West Midlands in 20th century

London as a Financial Centre
• Agglomeration where size matters
• Benefits from thick labour markets and importance of proximity for deal-making
• Clerical jobs will increasingly be offshored
• This will strengthen the core business

UK Asset Management: Core BusinessOXERA (2005)
Importance Score
Financial Infrastructure
4.00 3.96
Size of Labour Pool 3.96 4.24
Quality of Life 3.77 3.36
Market Liquidity 3.69 4.29
Regulatory Regime 3.69 3.40

UK Asset Management: Back-OfficeOXERA (2005)
Importance Score
Total Labour Cost 4.00 2.74
Size of Labour Pool 3.92 4.08
Flexibility of Labour Market
3.89 3.22
Property Rentals 3.59 2.11
Financial Infrastructure
3.42 3.85

Death of Distance
• “Greatly exaggerated”
• ICT enables some things to go to the periphery but enhances the strengths of the core at the same time (e.g. strengthens London as a financial centre)
• Like steam, ICT rearranges geography but doesn’t abolish it
• Globalization requires sectoral and spatial adjustment

Did Victorian Britain Fail ?
• Choices of technique basically correct
• Foreign investment profitable
• Emulation of USA not feasible
• Natural resources, economies of scale, non-universal technology: not a neoclassical world
• New growth economics and new economic geography complicate the argument

Pre-1914 Globalization
• Driven by falling transport and communication costs
• Protectionism increasing in product markets and USA a high tariff country
• Massive international factor flows
• BOTH capital and labor go from Old World to New World

Anglo-American Wage Gap: %
Contributions to Change, 1870-1913 (O’Rourke, 1996)
Migration -34.8
Capital Flows +13.7
Market Integration -28.5
Residual +54.8
Total +5.2

Why No Wage Convergence ?
• TFP gaps increase because of British incompetence
• USA develops its own non-transferable technology
• USA benefits from increasing returns to scale and agglomeration economies sustained by migration

North Atlantic Economy
• Heckscher-Ohlin• US comparative
advantage from land abundance remains in agriculture
• Tariffs imply less trade and more migration
• New Geography• Migration and
increasing returns: virtuous circle of industrialization plus manufactured exports
• Tariffs imply more migration and promote switch in comparative advantage

American Overtaking of Britain
• Best understood in the context of globalization
• Reveals some limitations of neoclassical economics
• May have no important policy implications