Embed Size (px)
Citation preview
Y E A R I N R E V I E W 2 0 1 7
British Columbia Seafood Industry
The B.C. government’s Grow BC, Feed BC and Buy BC programs will continue to build a strong, safe and sustainable seafood sector that employs thousands of British Columbians in communities throughout the province
British Columbia Seafood Industry Year in Review 2017
Table of Contents
A MESSAGE FROM THE MINISTER OF AGRICULTURE 1
BRITISH COLUMBIA’S AGRIFOOD AND SEAFOOD SECTOR 2
BRITISH COLUMBIA SEAFOOD SECTOR HIGHLIGHTS 2
BRITISH COLUMBIA SEAFOOD PRODUCTION 2015 - 2017 3
B.C. SEAFOOD SECTOR PERFORMANCE 5
HARVEST
LANDED VALUE
WHOLESALE VALUE
SALMON 6
HERRING 8
GROUNDFISH 9
SHELLFISH 11
OTHER SEAFOOD SPECIES 13
B.C. SEAFOOD EXPORT HIGHLIGHTS 14
SIGNIFICANT EVENTS IN B.C.’S SEAFOOD SECTOR – 2017/18 15
DATA SOURCES AND CONTACT INFORMATION 17
A message from the Minister of AgricultureI am proud to present the Ministry of Agriculture’s 2017 British Columbia Seafood Year in Review. This document reflects the hard work being done by B.C.’s seafood industry and the Ministry to provide safe, sustainable, high quality products to both local and international markets who are eager to Buy B.C.
In 2017, the seafood sector harvested 279,400 tonnes of wild and farmed species valued at $1.2 billion and exported seafood products to 73 international markets. The continual increase in the sale of B.C.’s seafood products reflects our reputation of quality that our purchasers have come to know and expect. Though B.C. seafood is diverse, with more than 100 species of finfish, shellfish and marine plants being harvested commercially the industry, provincial and federal governments are working hard to ensure the sustainability of the species being harvested.
In 2017, The Ministry of Agriculture and the Department of Fisheries and Oceans launched the national Fisheries and Aquaculture Clean Technology Program - a matching federal-provincial grant program. The Ministry of Agriculture is supporting B.C.’s aquaculture and fisheries industry to apply for funding to implement market-ready clean technologies, processes and sustainable practices into their operations to improve their environmental performance.
The Ministry of Agriculture also launched the B.C. Oyster Recovery Fund to help the province’s oyster aquaculture sector rebuild, re-seed, and study coastal marine areas where oysters are grown to expand and sustain this growing industry.
The B.C. government’s Grow BC, Feed BC and Buy BC programs will continue to build a strong, safe and sustainable seafood sector that employs thousands of British Columbians in communities throughout the province. Together these initiatives are helping to make B.C. seafood a more sustainable and competitive choice for consumers looking for trusted, high quality products.
Thank you to everyone involved in our B.C. seafood sector. Your commitment to quality, sustainability and diversity have fueled our growth this year and your work is truly appreciated.
HONOURABLE LANA POPHAM Minister of Agriculture
#BuyBC
1British Columbia Seafood Industry Year in Review 2017
2British Columbia Seafood Industry Year in Review 2017
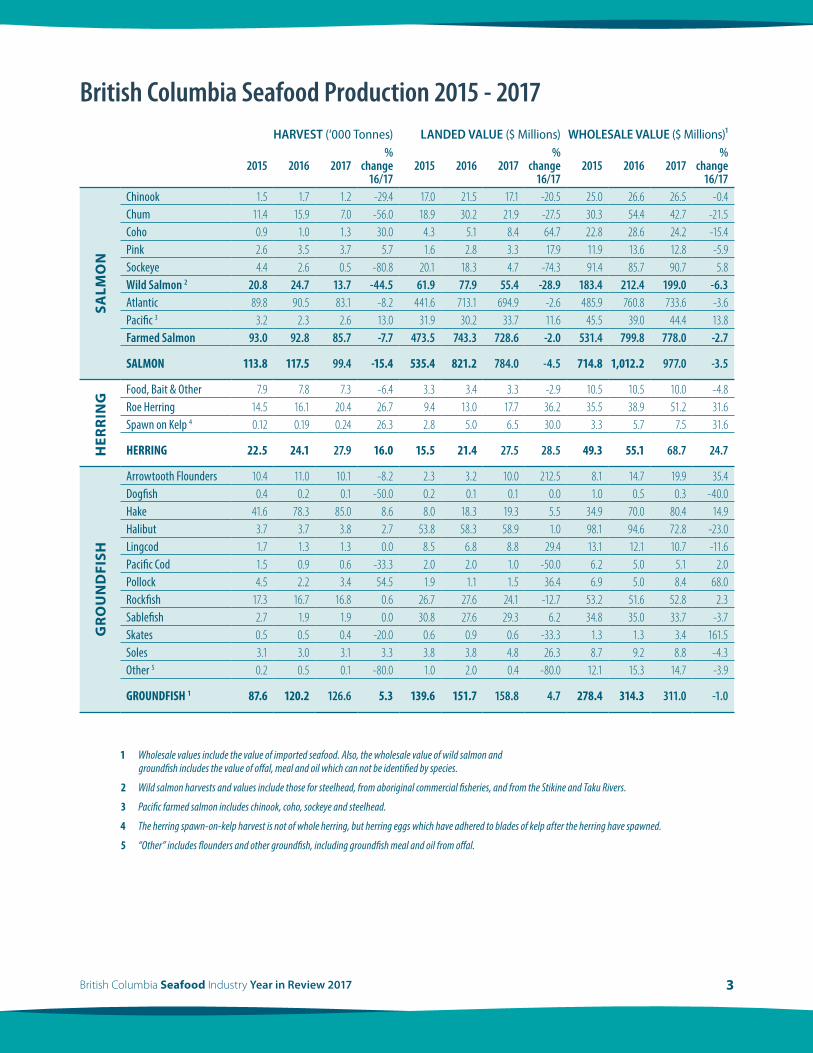
British Columbia Seafood Production 2008 – 2017
Wholesale Value($ Millions)
Landed Value($ Millions)
Harvest(’000 Tonnes)
201620152014201320122011201020092008 20170
400
800
1,200
1,600
2,000
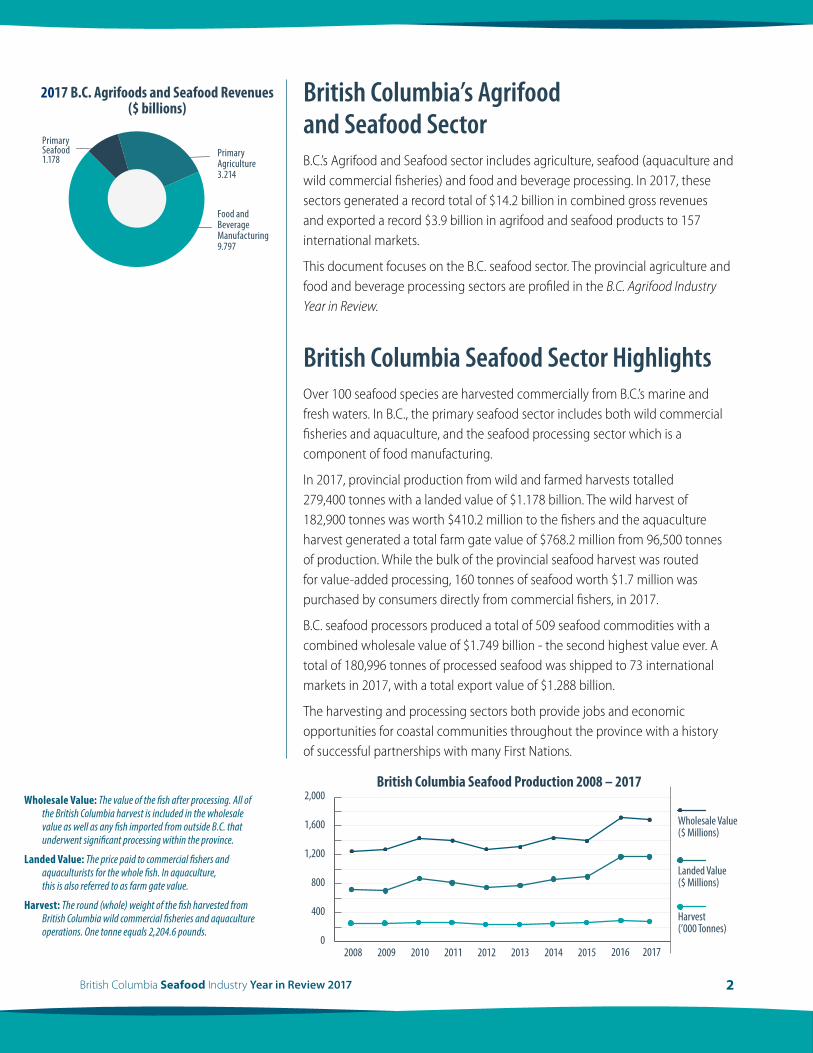
British Columbia’s Agrifood and Seafood SectorB.C.’s Agrifood and Seafood sector includes agriculture, seafood (aquaculture and wild commercial fisheries) and food and beverage processing. In 2017, these sectors generated a record total of $14.2 billion in combined gross revenues and exported a record $3.9 billion in agrifood and seafood products to 157 international markets.
This document focuses on the B.C. seafood sector. The provincial agriculture and food and beverage processing sectors are profiled in the B.C. Agrifood Industry Year in Review.
British Columbia Seafood Sector HighlightsOver 100 seafood species are harvested commercially from B.C.’s marine and fresh waters. In B.C., the primary seafood sector includes both wild commercial fisheries and aquaculture, and the seafood processing sector which is a component of food manufacturing.
In 2017, provincial production from wild and farmed harvests totalled 279,400 tonnes with a landed value of $1.178 billion. The wild harvest of 182,900 tonnes was worth $410.2 million to the fishers and the aquaculture harvest generated a total farm gate value of $768.2 million from 96,500 tonnes of production. While the bulk of the provincial seafood harvest was routed for value-added processing, 160 tonnes of seafood worth $1.7 million was purchased by consumers directly from commercial fishers, in 2017.
B.C. seafood processors produced a total of 509 seafood commodities with a combined wholesale value of $1.749 billion - the second highest value ever. A total of 180,996 tonnes of processed seafood was shipped to 73 international markets in 2017, with a total export value of $1.288 billion.
The harvesting and processing sectors both provide jobs and economic opportunities for coastal communities throughout the province with a history of successful partnerships with many First Nations.
Wholesale Value: The value of the fish after processing. All of the British Columbia harvest is included in the wholesale value as well as any fish imported from outside B.C. that underwent significant processing within the province.
Landed Value: The price paid to commercial fishers and aquaculturists for the whole fish. In aquaculture, this is also referred to as farm gate value.
Harvest: The round (whole) weight of the fish harvested from British Columbia wild commercial fisheries and aquaculture operations. One tonne equals 2,204.6 pounds.
2017 B.C. Agrifoods and Seafood Revenues($ billions)
PrimarySeafood1.178
PrimaryAgriculture3.214
Food andBeverageManufacturing9.797
3British Columbia Seafood Industry Year in Review 2017
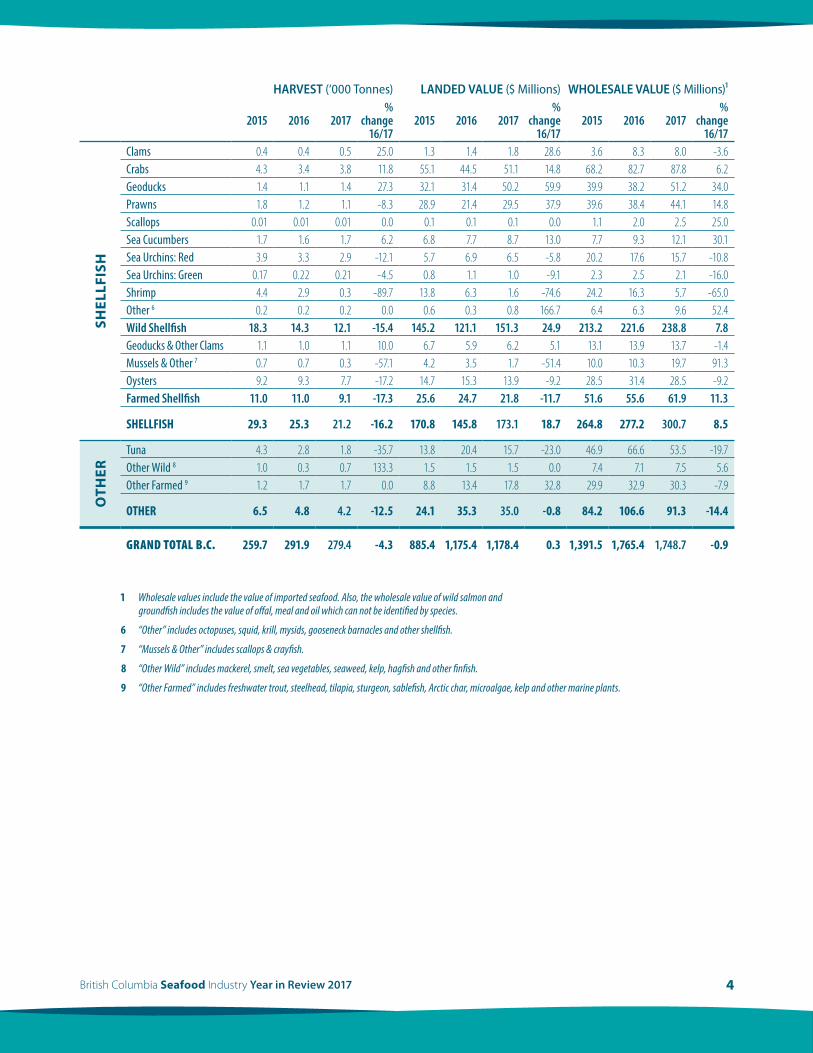
British Columbia Seafood Production 2015 - 2017HARVEST (‘000 Tonnes) LANDED VALUE ($ Millions) WHOLESALE VALUE ($ Millions)¹
2015 2016 2017%
change 16/17
2015 2016 2017%
change 16/17
2015 2016 2017%
change 16/17
SALM
ON
Chinook 1 5 1 7 1 2 -29 4 17 0 21 5 17 1 -20 5 25 0 26 6 26 5 -0 4Chum 11 4 15 9 7 0 -56 0 18 9 30 2 21 9 -27 5 30 3 54 4 42 7 -21 5Coho 0 9 1 0 1 3 30 0 4 3 5 1 8 4 64 7 22 8 28 6 24 2 -15 4Pink 2 6 3 5 3 7 5 7 1 6 2 8 3 3 17 9 11 9 13 6 12 8 -5 9Sockeye 4 4 2 6 0 5 -80 8 20 1 18 3 4 7 -74 3 91 4 85 7 90 7 5 8Wild Salmon 2 20.8 24.7 13.7 -44.5 61.9 77.9 55.4 -28.9 183.4 212.4 199.0 -6.3Atlantic 89 8 90 5 83 1 -8 2 441 6 713 1 694 9 -2 6 485 9 760 8 733 6 -3 6Pacific 3 3 2 2 3 2 6 13 0 31 9 30 2 33 7 11 6 45 5 39 0 44 4 13 8Farmed Salmon 93.0 92.8 85.7 -7.7 473.5 743.3 728.6 -2.0 531.4 799.8 778.0 -2.7
SALMON 113.8 117.5 99.4 -15.4 535.4 821.2 784.0 -4.5 714.8 1,012.2 977.0 -3.5
HER
RIN
G
Food, Bait & Other 7 9 7 8 7 3 -6 4 3 3 3 4 3 3 -2 9 10 5 10 5 10 0 -4 8Roe Herring 14 5 16 1 20 4 26 7 9 4 13 0 17 7 36 2 35 5 38 9 51 2 31 6Spawn on Kelp 4 0 12 0 19 0 24 26 3 2 8 5 0 6 5 30 0 3 3 5 7 7 5 31 6
HERRING 22.5 24.1 27.9 16.0 15.5 21.4 27.5 28.5 49.3 55.1 68.7 24.7
GR
OU
ND
FISH
Arrowtooth Flounders 10 4 11 0 10 1 -8 2 2 3 3 2 10 0 212 5 8 1 14 7 19 9 35 4Dogfish 0 4 0 2 0 1 -50 0 0 2 0 1 0 1 0 0 1 0 0 5 0 3 -40 0Hake 41 6 78 3 85 0 8 6 8 0 18 3 19 3 5 5 34 9 70 0 80 4 14 9Halibut 3 7 3 7 3 8 2 7 53 8 58 3 58 9 1 0 98 1 94 6 72 8 -23 0Lingcod 1 7 1 3 1 3 0 0 8 5 6 8 8 8 29 4 13 1 12 1 10 7 -11 6Pacific Cod 1 5 0 9 0 6 -33 3 2 0 2 0 1 0 -50 0 6 2 5 0 5 1 2 0Pollock 4 5 2 2 3 4 54 5 1 9 1 1 1 5 36 4 6 9 5 0 8 4 68 0Rockfish 17 3 16 7 16 8 0 6 26 7 27 6 24 1 -12 7 53 2 51 6 52 8 2 3Sablefish 2 7 1 9 1 9 0 0 30 8 27 6 29 3 6 2 34 8 35 0 33 7 -3 7Skates 0 5 0 5 0 4 -20 0 0 6 0 9 0 6 -33 3 1 3 1 3 3 4 161 5Soles 3 1 3 0 3 1 3 3 3 8 3 8 4 8 26 3 8 7 9 2 8 8 -4 3Other 5 0 2 0 5 0 1 -80 0 1 0 2 0 0 4 -80 0 12 1 15 3 14 7 -3 9
GROUNDFISH 1 87.6 120.2 126.6 5.3 139.6 151.7 158.8 4.7 278.4 314.3 311.0 -1.0
1 Wholesale values include the value of imported seafood. Also, the wholesale value of wild salmon and groundfish includes the value of offal, meal and oil which can not be identified by species.
2 Wild salmon harvests and values include those for steelhead, from aboriginal commercial fisheries, and from the Stikine and Taku Rivers.
3 Pacific farmed salmon includes chinook, coho, sockeye and steelhead.
4 The herring spawn-on-kelp harvest is not of whole herring, but herring eggs which have adhered to blades of kelp after the herring have spawned.
5 “Other” includes flounders and other groundfish, including groundfish meal and oil from offal.
4British Columbia Seafood Industry Year in Review 2017
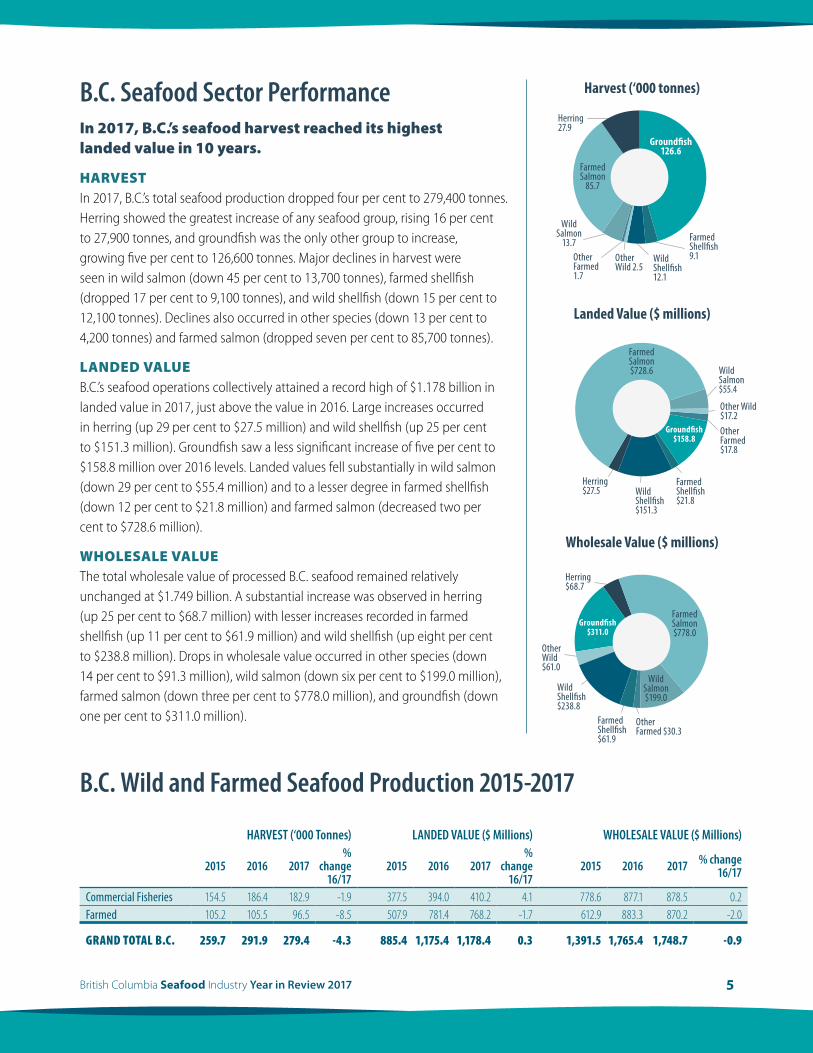
HARVEST (‘000 Tonnes) LANDED VALUE ($ Millions) WHOLESALE VALUE ($ Millions)¹
2015 2016 2017%
change 16/17
2015 2016 2017%
change 16/17
2015 2016 2017%
change 16/17
SHEL
LFIS
H
Clams 0 4 0 4 0 5 25 0 1 3 1 4 1 8 28 6 3 6 8 3 8 0 -3 6Crabs 4 3 3 4 3 8 11 8 55 1 44 5 51 1 14 8 68 2 82 7 87 8 6 2Geoducks 1 4 1 1 1 4 27 3 32 1 31 4 50 2 59 9 39 9 38 2 51 2 34 0Prawns 1 8 1 2 1 1 -8 3 28 9 21 4 29 5 37 9 39 6 38 4 44 1 14 8Scallops 0 01 0 01 0 01 0 0 0 1 0 1 0 1 0 0 1 1 2 0 2 5 25 0Sea Cucumbers 1 7 1 6 1 7 6 2 6 8 7 7 8 7 13 0 7 7 9 3 12 1 30 1Sea Urchins: Red 3 9 3 3 2 9 -12 1 5 7 6 9 6 5 -5 8 20 2 17 6 15 7 -10 8Sea Urchins: Green 0 17 0 22 0 21 -4 5 0 8 1 1 1 0 -9 1 2 3 2 5 2 1 -16 0Shrimp 4 4 2 9 0 3 -89 7 13 8 6 3 1 6 -74 6 24 2 16 3 5 7 -65 0Other 6 0 2 0 2 0 2 0 0 0 6 0 3 0 8 166 7 6 4 6 3 9 6 52 4Wild Shellfish 18.3 14.3 12.1 -15.4 145.2 121.1 151.3 24.9 213.2 221.6 238.8 7.8Geoducks & Other Clams 1 1 1 0 1 1 10 0 6 7 5 9 6 2 5 1 13 1 13 9 13 7 -1 4Mussels & Other 7 0 7 0 7 0 3 -57 1 4 2 3 5 1 7 -51 4 10 0 10 3 19 7 91 3Oysters 9 2 9 3 7 7 -17 2 14 7 15 3 13 9 -9 2 28 5 31 4 28 5 -9 2Farmed Shellfish 11.0 11.0 9.1 -17.3 25.6 24.7 21.8 -11.7 51.6 55.6 61.9 11.3
SHELLFISH 29.3 25.3 21.2 -16.2 170.8 145.8 173.1 18.7 264.8 277.2 300.7 8.5
OTH
ER
Tuna 4 3 2 8 1 8 -35 7 13 8 20 4 15 7 -23 0 46 9 66 6 53 5 -19 7Other Wild 8 1 0 0 3 0 7 133 3 1 5 1 5 1 5 0 0 7 4 7 1 7 5 5 6Other Farmed 9 1 2 1 7 1 7 0 0 8 8 13 4 17 8 32 8 29 9 32 9 30 3 -7 9
OTHER 6.5 4.8 4.2 -12.5 24.1 35.3 35.0 -0.8 84.2 106.6 91.3 -14.4
GRAND TOTAL B.C. 259.7 291.9 279.4 -4.3 885.4 1,175.4 1,178.4 0.3 1,391.5 1,765.4 1,748.7 -0.9
1 Wholesale values include the value of imported seafood. Also, the wholesale value of wild salmon and groundfish includes the value of offal, meal and oil which can not be identified by species.
6 “Other” includes octopuses, squid, krill, mysids, gooseneck barnacles and other shellfish.
7 “Mussels & Other” includes scallops & crayfish.
8 “Other Wild” includes mackerel, smelt, sea vegetables, seaweed, kelp, hagfish and other finfish.
9 “Other Farmed” includes freshwater trout, steelhead, tilapia, sturgeon, sablefish, Arctic char, microalgae, kelp and other marine plants.
5British Columbia Seafood Industry Year in Review 2017
B.C. Seafood Sector PerformanceIn 2017, B.C.’s seafood harvest reached its highest landed value in 10 years.
HARVESTIn 2017, B.C.’s total seafood production dropped four per cent to 279,400 tonnes. Herring showed the greatest increase of any seafood group, rising 16 per cent to 27,900 tonnes, and groundfish was the only other group to increase, growing five per cent to 126,600 tonnes. Major declines in harvest were seen in wild salmon (down 45 per cent to 13,700 tonnes), farmed shellfish (dropped 17 per cent to 9,100 tonnes), and wild shellfish (down 15 per cent to 12,100 tonnes). Declines also occurred in other species (down 13 per cent to 4,200 tonnes) and farmed salmon (dropped seven per cent to 85,700 tonnes).
LANDED VALUEB.C.’s seafood operations collectively attained a record high of $1.178 billion in landed value in 2017, just above the value in 2016. Large increases occurred in herring (up 29 per cent to $27.5 million) and wild shellfish (up 25 per cent to $151.3 million). Groundfish saw a less significant increase of five per cent to $158.8 million over 2016 levels. Landed values fell substantially in wild salmon (down 29 per cent to $55.4 million) and to a lesser degree in farmed shellfish (down 12 per cent to $21.8 million) and farmed salmon (decreased two per cent to $728.6 million).
WHOLESALE VALUEThe total wholesale value of processed B.C. seafood remained relatively unchanged at $1.749 billion. A substantial increase was observed in herring (up 25 per cent to $68.7 million) with lesser increases recorded in farmed shellfish (up 11 per cent to $61.9 million) and wild shellfish (up eight per cent to $238.8 million). Drops in wholesale value occurred in other species (down 14 per cent to $91.3 million), wild salmon (down six per cent to $199.0 million), farmed salmon (down three per cent to $778.0 million), and groundfish (down one per cent to $311.0 million).
Harvest (‘000 tonnes)
Landed Value ($ millions)
Wholesale Value ($ millions)
WildSalmon
13.7 FarmedShellfish 9.1Wild
Shellfish 12.1
FarmedShellfish $21.8
Herring $27.5 Wild
Shellfish $151.3
Other Farmed 1.7
OtherFarmed$17.8
Wild Salmon$55.4
Other Wild 2.5
Other Wild$17.2
FarmedShellfish $61.9
Herring $68.7
WildShellfish $238.8
Other Farmed $30.3
Other Wild $61.0
Herring 27.9
FarmedSalmon
85.7
Ground�sh126.6
FarmedSalmon$728.6
Ground�sh$158.8
FarmedSalmon$778.0
Ground�sh$311.0
WildSalmon$199.0
B.C. Wild and Farmed Seafood Production 2015-2017
HARVEST (‘000 Tonnes) LANDED VALUE ($ Millions) WHOLESALE VALUE ($ Millions)
2015 2016 2017%
change 16/17
2015 2016 2017%
change 16/17
2015 2016 2017 % change 16/17
Commercial Fisheries 154 5 186 4 182 9 -1 9 377 5 394 0 410 2 4 1 778 6 877 1 878 5 0 2Farmed 105 2 105 5 96 5 -8 5 507 9 781 4 768 2 -1 7 612 9 883 3 870 2 -2 0
GRAND TOTAL B.C. 259.7 291.9 279.4 -4.3 885.4 1,175.4 1,178.4 0.3 1,391.5 1,765.4 1,748.7 -0.9
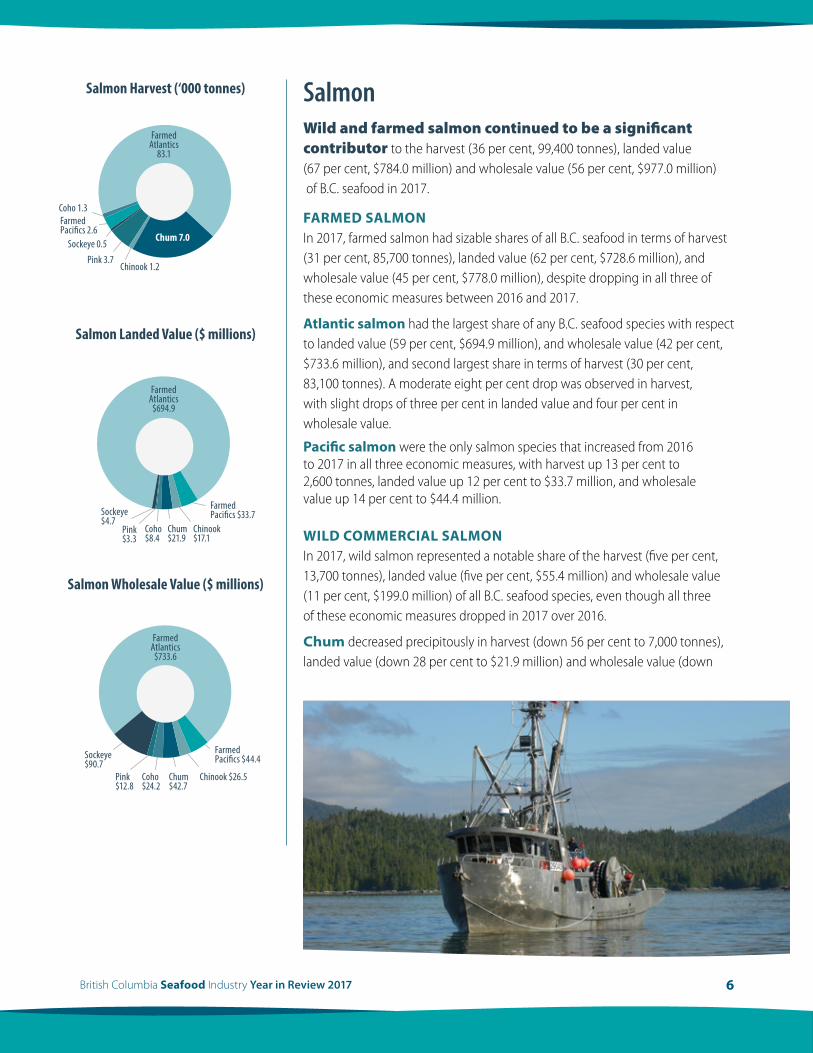
Salmon Harvest (‘000 tonnes)
Salmon Wholesale Value ($ millions)
Salmon Landed Value ($ millions)
Chinook $17.1
Coho $8.4
Pink $3.3
Chum $21.9
Chinook $26.5Coho $24.2
Pink$12.8
Sockeye$90.7
Chum $42.7
FarmedPacifics $33.7
FarmedPacifics $44.4
Chinook 1.2
Sockeye 0.5Pink 3.7
Coho 1.3FarmedPacifics 2.6
FarmedAtlantics
83.1
Chum 7.0
Sockeye $4.7
FarmedAtlantics
$694.9
FarmedAtlantics
$733.6
6British Columbia Seafood Industry Year in Review 2017
SalmonWild and farmed salmon continued to be a significant contributor to the harvest (36 per cent, 99,400 tonnes), landed value (67 per cent, $784.0 million) and wholesale value (56 per cent, $977.0 million) of B.C. seafood in 2017.
FARMED SALMONIn 2017, farmed salmon had sizable shares of all B.C. seafood in terms of harvest (31 per cent, 85,700 tonnes), landed value (62 per cent, $728.6 million), and wholesale value (45 per cent, $778.0 million), despite dropping in all three of these economic measures between 2016 and 2017.
Atlantic salmon had the largest share of any B.C. seafood species with respect to landed value (59 per cent, $694.9 million), and wholesale value (42 per cent, $733.6 million), and second largest share in terms of harvest (30 per cent, 83,100 tonnes). A moderate eight per cent drop was observed in harvest, with slight drops of three per cent in landed value and four per cent in wholesale value.
Pacific salmon were the only salmon species that increased from 2016 to 2017 in all three economic measures, with harvest up 13 per cent to 2,600 tonnes, landed value up 12 per cent to $33.7 million, and wholesale value up 14 per cent to $44.4 million. WILD COMMERCIAL SALMON In 2017, wild salmon represented a notable share of the harvest (five per cent, 13,700 tonnes), landed value (five per cent, $55.4 million) and wholesale value (11 per cent, $199.0 million) of all B.C. seafood species, even though all three of these economic measures dropped in 2017 over 2016.
Chum decreased precipitously in harvest (down 56 per cent to 7,000 tonnes), landed value (down 28 per cent to $21.9 million) and wholesale value (down
7British Columbia Seafood Industry Year in Review 2017
22 per cent to $42.7 million), but still represented the largest portion of the harvest of all wild salmon species.
Sockeye wholesale value increased by six per cent to $90.7 million despite huge drops in harvest (down 81 per cent to 500 tonnes) and landed value (down 74 per cent to 4.7 million).
Coho showed impressive increases in harvest (up 30 per cent to 1,300 tonnes) and landed value (up 65 per cent to $8.4 million) despite falling in wholesale value (down 15 per cent to $24.2 million).
Chinook stayed relatively stable in wholesale value at $26.5 million despite large declines in harvest (down 29 per cent to 1,200 tonnes) and landed value (down 21 per cent to $17.1 million).
Pink increased in harvest (up six per cent to 3,600 tonnes) and landed value (up 18 per cent to $3.3 million), but dipped in wholesale value (down six per cent to $12.8 million) in 2017 compared to 2016.
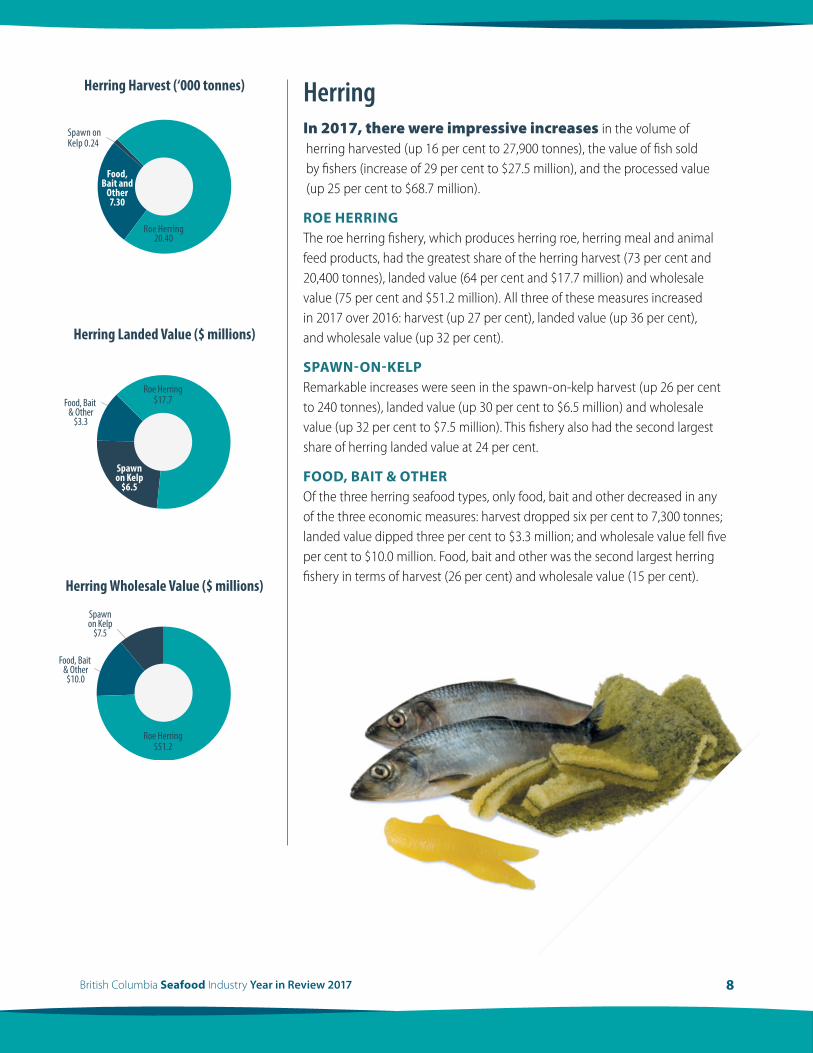
Herring Landed Value ($ millions)
Herring Wholesale Value ($ millions)
Herring Harvest (‘000 tonnes)
Roe Herring$17.7Food, Bait
& Other$3.3
Food, Bait & Other$10.0
Spawn on Kelp 0.24
Spawnon Kelp
$6.5
Spawnon Kelp
$7.5
Roe Herring20.40
Food, Bait and
Other7.30
Roe Herring$51.2
8British Columbia Seafood Industry Year in Review 2017
HerringIn 2017, there were impressive increases in the volume of herring harvested (up 16 per cent to 27,900 tonnes), the value of fish sold by fishers (increase of 29 per cent to $27.5 million), and the processed value (up 25 per cent to $68.7 million).
ROE HERRINGThe roe herring fishery, which produces herring roe, herring meal and animal feed products, had the greatest share of the herring harvest (73 per cent and 20,400 tonnes), landed value (64 per cent and $17.7 million) and wholesale value (75 per cent and $51.2 million). All three of these measures increased in 2017 over 2016: harvest (up 27 per cent), landed value (up 36 per cent), and wholesale value (up 32 per cent).
SPAWN-ON-KELPRemarkable increases were seen in the spawn-on-kelp harvest (up 26 per cent to 240 tonnes), landed value (up 30 per cent to $6.5 million) and wholesale value (up 32 per cent to $7.5 million). This fishery also had the second largest share of herring landed value at 24 per cent.
FOOD, BAIT & OTHEROf the three herring seafood types, only food, bait and other decreased in any of the three economic measures: harvest dropped six per cent to 7,300 tonnes; landed value dipped three per cent to $3.3 million; and wholesale value fell five per cent to $10.0 million. Food, bait and other was the second largest herring fishery in terms of harvest (26 per cent) and wholesale value (15 per cent).
9British Columbia Seafood Industry Year in Review 2017
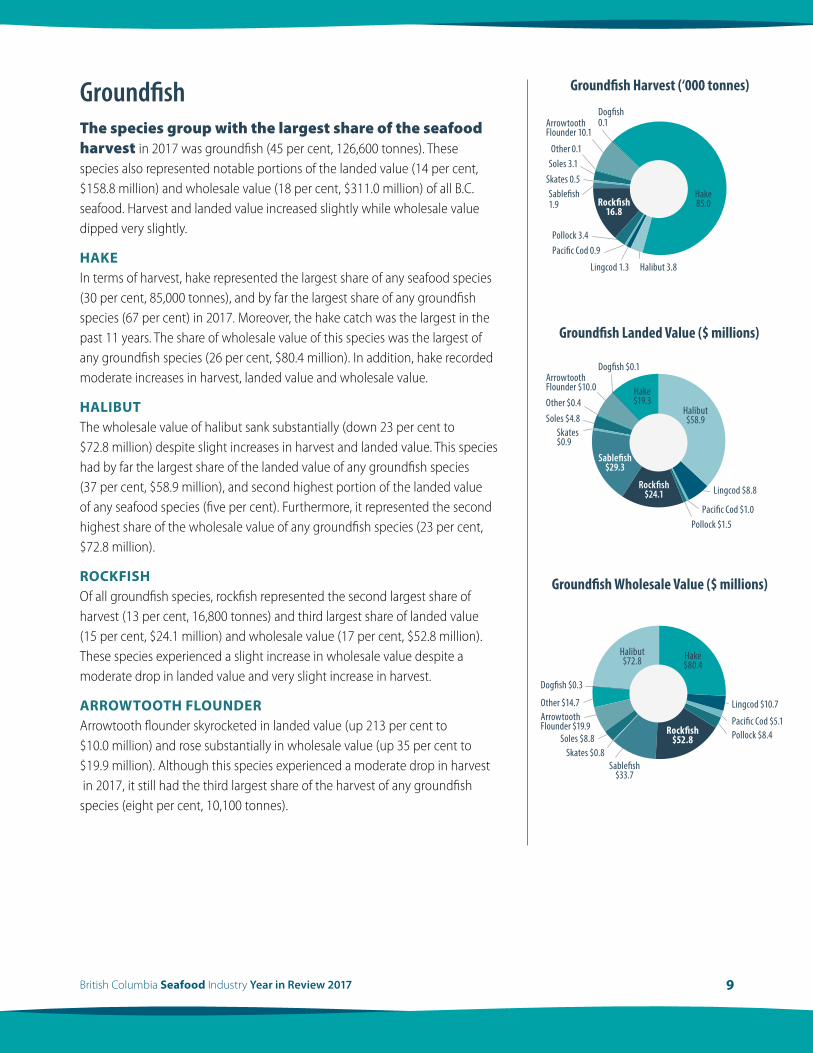
GroundfishThe species group with the largest share of the seafood harvest in 2017 was groundfish (45 per cent, 126,600 tonnes). These species also represented notable portions of the landed value (14 per cent, $158.8 million) and wholesale value (18 per cent, $311.0 million) of all B.C. seafood. Harvest and landed value increased slightly while wholesale value dipped very slightly.
HAKEIn terms of harvest, hake represented the largest share of any seafood species (30 per cent, 85,000 tonnes), and by far the largest share of any groundfish species (67 per cent) in 2017. Moreover, the hake catch was the largest in the past 11 years. The share of wholesale value of this species was the largest of any groundfish species (26 per cent, $80.4 million). In addition, hake recorded moderate increases in harvest, landed value and wholesale value.
HALIBUTThe wholesale value of halibut sank substantially (down 23 per cent to $72.8 million) despite slight increases in harvest and landed value. This species had by far the largest share of the landed value of any groundfish species (37 per cent, $58.9 million), and second highest portion of the landed value of any seafood species (five per cent). Furthermore, it represented the second highest share of the wholesale value of any groundfish species (23 per cent, $72.8 million).
ROCKFISHOf all groundfish species, rockfish represented the second largest share of harvest (13 per cent, 16,800 tonnes) and third largest share of landed value (15 per cent, $24.1 million) and wholesale value (17 per cent, $52.8 million). These species experienced a slight increase in wholesale value despite a moderate drop in landed value and very slight increase in harvest.
ARROWTOOTH FLOUNDERArrowtooth flounder skyrocketed in landed value (up 213 per cent to $10.0 million) and rose substantially in wholesale value (up 35 per cent to $19.9 million). Although this species experienced a moderate drop in harvest in 2017, it still had the third largest share of the harvest of any groundfish species (eight per cent, 10,100 tonnes).
Ground�sh Harvest (‘000 tonnes)
Ground�sh Landed Value ($ millions)
Ground�sh Wholesale Value ($ millions)
Pollock 3.4
Halibut 3.8Lingcod 1.3
Pacific Cod 0.9
Sablefish1.9
Skates 0.5Soles 3.1Other 0.1
ArrowtoothFlounder 10.1
Dogfish 0.1
Pollock $1.5Pacific Cod $1.0
Lingcod $8.8
Skates$0.9
Soles $4.8Other $0.4
ArrowtoothFlounder $10.0
Dogfish $0.1
Pacific Cod $5.1Pollock $8.4
Lingcod $10.7
Skates $0.8Soles $8.8
Dogfish $0.3
ArrowtoothFlounder $19.9
Other $14.7
Hake85.0Rock�sh
16.8
Sablefish$33.7
Halibut$58.9
Rockfish$24.1
Sablefish$29.3
Hake$19.3
Hake$80.4
Halibut$72.8
Rock�sh$52.8
10British Columbia Seafood Industry Year in Review 2017
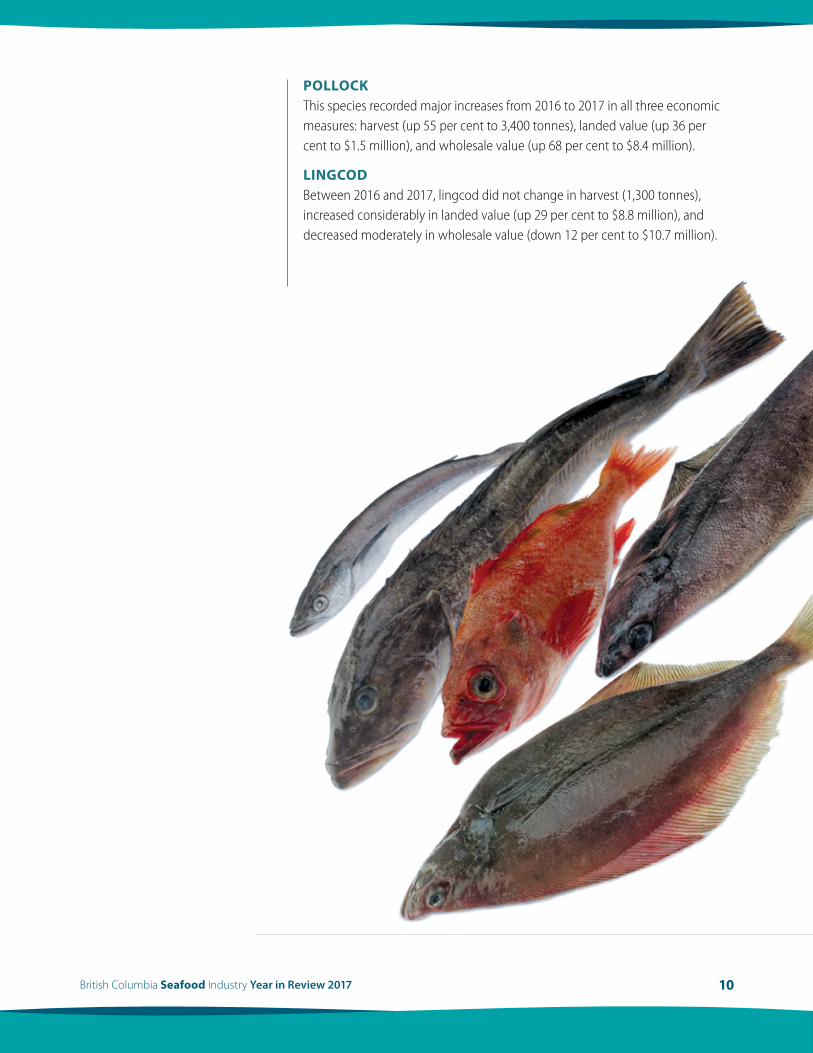
POLLOCKThis species recorded major increases from 2016 to 2017 in all three economic measures: harvest (up 55 per cent to 3,400 tonnes), landed value (up 36 per cent to $1.5 million), and wholesale value (up 68 per cent to $8.4 million).
LINGCODBetween 2016 and 2017, lingcod did not change in harvest (1,300 tonnes), increased considerably in landed value (up 29 per cent to $8.8 million), and decreased moderately in wholesale value (down 12 per cent to $10.7 million).
FarmedMussels& Other
7.7
Crabs3.8
Red SeaUrchins
2.9
Sea Cucumbers1.7
Green SeaUrchins 0.21
WildScallops 0.01
Wild Geoducks 1.4
Shrimp0.3
Prawns 1.1
Farmed Geoducks& Other Clams 1.1
Other Wild 0.2
Farmed Geoducks& Other Clams $6.2
Other Wild $0.8
WildClams 0.5
Farmed Oysters 0.3
Farmed Oysters $1.7
Wild Clams$1.8
Farmed Geoducks& Other Clams $13.7
Other Wild $9.6
Farmed Mussels& Other $28.5
Wild Clams$8.0
WildScallops $0.1
Wild Scallops$2.5
Sea Cucumbers$8.7
Sea Cucumbers$12.1
Red Sea Urchins $6.5Green Sea Urchins $1.0
Shrimp $1.6
Red SeaUrchins $15.7
Green SeaUrchins $2.1
Shrimp $5.7
Farmed Mussels & Other $13.9
Farmed Oysters$19.7
Shell�sh Harvest (‘000 tonnes)
Shell�sh Wholesale Value ($ millions)
Shell�sh Landed Value ($ millions)
Wild Geoducks
$50.2
Crabs$51.1
Prawns$29.5
Crabs$87.8 Prawns
$44.1
WildGeoducks
$51.2
11British Columbia Seafood Industry Year in Review 2017
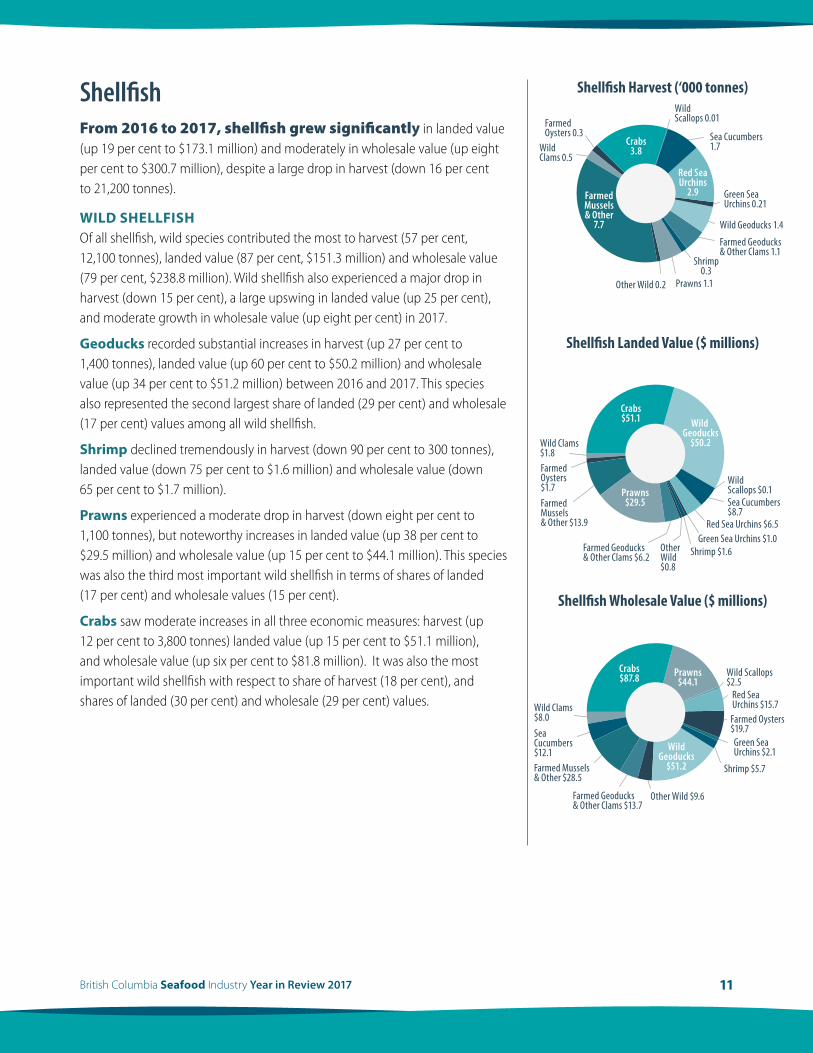
ShellfishFrom 2016 to 2017, shellfish grew significantly in landed value (up 19 per cent to $173.1 million) and moderately in wholesale value (up eight per cent to $300.7 million), despite a large drop in harvest (down 16 per cent to 21,200 tonnes).
WILD SHELLFISHOf all shellfish, wild species contributed the most to harvest (57 per cent, 12,100 tonnes), landed value (87 per cent, $151.3 million) and wholesale value (79 per cent, $238.8 million). Wild shellfish also experienced a major drop in harvest (down 15 per cent), a large upswing in landed value (up 25 per cent), and moderate growth in wholesale value (up eight per cent) in 2017.
Geoducks recorded substantial increases in harvest (up 27 per cent to 1,400 tonnes), landed value (up 60 per cent to $50.2 million) and wholesale value (up 34 per cent to $51.2 million) between 2016 and 2017. This species also represented the second largest share of landed (29 per cent) and wholesale (17 per cent) values among all wild shellfish.
Shrimp declined tremendously in harvest (down 90 per cent to 300 tonnes), landed value (down 75 per cent to $1.6 million) and wholesale value (down 65 per cent to $1.7 million).
Prawns experienced a moderate drop in harvest (down eight per cent to 1,100 tonnes), but noteworthy increases in landed value (up 38 per cent to $29.5 million) and wholesale value (up 15 per cent to $44.1 million). This species was also the third most important wild shellfish in terms of shares of landed (17 per cent) and wholesale values (15 per cent).
Crabs saw moderate increases in all three economic measures: harvest (up 12 per cent to 3,800 tonnes) landed value (up 15 per cent to $51.1 million), and wholesale value (up six per cent to $81.8 million). It was also the most important wild shellfish with respect to share of harvest (18 per cent), and shares of landed (30 per cent) and wholesale (29 per cent) values.
12British Columbia Seafood Industry Year in Review 2017
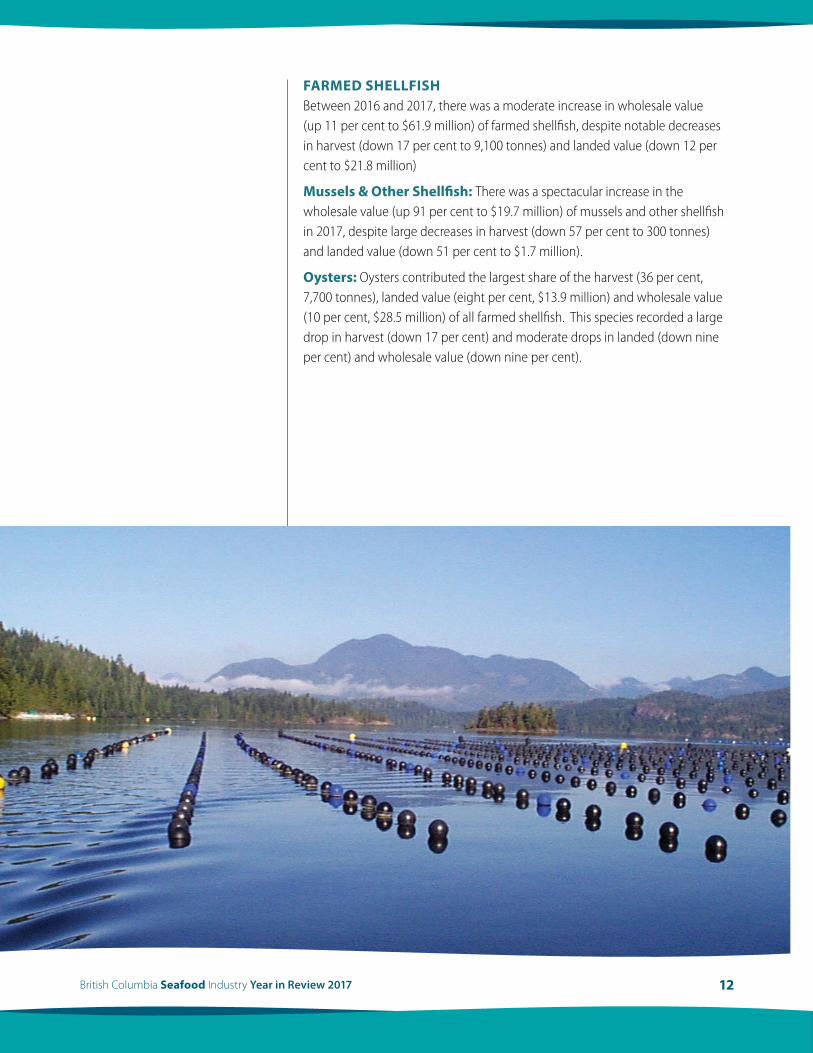
FARMED SHELLFISHBetween 2016 and 2017, there was a moderate increase in wholesale value (up 11 per cent to $61.9 million) of farmed shellfish, despite notable decreases in harvest (down 17 per cent to 9,100 tonnes) and landed value (down 12 per cent to $21.8 million)
Mussels & Other Shellfish: There was a spectacular increase in the wholesale value (up 91 per cent to $19.7 million) of mussels and other shellfish in 2017, despite large decreases in harvest (down 57 per cent to 300 tonnes) and landed value (down 51 per cent to $1.7 million).
Oysters: Oysters contributed the largest share of the harvest (36 per cent, 7,700 tonnes), landed value (eight per cent, $13.9 million) and wholesale value (10 per cent, $28.5 million) of all farmed shellfish. This species recorded a large drop in harvest (down 17 per cent) and moderate drops in landed (down nine per cent) and wholesale value (down nine per cent).
13British Columbia Seafood Industry Year in Review 2017
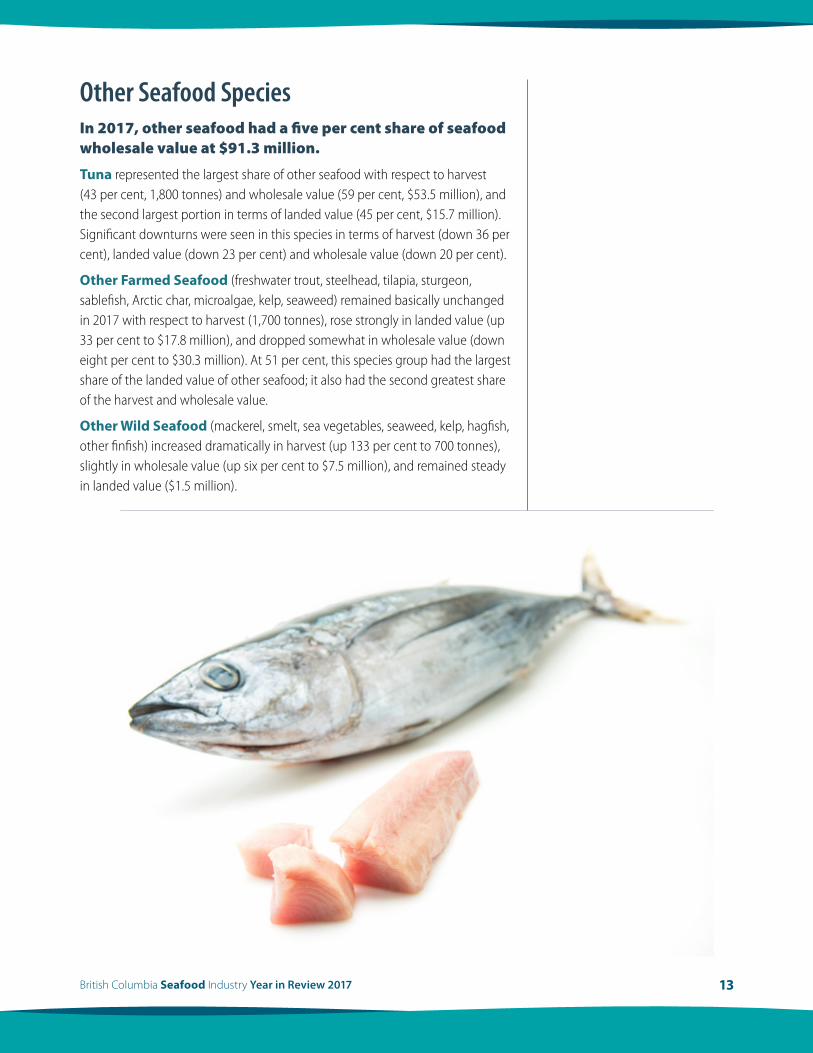
Other Seafood SpeciesIn 2017, other seafood had a five per cent share of seafood wholesale value at $91.3 million.
Tuna represented the largest share of other seafood with respect to harvest (43 per cent, 1,800 tonnes) and wholesale value (59 per cent, $53.5 million), and the second largest portion in terms of landed value (45 per cent, $15.7 million). Significant downturns were seen in this species in terms of harvest (down 36 per cent), landed value (down 23 per cent) and wholesale value (down 20 per cent).
Other Farmed Seafood (freshwater trout, steelhead, tilapia, sturgeon, sablefish, Arctic char, microalgae, kelp, seaweed) remained basically unchanged in 2017 with respect to harvest (1,700 tonnes), rose strongly in landed value (up 33 per cent to $17.8 million), and dropped somewhat in wholesale value (down eight per cent to $30.3 million). At 51 per cent, this species group had the largest share of the landed value of other seafood; it also had the second greatest share of the harvest and wholesale value.
Other Wild Seafood (mackerel, smelt, sea vegetables, seaweed, kelp, hagfish, other finfish) increased dramatically in harvest (up 133 per cent to 700 tonnes), slightly in wholesale value (up six per cent to $7.5 million), and remained steady in landed value ($1.5 million).
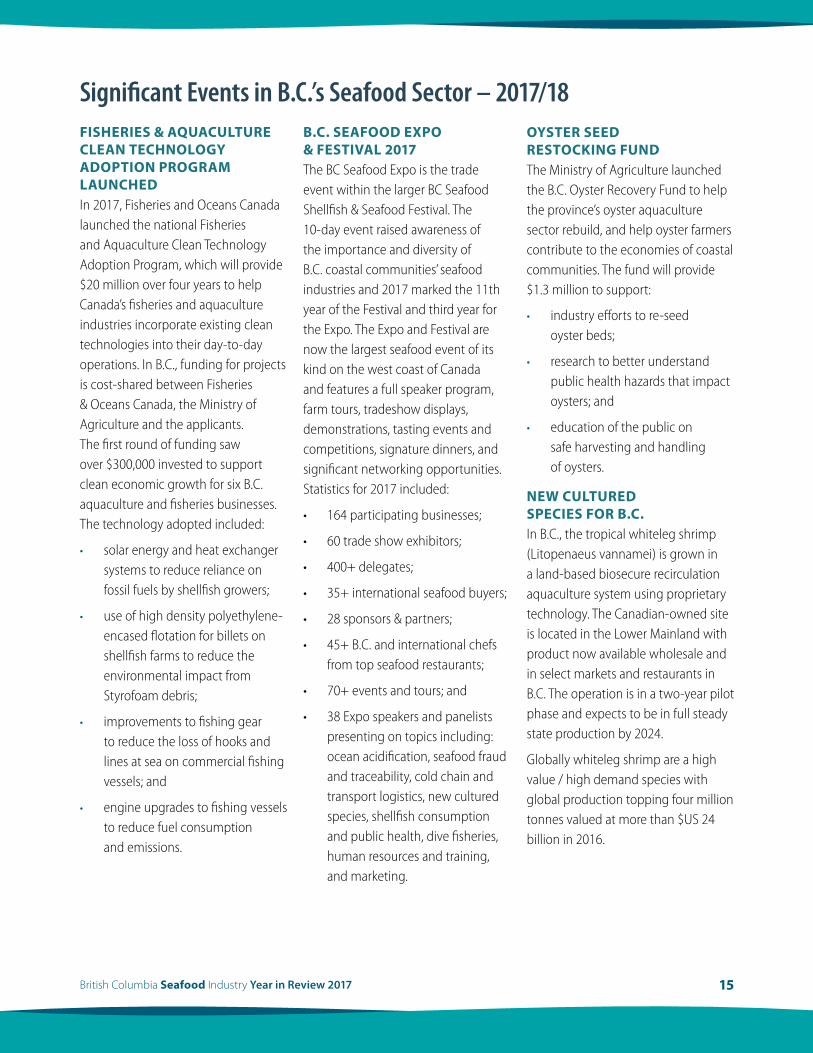
B.C. Seafood Exports ($ Millions)
Tuna 25.3
Geoduck Clams 57.1
Halibut 39.1
Chum 33.4
Herring 55.3
Shrimp & Prawns 36.9
Hake 72.0
Chinook 49.5 Other276.3
Crabs130.9
AtlanticSalmon
512.3
USA
China
Japan
Hong Kong
Ukraine
Farmed Salmon
Groundfish Herring/Pelagics
Shellfish WildSalmon
Other Products
14British Columbia Seafood Industry Year in Review 2017
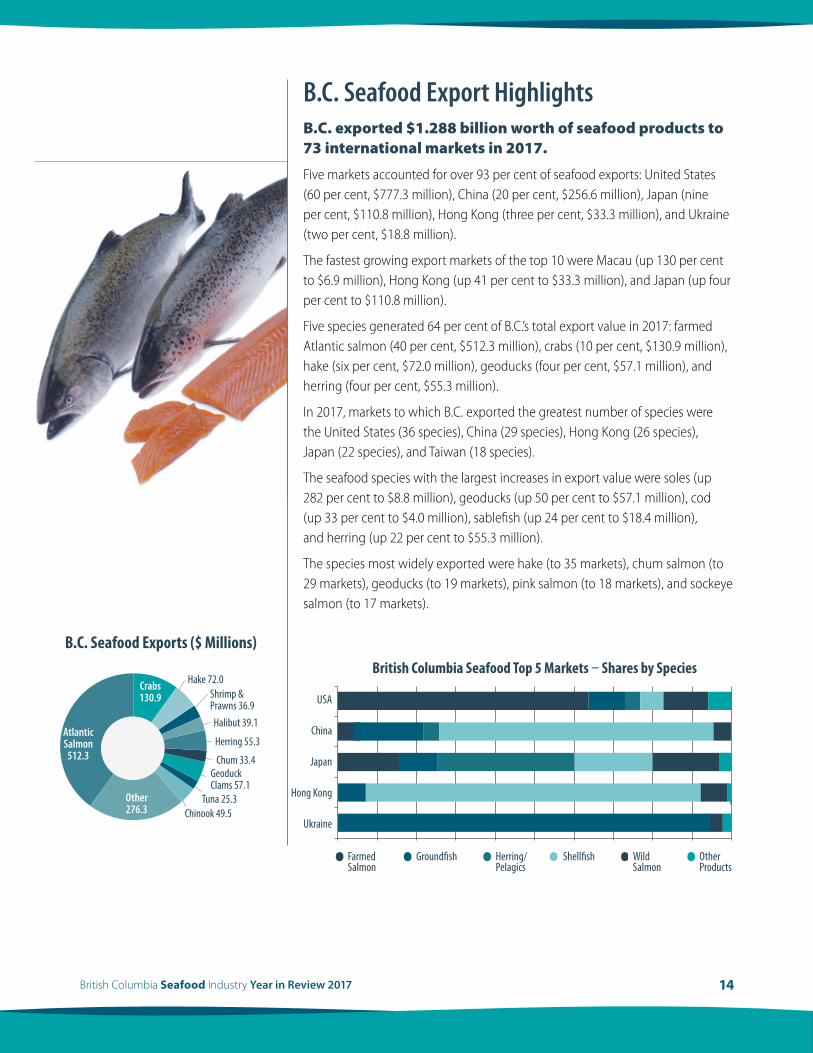
B.C. Seafood Export HighlightsB.C. exported $1.288 billion worth of seafood products to 73 international markets in 2017.
Five markets accounted for over 93 per cent of seafood exports: United States (60 per cent, $777.3 million), China (20 per cent, $256.6 million), Japan (nine per cent, $110.8 million), Hong Kong (three per cent, $33.3 million), and Ukraine (two per cent, $18.8 million).
The fastest growing export markets of the top 10 were Macau (up 130 per cent to $6.9 million), Hong Kong (up 41 per cent to $33.3 million), and Japan (up four per cent to $110.8 million).
Five species generated 64 per cent of B.C.’s total export value in 2017: farmed Atlantic salmon (40 per cent, $512.3 million), crabs (10 per cent, $130.9 million), hake (six per cent, $72.0 million), geoducks (four per cent, $57.1 million), and herring (four per cent, $55.3 million).
In 2017, markets to which B.C. exported the greatest number of species were the United States (36 species), China (29 species), Hong Kong (26 species), Japan (22 species), and Taiwan (18 species).
The seafood species with the largest increases in export value were soles (up 282 per cent to $8.8 million), geoducks (up 50 per cent to $57.1 million), cod (up 33 per cent to $4.0 million), sablefish (up 24 per cent to $18.4 million), and herring (up 22 per cent to $55.3 million).
The species most widely exported were hake (to 35 markets), chum salmon (to 29 markets), geoducks (to 19 markets), pink salmon (to 18 markets), and sockeye salmon (to 17 markets).
15British Columbia Seafood Industry Year in Review 2017
Significant Events in B.C.’s Seafood Sector – 2017/18FISHERIES & AQUACULTURE CLEAN TECHNOLOGY ADOPTION PROGRAM LAUNCHEDIn 2017, Fisheries and Oceans Canada launched the national Fisheries and Aquaculture Clean Technology Adoption Program, which will provide $20 million over four years to help Canada’s fisheries and aquaculture industries incorporate existing clean technologies into their day-to-day operations. In B.C., funding for projects is cost-shared between Fisheries & Oceans Canada, the Ministry of Agriculture and the applicants. The first round of funding saw over $300,000 invested to support clean economic growth for six B.C. aquaculture and fisheries businesses. The technology adopted included:
• solar energy and heat exchanger systems to reduce reliance on fossil fuels by shellfish growers;
• use of high density polyethylene-encased flotation for billets on shellfish farms to reduce the environmental impact from Styrofoam debris;
• improvements to fishing gear to reduce the loss of hooks and lines at sea on commercial fishing vessels; and
• engine upgrades to fishing vessels to reduce fuel consumption and emissions.
B.C. SEAFOOD EXPO & FESTIVAL 2017The BC Seafood Expo is the trade event within the larger BC Seafood Shellfish & Seafood Festival. The 10-day event raised awareness of the importance and diversity of B.C. coastal communities’ seafood industries and 2017 marked the 11th year of the Festival and third year for the Expo. The Expo and Festival are now the largest seafood event of its kind on the west coast of Canada and features a full speaker program, farm tours, tradeshow displays, demonstrations, tasting events and competitions, signature dinners, and significant networking opportunities. Statistics for 2017 included:
• 164 participating businesses;
• 60 trade show exhibitors;
• 400+ delegates;
• 35+ international seafood buyers;
• 28 sponsors & partners;
• 45+ B.C. and international chefs from top seafood restaurants;
• 70+ events and tours; and
• 38 Expo speakers and panelists presenting on topics including: ocean acidification, seafood fraud and traceability, cold chain and transport logistics, new cultured species, shellfish consumption and public health, dive fisheries, human resources and training, and marketing.
OYSTER SEED RESTOCKING FUNDThe Ministry of Agriculture launched the B.C. Oyster Recovery Fund to help the province’s oyster aquaculture sector rebuild, and help oyster farmers contribute to the economies of coastal communities. The fund will provide $1.3 million to support:
• industry efforts to re-seed oyster beds;
• research to better understand public health hazards that impact oysters; and
• education of the public on safe harvesting and handling of oysters.
NEW CULTURED SPECIES FOR B.C.In B.C., the tropical whiteleg shrimp (Litopenaeus vannamei) is grown in a land-based biosecure recirculation aquaculture system using proprietary technology. The Canadian-owned site is located in the Lower Mainland with product now available wholesale and in select markets and restaurants in B.C. The operation is in a two-year pilot phase and expects to be in full steady state production by 2024.
Globally whiteleg shrimp are a high value / high demand species with global production topping four million tonnes valued at more than $US 24 billion in 2016.
16British Columbia Seafood Industry Year in Review 2017
INTERNATIONAL FISHERIES TREATIES & AGREEMENTSCanada participates in international fisheries treaties and agreements to conserve and effectively manage fisheries stocks. The status of Pacific region treaties important to British Columbia seafood:
Salmon: Renegotiations of expiring Chapters under the Canada-US Pacific Salmon Treaty are underway and due to be completed by the end of 2018.
Halibut: At the Pacific Halibut Commission annual meeting in Portland, Oregon, renegotiations of the 2018 catch limits were not successful. Canada and the U.S. set their own total allowable catches (TAC) separately. The 2018 TAC for British Columbia is 3,220 tonnes, a 15% decrease over 2017.
Hake: Due to consistency in stock biomass, the Hake Joint Management Committee allowed a coast-wide 2018 TAC of 156,067 tonnes, the same amount allowed in 2017.
Tuna: Under the Canada-US Pacific Albacore Tuna Treaty, fishing arrangements and reciprocal access provisions, including a three-year term, were agreed on in early 2017 and continue through 2018.
SUSTAINABLE SEAFOODCommercial Fisheries: In 2017, the British Columbia chum, pink and sockeye fisheries were recertified by the Marine Stewardship Council (MSC) as sustainable. The following six B.C. species comprising 11 fisheries hold MSC certification: albacore tuna, hake, halibut, and the three salmon species mentioned above.
Learn more: Marine Stewardship Council: https://fisheries.msc.org/en/fisheries/
Aquaculture: B.C. aquaculture companies achieved a total of 12 and seven Aquaculture Stewardship Council (ASC) certifications in 2017 and 2018, respectively. All certifications were for Atlantic salmon. B.C. salmon farmers raising Atlantic salmon are committed to achieving ASC certification for all their farms by 2020. At present, there are 26 and 213 ASC-certified Atlantic salmon farms in B.C. and the world, respectively.
Learn more: Aquaculture Stewardship Council: http://asc.force.com/Certificates B.C. WILD SALMON STRATEGY
The B.C. government began developing proposals for a made-in-B.C. wild salmon strategy in summer 2018, supported by the advice and guidance of the Wild Salmon Advisory Council. The Province is scheduled to submit its recommendations to the legislative assembly’s Select Standing Committee on Agriculture, Fish, and Food in fall 2018. The recommendations will support a public consultation process to examine the health, habitat, and management of wild salmon and the sustainability of the wild salmon industry in British Columbia. The process will inform the development of a wild salmon strategy for B.C.
Learn more: https://news.gov.bc.ca/releases/2018PREM0045-001204
17British Columbia Seafood Industry Year in Review 2017
Data Sources and Contact InformationDATA SOURCES• Aquaculture industry harvests and farm gate values, and wild commercial fisheries harvests and values are adapted
from data compiled each May by Fisheries & Oceans Canada, Pacific Region.
• Wholesale values are compiled by the Ministry of Agriculture. Note that these are estimates, and that estimates for recent years are subject to revision.
• Export data are sourced from Statistics Canada and Global Trade Atlas.
CONTACT INFORMATIONFor more information on B.C. agrifood and seafood, please contact:
AgriService B.C. Telephone: 1-888-221-7141 Email: [email protected]
For more information on the Province of British Columbia, please visit: http://www2.gov.bc.ca/gov/content/home
This report is available online at: http://www2.gov.bc.ca/gov/content/industry/agriculture-seafood/statistics/industry-and-sector-profiles
January 2019
![· Indonesia Italy a British Columbia C] Discovery B.C. C] Challenge B.C. C] Showcase B.C. Northwest Territories Nova Scotia Ontario Prince Edward Island Quebec Saskatchewan Yukon](https://img.dokumen.tips/doc/110x75/5d4fd86c88c993110c8bc632/-indonesia-italy-a-british-columbia-c-discovery-bc-c-challenge-bc-c-showcase.jpg)