Embed Size (px)
Citation preview

Bringing Simulation to Application
Peter Warren
Published by FaberMaunsell Ltd on behalf of the International Energy Agency Energy Conservation in Buildings and Community Systems Programme

Bringing Simulation to Application
ii
About the Author Peter Warren is an independent consultant. For most of his professional life he worked at the Building Research Establishment, UK, involved with research in the fields of ventilation, indoor air quality, energy conservation and fire. He is a visiting professor at the University of Ulster. © Copyright FaberMaunsell Ltd 2002 All property rights, including copyright, are vested in the ECBCS ExCo Support Services Unit - ESSU (FaberMaunsell Ltd) on behalf of the International Energy Agency Energy Conservation in Buildings and Community Systems Programme. In particular, no part of this publication may be reproduced, stored in a retrieval system or transmitted in any form or by any means, electronic, mechanical, photocopying, recording or otherwise, without the prior written permission of FaberMaunsell Ltd. Published by FaberMaunsell Ltd, Marlborough House, Upper Marlborough Rd, St Albans, Hertfordshire, AL1 3UT, United Kingdom Document A30-TSR-09-2002 ISBN 0-9542670-2-8 Participating countries in ECBCS: Australia, Belgium, CEC, Canada, Czech Republic, Denmark, Finland, Germany, Greece, Israel, Italy, Japan, the Netherlands, New Zealand, Norway, Poland, Portugal, Sweden, Switzerland, Turkey, United Kingdom and the United States of America. Additional copies of this report may be obtained from: ECBCS Bookshop C/o FaberMaunsell Ltd 94/96 Newhall Street Birmingham B3 1PB United Kingdom

Energy Conservation in Buildings and Community Systems
iii
Preface International Energy Agency
The International Energy Agency (IEA) was established in 1974 within the framework of the Organisation for Economic Co-operation and Development (OECD) to implement an international energy program. A basic aim of the IEA is to foster co-operation among the twenty four IEA participating countries and to increase energy security through energy conservation, development of alternative energy sources and energy research, development and demonstration (RD&D).
Energy Conservation in Buildings and Community Systems
The IEA sponsors research and development in a number of areas related to energy. The mission of one of those areas, the ECBCS - Energy Conservation for Building and Community Systems Programme, is to facilitate and accelerate the introduction of energy conservation, and environmentally sustainable technologies into healthy buildings and community systems, through innovation and research in decision-making, building assemblies and systems, and commercialisation. The objectives of collaborative work within the ECBCS R&D program are directly derived from the on-going energy and environmental challenges facing IEA countries in the area of construction, energy market and research. ECBCS addresses major challenges and takes advantage of opportunities in the following areas:
• exploitation of innovation and information technology; • impact of energy measures on indoor health and usability; • integration of building energy measures and tools to changes in lifestyles, work
environment alternatives, and business environment.
The Executive Committee Overall control of the program is maintained by an Executive Committee, which not only monitors existing projects but also identifies new areas where collaborative effort may be beneficial. To date the following projects have been initiated by the executive committee on energy conservation in buildings and community systems (completed projects are identified by (*) ):
Annex 1: Load Energy Determination of Buildings (*) Annex 2: Ekistics and Advanced Community Energy Systems (*) Annex 3: Energy Conservation in Residential Buildings (*) Annex 4: Glasgow Commercial Building Monitoring (*) Annex 5: Air Infiltration and Ventilation Centre Annex 6: Energy Systems and Design of Communities (*) Annex 7: Local Government Energy Planning (*) Annex 8: Inhabitants Behaviour with Regard to Ventilation (*) Annex 9: Minimum Ventilation Rates (*) Annex 10: Building HVAC System Simulation (*) Annex 11: Energy Auditing (*) Annex 12: Windows and Fenestration (*) Annex 13: Energy Management in Hospitals (*) Annex 14: Condensation and Energy (*) Annex 15: Energy Efficiency in Schools (*)

Bringing Simulation to Application
iv
Annex 16: BEMS 1- User Interfaces and System Integration (*) Annex 17: BEMS 2- Evaluation and Emulation Techniques (*) Annex 18: Demand Controlled Ventilation Systems (*) Annex 19: Low Slope Roof Systems (*) Annex 20: Air Flow Patterns Within Buildings (*) Annex 21: Thermal Modelling (*) Annex 22: Energy Efficient Communities (*) Annex 23: Multi Zone Air Flow Modelling (COMIS) (*) Annex 24: Heat, Air and Moisture Transfer in Envelopes (*) Annex 25: Real Time HEVAC Simulation (*) Annex 26: Energy Efficient Ventilation of Large Enclosures (*) Annex 27: Evaluation and Demonstration of Domestic Ventilation Systems (*) Annex 28: Low Energy Cooling Systems (*) Annex 29: Daylight in Buildings (*) Annex 30: Bringing Simulation to Application (*) Annex 31: Energy Related Environmental Impact of Buildings Annex 32: Integral Building Envelope Performance Assessment (*) Annex 33: Advanced Local Energy Planning (*) Annex 34: Computer-aided Evaluation of HVAC System Performance (*) Annex 35: Design of Energy Efficient Hybrid Ventilation (HYBVENT) (*) Annex 36: Retrofitting of Educational Buildings Annex 37: Low Exergy Systems for Heating and Cooling of Buildings Annex 38: Solar Sustainable Housing Annex 39: High Performance Insulation Systems Annex 40: Building Commissioning to Improve Energy Performance (*) - Completed Annexes This summary report concentrates on Annex 30: Bringing Simulation to Application. Summary This annex attempts to ‘bridge the gap’ between simulation for its own sake and simulation as a tool to improve the performance of buildings. The aim of the annex is to promote the use of simulation at all stages of the building life cycle, with particular focus on those aspects which impact upon energy use and the thermal performance of the building and its services. The annex has examined an ideal design process in terms of where simulation can realistically contribute. Seven key stages have been identified: Conceptual design, Preliminary design, Detailed design, Tender evaluation, Construction and commissioning, Operation and maintenance and Renovation. Within each design stage a number of areas are outlined where simulation may be applicable, for example evaluating day and electrical lighting, indoor air flows and visualisation of typical rooms. Each section also outlines the level of input and output data possible for each stage of the design process. Unfamiliarity or poor guidance are often typical barriers to the use of simulation models. To address this the annex examines models that have been used before in extensive research programs, for example TRNSYS, ESP-r and BLAST. With energy conservation being the prime initiative the main area of interest for simulation is the thermal response of the building and the performance of HVAC systems. Models can therefore be divided into three broad types: Building thermal models, Primary equipment models, and Secondary equipment models

Energy Conservation in Buildings and Community Systems
v
The main elements of these models are examined by the annex and then qualified in terms of model documentation, parameter identification, example of use, certification and validation and implementation, to improve confidence in the models. Also examined are the information management aspects of the differing models, including levels of input data and output data required for different model types, these have in more recent times become more important in terms of time than the actual computation of the results. The annex has attempted to streamline and improve this process, by identifying improved methods of handling the necessary data. Examples include the use if datasheets, checklists and diagrams. The annex then examines how data can be best prepared to enable continuous exchange throughout the design process, for example, via the integration of CAD programs with design tools and the establishment of an open and internationally recognised standardised data exchange format. Finally five case studies are presented to illustrate the ability of simulation to assist the designer at all stages of the design process and to identify opportunities for improving the usability of simulation techniques.

Bringing Simulation to Application
vi

Energy Conservation in Buildings and Community Systems
vii
Contents
Preface iii
International Energy Agency iii
Energy Conservation in Buildings and Community Systems iii
The Executive Committee iii
Summary iv
1 Introduction 1
1.1 Background 1
1.2 Obstacles to the use of simulation 1
1.3 The objectives of Annex 30 2
2 Design Process Analysis 3
2.1 Introduction 3
2.2 Conceptual design 4
2.3 Preliminary design 5
2.4 Detailed design 6
2.5 Tender evaluation 7
2.6 Construction and commissioning 8
2.7 Operation and maintenance 9
2.8 Renovation 9
3 Model Qualification 11
3.1 Introduction 11
3.2 Available models 11
3.3 Building models 12 3.3.1 Thermal models 12 3.3.2 Air flow models 13 3.3.3 Coupled air flow and thermal models 13
3.4 HVAC component models 14
3.5 Model qualification procedure 15 3.5.1 Introduction 15 3.5.2 Model documentation 15 3.5.3 Parameter identification 16 3.5.4 Examples of use 16 3.5.5 Verification and validation 16 3.5.6 Implementation 16
3.6 Discussion 16
4 Information Management 18
4.1 Introduction 19

Bringing Simulation to Application
viii
4.2 Data required for simulation 19
4.3 Data preparation 19 4.3.1 Overview of relevant data 19 4.3.2 Production of checklists 21
4.4 User interfaces - input data 21 4.4.1 Introduction 21 4.4.2 Building geometry 21 4.4.3 Schedules and other data 23 4.4.4 Data storage 23
4.5 User interface - output data 24 4.5.1 Introduction 24 4.5.2 Simple diagrams 24 4.5.3 Datasheets 25 4.5.4 Brochure-like compilations of solutions for special problems 25
4.6 Conclusions 25
5 Data Exchange 26
5.1 Introduction 26
5.2 Approaches to integrated data exchange 26 5.2.1 Introduction 26 5.2.2 RETEx 26 5.2.3 RIUSKA 28 5.2.4 COMBINE 29 5.2.5 The International Alliance for Interoperability 30
5.3 Conclusions 30
6 Conclusions 31
References 33
Appendix 1 Participating Organisations 35
Appendix 2 Principal Annex 30 Reports 37
Appendix 3 Case Studies 39
Case Study 1 – Design study for a 10 storey office building. 41
Case Study 2 – Retrofit to improve the envelope of a multi-storey residential building. 47
Case Study 3 – Preliminary design study for the natural cooling of an office building. 51
Case Study 4 - Commissioning, Management and Retrofit of an office building/conference 57
Case Study 5 – Study to improve the management of the HVAC plant supplying an existing building. 63

Energy Conservation in Buildings and Community Systems
1
1 Introduction 1.1 Background The design of buildings is a complex process. The ability to simulate the future performance of a building, or specific components, at the various stages of this process provides the designer with the ability to review a range of options, to identify potential problems and to balance competing requirements. Simulation of performance necessarily involves the use of models. These are usually mathematically based, although physical models are sometimes used (for instance, wind tunnel studies) and relate the physical performance of a component or aspect of the building to externally imposed factors. Since the 1950's many such models have resulted from the greater understanding of building physics provided by research. Together with parallel improvements in speed and capacity of computers, these models now provide the means for sophisticated simulation of the performance of buildings. In particular, many of the Annexes under the IEA Energy Conservation in Buildings and Community Systems Programme, have involved work to develop or underpin models and several, notably Annex 10 'Building HVAC Simulation' and Annex 17 'BEMS - 2: Evaluation and Emulation Techniques' have been specifically concerned with simulation. However, despite the availability of simulation tools and attempts to make these 'user-friendly' their use in both building and HVAC design remains limited. This results in decisions at all stages of the design process being made without the substantial benefits that a correct simulation can provide resulting, at best, in a less than optimal design and, at worst, in major failures in performance. 1.2 Obstacles to the use of simulation Possible obstacles to the use of simulation can be classified under two headings - technical and non-technical: Technical obstacles
• Difficulties with the conversion of data (such as product information, geometrical descriptions, experimental results) into a suitable form for input into a model.
• Difficulty in obtaining all of the required models for a simulation and ensuring that they are compatible.
• Problems in setting up a simulation due to the large number of individual components involved and the complexity of their interactions.
• Poor documentation, leading to uncertainty in the use of models. • Lack of quality assurance procedures for simulation programs.

Bringing Simulation to Application
2
Non-technical obstacles • Limitations on time and money available for particular stages of the design
process. • Lack of time for design engineers to become familiar with simulation tools. • Fragmentation of the design process. • Lack of information on the availability of simulation tools. • Inadequate education of the end-user concerning the benefits of simulation. • Differences in the use of terminology by the developers of simulation tools
and their potential users. 1.3 The objectives of Annex 30 Annex 30 was set up with the aim of promoting the use of simulation at all stages of the Building Life Cycle, with particular focus on those aspects which impact upon energy use - the thermal performance of the building and its services. After preliminary meetings between the principal collaborators it was agreed that the work over a three year period from October 1995 to October 1998 would be carried out under four separate, but closely related sub-tasks:
• Design process analysis • Model qualification • Information management • Data exchange
In order to illustrate issues and to provide a practical basis for the work, five case studies were undertaken, chosen to cover a wide range of design problems and simulation applications. These are listed below and a brief description of each is contained in Appendix 3. Case Study 1: Design study for a 10-storey office building. Case Study 2: Retrofit to improve the envelope of a multi-storey residential building. Case Study 3: Preliminary design study for the natural cooling of an office building. Case Study 4: Commissioning, management and retrofits of an office building/conference facility. Case Study 5: Study to improve the management of the HVAC plant supplying an existing building. Full details of each case study are given in the reports listed in Appendix 2.

Energy Conservation in Buildings and Community Systems
3
2 Design Process Analysis 2.1 Introduction In order to examine the benefits of simulation and to identify further developments it is helpful to analyse the decision-making process associated with a construction project and separate out key elements. The logical progression of design, decision-making and information flow are similar in most countries, although there may be differences in design procedures, fields of professional responsibility and the way that construction is carried out. It is, therefore, possible to describe an idealised design process that can serve as a basis for discussion of the application of simulation, as shown in Figure [2.1]. In practice, in any actual project the process is not so simple and there will be the need for revision and redesign to deal with changes in requirement or unexpected problems.
Figure 2.1 Schematic diagram of the idealised building design process The description in Figure 2.1 covers the whole building life-cycle, including not only design and construction but also commissioning, operation, maintenance and renovation. Such an analysis focuses the need for simulation to take account of the type of input data required at each stage, the required accuracy of calculations, the objectives set for output, the need for visualisation and the resources and time-scales likely to be available. In the following sections each of the principal components of the design process is discussed in turn and possible types of simulation which can contribute are identified, together with required input and output data. Examples of the use of simulation at each stage of the design process are contained in the Case Studies summarised in Appendix 3, as indicated in Table 2.1

Bringing Simulation to Application
4
Table 2.1 Examples of simulation at particular design stages included in the Case Studies (Appendix 3)
Design stage Case Study
1 2 3 4 5 Conceptual design
Preliminary design
Detailed design
Tender evaluation
Construction and commissioning
Operation and maintenance
Renovation
2.2 Conceptual design Objectives At the conceptual design stage, only broad requirements and design restrictions are generally known. The requirement is to examine a range of alternative strategies and to identify the effect of these on key issues such as:
• achieving the required indoor environment; • investment and life-cycle costs; • energy consumption, and • space requirements for HVAC systems.
Potential problem areas and their solutions need to be identified. Simulation Typical simulations at this stage are:
• investigation of the impact of orientation of the building and façades on energy economy and life-cycle costs;
• evaluation of thermal conditions in critical spaces and associated heating and cooling requirements;
• evaluation of architectural concepts involving alternative methods of energy savings;
• daylighting and electrical lighting; • air flows in open areas of office and commercial buildings; • natural ventilation air flows in large buildings, and • airflows in industrial premises and other premises with high internal heat
loads.

Energy Conservation in Buildings and Community Systems
5
Input data Information available at this stage is usually sparse and may only comprise a plan of the building, indicating the general use and dimensions of the principal spaces, together with schematic architectural drawings, giving rough information on building envelope, orientation of windows etc. It will often be necessary to make assumptions on factors such as heat loads, usage times etc. and, in consequence, to use default values. Output data The particular value of the output from simulation at this stage is to allow the architect to balance alternative approaches and to examine the sensitivity of key criteria to any choices that may need to be made. Output should preferably be presented in a concise and clear-cut way, with a visual format preferred to numerical tabulation. 2.3 Preliminary design Objectives At this stage the HVAC designer specifies the technical solutions that fulfil the indoor air quality and cost targets of the project. The main HVAC zones are specified, the central plant (heating, cooling, air-conditioning etc.) is dimensioned and the main routes for ductwork and piping are designed. The architect expects the HVAC designer to provide detailed information on plant spaces, ceiling voids, the placement of central equipment, ducts and pipes, and so on. The solar protection of windows, the room devices for ventilation and so on, are also compared and specified jointly by the architect and the HVAC designer. The preliminary design of the HVAC systems is based on the architect's preliminary design drawings, resulting from the conceptual design stage. It is schematic but includes more precise information concerning the building envelope, façades, structures, internal layout, etc. The objective of any simulation is to analyse alternative design solutions and select one for use at the detailed design stage. The space requirements of the HVAC systems will also be determined. Simulation Typical preliminary design tasks in which simulation may be employed are:
• computation and visualisation of typical rooms and special spaces; • computation of the cooling requirements of systems and rooms; • comparison of window solar protection alternatives for the typical and special
spaces; • comparison of HVAC system alternatives; • analysis of the zoning of HVAC systems; • sizing of the central HVAC plant; • daylighting and electrical lighting design; • air infiltration; • achievement of satisfactory indoor climate, including indoor air quality.

Bringing Simulation to Application
6
Input data The following are examples of the available data that can be used in simulations:
• the architect's preliminary drawings; • structural types; • the architect's data on alternative window and protection solutions; • indoor air quality requirements of different spaces; • estimate usage times for the spaces, equipment, lighting and HVAC systems; • internal heat loads in the rooms (equipment, people, lighting); • possible HVAC system alternatives .
Output data It is important to present the simulation output for the architects and developers in a simple way for use in their decision-making. Designers favour results that are readable and well documented, and would prefer it if only those computational results that are important for the design work are documented. 2.4 Detailed design Objectives The detailed design is based on the architect's drawings, which have been finalised as a result of the preliminary design. In conventional forms of contracting, the detailed design is the basis for a call for tenders and the selection of contractors. Normally products are not specified in the detailed design, only the technical requirements. The process may differ in other construction cultures and methods of implementation. During the detailed design phase, the bulk of the design work is carried out. In large projects the HVAC design team consists of many specialists who work simultaneously. The design work should progress as straightforwardly as possible and in line with the previously agreed concepts so as to ensure that the work is performed efficiently. Alternatives should no longer be examined. At this stage, simulation serves as a sizing and computation tool for the designer. The software should be designer-friendly and its output should serve the needs of the design work. Larger-scale system simulations may also be performed when sizing special systems or demanding systems such as cooling plants. Simulation Typical detailed design tasks in which simulations are employed:
• detailed sizing of air handling and cooling equipment • detailed dimensioning of piping and ductwork • selection of room terminal devices • acoustic analysis of the ductwork • calibration and balancing of the piping and ductwork • simulation of control strategies

Energy Conservation in Buildings and Community Systems
7
• sizing of special systems • special evaluation of comfort
Input data Detailed information is available for use in simulation, including:
• detailed drawings by the architect, structural designer and specialist designers • detailed information on the HVAC systems and equipment • manufacturers' data on alternative products (today available also to some
extent in a digital format) Output data The output helps the designer to carry out detailed technical dimensioning. The same requirements may be set for the output as in the preliminary design. 2.5 Tender evaluation Objectives Final product selections are most commonly made on the basis of the technical requirements defined in the detailed design documentation. The most common practice in many countries is that contractors propose to the developer for the approval products that fulfil the requirements. Acting as the developer’s consultant, the designer ensures that they are appropriate, and on this basis the developer approves the contractors’ proposals. Contractors, too, can make use of simulation in the tendering stage by seeking alternative solutions that make it possible to reach an end result that is both optimal in term of cost and also fulfils the technical requirements. The practice in different countries varies somewhat in respect of the overall operational responsibility. Most often the developer and the designer - who is the developer’s consultant - have an overall responsibility for the design and performance specification. In a case where the contractors are responsible for the functionality of the HVAC systems (as in Germany), they examine the designer’s proposals and often make their own alternative proposals. Simulation is also used for this purpose. The trend in many countries is towards an increase in the efficiency and overall economy of mechanical systems and to increase the share of industrial manufacture. Accordingly, one operational model can be to arrange HVAC contract and subcontract tender competitions in such a way that the tenders address not only the first cost but also the life cycle costs. In order for the use of a model of this kind to become widespread, simulation tools are needed in order to compare the energy economy of the tenders. The use of simulation in comparing tenders is not very common today, though making the correct equipment selections can have a considerable impact on the life cycle costs and the achievement of system performance values as well as their controllability.

Bringing Simulation to Application
8
However there is presently increased interest for these simulations to become more common. Typical simulations Typical simulation tasks during the stage when tenders are compared can be:
• energy consumption comparisons of air handling unit alternatives (e.g. various face velocities of coils and filters, alternative fan curves, efficiencies, etc.)
• comparisons of the energy consumption of chillers • energy economy and performance value comparisons of the tenders for total
system or sub system deliveries Input data To carry out simulations, final design data and real product data are available Output data In evaluating tenders, attention should be paid to the documentation and clarity of format and principles of calculation, input data and results, particularly when the calculations involve direct economic and operational responsibilities. 2.6 Construction and commissioning Objectives In the construction and commissioning phase, various sizing and product selection programmes are used, including those for main equipment, piping, ductwork and terminal devices. The users of the programs are contractors, and to some extent designers. Large simulations are performed in the construction and commissioning phases only in special cases. Typical simulations Calculation tasks during the construction and commissioning phase may include:
• control and balancing calculations for the piping and ductwork; • noise damper calculations; • product selection; • control strategy.
Input data The information available for the simulations may include:
• final building and system data • product information • possible measurement values
Output data The outputs of the calculations or simulations are often part of the handed over documentation for the contract.

Energy Conservation in Buildings and Community Systems
9
2.7 Operation and maintenance Objectives At the end of a construction project, the target annual consumption of energy can be simulated for maintenance purposes. This is done using the real building performance data with the systems installed and the use of the spaces known. Although energy monitoring is a vital part of a number of computerised technical maintenance programs and most building automation systems, only rarely is the target consumption based on simulations using the real building and associated technical data. These figures would provide a more reliable basis for energy monitoring than the reference consumption for previous years, which are normally used. Certain technical maintenance systems also incorporate simple energy simulation programs that operational and maintenance personnel can use to make rough calculations of the effects of various operating and energy-saving tasks on annual energy consumption (changes in the operating times or room temperatures etc.). Simulations may also be carried out, for example, to investigate comfort problems. Simulation
• for energy monitoring purposes, a simulation of the annual energy consumption of the building and its monthly breakdown;
• simulations connected with comfort problem seeking ; • simulations connected with changes in the usage of rooms and zones; • simulations connected with operating problems of the systems; • control strategy simulations.
Input data Actual data on the building and its use are available for simulations. Output data As in the design phase. 2.8 Renovation Objectives Simulations may be used in designing renovations to buildings and systems in the same way as in the new construction projects. When changes are made to the usage of rooms or zones, simulations are often quite important, especially if the existing building places constraints on the installation of technical systems. Simulations may also be used to study the possibilities of renovation to improve indoor climate conditions and to estimate the resulting cost impact and feasibility. In addition, simulation provides an aid for estimating alternative energy conservation measures, either in connection with renovation or in carrying out condition assessments and energy surveys.

Bringing Simulation to Application
10
Simulations Typical simulation tasks that are connected with renovations include:
• simulation of the thermal conditions in individual rooms; • simulation connected with changes in zoning or systems; • simulation of energy consumption for the purposes of assessing the effects
such as an increase in heat recovery or an improvement in the thermal insulation of the building’s envelope or windows;
• simulations for studying air flows in existing buildings and ways of improving tightness to provide better energy economy;
• target consumption simulations of the energy situation of buildings after corrective actions have been taken.
Input data For the purpose of simulation, information is available on the existing building and its use as well as the renovation plans. Output data As in the design phase.

Energy Conservation in Buildings and Community Systems
11
3 Model Qualification 3.1 Introduction An essential feature of any simulation program is the ability to model 'real world' physical processes. Many such models have been introduced and developed in recent years covering a wide range of applications. While their limitations may be well understood by the scientists and specialists concerned with their development and incorporation in simulation packages, the practitioner often has little guidance on their use. This can often act as a barrier to employing simulation procedures due to lack of confidence or, perhaps worse, can lead to error due to incorrect application. A key element of the work of Annex 30 was to propose a 'qualification procedure' that would clearly define the characteristics of any model used for simulation purposes. A possible definition of a qualification procedure is - "a standardised quality assessment procedure that has to be passed by a model before its implementation in a given simulation program and that certifies the quality of a model for a given purpose." 3.2 Available models It was not possible within the limits of Annex 30 to review all of the many models that have been developed over the past 30 or more years. Instead, the most commonly used models were identified and surveyed, with an emphasis on those used within the Annex 30 participating countries. In most cases models are incorporated within larger simulation programs together with appropriate solvers and other features. The main sources of models identified in the course of Annex 30 were:
• TRNSYS • HVAC Sim+ • ASHRAE primary toolkit • ASHRAE secondary toolkit • ASHRAE dynamic models reference guide • IEA-ECBCS Annex 10 • IEA-ECBCS Annex 17 • ESP-r simulation program • BLAST simulation program
TRNSYS, developed by the University of Wisconsin, is typical of the large simulation programs. In addition to standard utility sub-routines, a large range of building and HVAC components are modelled and each of the individual models is allocated a 'Type' designation. Thus Type 35 is a window with external shading. These Type designations are increasingly used to describe models incorporated in other programs. In the context of energy conservation, the main interest is in simulating the thermal response of the building and the performance of HVAC systems, leading to the following broad division of types:

Bringing Simulation to Application
12
• Building thermal models, with an emphasis on those that can be readily coupled to HVAC system models.
• Primary equipment (central plant that converts fuel or electrical energy to heating or cooling effect.).
• Secondary equipment (components used in distributing the heating, cooling or ventilating medium to conditioned spaces)
The following sections deal with each of these in turn. 3.3 Building models
3.3.1 Thermal models
The early development of models was principally aimed at predicting the internal temperature conditions in the context of defining heating and cooling requirements. Interest was accelerated by the recognition of the need for the rational use of energy and related interest in solar energy. Annex 30 identified three general trends: (i) The development of programs for simulating the thermal behaviour of whole building structures, containing detailed models of the different thermal processes within a building. (ii) The development of models for the simulation of specific building elements (e.g. Trombe walls, solar collectors) generally implemented in larger programs such as TRNSYS. (iii) The reduction of more complex models to 'simplified' models more easily used, for instance, in studying the performance of control systems. Thermal models generally incorporate two essential features:
• treatment of the heat transfer processes such as conduction within the fabric (e.g. using finite differences, transfer functions etc.) and
• representation of temperatures which, for a zone, may include a range of possibilities (air temperature, mean radiant temperature, resultant temperature) and which influence the calculation of energy flows.
For this reason, models that come under (i) above are often quite complex. In order to include these together with other elements, for instance for HVAC and control system calculations, a number of simplifying hypotheses are required such as
• aggregation of building elements into single entities, and • aggregation of time-varying boundary conditions into global input variables.
Reference 1 of Appendix 2 contains a general survey of the models used in the countries participating in Annex 30.

Energy Conservation in Buildings and Community Systems
13
3.3.2 Air flow models
In addition to radiative and conductive heat transfers within a building, heat is also transferred by convection. This involves both the transfer of heat from air to fabric at surfaces and heat transferred from one location to another by air movement. The latter includes both the movement of air within a space or zone and movement between zones. An important sub-set of the latter is the exchange of air across the building envelope. Flow models embedded in thermal models are usually very primitive, such as simple user-defined constant mass flows. However, advances in fluid dynamics together with improved computational power have enabled the development of methods for predicting complex flow fields. Annex 30 identified three principal categories of model distinguished by level of complexity. These are summarised below: Computational fluid dynamics Computational fluid dynamics (CFD) involves the simultaneous solution of the continuity equations for mass, momentum and energy. The flow domain is divided into many small control volumes and the discretised equations are solved iteratively for each control volume and for the domain as a whole. A turbulence model is required to account for the energy dampening effects of viscosity. CFD is a very powerful tool for predicting the three-dimensional air distribution within a space and is particularly useful for complex situations. However, CFD requires powerful computing facilities, specialist software and expert users and, is in consequence, relatively expensive in both time and resources. This type of model also requires considerable, detailed input data much of which is not available at the early stages of a design project. For this reason it is mainly used at the detailed design stage to provide fine-tuning or additional confidence in a proposed design, based on simpler methods. Network models These models solve for the flows between zones in a building and between zones and outside air. They do so by representing flows in the form of a network with the driving potential being the pressures generated by the wind, temperature difference and any installed mechanical ventilation system. There is a wide range of these models available and Reference [1] summarises the characteristics of many of these. Simplified models These are essentially simplifications of the network models described in (b). In most cases they treat the building as a single zone and are generally used for predicting overall building infiltration losses.
3.3.3 Coupled air flow and thermal models
While thermal and air flow models are often designed to stand alone they are complementary. Thermal models require the specification of air flows in order to calculate convective heat transfer. Air flow models require a knowledge of air temperature in order to calculate driving pressure differences correctly. Clearly there is considerable benefit in coupling the two types of model to enable a simultaneous solution of the mass and energy balance in a multi-zoned building. During the work of

Bringing Simulation to Application
14
Annex 30, two examples of coupled solutions were identified, with simulation programs: TRNSYS/COMIS COMIS is a multizone air flow model, developed under IEA ECBCS Annex 23 [12]. Methods of coupling COMIS with TRNSYS were reviewed within Annex 30. The simplest of these, sequential operation of COMIS together with TRNSYS Type 56 multizone model was set up and tested in Case Study 2. This was successful and the results indicated a substantial improvement over using the thermal model with standard default values for air flow rates. The procedure does, however, lengthen the computation time and other approaches were investigated, in particular, the incorporation of COMIS as a TRNSYS component (designated Type 157). This was carried out under IEA ECBCS Annex 23. ESP-r ESP is simulation program developed by the University of Strathclyde [13]. At an early stage in its development, an air flow network model 'mfs' was incorporated to run either in stand-alone mode or coupled to the main building performance simulation module 'bps'. In a later development, a more advanced airflow model 'dfs' was incorporated allowing the calculation of flows within individual zones, using computational fluid dynamics. 3.4 HVAC component models Models of individual components of both primary and secondary HVAC systems are usually set up as individual sub-routines capable of being integrated within modular programs such a TRNSYS and HVACSIM+ or included in libraries such as the ASHRAE Toolkits. Typically, such models combine two different approaches:
• Deterministic modelling (“white box” approach) • Curve-fitting (“black box” approach)
Although the deterministic modelling, based upon an understanding of the physical processes involved, can be used for some simple secondary components such as ducts and pipes, it is not workable for more complex components such as primary systems for which curve-fitting is the most appropriate approach. In the latter case the model parameters are the coefficients of a polynomial expression and have no physical meaning. Most models are static or ‘quasi-static’, although dynamic models are necessary for some purposes, such as:
• Energy management analysis (leading to optimal control strategies) • Simulation of closed loop control systems • Real time simulation, fault detection and diagnosis.
Table 3.1 shows the HVAC component models and their sources considered during the work programme of Annex 30.

Energy Conservation in Buildings and Community Systems
15
Table 3.1 The sources of the major component models considered by Annex 30
3.5 Model qualification procedure
3.5.1 Introduction
The key elements of a model qualification procedure were identified as follows:
• Model documentation. • Parameter identification. • Example of use. • Verification and validation. • Implementation.
3.5.2 Model documentation
It is essential that a model be fully documented in order to enable the user to be aware of its capabilities and limitations. Experience gained during the course of Annex 30 resulted in the following proposal for the key components that should be included in any documentation of a model:
SOURCE
Ref
[2
]
Ref
[3
]
Ref
[4
]
Ref
s[5
,6]
Ref
[7
]
Ref
[8
]
Ref
[9
]
Ref
[1
0]
Ref
[1
1]
COMPONENT
TR
NSY
S
HV
AC
Si
m+
ASH
RA
E
Pri
mar
y T
oolk
it
ASH
RA
E
Seco
ndar
y T
oolk
it
IEA
A
nnex
10
IEA
A
nnex
17
IEA
A
nnex
30
Boiler
Chiller
Cooling tower
Ice storage
Cooling coil
Chilled beam
Ground cooling

Bringing Simulation to Application
16
• General description of the model. • Modelling assumptions and input/output characteristics. • Nomenclature of all variables and symbols appearing in the model
formulation. • Detailed mathematical representation of the model. • Typical input files. • Sample results. • Source code of the model, if in the public domain. (Optional).
3.5.3 Parameter identification
Many models have been formulated from a scientific point of view and associated parameters do not readily correspond to the technical data available to designers. In order to bridge this gap, it is necessary to apply an 'identification procedure' which provides for the efficient translation of the technical data to the input parameters required by the model.
3.5.4 Examples of use
One or more examples of use should be provided to enable the user to become familiar with the model and to gain confidence in its use.
3.5.5 Verification and validation
In general, validation will involve comparison of the results, over the expected range of application of the model, with a reference source. This may be a set of experimental data, provided these are known to be within required confidence limits or, alternatively, may be a model that has been agreed as a suitable standard.
3.5.6 Implementation
Models rarely stand-alone and need to be operated, generally with other models, in a program or solver. 3.6 Discussion The model qualification procedure outlined above was applied to a number of models of different types, three of which are described in detail in the Annex 30 Final Report:
• A simplified single zone building model, implemented in TRNSYS. • A cooling coil model, implemented in Simulink. • A chiller model.
The results of these and other tests demonstrated the potential of model qualification procedure as a systematic method for the appraisal of models used in simulation procedures. In order to encourage its wider use, consideration should be given to developing the procedure as an international standard through CEN or ISO.

Energy Conservation in Buildings and Community Systems
17
It was also noted that there were strong parallels between the model qualification procedure and the process of commissioning and fault-finding in HVAC systems. In each case comparison is made with a ‘reference’ model and a common software framework could be developed to cover both.

Bringing Simulation to Application
18

Energy Conservation in Buildings and Community Systems
19
Information Management 3.7 Introduction A major disincentive to the use of simulation models in practice is the difficulty in dealing with the quantity and disparate nature of the required input data and the resulting output data. A key component of the work of Annex 30 was to review the range of types of data required and to identify methods for handling these. Three main areas where data handling is required are:
• Recording of basic data related to the building and its systems. • User interfaces to simplify the input and output of data from simulation
programs. • Preparation and presentation of results.
3.8 Data required for simulation The nature of these data varies with the type of simulation being undertaken and in the course of preparing the Case Studies. The accompanying summaries outline example data requirements for three types of simulation problem:
• Calculation of heating and cooling loads for an office building. • Calculation of air flows into and within an office building. • Simulation of a chiller.
3.9 Data preparation
3.9.1 Overview of relevant data
Errors in data acquisition for a simulation calculation can significantly affect the quality of the results. As an aid to identifying the different types of data required the following categories have been identified:
• Project information. • Building information. • Internal layout/system information. • Building geometry. • Building physics. • External and internal loads. • Ventilation and air-conditioning components. • Heating components. • Building automation.
These can be further subdivided. For each of these categories and their subdivisions three levels of precision are proposed:

Bringing Simulation to Application
20
• Exact • Standard • Not essential
Table 4.1 Overview of the data necessary for a building simulation.
Type of Information Exact Standard Not essential
P - Preliminary design phase; F - Final design phase
0. Project Client P,F Project name P,F Project No. P,F 1. Building Name P,F Location P,F Orientation P,F Shading F P Type P,F 2. Building layout/system information Zoning F P HVAC system Air change rate F P Air quality limits F P Max. cooling load P Max. heating consumption F P 3. Geometry information Walls Orientation P,F Width F P Height F P Tilt F P Construction F P Windows/doors Orientation P,F Width F P Height F P Tilt F P Construction F P Floors/ceilings Orientation P,F Shape F P Construction F P 4. Physical information Materials used P,F Different coefficients P,F 5. Internal & External Loads Usage of zones Heat sinks and sources F P Electrical equipment F P Lighting F P Schedules F P Weather Design days F P Test Reference Year F P

Energy Conservation in Buildings and Community Systems
21
Based on these, a simple schema has been developed and is shown in Table 4.1. For present purposes this deals only with building simulation, but could be extended to deal with other aspects of the design, including HVAC equipment. Because the nature of the data and its required precision varies with the different stages of the design process, there are separate entries in Table 4.1, corresponding to the preliminary design phase (P) and final design phase (F). The schema is only intended as an indication of the type, and not the detailed nature, of data required at each stage. One possibility might be to add an additional column, indicating whether default values are available. These for example might include the standards (for, say, wall insulation) set out in national regulations.
3.9.2 Production of checklists
A useful aid in dealing with input data is a checklist. These provide a valuable discipline to ensure that all data is properly recorded and lead the user through the data acquisition process. 3.10 User interfaces - input data
3.10.1 Introduction
Practical experience has shown that a substantial amount of time is spent on the input of data into simulation models, particularly in relation to setting up the building geometry and checking for errors. The improved power and speed of computing facilities now means that setting up a simulation may be the dominating activity, limiting the time available for examining alternative solutions. Additional time and effort is required to transform the results into a suitable form for the end-user. These considerations point to the need for efficient user interfaces. Objectives for developing user interfaces for simulation programs include:
• To simplify the input and output procedures, possibly using graphical interfaces.
• To input identical information only once during the simulation process. • To use results of simulations as input for following calculations.
Basic ideas will be discussed here, looking at building geometry, schedules and other data. Further, more general, possibilities for information exchanges are discussed in Section 5.
3.10.2 Building geometry
Data related to the geometry of a building may be entered in a number of ways:
• As numerical data, using an ASCII editor or word processor. • From drawings, using a digitiser. • Using simple drawing tools, adapted for a particular application. • Using CAD systems with added functions.

Bringing Simulation to Application
22
ASCII editor or word processor This approach remains in common use although it is time consuming and prone to error. Information is extracted from paper drawings by direct measurement and recorded onto data sheets for manual entry into the simulation program in coded form using a text editor. Particular problems arise when buildings with other than a simple form are under consideration. Digitiser Digitisers allow information from drawings to be entered directly into a computer database. However, large digitisers, suitable for most building drawings, are expensive and the use of smaller digitisers suffers from reduced resolution and, possibly, distortion effects from reducing the size of the drawings. Simple drawing tools A major improvement is the use of simple 3D drawing tools, adapted for particular simulation packages. With these it is possible to check the data as it is entered and to avoid many of the errors associated with the two preceding approaches. The main disadvantage is the limited capacity of the drawing tools. While they can usually deal adequately with a single room or floor, modelling a more complex building is not usually possible. Further, these drawing tools are often not compatible with information supplied in standard file formats from CAD systems. CAD systems with added functions State of the art CAD systems are able to draw in three dimensions with predefined objects such as walls, windows, doors and ceilings. They include nearly all characteristics needed for the successful input of geometry for simulation purposes. Some functions have, however, to be added. Accurate data on materials are not usually available and a connection to an appropriate database may be required. Also, simulation programs may not be able to handle, or need, the large volume of data that can be extracted from CAD drawings and simplification strategies will be needed to reduce this. The geometric data must be converted into the input format of the simulation program and the connection between spaces and schedules of usage, internal loads etc. must be created. Although effort is required to adapt CAD models, there are substantial off-setting benefits, including:
• Excellent visualisation and high reliability. • Ability to use CAD architectural drawings via data exchange formats. • Ready incorporation of changes and variations
As an example, one of the main components of the RIUSKA integrated simulation tool, discussed in Chapter 5, is a 3D space modeller, SMOG, which is an object-orientated add-on tool for AutoCAD R14. SMOG has drawing features that enhance efficiency by giving the tools to produce a 3D model of a building as objects. They may be linked to any kind of data and thus the model may be reused for several different purposes such as simulations, heat loss calculations, space management and visualisations. SMOG provides an algorithm to interrogate the drawing for zone area and volume information. The tool calculates user-defined areas by an area calculation algorithm.
Energy Conservation in Buildings and Community Systems
23
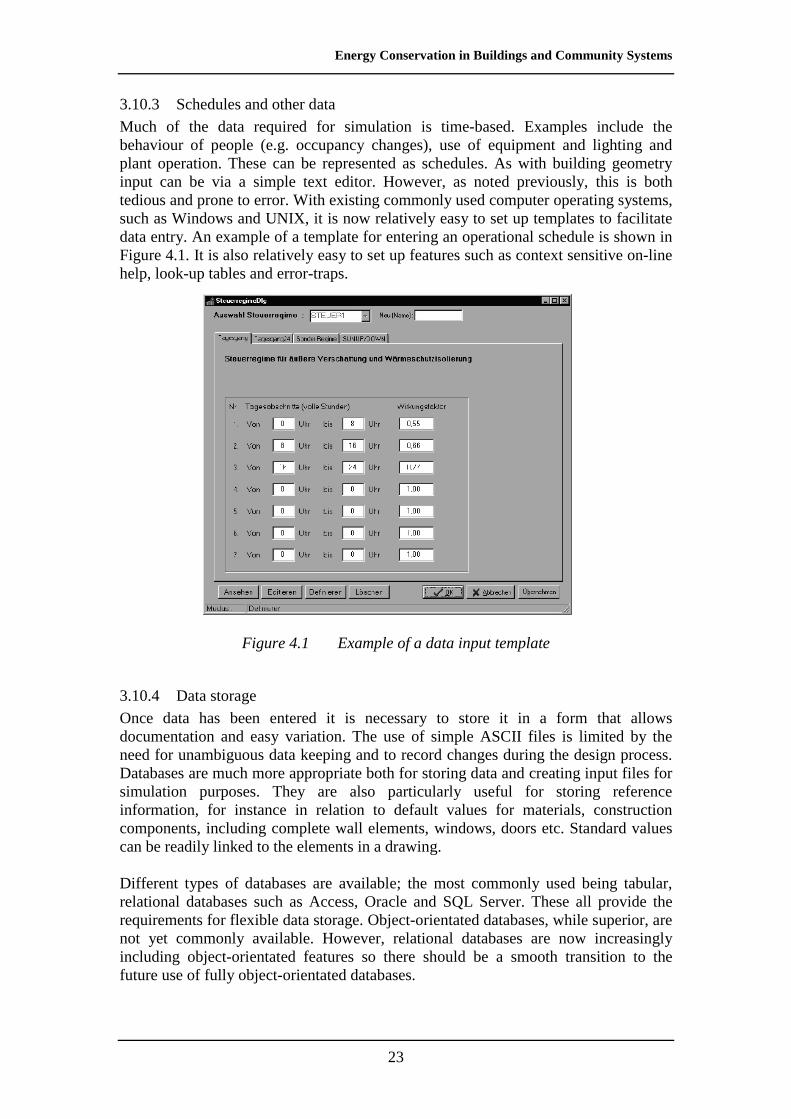
3.10.3 Schedules and other data
Much of the data required for simulation is time-based. Examples include the behaviour of people (e.g. occupancy changes), use of equipment and lighting and plant operation. These can be represented as schedules. As with building geometry input can be via a simple text editor. However, as noted previously, this is both tedious and prone to error. With existing commonly used computer operating systems, such as Windows and UNIX, it is now relatively easy to set up templates to facilitate data entry. An example of a template for entering an operational schedule is shown in Figure 4.1. It is also relatively easy to set up features such as context sensitive on-line help, look-up tables and error-traps.
Figure 4.1 Example of a data input template
3.10.4 Data storage
Once data has been entered it is necessary to store it in a form that allows documentation and easy variation. The use of simple ASCII files is limited by the need for unambiguous data keeping and to record changes during the design process. Databases are much more appropriate both for storing data and creating input files for simulation purposes. They are also particularly useful for storing reference information, for instance in relation to default values for materials, construction components, including complete wall elements, windows, doors etc. Standard values can be readily linked to the elements in a drawing. Different types of databases are available; the most commonly used being tabular, relational databases such as Access, Oracle and SQL Server. These all provide the requirements for flexible data storage. Object-orientated databases, while superior, are not yet commonly available. However, relational databases are now increasingly including object-orientated features so there should be a smooth transition to the future use of fully object-orientated databases.

Bringing Simulation to Application
24
3.11 User interface - output data
3.11.1 Introduction
Most of the commonly used simulation programs have been developed in universities or research institutes. In most cases the output consisted of large lists of numbers from which relevant information had to be extracted manually and presented by separate methods. This can be a time-consuming process, unsuited to the requirements of commercial practice. It is therefore a necessary development to create tools that allow output data to be more readily presented in a suitable form. It is not intended here to define a 'standard' format but, rather, to provide some general guidance. In particular, it is important to identify the end-user. A distinction must be made between (a) research and development, and (b) the design process. For research, a detailed review of the results may be required and, for this purpose, a tabular format is likely to be most appropriate. In the design process, however, a more general view of the data is likely to be most appropriate. Often, trends and relative changes are more important than absolute values. Three types of visualisation are suggested:
• Simple diagrams. • Improved datasheets with graphics and data. • Brochure-like compilations of solutions for special problems.
3.11.2 Simple diagrams
Simple diagrams, such as histograms or pie-charts, are mostly used in reports. Values are shown in compiled format to concentrate on the essentials. The type of diagram used depends on particular circumstances. Such diagrams can be readily created using charting accessories that accompany many computer operating systems (c.f. MS Chart). Extraction of the values from result files must be done with macro programming or via an external programming language. For more advanced presentations special programs for visualisation are more suitable. However, the inclusion of proprietary solutions into integrated program packages may present difficulties. Figure 4.2 shows a typical example of a simple output diagram, created with the program Techplot via an OLE connection to an integrated simulation program.

Energy Conservation in Buildings and Community Systems
25
Figure 4.2 Example of a simple output using a standard chart production program, integrated with a simulation program
3.11.3 Datasheets
Datasheets are an enhanced way of presenting results to a user. They can add to the graphical presentation by providing additional textual information - such as a short description of the project; the objective of the simulation; maximum and minimum values of key parameters etc. In many cases it will be appropriate to include the boundary conditions, assumptions and the variations used in the calculations. An easy way to create useful outputs of this type is using a spreadsheet program such as Excel. The integrated diagram functions can readily and rapidly produce compilations of relevant data in various predefined charts.
3.11.4 Brochure-like compilations of solutions for special problems
In some cases it is necessary, to convince a client either generally of the benefits of using a simulation tool or of the necessity to do extended investigations. In general, consulting engineers use this to provide clients with detailed factual information concerning a particular problem in a concise form. 3.12 Conclusions In the past, the greater part of the time taken to carry out a simulation was taken up in carrying out the calculation. With the advent of increased computing power and speed, together with more sophisticated models, it is the handling of input and output data that consumes most of the time and effort of designers. Experience gained through the work of Annex 30 has identified ways of for streamlining and improving these processes.

Bringing Simulation to Application
26
4 Data Exchange 4.1 Introduction The preceding chapter reviewed the nature of the data required for simulation and outlined the commonly used methods for data input and output to models. It was observed that, as the power and speed of computers has increased, it is data handling rather than computation time that provides the bigger constraint in running simulation models. What are required are more efficient methods not only of preparing data for input and output but to enable continuous exchange throughout the design process. Within the work of Annex 30 a number of key areas for consideration were identified:
• Integration of CAD programs with simulation tools. • Interoperability of HVAC design tools and simulation. • Availability of a common data base for all stages of the building life cycle • Availability of manufacturer's product data on-line. • Availability of an open and internationally standardised data exchange format. • Development of systems to ensure that decisions and actions taken by
individual members of the design team are tracked and, hence, available to others.
Of these, the need for an internationally agreed standard format for data exchange was seen to be of essential importance. 4.2 Approaches to integrated data exchange
4.2.1 Introduction
A number of advanced approaches were considered during the course of Annex 30 and four will be considered here.
4.2.2 RETEx
Arising from the national research project in Germany - "Computer-aided design system for HVAC with use of expert knowledge - RETEx" - attempted to integrate different simulation programs and a central data pool. Figure 5.1 shows the approach schematically. Each simulation program is associated with two 'converters'. One converter takes data, stored in neutral format, in the data pool, and converts it to a format acceptable to the simulation program. The second converter reverses the process, taking the output from the simulation and putting it into the data pool format. Within RETEx, building data is input using a CAD system and output is via a commercial graphics package. In practice, the resulting structure of the RETEx system is quite complex, as may be seen in Figure 5.2.

Energy Conservation in Buildings and Community Systems
27
Figure 5.1 Basic representation of the RETEx system
Figure 5.2 Schematic representation of data flow within RETEx

Bringing Simulation to Application
28
4.2.3 RIUSKA
Developed by Olof Granlund Oy, in Finland, RIUSKA, in part under Annex 30, is an integrated simulation system which forms part of a full suite of software covering the building life cycle, as shown in Figure 5.3. Figure 5.4 shows the links to the RIUSKA simulation program in more detail.
Figure 5.3 An example of an approach to integrating simulation with other aspects of the building life cycle
Figure 5.4 The RIUSKA simulation tool

Energy Conservation in Buildings and Community Systems
29
4.2.4 COMBINE
COMBINE ('Computer Models for the Building Industry in Europe') was a European Union funded research programme that was concluded in 1995. The intention was to develop the first of a new generation of Integrated Building Design Systems (IBDS). COMBINE I developed new methods of facilitating data transfer between different design and analysis computer programs in the fields of building services and energy efficiency. An outcome was the development of an Integrated Data Model (IDM) to form the basis of an integrated environment that would interface with a number, an analysis and CAD drawing tools.
Figure 5.5 Data exchange in the COMBINE system The IDM was based upon an object orientated computer language representation of the data structure, containing age number of complex geometrical and topological relationships between approximately 300 defined entities. Only data relating to energy efficiency and HVAC was included. COMBINE II was intended to link the IDM to the linked application programs developed under COMBINE I forming a functional data exchange system. Success was only partly demonstrated and while the basic feasibility of the integrated building design system was demonstrated, issues in relation to use in real projects and within real design practices were unresolved. In part as a consequence of this a COMBINE-related project was set up to investigate the method by which different members of a design team (engineers, architects etc.) can, during the design process, retrieve information, operate upon that information and return the results to a central database. Figure 5.5 illustrates schematically the use of the COMBINE IDM for this purpose. The exercise was proved to be only partially successful, due to difficulties with the link between the COMBINE system and AutoCAD. This limited the ability of the system to describe the building geometry adequately and, in consequence, considerably reduced its usefulness for practical design application. Nevertheless, important experience was gained which was incorporated into the development of the Industry Foundation Classes discussed in the next section.

Bringing Simulation to Application
30
4.2.5 The International Alliance for Interoperability
Originating in 1994 in the United States, the International Alliance for Interoperability (IAI) is an action-orientated non-profit organisation formed to define, publish and promote specifications for Industry Foundation Classes (IFCs) [14] as a basis for sharing project information amongst all disciplines in the construction industry, covering the full project life-cycle and across national boundaries. IFCs define a single object model of buildings shared by all IFC-compliant applications. IFC project models define individual buildings for which compliant versions can exchange information. IFCs are publicly available and ‘open’ for implementation and use by any member. Defined by members of the industry, they can be extended and will evolve over time. 4.3 Conclusions The advanced approaches to data exchange examined as part of the work of Annex 30 combine two key features:
• A unique data storage facility accessible to all members of the design team. • A public domain, object-orientated data structure.
The latter provides for improvement in consistency between design projects and, if widely used, would enable others outside the design team to contribute to the design process. In particular, product manufacturers would be encouraged to supply product data in formats that can be used directly. Some form of control on accessibility to data is likely to be required to mediate conflicting priorities of different members of the design team.

Energy Conservation in Buildings and Community Systems
31
5 Conclusions The objectives of Annex 30 were to investigate why the methods for simulating building performance were not being widely used in the design process and to identify ways of overcoming this. The design process, covering all of the stages from initial concept through to renovation, has been systematically analysed and the potential contribution of simulation to each stage identified. A series of case studies were carried out as a major component of the work of Annex 30 and these were used to further illustrate the ability of simulation to assist the design process at each of the stages as well as to identify any practical limitations in the use of simulation tools. A wide range of models was used in undertaking the case studies and two general issues related to their use were recognised, the need for a qualification procedure for models and the need to develop more efficient methods of handling input and output data. A qualification procedure was drawn up and tested on both building and HVAC component models. It is proposed that this should form the basis of an international standard in order to encourage a more systematic approach to the development of models which, in turn, it is hoped will give designers more confidence in their use. Existing methods of managing the extensive data needs of simulation models were investigated and proposals for improving this process were made. In particular, the need for an internationally agreed format for data exchange, covering all components of the design process, was seen as an essential requirement.

Bringing Simulation to Application
32

Energy Conservation in Buildings and Community Systems
33
References 1. Orme, M. Applicable models for air infiltration and ventilation calculations.
AIVC, Coventry. 1999. 2. Klein, S A, Beckman, W A et al. TRNSYS: A transient simulation program.
Engineering Experiment Station Report 38-14. University of Wisconsin, Madison. 1994.
3. Park, C, Clark, D R and Kelly, G E. An overview of HVACSIM+ - A dynamic
building/HVAC/control simulation program. Proceedings of First International Simulation Conference, Seattle, USA. p175ff. 1985.
4. Bourdouxhe, J-P, Grodent, M and Lebrun, J. HVAC 1 Toolkit: Algorithms and
subroutines for primary HVAC system calculations. ASHRAE. 1997. 5 Brandemuehl, M J and Gabel, S. Development of a toolkit for secondary HVAC
system energy calculations. ASHRAE Transaction Vol 100 (1). 1994. 6. Brandemuehl, M J. HVAC 2 Toolkit. Algorithms and subroutines for secondary
HVAC system calculations. ASHRAE. 1993. 7. Lebrun, J and Liebeq, G. System simulation synthesis report. IEA Annex 10 Final
Report. 1988. 8. Lebrun, J. Building energy management systems (BEMS). IEA Annex 17 Final
Report. 1992. 9. Bourdoxhe, J-P. Detailed analysis of HVAC subsystem. IEA Annex 30 Working
Document WD-75. University of Liège. July 1996. 10. Lassila, K and Jokela, M. The cooled beam model to be integrated to DOE-2
program. IEA Annex 30 Working Document WD-127. Grandlund. 1997. 11. Pilgrim, M. Proposed ground coupled ventilation system thermal model. Arup
Research and Development, London. 1998. 12. Warren, P. Multizone air flow modelling (COMIS). Technical Synthesis Report
on IEA Annex 23. IEA-ECBCS. 2000. 13. ESRU. The ESP-r system for building energy simulation. User Guide Version 8
series. University of Strathclyde. October 1997. 14 International Alliance for Interoperability. A guide to the development of Industry
Foundation Classes. IAI, May 1997.

Bringing Simulation to Application
34

Energy Conservation in Buildings and Community Systems
35
Appendix 1 Participating Organisations Country Organisation Belgium Thermodynamics University, University of Liège, Belgium
J-P Bourdouxhe, B George, M Grodent, J Lebrun, A Ternoveanu Fondation Universitaire Luxembourgoise (FUL) ��������������
China HVAC Division, Tsinghua University Feng Chen, Yi Jiang , Jinqian Zhang, Yingxin Zhu Hong Kong Polytechnic University J Burnett, Shenwei Wang, Jinbo Wang
France CSTB Service ENEA/AGE A Husaunndee
Germany Rud. Otto Meyer GmbH U Willan, R Starke
Poland University of Gliwice A Baranowski, D Pudelko, P Rylik
United Kingdom
Arup Research and Development G Davies, A Hedges, M Holmes

Bringing Simulation to Application
36

Energy Conservation in Buildings and Community Systems
37
Appendix 2 Principal Annex 30 Reports 1. André P and Lebrun J (eds). Bringing simulation to application. IEA Annex 30
Final Report. April 1999. 2. André P. Final report of IEA Annex 30 Case Study 1. July 2000. 3. Baranowski Andrzej. Final Report of IEA Annex 30 Case Study 2. July 2000. 4. Davies G and Holmes M. Final Report of IEA Annex 30 Case Study 3. July 2000. 5. Bourdouxhe J-P, Carpano A, George B, Hu H, Lebrun J and Marjanovic L. Final
Report of IEA Annex 30 Case Study 4. July 2000. 6. Wang, S. Final Report of IEA Annex 30 Case Study 5. July 2000.

Bringing Simulation to Application
38

Energy Conservation in Buildings and Community Systems
39
Appendix 3 Case Studies A central component of the work of Annex 30 was the preparation of a number of case studies. These served a number of purposes, particularly to illustrate the ability of simulation to assist the designer at all stages of the design process and to identify opportunities for improving the usability of simulation techniques. Five case studies were undertaken, each being led by one of the organisations participating in Annex 30. The table below shows the design stages, as defined in Chapter 2, covered by each case study.
Table A1 Examples of simulation at particular design stages included in the Case Studies
Design stage Case Study 1 2 3 4 5 Conceptual design Preliminary design Detailed design Tender evaluation Construction and commissioning Operation and maintenance Renovation
In the following sections each Case Study is described briefly. Full details are set out in the appropriate Annex publications.

Bringing Simulation to Application
40

Energy Conservation in Buildings and Community Systems
41
Case Study 1 – Design study for a 10 storey office building. Introduction: This case study was based upon a fictitious office building, notionally located in Hamburg, Germany. It was designed to examine and illustrate the application of simulation to the first three stages of the design process, as proposed in Chapter 2: (a) Conceptual design (b) Preliminary design (c) Detailed design Description of the building: The building consists of 10 floors with an underground basement and has a total floor area of 7000 m2. Figure CS1.1 shows the general form of the building.
Figure CS1.1 General form of the building used in Case Study 1 Apart from the ground and top floors, each floor is identical consisting of a mixture of office space, conference rooms, lounge and staircases. Each floor has a height of 3m giving a total height for the building of 30m. Figure A3.2 shows the general layout of the main floors.

Bringing Simulation to Application
42
Figure CS1.2 General layout of main floor The materials and form of the principal constructional components were based upon typical usage. Heat gains were based upon typical occupancy profiles and patterns of use of lighting and electrical equipment. Simulation studies (a) Conceptual design Three studies were carried out: (i) An initial evaluation of annual energy consumption, using German Test Reference Year 3, for Essen. (ii) An examination of the effects on cooling load and comfort of changes in the window design (iii) A comparison of TRNSYS Type 46 and 56 procedures for predicting internal space temperatures during a heatwave. Both TRNSYS Type 46 and Type 56 procedures simulate the thermal interchanges within a multi-storey building. They differ in their treatment of infra-red radiation losses and the way that internal thermal energy exchanges are modelled. Each study illustrated the ability of simulation to provide valuable information at the early design stage of a building. Figure CS1.3, for instance shows the estimated monthly energy consumption for heating and cooling determined in (i). The results of (ii) showed that replacement of the solar-protected glass by clear glass would substantially increase the cooling load/proportion of occupants dissatisfied, even with improved external shading. Study (iii) showed that the internal temperatures predicted by the TRNSYS Type 46 and 56 procedures can vary significantly for certain conditions.

Energy Conservation in Buildings and Community Systems
43
Figure CS1.3 Estimated monthly energy consumption for heating and cooling (using German test reference year)
(b) Preliminary design phase At this stage preliminary decisions have been made and the designer has to rely less on default data. The following studies were undertaken to illustrate the use of simulation at this stage: (i) Improved evaluation of comfort conditions, using inter-zone air flow modelling. (ii) Calculation of peak cooling loads, in order to size primary HVAC equipment. (iii) Comparison of two alternative approaches for cooling system. In the comfort condition/cooling load calculations in (a)(ii) above, very simple assumptions were made for the air infiltration of each zone. An improvement, which can be undertaken once the design has proceeded beyond the concept stage, is to include the air interchange between zones. This was done in study (i), using the COMIS/COMVEN 2.1 multi-zone airflow model, together with suitable estimates of the openings between zones and between each zone outside air. As in (a), the German test Reference Year 3 was used to provide meteorological data, both for a full year run to estimate heating and cooling loads and over a 25 day summer period to investigate potential peak temperatures. Figure CS1.4 shows the results for the last ten days of the latter period, comparing the results using COMIS with those assuming a simple infiltration rate of 1 ach for each zone and no inter-zonal air movement. The considerable difference points to the benefit of using the improved modelling procedure. There is a similar substantial difference in the estimated annual heating and cooling loads, as shown in Table CS1.1.

Bringing Simulation to Application
44
Table CS1.1 The effect of choice of ventilation model on calculated heating and
cooling annual consumption
Heating load
(GJ) Cooling Load
(GJ)
Simple infiltration 168.3 24.2
Using COMIS 76.0 52.3
In (ii) the peak cooling loads were calculated for floor 9 of the building using the TRNSYS 46 procedure, taking into account both sensible and latent heat loads, in order to assist in sizing the cooling plant. Examination of the results for the 25 day summer period mentioned above, showed peak cooling loads for two selected zones, the lounge and conference room 2, to be, respectively, for latent loads 4.4 kW and 12.8 kW, and for sensible loads, 4.7kW and 8.9 kW. Combining these results for floor 9, with estimates of other heat gains (from fans etc.) the design supply air conditions and flow rate can be determined and the cooling coil can be sized. Once the general characteristics of the cooling plant have been established, simulation can be used to compare different types of plant. To illustrate this, in (iii) a comparison was made of two systems:
• Air cooled reciprocating chillers • Water-cooled twin-screw chillers, with associated counter-flow cooling
towers.
Figure CS1.4 Calculation of Conference Room temperature during a heatwave, with and without airflow rates calculated using COMIS
Figure CS1.5 is typical of the information that can be provided by simulation. It shows, for a design day, a comparison of the Coefficient of Performance (COP) of each chiller type, together with the overall system coefficient of performance

Energy Conservation in Buildings and Community Systems
45
(SYSCOP) which includes the effect of auxiliary systems. The water-cooled system performs better than the air-cooled system, although it would be necessary in a real situation for the designer to compare performance over a full test reference year and to take account of other cost elements in making a choice. The results also indicate the importance, in both cases, of considering the performance of the system as a whole and not just the individual chiller units. (c) Detailed design phase At this stage, the designer has available the finalised architect's drawings and is principally concerned with specifying tenders and selecting contractors. The following aspects were illustrated in this case study: (i) Detailed dimensioning of secondary HVAC equipment (air handling units). (ii) Simulation of control strategies (iii) Dimensioning of piping and ductwork. A novel method of simulation developed at Tsinghua University, China, was used to examine a number of options for the required air handling systems for each of the principal zones of a representative floor of the building. These included constant air volume and variable air volume systems, with and without reheat, fan coil units and cooling coils. The simulation, using selected weather data, allowed the appropriate choice of air handling unit for each zone together with the range of operating conditions necessary to achieve comfortable conditions.
Figure CS1.5 Comparison of predicted performance for two types of chiller.

Bringing Simulation to Application
46

Energy Conservation in Buildings and Community Systems
47
Case Study 2 – Retrofit to improve the envelope of a multi-storey residential building. Introduction The purpose of this case study was to illustrate the potential for using simulation in improving the performance of existing buildings. The example chosen was an existing multi-storey residential building, situated in Gliwice, Poland. Description of the building The building is typical of many Polish apartment blocks built in the 1970s and consists of five storeys, connected by a single staircase and with two apartments on each storey. Figure CS2.1 shows the general layout. The building is heated by a pumped hydronic system connected to a district heating system. Each apartment has a number of radiators. The apartments are ventilated naturally by ducts connecting the kitchen and bathroom of each apartment to outlets at roof level, designed to provide about 0.8 to 1.0 ach per flat.
(a) Front elevation (b) Rear elevation (c) Floor plan
Figure CS2.1 General arrangement of the multi-storey residential building Simulation studies Simulation was carried principally using TRNSYS v14.1 to determine the heat exchange and energy demand of the building. Air flow characteristics, infiltration and ventilation, were determined either by simple functional relationships, linking air exchange to climatic conditions, or by using multi-zone air flow models, including COMIS. The building was divided into a number of zones 10 apartments (2 on each floor, type A and type B), 2 cellars and the central staircase. 'Ideal' heat sources, ensuring constant temperatures within the zones (apartments - 20oC, cellars - 10oC and staircase - 15oC). In summer an 'ideal' cooling system giving a temperature of 25oC was assumed in the apartments. Two sets of weather data were used - (i) a test reference year from Belgium (including a 25 day hot-dry wave) and (ii) a one year run of real data from Poland (Gliwice 1994).
�
5220���P
5220����P�
5220����P�
/,9,1*�5220����P�
%$7+5220���P�
+$//���P�
+$//���P�
%$7+5220���P�
.,7&+(1����P�
/,9,1*�5220����P�
.,7&+(1����P�
:&����P
(:
(:�
,:�
,:�
%
$
(:�
67$,5&$6(
����
����

Bringing Simulation to Application
48
(i) Calculation of thermal load A number of simulations were carried out. In each the total heat demand for each zone was calculated, together with the components of the heat balance: - heat losses from transmission, infiltration and ventilation - internal heat gains from occupants, lighting and solar radiation. Figure CS2.2 shows a typical summary of these results for the building without modification, using the Belgian test reference year climatic data.
Figure CS2.2 Predicted monthly variation of heating demand (using Belgian test reference year)
In order to estimate the effect of retrofitting the building with improved insulation to the external walls and the walls between the staircase and the apartments, together with less leaky windows, a comparison was made using the Polish climatic data. The results are shown in Figure CS2.3.
Figure CS2.3 Comparison of monthly heating demand before and after renovation
(using real Polish weather data)

Energy Conservation in Buildings and Community Systems
49
(ii) Improved modelling of air exchange A number of simulations were also performed to compare the use of simple models of infiltration and ventilation with multizone models which allow inter-zonal air movement to be included. Figure CS2.4 shows results obtained using COMIS which indicate the improvement in internal temperature in a summer hot wave if window opening is taken into account
Figure CS2.4 Predicted development of temperature during a summer hot wave
with and without window opening.

Bringing Simulation to Application
50

Energy Conservation in Buildings and Community Systems
51
Case Study 3 – Preliminary design study for the natural cooling of an office building. Introduction This case study concerns an investigation of the performance of a building with ventilation and cooling provided by natural means. It was intended to illustrate the use of simulation at the concept design stage. Description of the building The general concept of the office building is shown, in cross-section, in Figure CS3.1. It consists off a number of cellular offices on five floors. The heating and cooling systems are not specified, although provision is made for ducts and plant that could accommodate either natural or mechanically based systems. Provision is included for the possible use of two means of enhancing buoyancy driven ventilation: (i) Heat recovery by allowing exhaust air to pass over mid-pane blinds (ii) Heat recovery by using exhaust air to cool photovoltaic cells mounted in the
exhaust path
Figure CS3.1 General concept of the office building

Bringing Simulation to Application
52
Simulation studies Simulations were applied to investigate key features of the building at the conceptual design stage, principally the use of natural ventilation to minimise energy consumption. In addition to simulation packages included in the BEANS suite, some specific algorithms were derived and physical simulation carried out using wind tunnel studies. (a) Air inlet and exhaust system The principal means of natural ventilation were a series of 'chimneys', projecting above the top of the building. Each chimney would include both an air inlet and outlet, the need being to design the size and position of these to optimise wind-driven ventilation. Wind tunnel testing of a scale model of the complete building with and without surrounding buildings was undertaken. Pressures were measured at various locations on the chimneys. The results showed that:
• chimney performance was dependent on roof slope; • the most effective inlet is a plane opening facing into the wind; • the most effective outlet is situated in the horizontal chimney top; • the presence of surrounding buildings has a significant effect on chimney
performance, and • there is interference between the chimneys, depending upon wind direction.
A comparison with results made using a computational fluid dynamics model was attempted but it proved difficult to reconcile the differences between the predicted and measured values. Nevertheless, the wind-tunnel studies provided a reasonable basis for preliminary assessment of wind-driven ventilation. (b) Performance of a ventilated cavity containing photovoltaic cells One consideration was the possible use of photovoltaic cells to contribute to the building power requirements. The proposed design incorporated air paths in the external façades (see Figure CS3.1) with the aim that these would allow the air to be warmed by solar gain and hence enhance buoyancy-driven ventilation. It was also suggested that the photovoltaic cells be mounted in these air paths with the dual benefit of cooling the cells and increasing the buoyancy of the air. A simulation, using standard heat transfer equations, was carried out on this arrangement to develop and validate a model for subsequent incorporation in a dynamic thermal model of the whole building. The predictions were tuned against experimental data. Figure CS3.2, showing predicted cavity air temperature variation over a 12 hour period, illustrates the level of agreement achieved (c) Ventilation characteristics The general schematic arrangement of the building ventilation system is shown in Figure CS3.1. Air is supplied to offices on each of the five floors by central vertical ducts connected to a supply air plenum at roof level, fed by the chimney inlets. Air extracted from the offices passes into vertical exhaust ducts in the building façade and thence to the extract air plenum at roof level.

Energy Conservation in Buildings and Community Systems
53
Figure CS3.2 Comparison of predicted back cavity air temperatures and measured
test temperatures page missing!!chimney outlets. In each office the incoming air is introduced via an under-floor void and a displacement ventilation system. Air is extracted above the windows. The performance of the system was simulated using the Oasys Ltd. VENT program, using idealised conditions for chimney pressure differential and insolation appropriate to a clear sunny day. Figure CS3.3 shows a typical set of results for an office on level 3 for a range of wind speed.
Figure CS3.3 Predicted office air change rates, demonstrating the importance of internal gains at low wind speed.
A number of operating conditions were examined allowing the areas of the room inlet and exhaust openings to be optimised to prevent any short-circuiting. It was concluded that the proposed system could work and would provide both sufficient air for free cooling and for minimum design fresh air requirement.

Bringing Simulation to Application
54
(d) Development of a control strategy The aim of this simulation was to determine the amount of air necessary to achieve comfortable conditions in the office spaces, the method of controlling this air flow for a range of external conditions and the need to preheat the incoming air. The basis of the simulation was the application of the Oasys Ltd. ROOM model, to a typical office, in conjunction with reasonable assumptions on the thermal characteristics of the structure and internal loads. A suitable weather file was chosen and analysis was carried out for three operating conditions, corresponding to (i) summer, (ii) mid-season and (iii) winter. An analysis of temperature variations within the office for different ventilation strategies enabled a ventilation control system to be specified. (e) Whole building performance assessment Whole building simulations were performed using the Oasys Ltd. program ENERGY2, modified by inclusion of the VENT program to allow the airflows to be correctly represented, with the aim of providing information on:
• Summertime overheating • Performance of the ventilation control system and effect of chimney design • Space heating energy demand • The advantages of heat recovery • The effect of additional buoyancy due to heat gains from the photovoltaic cells • Appropriate use of the electrical power generated by the photovoltaic cells.
Figure CS3.4 Predicted energy loss due to damper leakage (i) with heat recovery
(lower line) and (ii) without heat recovery (upper line). The full results of the simulation studies are given in Ref. 3 of Appendix 2. Figure CS3.4 illustrates a typical set of results. In winter the control system will close the external dampers to the ventilation system during unoccupied hours. The only air movement will result from leakage due to imperfect damper closure. Figure CS3.4 shows the effect of increasing leakage on energy consumption for two cases (i) without heat recovery and (ii) with heat recovery. The effect of including heat

Energy Conservation in Buildings and Community Systems
55
recovery is immediately apparent, together with the need to ensure that leakage is 2% or less.

Bringing Simulation to Application
56

Energy Conservation in Buildings and Community Systems
57
Case Study 4 - Commissioning, Management and Retrofit of an Office Building/Conference Introduction Commissioning, management and retrofit of the European Council of Ministers Building (Justus Lipsius), Brussels, Belgium. Description of the building The building consists of 10 floors with a useful area of about 54,000m2, divided between the Conference building (25,000m2) and the General Secretariat office building (29,000m2). The Conference building (Figure CS4.1) has a maximal occupancy of 3500. It has 7 principal floors and 3 mezzanines and includes, in addition to conference and ceremonial, meeting rooms, delegation offices, three restaurants and a cafeteria.
Figure CS4.1 Conference Centre
Figure CS4.2 General Secretariat building

Bringing Simulation to Application
58
The General Secretariat building (Figure CS4.2) is arranged around four courtyards, allowing natural lighting of all rooms. It has a maximal occupancy of about 2500 and contains mainly offices, although there are also printing rooms, a computer room, cafeteria and sports area.
Figure CS4.3 Layout of primary HVAC system

Energy Conservation in Buildings and Community Systems
59
The cooling plant is designed to meet a whole building peak cooling load of 5MW (outside wet bulb temperature of 22oC). To meet this cooling load an ice storage system is used in parallel with chillers. The general layout of the primary HVAC system is shown in Figure C4.3
Figure CS4.4(a) A typical air handling unit in the Conference building
Figure CS4.4(b) A typical air handling unit in the general secretariat building Figures CS4.4(a) and CS4.4(b) show schematic arrangements for typical air handling units in the Conference building and the General Secretariat building. In the former summer conditions are set to 24oC dry bulb temperature and a relative humidity of 60%. About 300 air handling units are employed, almost all of which are constant air volume systems with a facility for recirculation. Total air flow rate is 515000 m3/h with a nominal cooling capacity of 3.88MW. All delegation rooms are equipped with fan coils, having a total nominal cooling capacity of 540kW. In the General Secretariat building, offices are supplied by a constant air volume system. Fresh air is only cooled to 24oC in summer. The building consists of seven sectors and all floors in a sector are served by a single air handling unit. The nominal air flow rate is 165,000 m3/h and nominal cooling power, 415 kW. Additional sensible cooling is supplied to South and West orientated offices by fan coils with a total cooling power of 1400kW.

Bringing Simulation to Application
60
Simulation studies (a) Construction and commissioning phase (i) Commissioning air handling units On-site measurements were made of key characteristics of the air handling units. Taken together with manufacturers' data these were used to develop a simplified 'black box' model of the air distribution system. The simulation model enabled the fresh air ratio to be predicted as a function of damper opening. This showed that 'back-flow' into the plenum could occur under certain operating conditions (Fig. CS4.5), even if plenum pressure set points were maintained and enabled remedial action to be undertaken.
Figure CS4.5. Simulated performance of air handling units. (ii) Commissioning of the cooling plant The general layout of the primary cooling system is given in Figure CS4.1. An ice storage system was incorporated in parallel to the chillers, allowing a reduction in the required number and size of chillers as well as taking advantage of lower overnight electricity supply tariffs. Models of the components of the cooling system were developed using data supplied by the manufacturers and satisfactorily validated. Controlled trials were carried on the system and compared with the simulation of the same conditions, revealing or confirming a number of discrepancies, such as the inaccurately low reading of the BEMS temperature sensor at the discharge to the ice storage tank. Examination of the chiller performance found poor agreement but was confounded by the inaccuracy of the temperature sensors on the control display, uncertainties in the hydraulic analysis and variations between the compressor motors. A subsequent physical examination revealed possible reasons for the discrepancies including condenser tube scaling and fouling by large particles from the cooling towers.

Energy Conservation in Buildings and Community Systems
61
(b) Operation and maintenance phase (i) Fault detection and diagnosis applied to the air handling units Two models of the cooling coil, the first covering dry or fully wet conditions, the second partially wet conditions, were calibrated against in situ measurements of the performance of the cooling coil. Figure CS4.6 shows a comparison between simulation based on this approach and measurements.
Figure CS4.6 Comparison between measurement and simulation for the cooling coil exhaust temperature
Based upon this simulation, a fault detection and diagnosis program, using fuzzy logic, and employed in conjunction with a set of simple tests (0%, 50% and 100% settings of the control valve voltage), was developed to identify four possible faults:
• leakage when the waterside control valve should be fully closed, • fouling on the inner wall of the cooling tubes • incorrect temperature measurement by the exhaust air sensor and • the waterside control valve stuck in a particular position.
The program appeared to function satisfactorily, although a broader trial programme will be required to fully confirm its usefulness and to eliminate confounding due to failure in associated units such as a leak in the upstream pre-heating coil. (ii) Cooling plant under different control strategies Simulation of the cooling plant operating modes, including control of the plant allows the impact on the thermal performance of the cooling plant of departures from the design control strategy to be assessed. In this exercise the following were examined:
• the ability of the cooling plant to handle a hot wave, including methods of increasing capacity to met particularly high cooling loads,

Bringing Simulation to Application
62
• the impact of the failure of one chiller on the thermal performance of the system, and
• methods of reducing plant operating costs. (c) Renovation phase (i)Reduction of overheating in office rooms The purpose of the simulation was to investigate possible retrofit solutions to reduce the over-heating experienced in the office rooms of the General secretariat building. The effect of introduction fan coil cooling units on peak and average temperatures was investigated, using real weather data. A further analysis was carried out to examine two different operating profiles for the fan-coil units.

Energy Conservation in Buildings and Community Systems
63
Case Study 5 – Study to improve the management of the HVAC plant supplying an existing building. Management of the HVAC plant for a large commercial building in Hong Kong, Peoples Republic of China. Description of building The building consists of 46 storeys and has a useable floor area of 74,000 m2. The HVAC plant includes four centrifugal chillers each with condensers indirectly cooled with sea water. A schematic diagram of the chilling system is shown in Fig CS5.1
Flow MeterFM
Air FlowTemperature (PID) Controller
A
CC
FM
FM
H/E
H/E
H/E
H/E
H/E
To Building
From Building
FM
Figure CS5.1 Schematic diagram of central chilling system and chilled water network
The chilling plant consists of four identical indirect seawater-cooled centrifugal chillers (design cooling capacity 3100 kW each), two variable speed seawater pumps and an auxiliary heat exchanger (used to supply local air conditioning to specialist spaces such as computer units). Each chiller is associated with a constant speed condenser water pump and a primary chilled water pump. Three parallel constant speed secondary chilled water pumps distribute the chilled water to the air handling units. The chilling system operates continuously but with significant variation in load, even on a daily basis. Simulation studies The whole plant was simulated with the aim of optimising the control strategy, focussing on the chillers and sea water pumps. Results obtained by monitoring performance were used to fit and validate the models used. The analysis consisted of testing the effect of an optimal control algorithm applied to the variable speed sea-water pumps on the combined electric power consumption of the pumps and compressors. The variable speed pump and seawater network were simulated by a steady-state pump, a steady state frequency inverter with a dynamic actuator. The energy

Bringing Simulation to Application
64
performance and pump characteristics were determined by a fourth-order polynomial regression fit to experimental data and the manufacturer's catalogue. The pressure-flow characteristics of the seawater network were solved as a single model, to avoid problems of convergence. The primary seawater heat exchangers were modelled using classical steady state heat exchanger theory and simple dynamic equations to determine seawater and cooling water temperatures, assuming notional thermal storage in each flow circuit. The cooling coil was represented by a model developed under IEA Annex 17. The model for the centrifugal chiller was developed from that in HVAC1, together with parameter identification data obtained from field measurement and manufacturers. Other secondary HVAC components were similarly modelled dynamically using suitably chosen models, including appropriate TRNSYS types. The existing Building Management System was used, after careful calibration, to provide data to validate the simulation. The power consumption of one selected chiller was monitored under various conditions. Figure CS5.2 shows a comparison between predicted and measured (a) power consumption and (b) chiller full load capacity.
Figure CS5.2 Comparison between predicted and measured values of:
(a) power consumption and (b) capacity