Embed Size (px)
Citation preview

Breastfeeding to Breastfeeding to prevent double burden prevent double burden
of malnutritionof malnutrition
Sirinuch Chomtho MD PhDSirinuch Chomtho MD PhD
Nutrition Unit, Department of Nutrition Unit, Department of Paediatrics, Paediatrics,
Faculty of Medicine, Chulalongkorn Faculty of Medicine, Chulalongkorn UniversityUniversity

Breast milk compositionBreast milk composition Special fluid that keep changing !!!???Special fluid that keep changing !!!???
Colostrum-Transitional milk-mature milkColostrum-Transitional milk-mature milk Foremilk-HindmilkForemilk-Hindmilk Premature milk-Fullterm milkPremature milk-Fullterm milk

Nutrients in breast milkNutrients in breast milk
MacronutrientsMacronutrients Lipids-most important E source Lipids-most important E source
(50%)(50%) ProteinProtein CarbohydrateCarbohydrate
MicronutrientsMicronutrients VitaminsVitamins MineralsMinerals

Composition/100ml
Colostrum
Mature milk
Cow milk
Codex standard
Energy (kcal) 58 -657
0
64 60-70
Lipids (gm ) -152.0
-354.8.
366. 2.95-4.0
Carbohydrate (gm)
Lactose (gm)
Oligosaccharides (gm)
Glucose (gm)
-572 -5
-222.4
-002.01.
-708.5
67. -7.0
-121.4
-002.00.3
465.4.5TraceNR
6.0-9.4
Protein (gm) Casein Whey α-lactalbumin β-
lactoglobulin lactoferrin lysozyme serum
albumin sIgA IgM IgGNon-protein
nitrogen (gm)
-152.0
038.-111.
5
0.36-0.350.01-
0.020.40.2-1.20.0020.0010.05
-081.1
0.3-0.5-050.
6
-020.3
--010.
3
0.010.30.05-
0.10.0010.0050.045
3.2-3.5
2.70.50.10.36TraceTrace0.040.0030.0060.0030.02
1.2-2.0

LipidsLipids
LCPUFALCPUFA highest in breast milk highest in breast milk >>>> cow’s milk >>>> cow’s milk (saturated (saturated short/medium chain FA)short/medium chain FA) linoleic acid (C18:2, n-6)/linoleic acid (C18:2, n-6)/αα-linolenic -linolenic
(C18:3, n-3) (C18:3, n-3) arachidonic acid (ARA ; C20:4, n-6)/ arachidonic acid (ARA ; C20:4, n-6)/
docosahexaenoic acid (DHA ; C22:6, docosahexaenoic acid (DHA ; C22:6, n-3) n-3)
higher in premature human milkhigher in premature human milkMinda H et al. Acta Paediatr 2002;91(8):874-81.Simmer K et al. Cochrane Database Syst Rev 2008;(1):CD000376.Simmer K et al. Cochrane Database Syst Rev 2008;(1):CD000375.Kramer MS et al. Arch Gen Psychiatry 2008 May;65(5):578-84.

DHA is the largest PUFA source DHA is the largest PUFA source in the retina and in the brainin the retina and in the brain
LipidsLipids LCPUFALCPUFA
depends on maternal diet (oily fish, egg depends on maternal diet (oily fish, egg yolk, seaweed)yolk, seaweed)
higher DHA in erythrocyte membrane higher DHA in erythrocyte membrane lipids in BF vs FFlipids in BF vs FF
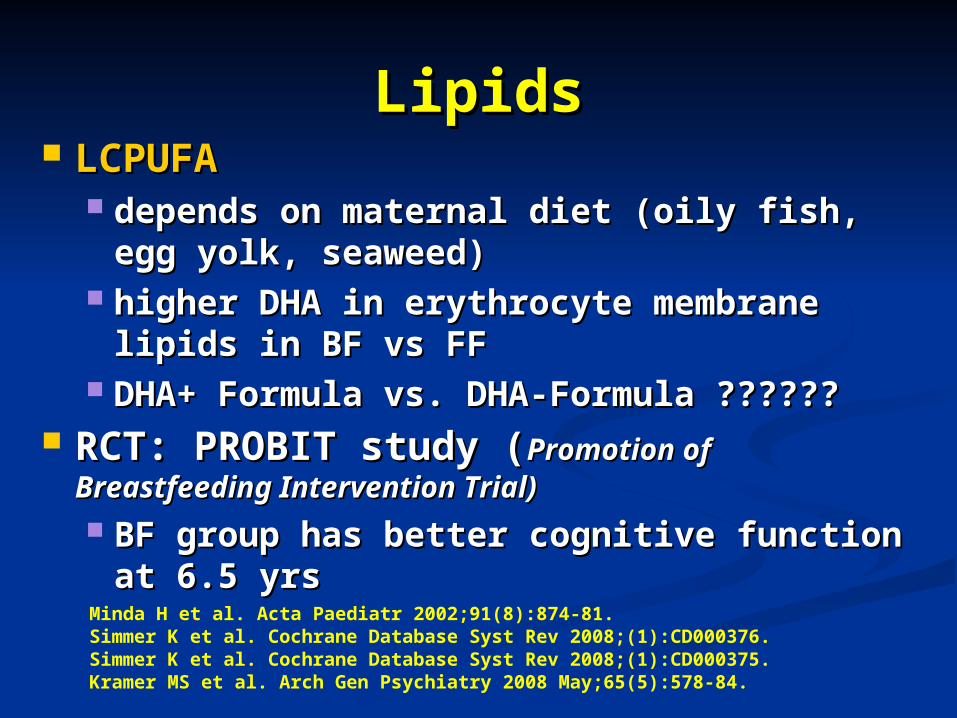
DHA+ Formula vs. DHA-Formula ??????DHA+ Formula vs. DHA-Formula ?????? RCT: PROBIT study (RCT: PROBIT study (Promotion of Promotion of
Breastfeeding Intervention Trial)Breastfeeding Intervention Trial) BF group has better cognitive function BF group has better cognitive function
at 6.5 yrsat 6.5 yrsMinda H et al. Acta Paediatr 2002;91(8):874-81.Simmer K et al. Cochrane Database Syst Rev 2008;(1):CD000376.Simmer K et al. Cochrane Database Syst Rev 2008;(1):CD000375.Kramer MS et al. Arch Gen Psychiatry 2008 May;65(5):578-84.

prevalence of exclusive breastfeedingin the experimental and control group at 3 mo =43.3% vs 6.4%)

Nutrients in breast milkNutrients in breast milk
MacronutrientsMacronutrients Lipids: most important E source Lipids: most important E source
(50%)(50%) Protein:Protein: CarbohydrateCarbohydrate
MicronutrientsMicronutrients VitaminsVitamins MineralsMinerals

Fat-soluble vitaminsFat-soluble vitamins Vitamin AVitamin A
colostrum >> mature milk >>> cow’s milkcolostrum >> mature milk >>> cow’s milk retinol ester + carotenoids (retinol ester + carotenoids ( lutein, lutein,
zeaxanthine)zeaxanthine) Vitamin DVitamin D
lower than DRI but adequate if 2 hour/week lower than DRI but adequate if 2 hour/week sun exposuresun exposure
Vitamin EVitamin E colostrum >> mature milk >>> cow’s milkcolostrum >> mature milk >>> cow’s milk adequateadequate ((αα-tocopherol:PUFA ratio 0.79 mg/gm)-tocopherol:PUFA ratio 0.79 mg/gm)
Vitamin KVitamin K Universal vit K 1 mg IM at birth to prevent Universal vit K 1 mg IM at birth to prevent
hemorrhagic disease of newbornhemorrhagic disease of newborn

Water-soluble vitaminsWater-soluble vitamins
depends on maternal diet > fat-depends on maternal diet > fat-soluble vitaminssoluble vitamins
Vitamin CVitamin C High in breast milk >>> cow’s milkHigh in breast milk >>> cow’s milk
Vitamin BVitamin B groupgroup Adequate exc. Vegan mother (B6, Adequate exc. Vegan mother (B6,
B12)B12) Mother with B1 deficiency, Mother with B1 deficiency,
thiaminase containing diets thiaminase containing diets

MineralsMinerals
Breast milk has low osmolarity, renal Breast milk has low osmolarity, renal solute loadsolute load
Adequate Na, K, ClAdequate Na, K, Cl Lower Ca than cow’s milk but good Lower Ca than cow’s milk but good
absorptionabsorption, Ca:P ratio 2:1, Ca:P ratio 2:1 Inadequate Ca, P for premature infantsInadequate Ca, P for premature infants High bioavailability of trace elementHigh bioavailability of trace element Fe 20-50% availability, adequate for Fe 20-50% availability, adequate for
‘healthy full-term’ infants until 6 mos.‘healthy full-term’ infants until 6 mos.

Influence of maternal diet on milk Influence of maternal diet on milk compositioncomposition
Little or no effectLittle or no effect Lactose concentrationLactose concentration Macromineral concentration (Ca, P, Mg)Macromineral concentration (Ca, P, Mg) Some trace elements (Fe, Zn, Cu)Some trace elements (Fe, Zn, Cu) Electrolytes (Na, K, Cl)Electrolytes (Na, K, Cl)
Minimal effect, except severe malnutritionMinimal effect, except severe malnutrition Protein (conc./composition)Protein (conc./composition) Non-protein nitrogen (conc./composition)Non-protein nitrogen (conc./composition)
Influenced by maternal dietInfluenced by maternal diet Fatty acid content and compositionFatty acid content and composition
LCPUFA, trans-fatty acidsLCPUFA, trans-fatty acids Mn, I, SeMn, I, Se Water-soluble vitamin (Vit C, B1, B2, B6, B12, Water-soluble vitamin (Vit C, B1, B2, B6, B12,
niacin)niacin) Fat-soluble vitamin (A,D,E,K)Fat-soluble vitamin (A,D,E,K)
Donovan SM. In: Duggan C, Watkins JB, Walker WA, editors. Nutrition in Pediatrics: Basic science and clinical applications. 4th ed. 2008. p. 341-54.
Production of breast milk is robust! Breast milk still contain protective factors regardless.
Who should we give ‘extra’ supplement to ??? A. Mother B. Baby

Non-nutritive factors in Non-nutritive factors in breast milkbreast milk
Secretary IgASecretary IgA (90% of total Ab) (90% of total Ab) very high in colostrum 0.2-1.2 gm/dL (twice very high in colostrum 0.2-1.2 gm/dL (twice
adult sIgA produced per day), 0.1 gm/dL in adult sIgA produced per day), 0.1 gm/dL in mature milkmature milk
Protects mucosal surfaces eg gut, respiratory Protects mucosal surfaces eg gut, respiratory tract immediately after birthtract immediately after birth
Composed of specific antibodies against Composed of specific antibodies against bacteria that mother has encountered in the bacteria that mother has encountered in the environment (appear in milk around 1 day after environment (appear in milk around 1 day after mother infected)mother infected)
Infant starts to make its own SIgA after some Infant starts to make its own SIgA after some weeks weeks takes much longer in less exposed takes much longer in less exposed infantsinfants

Secretary IgA in breast milkSecretary IgA in breast milk
the secretory component protects them from digestion 2-4 grams sIgA per litre presents in infant’s stool

Non-nutritive factors in Non-nutritive factors in breast milkbreast milk
Living immunityLiving immunity Macrophages and neutrophils
May protect mammary gland against infectious mastitis
May kill microbes in baby’s gut Macrophages make lysozyme secreted in milk
Lymphocytes – B and T cells May enter infant’s body and transfer immune
functions mother’s cells tolerated by baby enhanced response to vaccines increased tolerance to kidney transplant from
mother

Non-nutritive factors in Non-nutritive factors in breast milkbreast milk
LactoferrinLactoferrin binds iron which inhibits binds iron which inhibits bacterial growth, kills bacteria, viruses bacterial growth, kills bacteria, viruses and Candidaand Candida
LysozymeLysozyme breaks down cell walls of many bacteria
OligosaccharidesOligosaccharides stop bacteria attaching to epithelium, prebiotics effects
NucleotidesNucleotides building blocks of nucleic acids; enhance maturation of immune system
Non-nutritive factors in Non-nutritive factors in breast milkbreast milk
> 100 cytokines+immunomodulatory > 100 cytokines+immunomodulatory factorsfactors do not cause inflammation do not cause inflammation e.g TGF-e.g TGF-ββ ((Transforming Growth Factor beta)
Epidermal growth factorsEpidermal growth factors Hormones: leptin, thyroid hormones, Hormones: leptin, thyroid hormones,
erythropoietin, prolactinerythropoietin, prolactin Enzymes: bile salt-stimulated lipaseEnzymes: bile salt-stimulated lipase

How to maintain adequate How to maintain adequate milk supply?milk supply?

How to maintain adequate How to maintain adequate milk supply?milk supply?
Prolactin & Prolactin & OxytocinOxytocin

How to maintain adequate How to maintain adequate milk supply?milk supply?
Early stage:Early stage: Frequent + effective nursingFrequent + effective nursing
Every 1-3 hours esp. during the night!!!Every 1-3 hours esp. during the night!!! Rooming-in + maternal confidence/supportRooming-in + maternal confidence/support
Later stage (after 4-6 weeks)Later stage (after 4-6 weeks) LOCAL LOCAL control:control:
Breast emptying (one at a time!)Breast emptying (one at a time!) Demand & supplyDemand & supply
Full breast Slower milk production
Empty breast Faster milk production

What to eat during What to eat during lactation?lactation?
Exclusive breast feeding mother needExclusive breast feeding mother need Extra energy 500 kcal/day, protein 15-25 Extra energy 500 kcal/day, protein 15-25
gm/daygm/day Adequate waterAdequate water Beware of maternal malnutritionBeware of maternal malnutrition
vitamin B group e.g. Bvitamin B group e.g. B11, B, B1212
vitamin Dvitamin D Calcium, Phosphorus, Iron, Copper, Calcium, Phosphorus, Iron, Copper,
Folate, Iodine22Folate, Iodine22

What to eat during What to eat during lactation?lactation?
Hypoallergenic diet ????Hypoallergenic diet ???? Diary product, fish, egg, peanut Diary product, fish, egg, peanut
avoidance during lactationavoidance during lactation
Galactogogue ???Galactogogue ???

Breastfeeding to prevent Breastfeeding to prevent
“double burden” of “double burden” of malnutritionmalnutrition

Slow weight gain in Slow weight gain in breastfed babybreastfed baby
BF baby BF baby normal/faster growth in normal/faster growth in 11stst 4-6 months 4-6 months
Then slower growth rate Then slower growth rate become become leaner than FF baby by the end of leaner than FF baby by the end of 11stst year year
Weight deviate from standard Weight deviate from standard growth chart (combine FF>>BF)!growth chart (combine FF>>BF)!
WHO child growth standard WHO child growth standard (http://www.who.int/childgrowth/)(http://www.who.int/childgrowth/)
Dewey et al. Pediatrics 1992; 89: 1035-41Dewey KG. Pediatr Clin North Am 2001; 48: 87-104


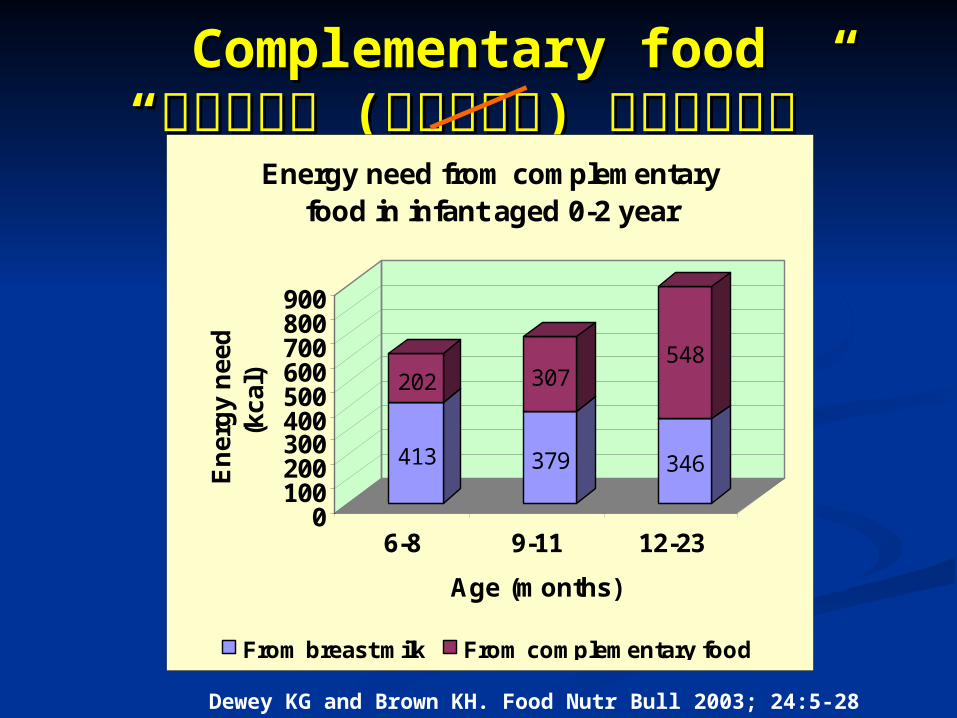
Complementary foodComplementary food““อาหารอาหาร ((เสรมเสรม) ) ตามวั ยตามวั ย””
413
202
379
307
346
548
0100200300400500600700800900
En
erg
y n
eed
(k
cal)
6-8 9-11 12-23
Age (months)
Energy need from complementary food in infant aged 0-2 year
From breast milk From complementary food
Dewey KG and Brown KH. Food Nutr Bull 2003; 24:5-28

Some problem nutrients Some problem nutrients in BM?in BM?

BF vs IronBF vs Iron????????

e.e.

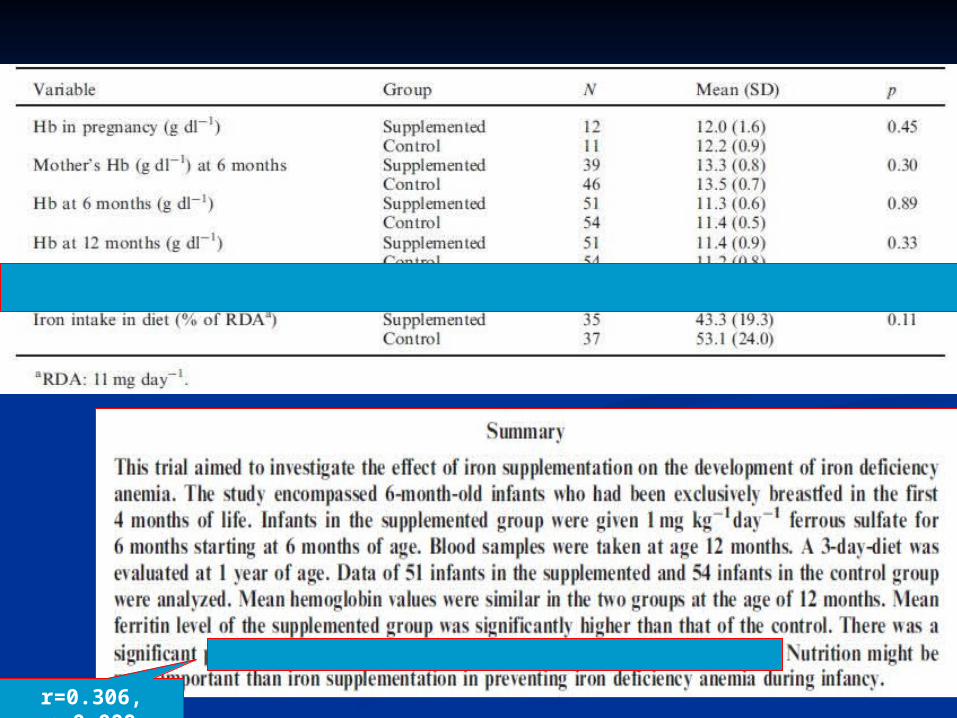
r=0.306, p=0.009

How to prevent iron deficiency in Thai How to prevent iron deficiency in Thai infants?infants?
Prevention of maternal iron Prevention of maternal iron deficiency/anemia during pregnancy?deficiency/anemia during pregnancy?
Delayed cord clamping?Delayed cord clamping? Screening in infants at risk?Screening in infants at risk? Iron supplement medication?Iron supplement medication?
Iron tolerance and complianceIron tolerance and compliance Adverse effect of iron e.g. saturation of Adverse effect of iron e.g. saturation of
lactoferrinlactoferrin Food fortification?Food fortification?

Advice re: complementary food high Advice re: complementary food high in iron!in iron!
How to prevent iron deficiency in Thai How to prevent iron deficiency in Thai infants?infants?

Long term effect of Long term effect of breastfeeding in obesitybreastfeeding in obesity preventionprevention

Early life risk factors for obesity Early life risk factors for obesity in childhoodin childhood
John J Reilly, Andrea Sherriff ,et al. Early life risk factors for obesity in childhood: cohort study. BMJ 2005;10:1-7.
Obesity Obesity
Intrauterine & perinatal- Birthweight (low and high)- Maternal smoking
Infant feeding and weaning practice -Breast feeding (lack of)-Time of introduce complementary food (too soon)
Family characteristics and demographics- Parental obese
Lifestyle in early childhood-Sleep pattern-Sedentary behavior-Dietary pattern

Potential causes for the protective Potential causes for the protective effects ofeffects of
breastfeeding on later obesitybreastfeeding on later obesity
Modulating child behavior BF infantBF infant
Different suckling Different suckling patternpattern
Higher suckling Higher suckling frequencyfrequency
Greater degree of Greater degree of control on meal size & control on meal size & intervalinterval
BM BM Varies taste & smell >> Varies taste & smell >>
programmed to different programmed to different food selection & dietary food selection & dietary habit in later lifehabit in later life
Early growth and substrate supply
BM Lower average
caloric density Lower protein intake
per kg bodyweight Slower growth rate
in the 1st year

http://themedicalbiochemistrypage.org/gut-brain.php
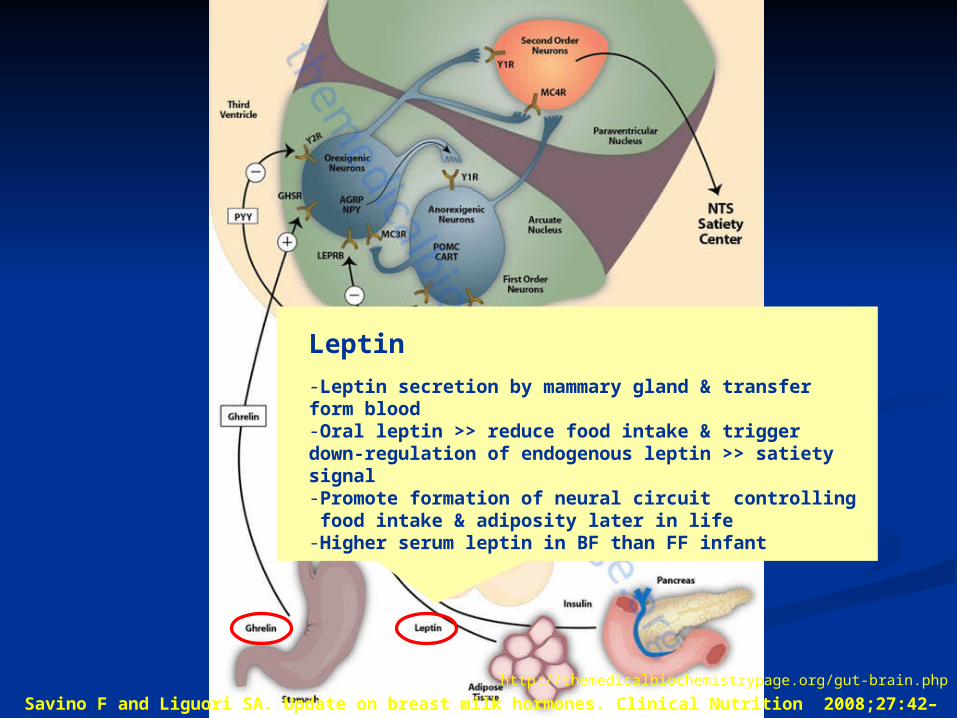
http://themedicalbiochemistrypage.org/gut-brain.php
Leptin
-Leptin secretion by mammary gland & transfer form blood-Oral leptin >> reduce food intake & trigger down-regulation of endogenous leptin >> satiety signal -Promote formation of neural circuit controlling food intake & adiposity later in life-Higher serum leptin in BF than FF infant
Savino F and Liguori SA. Update on breast milk hormones. Clinical Nutrition 2008;27:42–47.

http://themedicalbiochemistrypage.org/gut-brain.php
Savino F and Liguori SA. Update on breast milk hormones. Clinical Nutrition 2008;27:42–47.
Ghrelin
-Influence on growth in first months of life- Higher seum ghrelin conc >> inc. appetite-Only in FF infant a positve correlation between serum ghrelin level fasting time emerged

Early protein intake and later Early protein intake and later obesity riskobesity risk
Berthold Koletzko. Am J Clin Nutr 2009;89(suppl):1502S–8S.
Protein supply
Insulin releasing amino acid
Increase insulin & IGF1
Rapid weight gain Adipogenic activity

ObjectiveObjective To examine the influence of initial infant feeding on obesity in To examine the influence of initial infant feeding on obesity in
later lifelater life MethodsMethods
A systematic review of published studies investigating the A systematic review of published studies investigating the association between infant feeding and a measure of obesity association between infant feeding and a measure of obesity was performed with Medline (1966 onward) and Embase (1980 was performed with Medline (1966 onward) and Embase (1980 onward) databasesonward) databases
ResultsResults Sixty-one studies reported on the relationship of infant feeding to Sixty-one studies reported on the relationship of infant feeding to
a measure of obesity in later lifea measure of obesity in later life of these, 28 (298 900 subjects) provided odds ratio estimatesof these, 28 (298 900 subjects) provided odds ratio estimates
Christopher G, Derek G. Cook, et al. Effect of Infant Feeding on the Risk of Obesity Across the Life Course:A Quantitative Review of Published Evidence. Pediatrics 2005;115;1367-1377.

breastfeeding was associated with a reduced risk of obesity, compared with formula feeding (odds ratio: 0.87; 95% confidence interval [CI]: 0.85– 0.89) WHO 2013 review OR 0.88
(0.83-0.93)

Michael S. Kramer, Stanley Shapiro,et al. J. Nutr. 2009;139: 417S–421S.
prevalence of exclusive breastfeedingin the experimental and control group at 3 mo =43.3% vs 6.4%)

Conclusion :
we found no effect of prolonged and exclusivebreast-feeding on height, adiposity, or BP in Belarusian earlyschool-age children
Michael S. Kramer, Stanley Shapiro,et al. J. Nutr. 2009;139: 417S–421S.
Probably too young to see the effects on body fat accumulation !
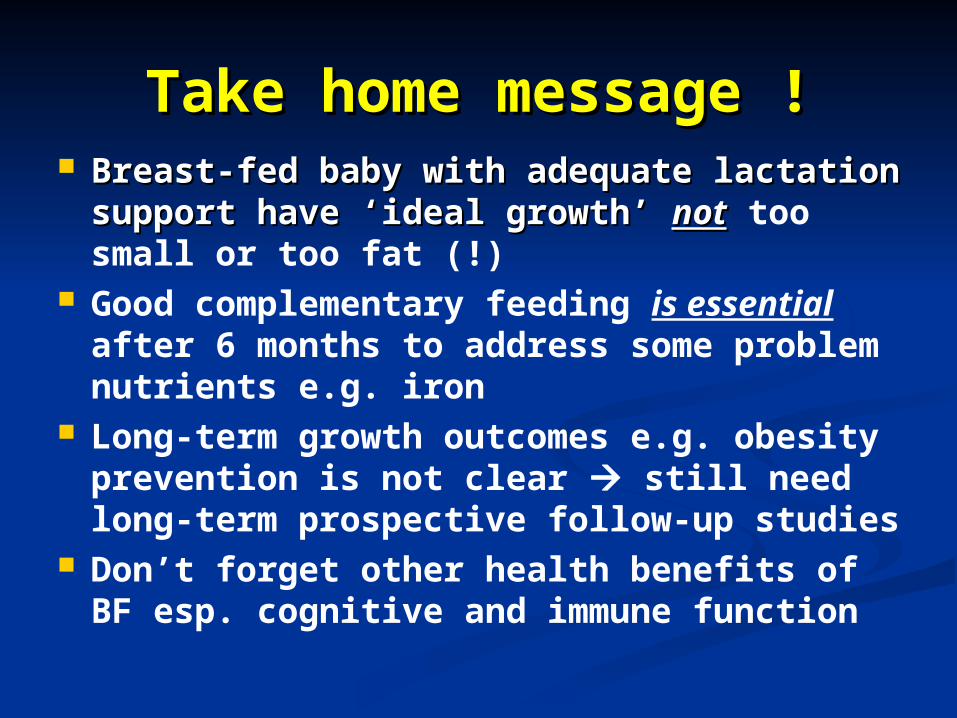
Take home message !Take home message ! Breast-fed baby with adequate lactation Breast-fed baby with adequate lactation
support have ‘ideal growth’support have ‘ideal growth’ notnot too small or too fat (!)
Good complementary feeding is essential after 6 months to address some problem nutrients e.g. iron
Long-term growth outcomes e.g. obesity prevention is not clear still need long-term prospective follow-up studies
Don’t forget other health benefits of BF esp. cognitive and immune function

Thank you for your kind Thank you for your kind attention!attention!