Embed Size (px)
Citation preview
Supporting healthcareprofessionals for over 150 years
Supporting healthcareprofessionals for over 150 years
Investor PresentationNovember - December 2017

Forward looking statements
This document may contain forward-looking statements that may or may not prove accurate. For example,statements regarding expected revenue growth and trading margins, market trends and our product pipeline areforward-looking statements. Phrases such as “aim”, “plan”, “intend”, “anticipate”, “well-placed”, “believe”, “estimate”,“expect”, “target”, “consider” and similar expressions are generally intended to identify forward-looking statements.Forward-looking statements involve known and unknown risks, uncertainties and other important factors that couldcause actual results to differ materially from what is expressed or implied by the statements. For Smith & Nephew,these factors include: economic and financial conditions in the markets we serve, especially those affecting healthcare providers, payers and customers; price levels for established and innovative medical devices; developments inmedical technology; regulatory approvals, reimbursement decisions or other government actions; product defects orrecalls; litigation relating to patent or other claims; legal compliance risks and related investigative, remedial orenforcement actions; strategic actions, including acquisitions and dispositions, our success in performing duediligence, valuing and integrating acquired businesses; disruption that may result from transactions or otherchanges we make in our business plans or organisation to adapt to market developments; and numerous othermatters that affect us or our markets, including those of a political, economic, business, competitive or reputationalnature. Please refer to the documents that Smith & Nephew has filed with the U.S. Securities and ExchangeCommission under the U.S. Securities Exchange Act of 1934, as amended, including Smith & Nephew’s most recentannual report on Form 20-F, for a discussion of certain of these factors.
Any forward-looking statement is based on information available to Smith & Nephew as of the date of thestatement. All written or oral forward-looking statements attributable to Smith & Nephew are qualified by thiscaution. Smith & Nephew does not undertake any obligation to update or revise any forward-looking statement toreflect any change in circumstances or in Smith & Nephew’s expectations.
2
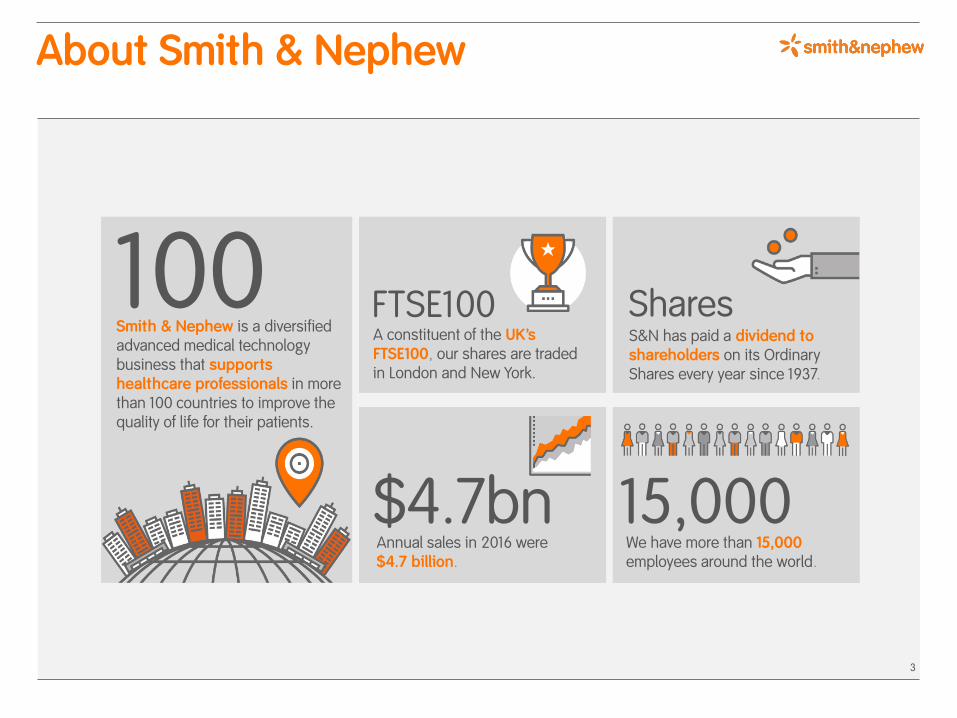
About Smith & Nephew
Smith & Nephew is a diversified advanced medical technology business that supportshealthcare professionals in more than 100 countries to improve the quality of life for their patients.
A constituent of the UK’s FTSE100, our shares are traded in London and New York.
FTSE100S&N has paid a dividend to shareholders on its Ordinary Shares every year since 1937.
Shares
Annual sales in 2016 were $4.7 billion.
$4.7bnWe have more than 15,000employees around the world.
15,000
100
3
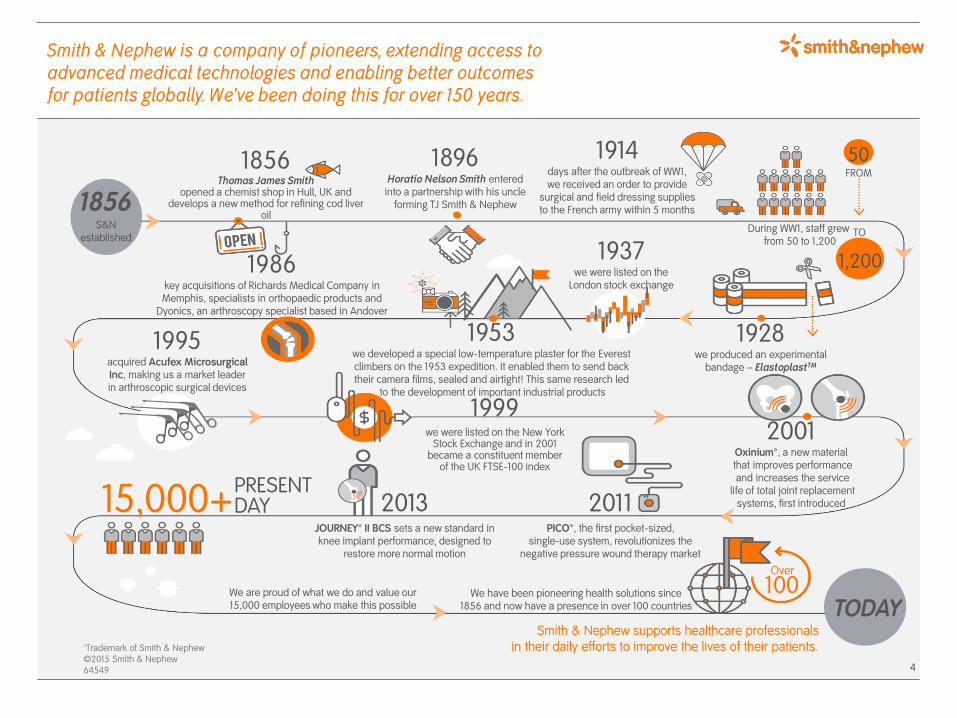
Smith & Nephew is a company of pioneers, extending access to advanced medical technologies and enabling better outcomes for patients globally. We’ve been doing this for over 150 years.
Smith & Nephew supports healthcare professionals in their daily efforts to improve the lives of their patients.™Trademark of Smith & Nephew
©2015 Smith & Nephew64549
1856S&N
established
TODAY
1856Thomas James Smith
opened a chemist shop in Hull, UK anddevelops a new method for refining cod liver
oil
1896Horatio Nelson Smith entered
into a partnership with his uncle forming TJ Smith & Nephew
1914days after the outbreak of WW1, we received an order to provide
surgical and field dressing supplies to the French army within 5 months
50FROM
TO
1,2001986key acquisitions of Richards Medical Company inMemphis, specialists in orthopaedic products and
Dyonics, an arthroscopy specialist based in Andover
1937we were listed on the
London stock exchange
1995acquired Acufex Microsurgical Inc, making us a market leader in arthroscopic surgical devices
1928we produced an experimental
bandage – ElastoplastTM
2001Oxinium™, a new materialthat improves performanceand increases the service
life of total joint replacementsystems, first introduced
1999we were listed on the New York
Stock Exchange and in 2001became a constituent member
of the UK FTSE-100 index
2011PICO™, the first pocket-sized,
single-use system, revolutionizes the negative pressure wound therapy market
2013JOURNEY™ II BCS sets a new standard inknee implant performance, designed to
restore more normal motion
We are proud of what we do and value our 15,000 employees who make this possible
We have been pioneering health solutions since 1856 and now have a presence in over 100 countries
15,000+PRESENTDAY
Over
100
1953we developed a special low-temperature plaster for the Everestclimbers on the 1953 expedition. It enabled them to send backtheir camera films, sealed and airtight! This same research led
to the development of important industrial products
During WW1, staff grewfrom 50 to 1,200
4
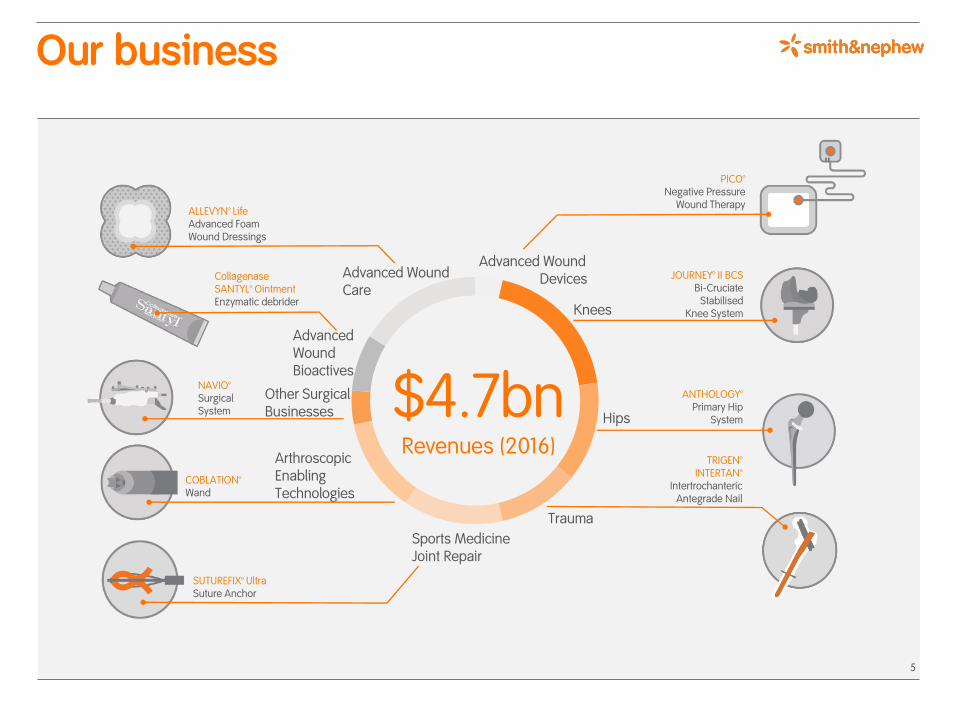
Our business
Advanced WoundCare
Advanced WoundBioactives
Other SurgicalBusinesses
Arthroscopic Enabling Technologies
Sports MedicineJoint Repair
Trauma
Hips
Knees
Advanced WoundDevices
ALLEVYN™ LifeAdvanced Foam Wound Dressings
CollagenaseSANTYL™ OintmentEnzymatic debrider
NAVIO™Surgical System
COBLATION™Wand
SUTUREFIX™ UltraSuture Anchor
PICO™Negative Pressure
Wound Therapy
JOURNEY™ II BCSBi-Cruciate
StabilisedKnee System
$4.7bnRevenues (2016)
ANTHOLOGY™Primary Hip
System
TRIGEN™ INTERTAN™
IntertrochantericAntegrade Nail
5
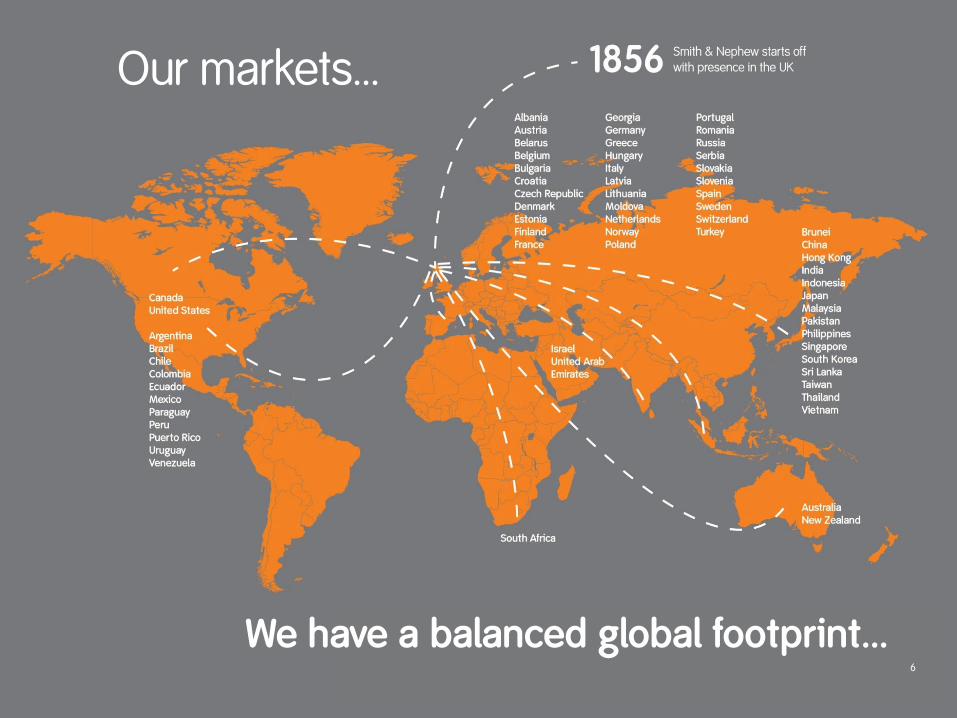
We have a balanced global footprint…
Our markets…
6
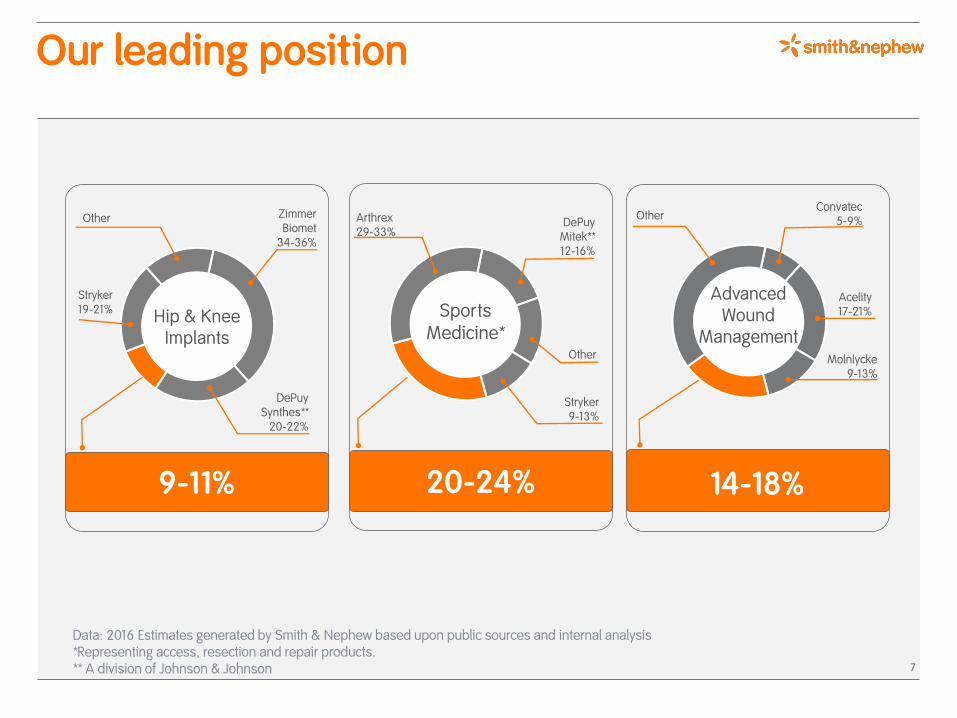
Our leading position
7
Hip & KneeImplants
Other
Stryker19-21%
ZimmerBiomet
34-36%
DePuySynthes**
20-22%
SportsMedicine*
Arthrex29-33%
DePuyMitek**12-16%
Other
Stryker9-13%
AdvancedWound
Management
OtherConvatec
5-9%
Acelity17-21%
Molnlycke9-13%
9-11% 20-24% 14-18%
Data: 2016 Estimates generated by Smith & Nephew based upon public sources and internal analysis *Representing access, resection and repair products. ** A division of Johnson & Johnson

Our market growth drivers
DemographicsEmerging Markets Technology
EconomicsPrevalence Lifestyle
8
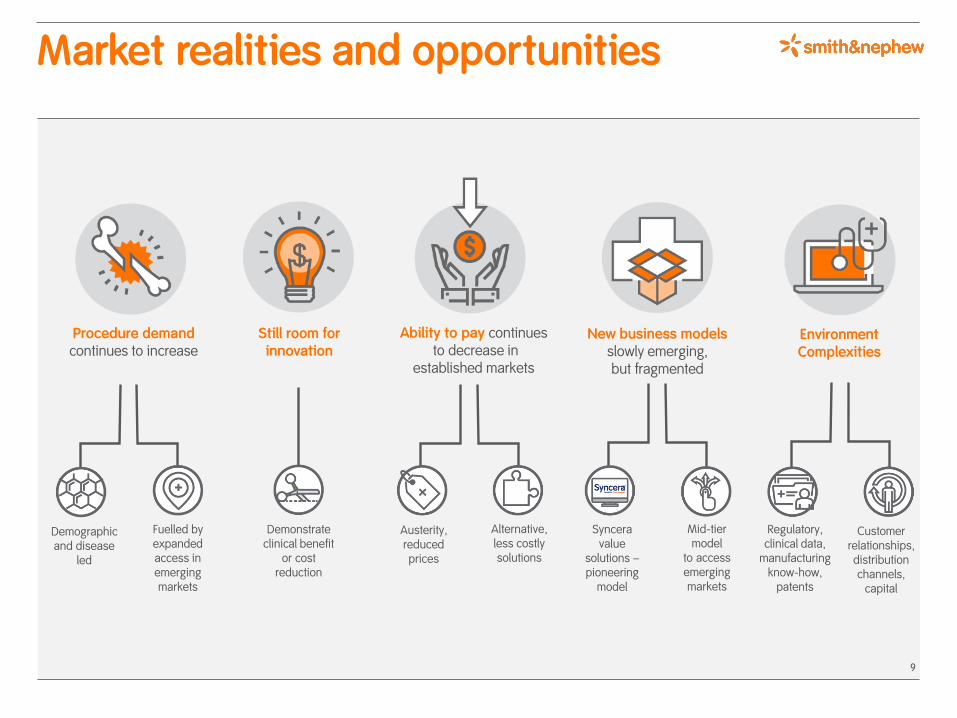
Market realities and opportunities
Procedure demand continues to increase
Still room for innovation
Ability to pay continuesto decrease in
established markets
New business models slowly emerging, but fragmented
Environment Complexities
Fuelled by expanded access in emerging markets
Demonstrate clinical benefit
or cost reduction
Regulatory, clinical data,
manufacturing know-how,
patents
Alternative, less costly solutions
Austerity, reduced prices
Mid-tier model
to access emerging markets
Synceravalue
solutions –pioneering
model
Demographic and disease
led
9
Customer relationships, distribution channels,
capital
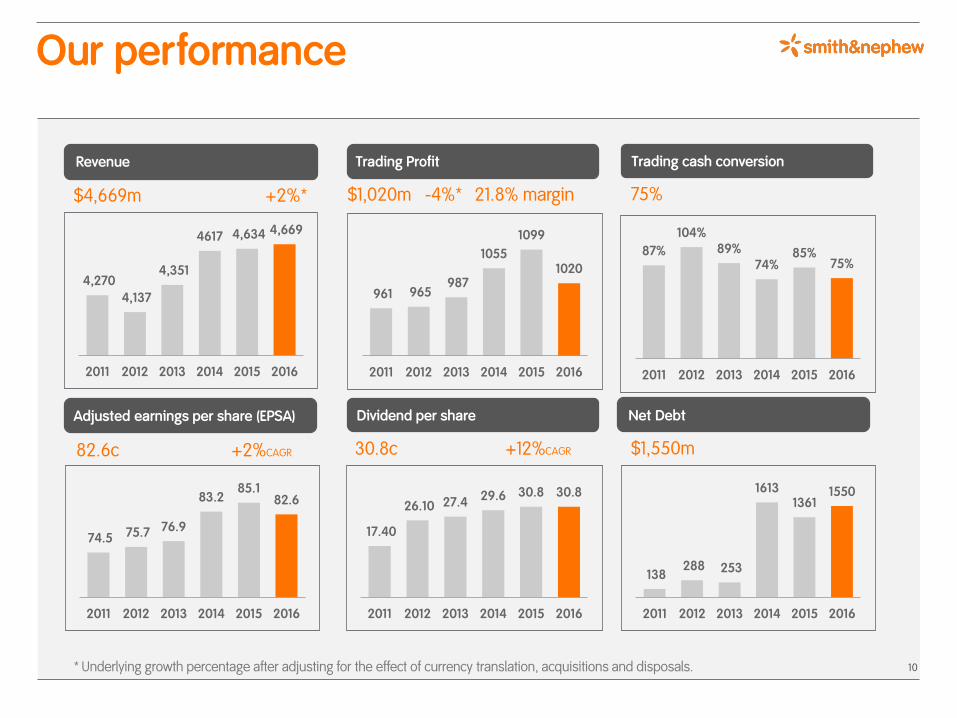
75%
Our performance
$4,669m +2%* $1,020m -4%* 21.8% margin
$1,550m82.6c +2%CAGR 30.8c +12%CAGR
4,270
4,137
4,351
4617 4,634 4,669
2011 2012 2013 2014 2015 2016
961 965 987
1055
1099
1020
2011 2012 2013 2014 2015 2016
87%
104%89%
74%85%
75%
2011 2012 2013 2014 2015 2016
74.5 75.7 76.9
83.285.1
82.6
2011 2012 2013 2014 2015 2016
17.40
26.10 27.4 29.6 30.8 30.8
2011 2012 2013 2014 2015 2016
138 288 253
16131361
1550
2011 2012 2013 2014 2015 2016
* Underlying growth percentage after adjusting for the effect of currency translation, acquisitions and disposals. 10
Revenue Trading Profit Trading cash conversion
Adjusted earnings per share (EPSA) Dividend per share Net Debt

Our customers
Retail consumers,Patients
Payers, Administrators
Healthcare systems, Procurement groups
Nurses, Nurse specialists
Physicians, GPs
Surgeons
11
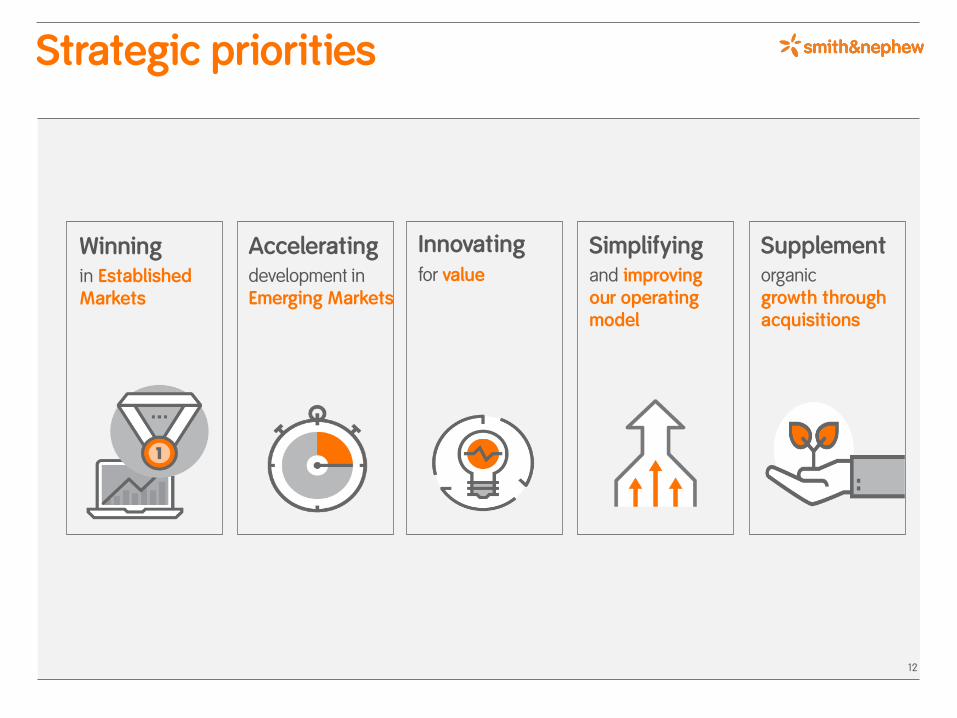
Strategic priorities
Winningin EstablishedMarkets
Acceleratingdevelopment in Emerging Markets
Innovating Simplifyingand improvingour operatingmodel
Supplementorganicgrowth throughacquisitions
for value
12
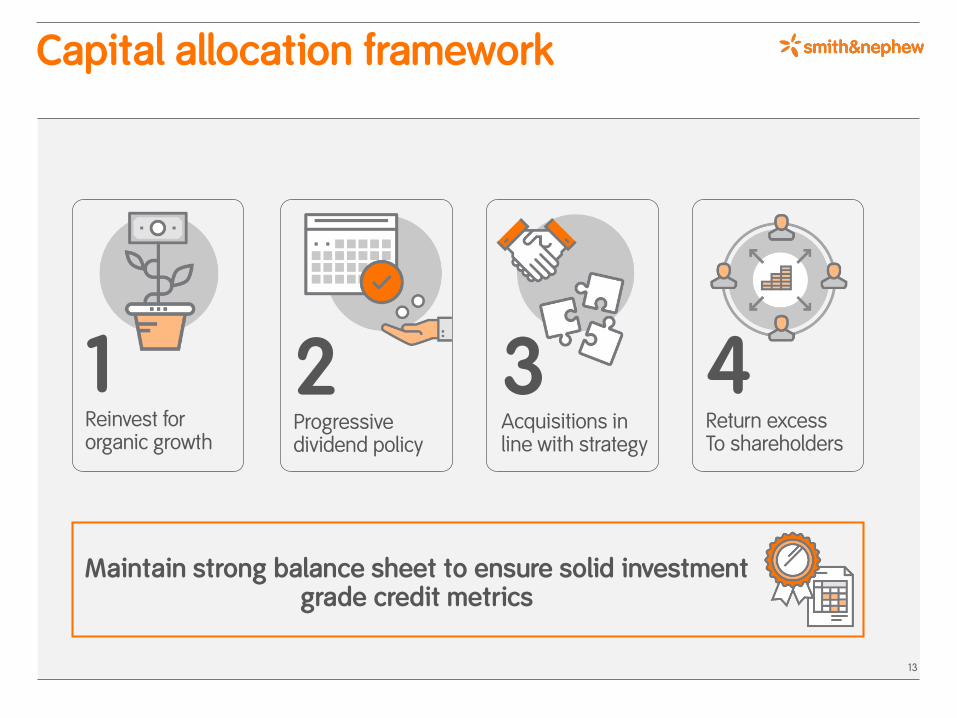
Capital allocation framework
4Return excessTo shareholders
Maintain strong balance sheet to ensure solid investmentgrade credit metrics
1Reinvest fororganic growth
2Progressivedividend policy
3Acquisitions inline with strategy
13

Revenue split
Q3 revenue growth of 3% underlying
14
9%
0%
2%
0% 5% 10%
8%
7%
-1%
1%
6%
6%
-2%
-3%
8%
-5% 0% 5% 10%
Geographical growth Product franchise growth
Emerging
Other Est
US
AWB
AWD
AWC
Hips
Knees
Trauma & Extremities
Other surgical
Arthroscopic Enabling Tech
Sports Medicine
Joint Repair
Note: ‘Other Est’ is Australia, Canada, Europe, Japan and New Zealand ‘Other Surgical’ includes ENT and robotics sales (excluding implant sales)
Revenue split
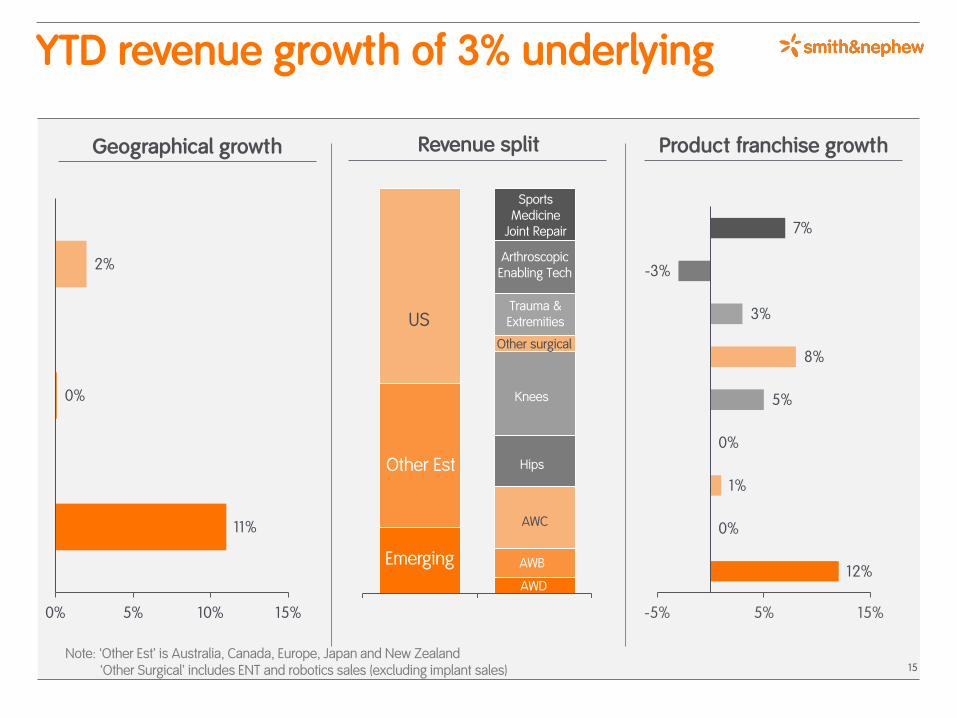
YTD revenue growth of 3% underlying
15
11%
0%
2%
0% 5% 10% 15%
12%
0%
1%
0%
5%
8%
3%
-3%
7%
-5% 5% 15%
Geographical growth Product franchise growth
Emerging
Other Est
US
AWB
AWD
AWC
Hips
Knees
Trauma & Extremities
Other surgical
Arthroscopic Enabling Tech
Sports Medicine
Joint Repair
Note: ‘Other Est’ is Australia, Canada, Europe, Japan and New Zealand ‘Other Surgical’ includes ENT and robotics sales (excluding implant sales)
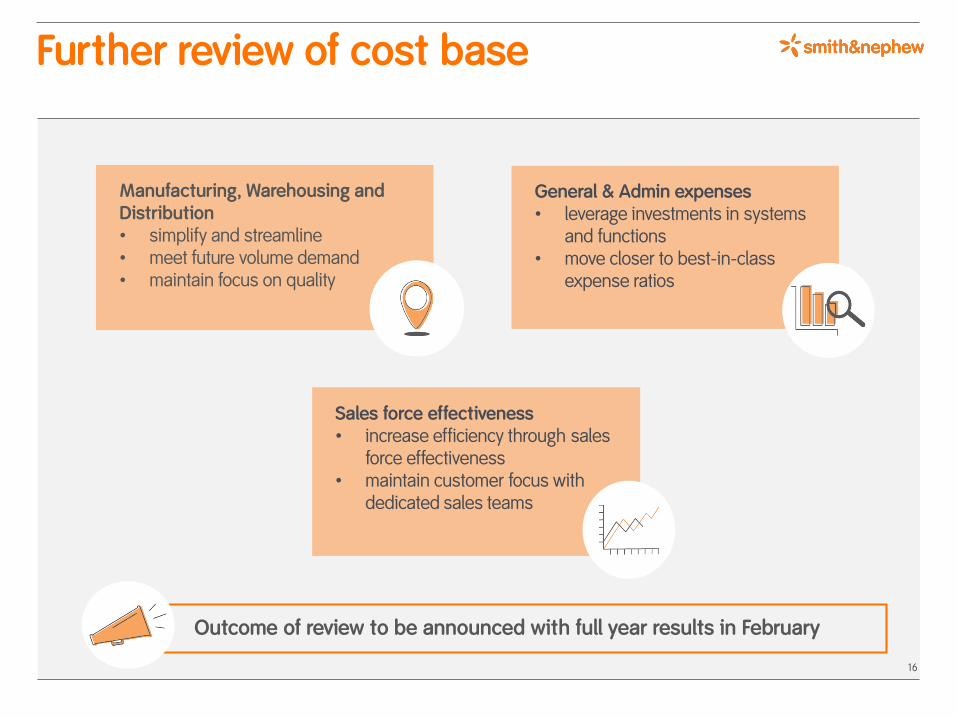
Further review of cost base
16
Outcome of review to be announced with full year results in February
General & Admin expenses• leverage investments in systems
and functions• move closer to best-in-class
expense ratios
Manufacturing, Warehousing and Distribution• simplify and streamline• meet future volume demand• maintain focus on quality
Sales force effectiveness• increase efficiency through sales
force effectiveness• maintain customer focus with
dedicated sales teams
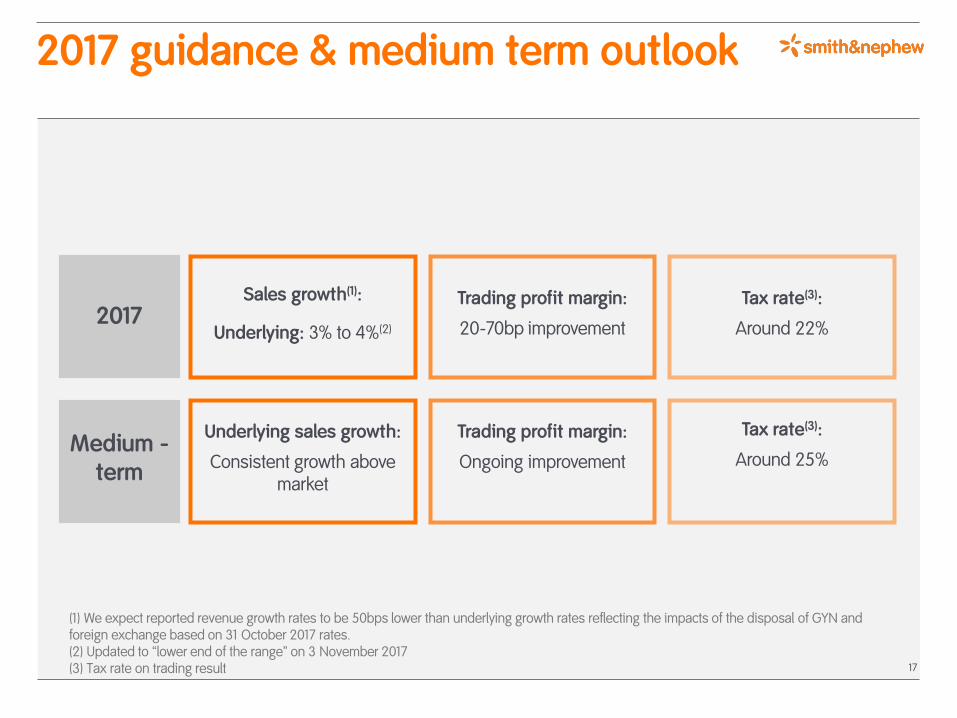
2017 guidance & medium term outlook
17
(1) We expect reported revenue growth rates to be 50bps lower than underlying growth rates reflecting the impacts of the disposal of GYN and foreign exchange based on 31 October 2017 rates. (2) Updated to “lower end of the range” on 3 November 2017(3) Tax rate on trading result
Trading profit margin:
20-70bp improvement
Tax rate(3):
Around 22%
Underlying sales growth:
Consistent growth above market
Trading profit margin:
Ongoing improvement
Tax rate(3):
Around 25%
2017
Medium -term
Sales growth(1):
Underlying: 3% to 4%(2)
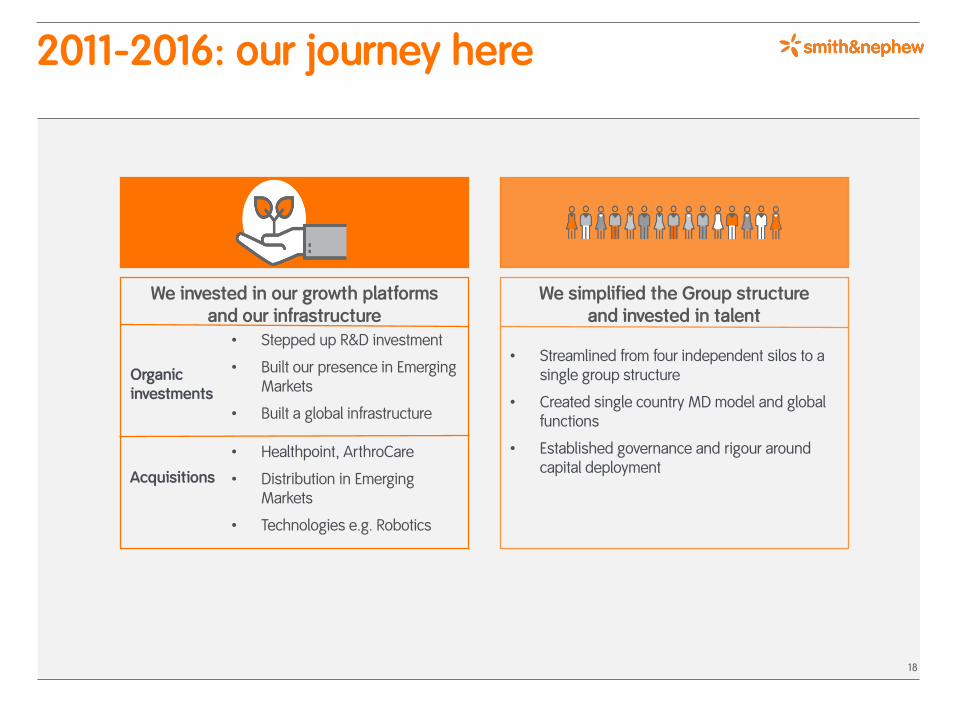
2011-2016: our journey here
We simplified the Group structureand invested in talent
• Streamlined from four independent silos to a single group structure
• Created single country MD model and global functions
• Established governance and rigour around capital deployment
We invested in our growth platformsand our infrastructure
• Stepped up R&D investment
• Built our presence in Emerging Markets
• Built a global infrastructure
• Healthpoint, ArthroCare
• Distribution in Emerging Markets
• Technologies e.g. Robotics
Organic investments
Acquisitions
18
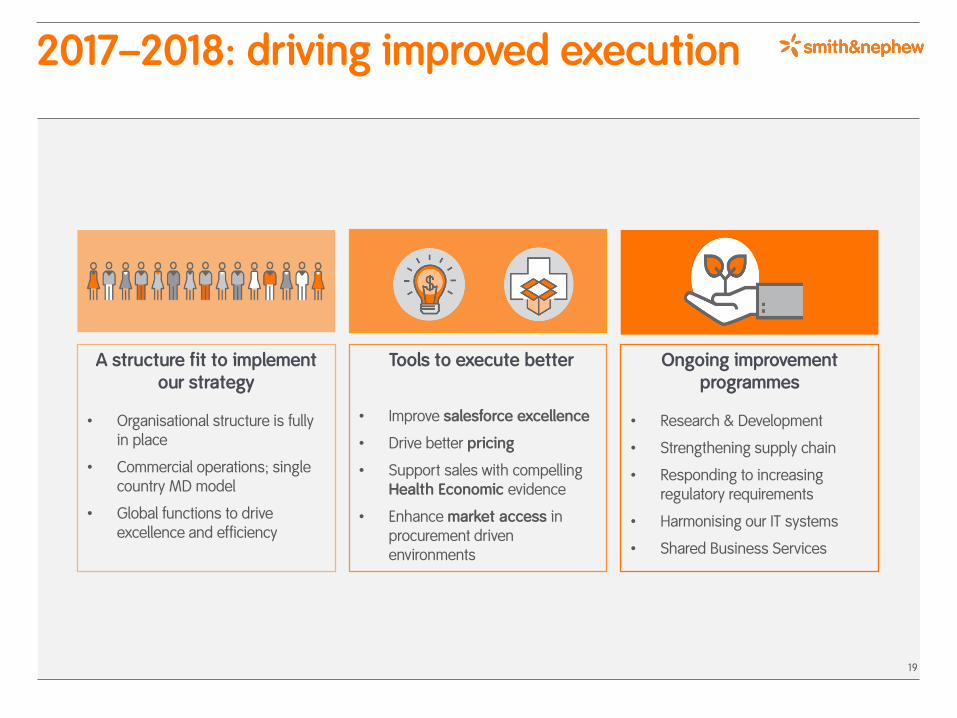
2017–2018: driving improved execution
Tools to execute better
• Improve salesforce excellence
• Drive better pricing
• Support sales with compelling Health Economic evidence
• Enhance market access in procurement driven environments
Ongoing improvement programmes
• Research & Development
• Strengthening supply chain
• Responding to increasing regulatory requirements
• Harmonising our IT systems
• Shared Business Services
A structure fit to implementour strategy
• Organisational structure is fully in place
• Commercial operations; single country MD model
• Global functions to drive excellence and efficiency
19
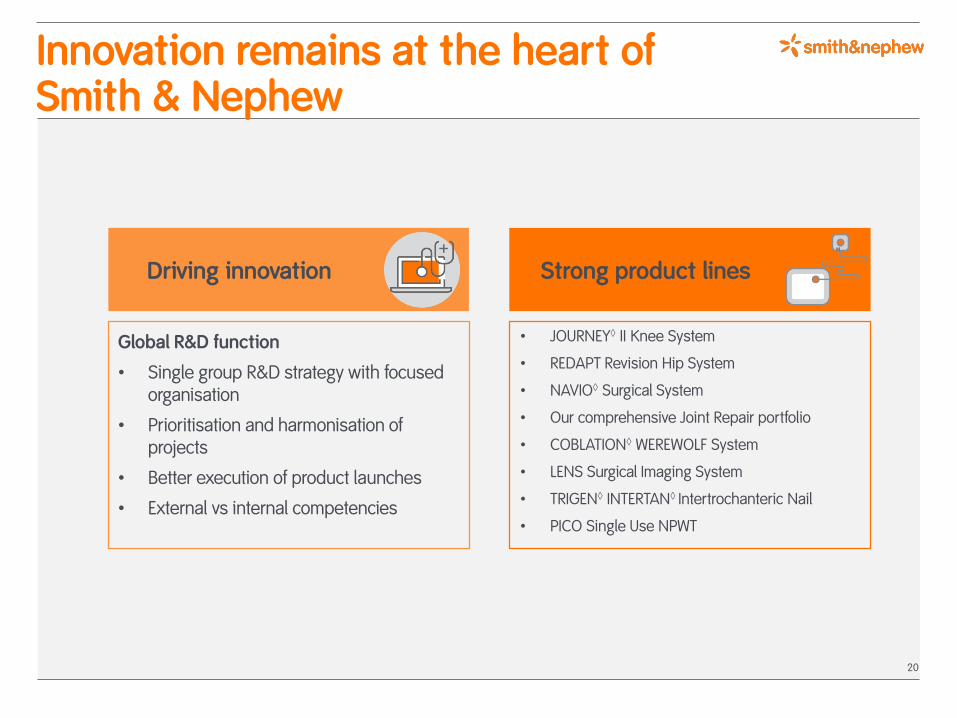
Innovation remains at the heart ofSmith & Nephew
20
• JOURNEY◊ II Knee System
• REDAPT Revision Hip System
• NAVIO◊ Surgical System
• Our comprehensive Joint Repair portfolio
• COBLATION◊ WEREWOLF System
• LENS Surgical Imaging System
• TRIGEN◊ INTERTAN◊ Intertrochanteric Nail
• PICO Single Use NPWT
Global R&D function
• Single group R&D strategy with focused organisation
• Prioritisation and harmonisation of projects
• Better execution of product launches
• External vs internal competencies
Strong product linesDriving innovation
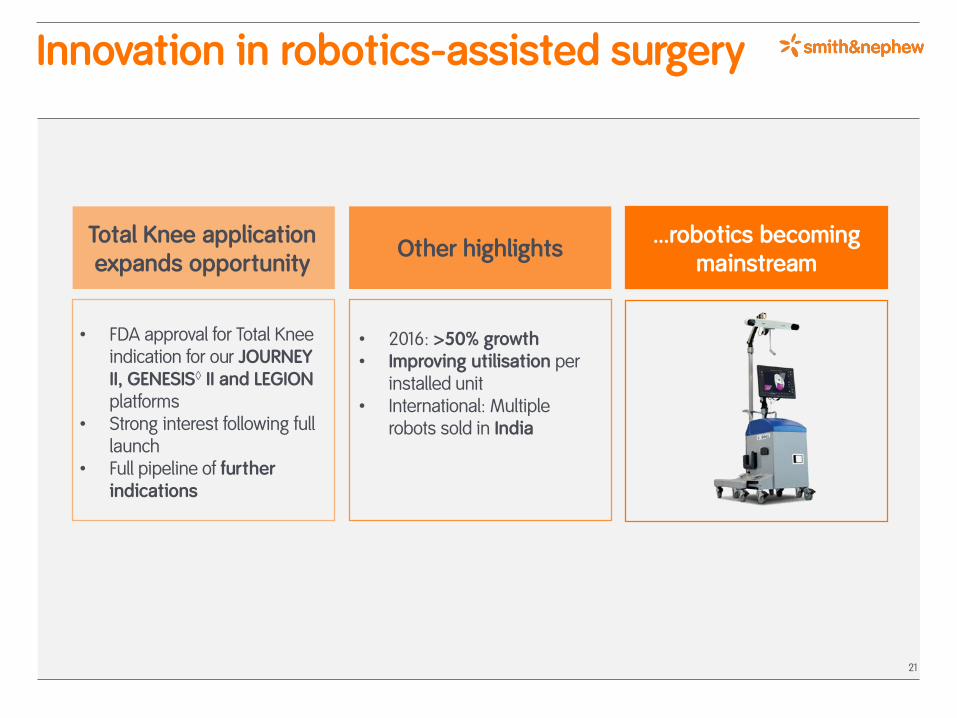
Innovation in robotics-assisted surgery
21
• 2016: >50% growth• Improving utilisation per
installed unit• International: Multiple
robots sold in India
• FDA approval for Total Knee indication for our JOURNEY II, GENESIS◊ II and LEGION platforms
• Strong interest following full launch
• Full pipeline of further indications
Total Knee application expands opportunity
Other highlights…robotics becoming
mainstream
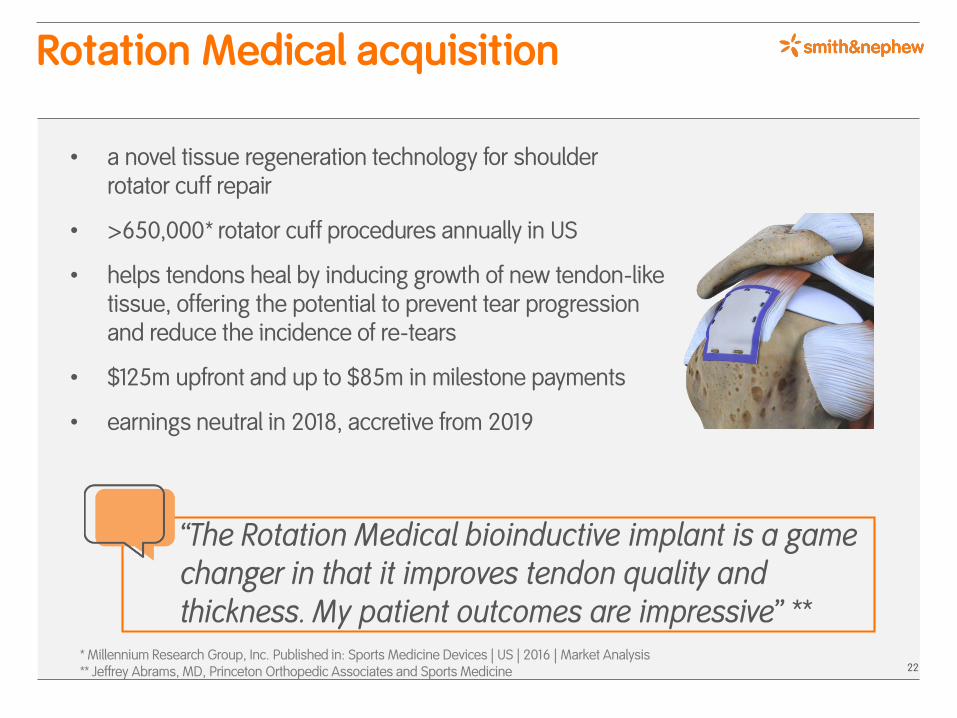
Rotation Medical acquisition
• a novel tissue regeneration technology for shoulder rotator cuff repair
• >650,000* rotator cuff procedures annually in US
• helps tendons heal by inducing growth of new tendon-like tissue, offering the potential to prevent tear progression and reduce the incidence of re-tears
• $125m upfront and up to $85m in milestone payments
• earnings neutral in 2018, accretive from 2019
22
“The Rotation Medical bioinductive implant is a game changer in that it improves tendon quality and thickness. My patient outcomes are impressive” **
* Millennium Research Group, Inc. Published in: Sports Medicine Devices | US | 2016 | Market Analysis** Jeffrey Abrams, MD, Princeton Orthopedic Associates and Sports Medicine
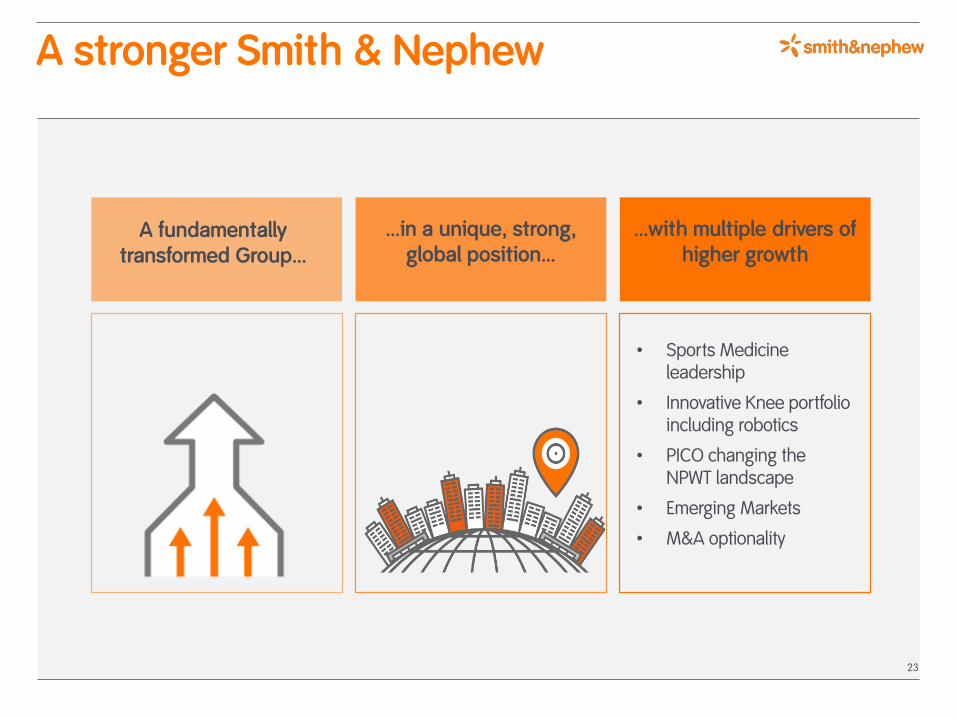
A stronger Smith & Nephew
A fundamentally transformed Group…
…in a unique, strong, global position…
…with multiple drivers of higher growth
• Sports Medicine leadership
• Innovative Knee portfolio including robotics
• PICO changing the NPWT landscape
• Emerging Markets
• M&A optionality
23
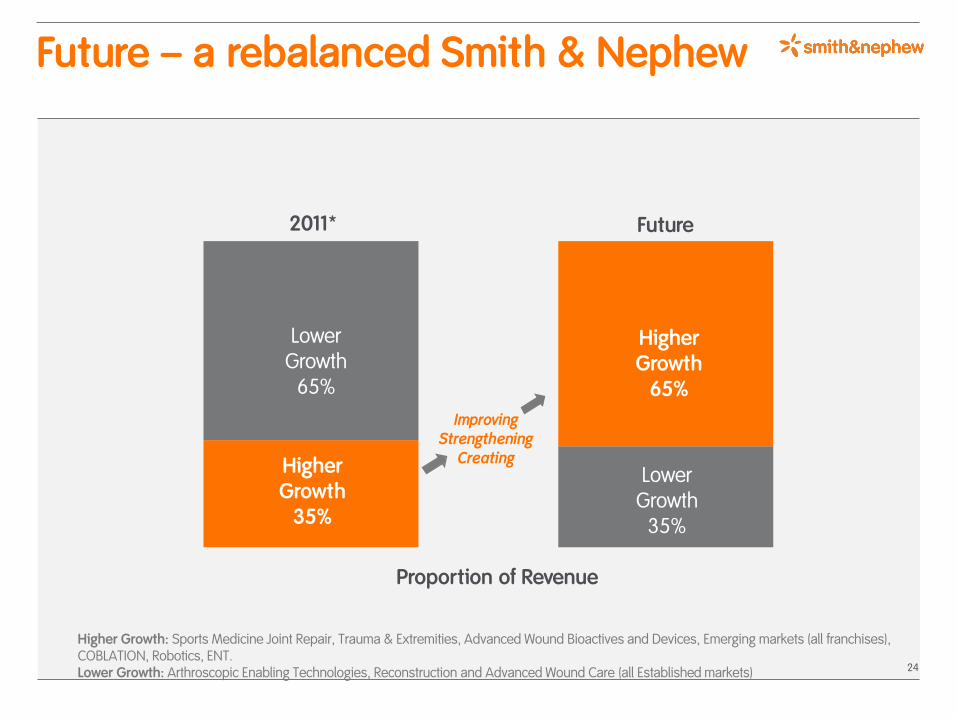
Future – a rebalanced Smith & Nephew
2011*
Lower Growth
65%
Higher Growth
35%
Higher Growth
65%
Lower Growth
35%
Proportion of Revenue
ImprovingStrengthening
Creating
Future
Higher Growth: Sports Medicine Joint Repair, Trauma & Extremities, Advanced Wound Bioactives and Devices, Emerging markets (all franchises), COBLATION, Robotics, ENT.Lower Growth: Arthroscopic Enabling Technologies, Reconstruction and Advanced Wound Care (all Established markets) 24

25
Appendices

2017 technical guidance
26
Guidance As of July 2017 Update
Restructuring costs Nil No change
Acquisition and integration costs c. $5m No change
Amortisation of acquisition intangibles c. $120m No change
Income from associates ~$0m No change
Net interest $50m - $55m No change
Other finance costs Similar to 2016 No change
Tax rate on Trading result c. 22% No change
Foreign exchange and other
Impact of disposal of GYN business on revenue ~80bps No change
Impact of translational FX on revenue +0.3% No change*
* Based on the foreign exchange rates prevailing on 31 October 2017
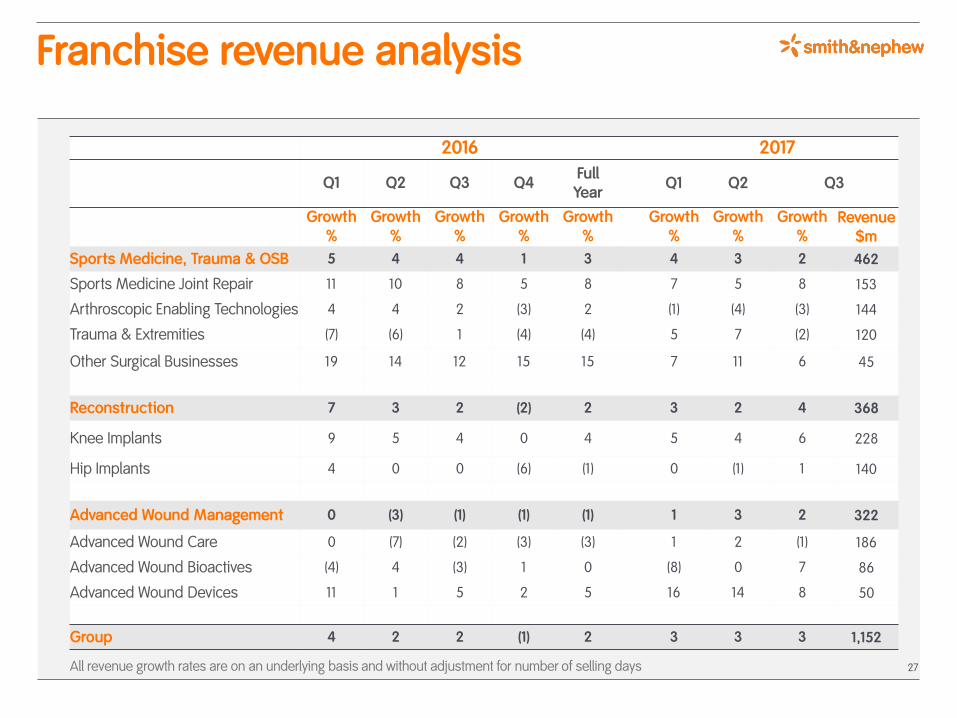
Franchise revenue analysis
27
2016 2017
Q1 Q2 Q3 Q4FullYear
Q1 Q2 Q3
Growth%
Growth%
Growth%
Growth%
Growth%
Growth %
Growth%
Growth%
Revenue$m
Sports Medicine, Trauma & OSB 5 4 4 1 3 4 3 2 462
Sports Medicine Joint Repair 11 10 8 5 8 7 5 8 153
Arthroscopic Enabling Technologies 4 4 2 (3) 2 (1) (4) (3) 144
Trauma & Extremities (7) (6) 1 (4) (4) 5 7 (2) 120
Other Surgical Businesses 19 14 12 15 15 7 11 6 45
Reconstruction 7 3 2 (2) 2 3 2 4 368
Knee Implants 9 5 4 0 4 5 4 6 228
Hip Implants 4 0 0 (6) (1) 0 (1) 1 140
Advanced Wound Management 0 (3) (1) (1) (1) 1 3 2 322
Advanced Wound Care 0 (7) (2) (3) (3) 1 2 (1) 186
Advanced Wound Bioactives (4) 4 (3) 1 0 (8) 0 7 86
Advanced Wound Devices 11 1 5 2 5 16 14 8 50
Group 4 2 2 (1) 2 3 3 3 1,152
All revenue growth rates are on an underlying basis and without adjustment for number of selling days
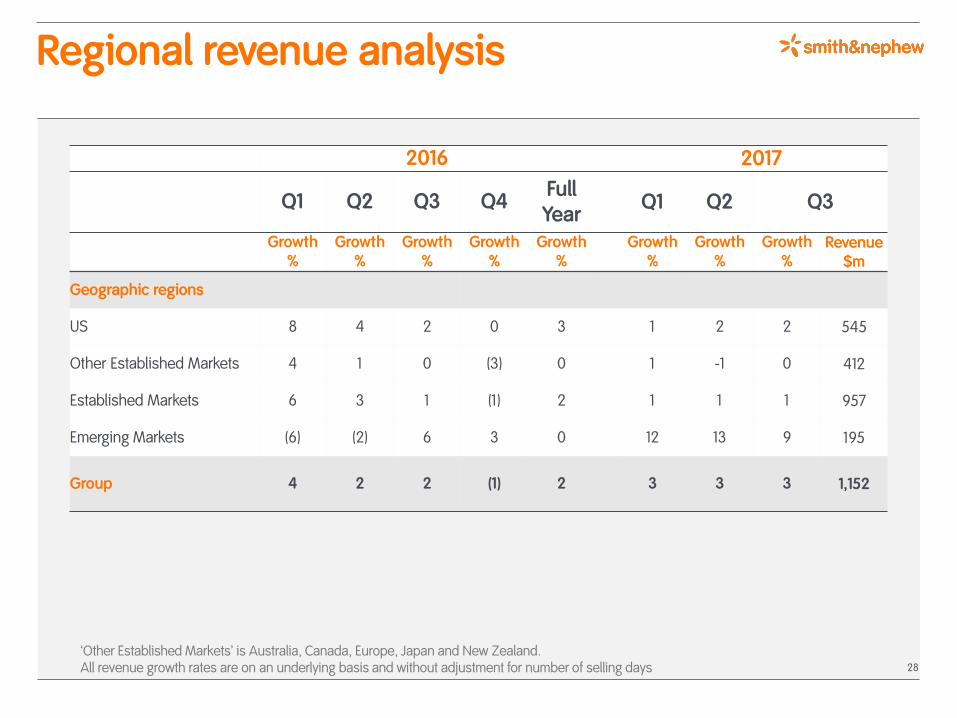
Regional revenue analysis
28
2016 2017
Q1 Q2 Q3 Q4FullYear
Q1 Q2 Q3
Growth%
Growth%
Growth%
Growth%
Growth%
Growth%
Growth%
Growth%
Revenue$m
Geographic regions
US 8 4 2 0 3 1 2 2 545
Other Established Markets 4 1 0 (3) 0 1 -1 0 412
Established Markets 6 3 1 (1) 2 1 1 1 957
Emerging Markets (6) (2) 6 3 0 12 13 9 195
Group 4 2 2 (1) 2 3 3 3 1,152
‘Other Established Markets’ is Australia, Canada, Europe, Japan and New Zealand. All revenue growth rates are on an underlying basis and without adjustment for number of selling days
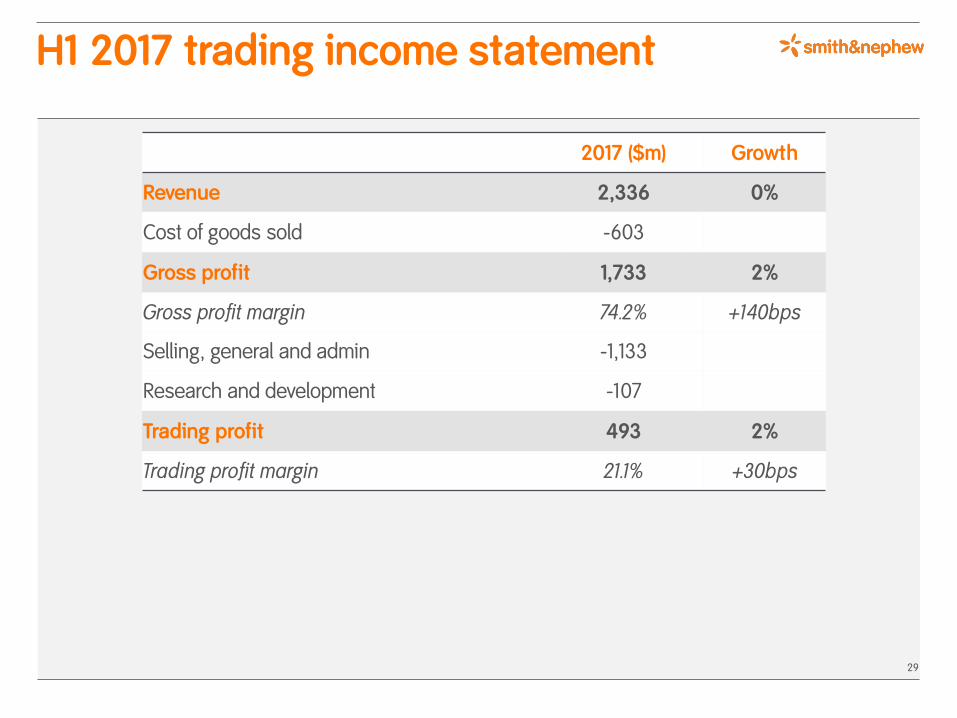
H1 2017 trading income statement
29
2017 ($m) Growth
Revenue 2,336 0%
Cost of goods sold -603
Gross profit 1,733 2%
Gross profit margin 74.2% +140bps
Selling, general and admin -1,133
Research and development -107
Trading profit 493 2%
Trading profit margin 21.1% +30bps

Trading income statement Half and full year
30
H1 H2 Full Year
2016$m
2015$m
2016$m
2015$m
2016$m
2015$m
Revenue 2,328 2,272 2,341 2,362 4,669 4,634
Cost of goods sold (632) (566) (640) (577) (1272) (1,143)
Gross profit 1,696 1,706 1,701 1,785 3,397 3,491
Gross profit margin 72.8% 75.1% 72.7% 75.6% 72.8% 75.3%
Selling, general and admin (1,100) (1,084) (1,047) (1,086) (2,147) (2,170)
Research and development (113) (110) (117) (112) (230) (222)
Trading profit 483 512 537 587 1,020 1,099
Trading profit margin 20.8% 22.5% 22.9% 24.9% 21.8% 23.7%
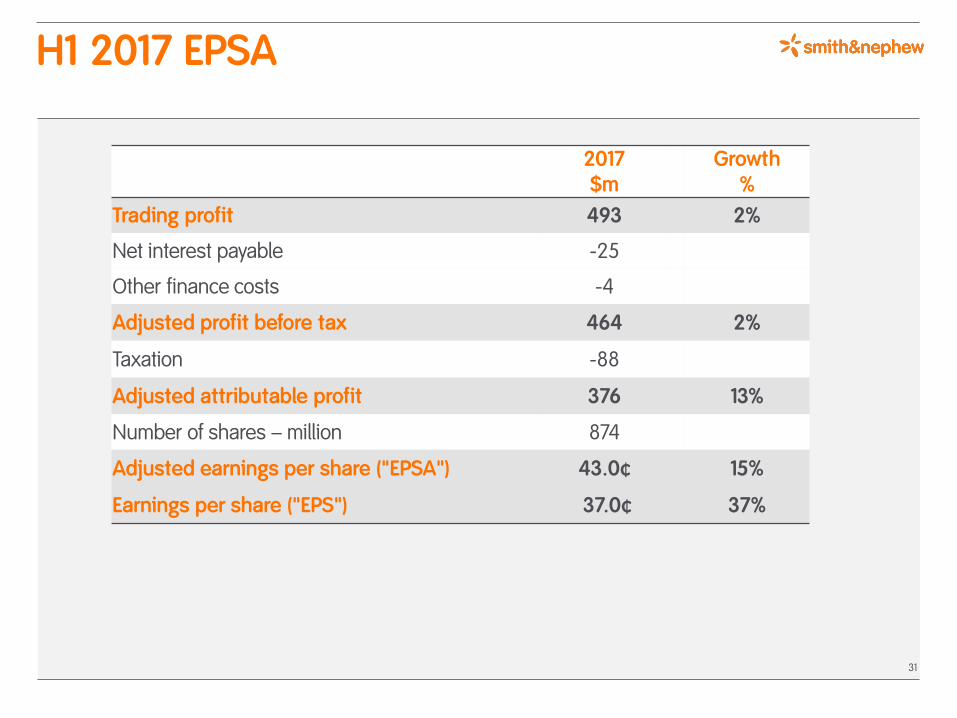
H1 2017 EPSA
31
2017$m
Growth%
Trading profit 493 2%
Net interest payable -25
Other finance costs -4
Adjusted profit before tax 464 2%
Taxation -88
Adjusted attributable profit 376 13%
Number of shares – million 874
Adjusted earnings per share ("EPSA") 43.0¢ 15%
Earnings per share ("EPS") 37.0¢ 37%
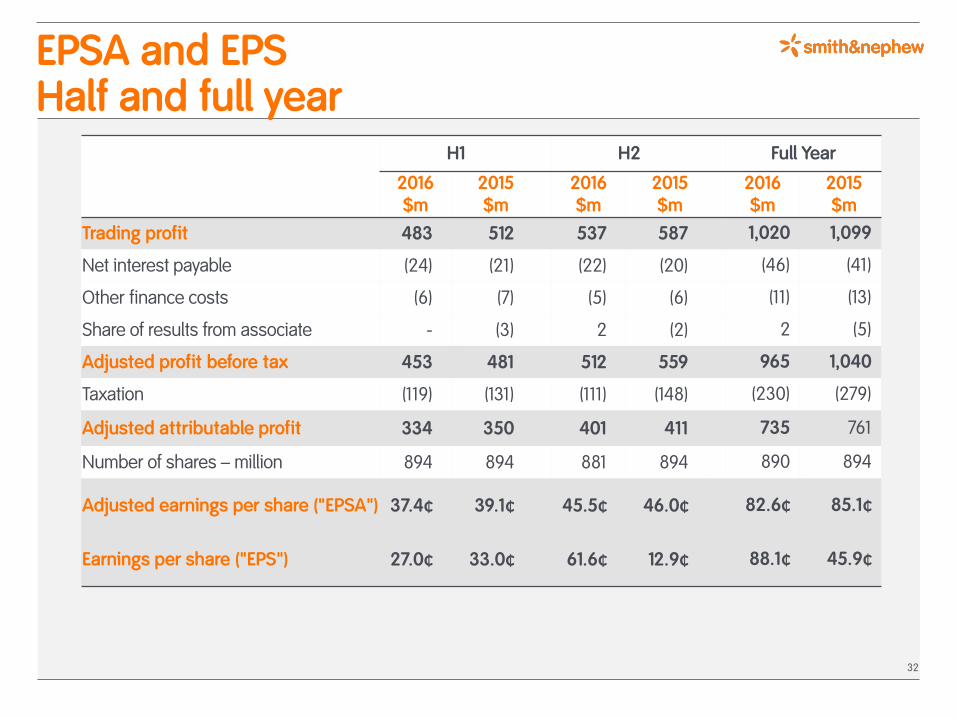
EPSA and EPS Half and full year
32
H1 H2 Full Year
2016$m
2015$m
2016$m
2015$m
2016$m
2015$m
Trading profit 483 512 537 587 1,020 1,099
Net interest payable (24) (21) (22) (20) (46) (41)
Other finance costs (6) (7) (5) (6) (11) (13)
Share of results from associate - (3) 2 (2) 2 (5)
Adjusted profit before tax 453 481 512 559 965 1,040
Taxation (119) (131) (111) (148) (230) (279)
Adjusted attributable profit 334 350 401 411 735 761
Number of shares – million 894 894 881 894 890 894
Adjusted earnings per share ("EPSA") 37.4¢ 39.1¢ 45.5¢ 46.0¢ 82.6¢ 85.1¢
Earnings per share ("EPS") 27.0¢ 33.0¢ 61.6¢ 12.9¢ 88.1¢ 45.9¢

H1 2017 trading cash flow
33
2017$m
2016$m
Growth%
Trading profit 493 483 2%
Share based payment 15 14
Depreciation and amortisation 154 147
Capital expenditure -178 -174
Movements in working capital and other -157 -215
Trading cash flow 327 255 28%
Trading cash conversion 66% 53%
Restructuring, legal, acquisition & other -67 -49
Operating cash flow 260 206 26%
Net interest paid -25 -24
Taxation paid -62 -87
Free cash flow 173 95 82%
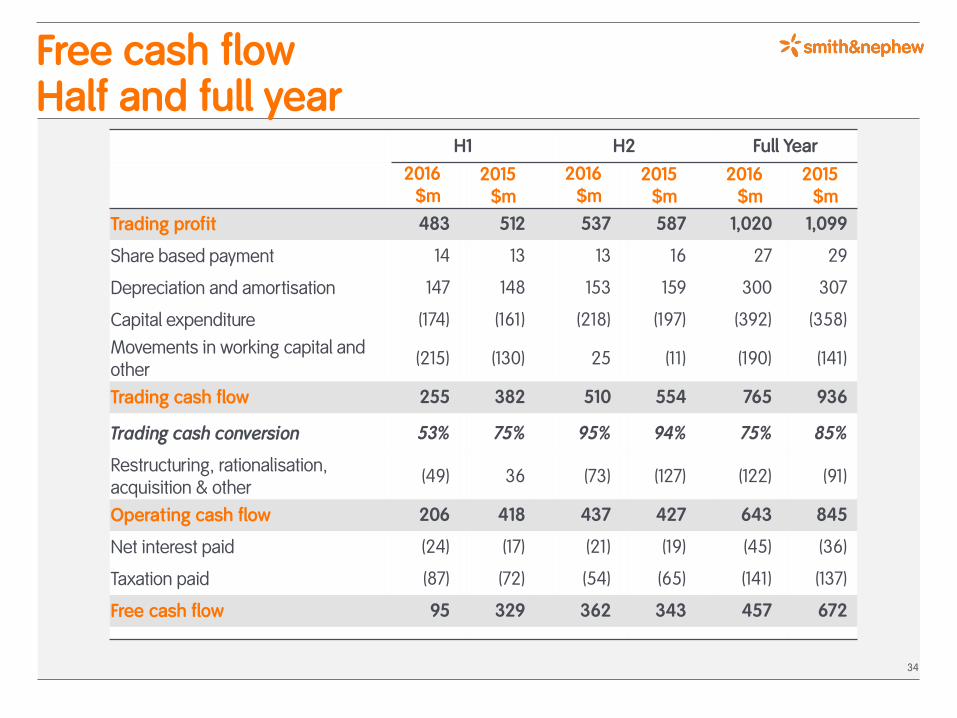
Free cash flow Half and full year
34
H1 H2 Full Year
2016$m
2015$m
2016$m
2015$m
2016$m
2015$m
Trading profit 483 512 537 587 1,020 1,099
Share based payment 14 13 13 16 27 29
Depreciation and amortisation 147 148 153 159 300 307
Capital expenditure (174) (161) (218) (197) (392) (358)
Movements in working capital and other
(215) (130) 25 (11) (190) (141)
Trading cash flow 255 382 510 554 765 936
Trading cash conversion 53% 75% 95% 94% 75% 85%
Restructuring, rationalisation,acquisition & other
(49) 36 (73) (127) (122) (91)
Operating cash flow 206 418 437 427 643 845
Net interest paid (24) (17) (21) (19) (45) (36)
Taxation paid (87) (72) (54) (65) (141) (137)
Free cash flow 95 329 362 343 457 672
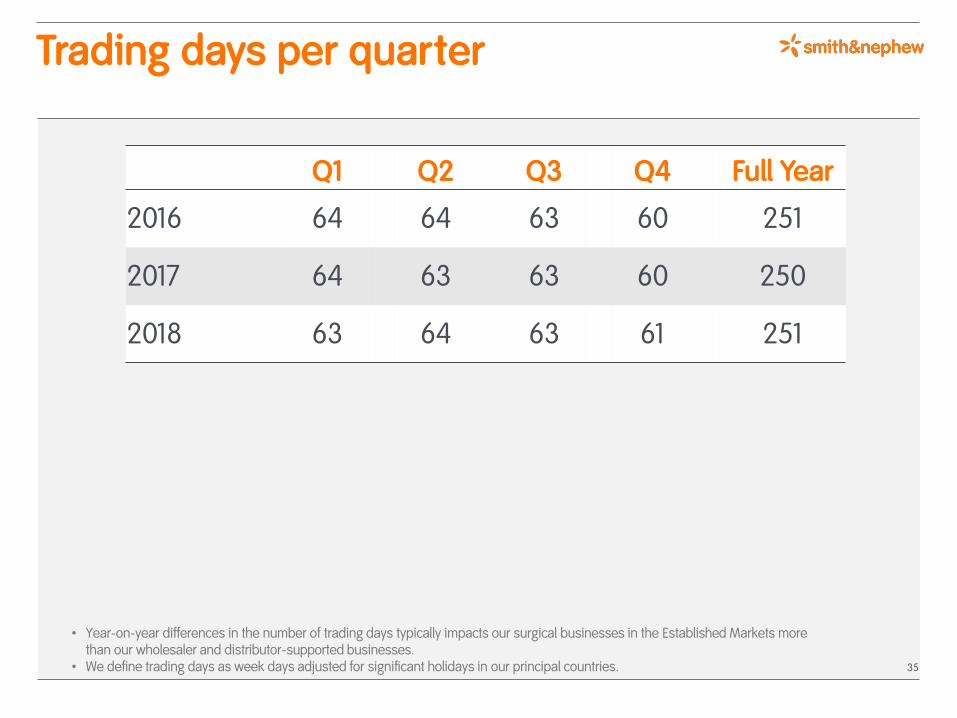
Trading days per quarter
35
Q1 Q2 Q3 Q4 Full Year
2016 64 64 63 60 251
2017 64 63 63 60 250
2018 63 64 63 61 251
• Year-on-year differences in the number of trading days typically impacts our surgical businesses in the Established Markets morethan our wholesaler and distributor-supported businesses.
• We define trading days as week days adjusted for significant holidays in our principal countries.

Management
36
Olivier BohuonChief Executive OfficerOlivier joined the Board and was appointed Chief Executive Officer in April 2011. He resigned as a Member of theNomination & Governance Committee on 3 February 2016. Olivier holds a doctorate from the University of Parisand an MBA from HEC, Paris. He started his career in Morocco with Roussel Uclaf S.A. and then, with the samecompany, held a number of positions in the Middle East with increasing levels of responsibility. He joined Abbott inChicago as head of their anti-infective franchise with Abbott International, before becoming PharmaceuticalGeneral Manager in Spain. He subsequently joined GlaxoSmithKline, rising to Senior Vice President & Director forEuropean Commercial Operations. He then re-joined Abbott as President for Europe, became President of AbbottInternational, and then President of their Pharmaceutical Division. He joined Smith & Nephew from Pierre Fabre,where he was Chief Executive. Olivier has extensive international healthcare leadership experience within anumber of significant pharmaceutical and healthcare companies. His global experience provides the skillsetrequired to innovate a FTSE 100 company with a deep heritage and provide inspiring leadership. He is a Non-Executive Director of Virbac group and Shire plc, where he is also a member of the Remuneration Committee.
36
Graham BakerChief Financial OfficerJoined the Board as Chief Financial Officer in March 2017. Graham holds an MA degree in Economics fromCambridge University and qualified as a Chartered Accountant and Chartered Tax Advisor with Arthur Andersen.In 1995, he joined AstraZeneca PLC where he worked for 20 years, holding multiple senior roles, including VicePresident, Finance, International (2013-2015) with responsibility for all emerging markets, Vice President, GlobalFinancial Services (2011-2013) and Vice President Finance & Chief Financial Officer, North America (2008-10). Mostrecently, Graham was Chief Financial Officer of generic pharmaceuticals company Alvogen. Graham has deepsector knowledge and has had extensive exposure to established and emerging markets which will be extremelyrelevant to his role at Smith & Nephew. He has a strong track record of delivering operational excellence and hasrelevant experience across major finance roles and geographic markets, leading large teams responsible forsignificant budgets.
Investor Relations Contacts
37
Ingeborg Øie
VP, Investor Relations
T: +44 (0) 207 960 2285
Nick Fridberg
Strategic Planning & Investor Relations
T: +44 (0) 192 347 7100
Smith & Nephew plc
15 Adam Street
London
WC2N 6LA
Ghazaleh Mahdizadeh
Investor Relations Manager
T: +44 (0) 207 960 2339
Olivia Balogun
Investor Relations Coordinator
T: +44 (0) 207 960 2257