Embed Size (px)
Citation preview

(i)
IMPACT OF BRAND IDENTITY ON
PERCEIVED BRAND IMAGE OF THE
NELSON MANDELA METROPOLITAN UNIVERSITY
YING HAN
Dissertation submitted in fulfillment of the requirement for the degree of
MAGISTER COMMERCII
in the
Faculty of Business and Economic Sciences
at the
Nelson Mandela Metropolitan University
Supervisor: PROF. J K BOSCH Port Elizabeth
Co-supervisor: DR E VENTER January 2006

(ii)
ACKNOWLEDGEMENTS
The successful completion of this dissertation was not possible without the
assistance, support and encouragement of the following persons:
Prof. J K Bosch, my supervisor, who provided proficient research guidance,
insightful clarifications on research paradigms, suggestions and
constructive criticism.
Dr Elmarie Venter, my co-supervisor, for her persistent guidance on brands
and branding, constructive reviews and criticisms, and continuous support.
Prof. Christo Boshoff, for his valuable inputs during the data analysis
phase.
Ms Marthie Nel, for her highly regarded linguistic recommendations and
guidance.
Finally, to my family in the city of Xi’an, People’s Republic of China, who
encouraged and supported me under difficult circumstances to persevere.

(iii)
千里之行, 始于足下
A thousand mile journey begins with the first step
– the highest eminence is to be gained step by step.
Lao Zi
Chinese philosopher

(iv)
TABLE OF CONTENTS
Page
ACKNOWLEDGEMENTS ………………………………………………
TABLE OF CONTENTS …………………………………………………
LIST OF TABLES …………………………………………………………
LIST OF FIGURES ………………………………………………………
ABSTRACT ………………………………………………………………...
(ii)
(iv)
(xi)
(xiii)
(xv)
CHAPTER ONE
INTRODUCTION AND PROBLEM DEFINITION
1.1 INTRODUCTION AND BACKGROUND TO RESEARCH …………….. 1
1.2 PURPOSE OF RESEARCH ……………………………………………... 9
1.3 RESEARCH OBJECTIVES ………………………………………………... 9
1.3.1 Primary research objective ……………………………………………….. 9 1.3.2 Secondary research objectives ……………………………………… 10
1.4 RESEARCH QUESTIONS AND HYPOTHESES ……………………… 11
1.4.1 Research questions ……………………………………………………… 11 1.4.2 Research hypotheses …………………………………………………… 11
1.5 ROLE OF SECONDARY SOURCES …………………………………… 13
1.6 PROPOSED RESEARCH METHODOLOGY ………………………… 13
1.7 DATA COLLECTION AND ANALYSIS …………………………………… 14
1.7.1 Data collection …………………………………………………………… 14 1.7.2 Data analysis ……………………………………………………………… 14

(v)
1.8 SCOPE AND DELIMITATION OF RESEARCH …………………………. 15
1.9 PRIOR RESEARCH ……………………………………………………… 15
1.10 PLAN OF RESEARCH …………………………………………………….. 16
CHAPTER TWO
RESEARCH DESIGN AND METHODOLOGY
2.1 INTRODUCTION …………………………………………………………… 18
2.2 TYPES OF RESEARCH …………………………………………………… 21
2.2.1 Quantitative and qualitative research ……………………………………. 21 2.2.2 Exploratory, descriptive, analytical and predictive research …………… 23 2.2.3 Deductive and inductive research ………………………………………… 25 2.2.4 Applied and basic research ……………………………………………….. 27 2.2.5 Conclusions on types of research ………………………………………… 28
2.3 DIFFERENT RESEARCH PARADIGMS ………………………………… 28
2.3.1 Introduction of two main research paradigms …………………………… 28 2.3.2 Positivistic (quantitative) paradigm ……………………………………… 29 2.3.3 Phenomenological (qualitative) paradigm ……………………………… 30 2.3.4 Comparison between positivistic (quantitative) and phenomenological
(qualitative) paradigms ……………………………………………………… 31 2.3.5 Conclusions: motivation for adopted research paradigm ………………. 33
2.4 CRITERIA FOR A WELL-DESIGNED RESEARCH PROJECT ………. 35
2.4.1 Reliability …………………………………………………………………… 35 2.4.2 Validity (internal validity) …………………………………………………… 37 2.4.3 Generalisability (external validity) ………………………………………... 39 2.4.4 Other criteria for a well-designed research project ……………………… 40
2.5 METHODS OF DATA SOURCING AND ANALYSIS …………………… 41
2.5.1 Primary data sourcing …………………………………………………… 42 2.5.2 Research instrument (questionnaire) ……………………………………. 42

(vi)
2.5.3 Data analysis ……………………………………………………………….. 44
2.6 SUMMARY AND CONCLUSIONS ……………………………………….. 44
CHAPTER THREE
PERSPECTIVES ON BRANDS, BRANDING AND BRAND EQUITY
3.1 INTRODUCTION ………………………………………………………….... 46
3.2 THE CONCEPTS ‘BRANDS’ AND ‘CORPORATE BRANDS’ ………… 49
3.2.1 Brands defined ……………………………………………………………… 49 3.2.2 Comparison between product and corporate brands …………………… 52
3.3 PERSPECTIVES ON BRANDING ………………………………………. 55
3.3.1 Traditional perspectives on branding …………………………………… 56 3.3.2 Contemporary perspectives on branding ………………………………… 57 (i) Brand orientation …………………………………………………………... 57 (ii) Brand leadership …………………………………………………………... 57 (iii) Brand asset management ………………………………………………… 59 (iv) Logman model ……………………………………………………………... 61
3.3.3 Corporate branding ………………………………………………………... 63
3.4 BRAND EQUITY …………………………………………………………… 66 3.4.1 Defining brand equity ……………………………………………………… 66 3.4.2 Managing brand equity ……………………………………………………. 68
3.5 SUMMARY AND CONCLUSIONS ………………………………………. 69
CHAPTER FOUR
UNDERSTANDING BRAND IDENTITY,
BRAND IMAGE AND OTHER RELATED CONCEPTS
4.1 INTRODUCTION ………………………………………………………….. 71

(vii)
4.2 BRAND IDENTITY ………………………………………………………… 71
4.2.1 Brand identity defined …………………………………………………….. 71 4.2.2 Brand identity variables …………………………………………………… 74 4.2.3 Benefits of creating a brand identity …………………………………….. 77 4.2.4 Some views on corporate identity ………………………………………. 78
4.3 BRAND KNOWLEDGE …………………………………………………… 79
4.4 BRAND AWARENESS ……………………………………………………. 80
4.5 BRAND IMAGE ……………………………………………………………. 81
4.5.1 Brand image defined …………………………………………………….... 81 4.5.2 Brand image associations and variables ……………………………….. 83 4.5.3 Some views on corporate image ………………………………………… 84
4.6 COMPARISION OF BRAND IDENTITY AND BRAND IMAGE ……….. 85
4.7 BRAND PERCEPTIONS AND ASSOCIATIONS ………………………. 86
4.8 BRAND LOYALTY ………………………………………………………… 87
4.9 BRAND COMMITMENT ………………………………………………….. 88
4.10 ROLE OF BRAND COMMUNICATION …………………………………. 89
4.11 CONCLUSIONS: CONSTRUCT OF COMPREHENSIVE
THEORETICAL AND MODIFIED CONCEPTUAL MODELS ON BRAND IDENTITY AND BRAND IMAGE ………………………….. 90
CHAPTER FIVE
PRIMARY DATA SOURCING
5.1 INTRODUCTION ………………………………………………………….. 96
5.2 DESIGN AND STRUCTURE OF RESEARCH INSTRUMENT ………. 96
5.2.1 Background to the design of the research instrument …………………. 96 5.2.2 Structure of research instrument ………………………………………… 97

(viii)
5.2.3 Operationalisation of variables of research instrument ……………….. 100 5.2.4 Measurement scales ………………………………………………………
1 0 1 (i) Nominal scale of measurement ………………………………………….. 101 (ii) Ordinal scale of measurement …………………………………………… 102 (iii) Interval scale of measurement ………………………………………… 103 (iv) Ratio scale of measurement …………………………………………… 104
5.3 PILOT TESTING OF RESEARCH INSTRUMENT …………………….. 106 5.4 PHASES IN SAMPLING DESIGN ………………………………………. 107
5.4.1 Population and target population ………………………………………... 108 5.4.2 Sampling frames …………………………………………………………... 110 5.4.3 Sampling units …………………………………………………………….. 111 5.4.4 Sampling and sample size ……………………………………………….. 111 5.4.5 Sampling methods employed ……………………………………………. 114 5.4.6 Administering research instrument and
actual samples (responses) ……………………………………………… 117
5.5 SUMMARY AND CONCLUSIONS ………………………………………. 120
CHAPTER SIX
DATA ANALYSIS AND EMPIRICAL FINDINGS
6.1 INTRODUCTION ………………………………………………………….. 121
6.2 DATA INSPECTION ………………………………………………………. 121
6.3 STATISTICAL PROCEDURES ………………………………………… 122
6.3.1 Validity of research instrument …………………………………………... 122 6.3.2 Reliability of research instrument ………………………………………... 124 6.3.3 Multiple linear regression analysis (brand identity
variables on brand identity) ………………………………………………. 125 6.3.4 Linear regression analysis (brand identity on brand image) ………….. 126 6.3.5 Pair-wise t-tests …………………………………………………………… 126 6.3.6 Mean scores and relative percentage ratings ………………………….. 127
6.4 EMPIRICAL FINDINGS ………………………………………………… 127

(ix)
6.4.1 Discriminant and construct validity findings (exploratory factor analysis) ……………………………………………... 127
(i) Discriminant validity of brand expectation items ……………………….. 128 (ii) Discriminant validity of brand experience items ……………………… 132 (iii) Findings on exploratory factor analysis of
expectations and actual experiences ………………………………….... 135 6.4.2 Assessing hypothesised relationships
of modified conceptual model ……………………………………………. 136 (i) Findings on first set of hypotheses:
Effect of brand identity variables on brand identity …………………….. 136 (ii) Findings on second set of hypotheses:
Effect of brand identity on perceived brand image …………………….. 138 6.4.3 Findings: Third set of hypotheses; Pair-wise t-tests …………………… 142 6.4.4 Findings: Third set of hypotheses; Mean scores and
relative percentage ratings ……........................................................... 142
6.5 SUMMARY AND CONCLUSIONS ………………………………………. 152
CHAPTER SEVEN
SUMMARY, CONCLUSIONS AND RECOMMENDATIONS
7.1 INTRODUCTION ………………………………………………………… 156
7.2 SUMMARY: HOLISTIC PERSPECTIVES AND CONTRIBUTIONS OF THIS RESEARCH ……………………………… 156
7.2.1 Purpose of the research and research objectives ……………………. 156 7.2.2 Research design and methodology ……………………………………. 158 7.2.3 Literature review …………………………………………………………. 159 7.2.4 Primary data sourcing …………………………………………………….. 159 7.2.5 Data analysis ………………………………………………………………. 160
7.3 OVERVIEW OF SIGNIFICANT FINDINGS …………………………….. 160
7.4 CONCLUSIONS AND RECOMMENDATIONS ………………………… 164
7.4.1 Strategic implications of findings for the NMMU
marketing communication strategists …………………………………… 164 7.4.2 Secondary sources on brand literature ………………………………… 168 7.4.3 Recommendations for future research ………………………………… 171

(x)
7.5 LIMITATIONS OF RESEARCH ………………………………………….. 172
7.6 LEARNING EXPERIENCES AND REFLECTION ……………………... 173 BIBLIOGRAPHY …………………………………………………………... 178 ANNEXURE A: THE RESEARCH INSTRUMENT …………………….. 188
ANNEXURE B: CRONBACH ALPHA COEFFICIENTS,
CORRELATIONS AND FACTOR LOADINGS
(EXPECTATIONS) ……………………………………... 195
ANNEXURE C: CRONBACH ALPHA COEFFICIENTS,
CORRELATIONS AND FACTOR LOADINGS
(ACTUAL EXPERIENCES) …………………………… 197

(xi)
LIST OF TABLES
Page TABLE 1.1: Core brand identity variables and attributes …………... 4
TABLE 2.1: Classification of main types of research ……………….. 21 TABLE 2.2: Comparison between positivistic (quantitative) and
phenomenological (qualitative) approaches ………….. 32 TABLE 2.3: Motivation for the decision on positivistic (quantitative)
approach ………………………………………………… 33 TABLE 3.1: Comparison between product and corporate brands … 53 TABLE 3.2: Top ten global brands ……………………………………. 68
TABLE 4.1: Core brand identity variables and attributes …………... 75 TABLE 4.2: Differences between brand identity and
brand image of the NMMU ……………………………… 86 TABLE 5.1: Heading of research instrument ………………………... 99 TABLE 5.2: Brand variables and number of statements
per variable ………………………………………………. 99 TABLE 5.3: Summary of measurement scales ……………………... 105 TABLE 5.4: Cronbach alpha reliability coefficients for pilot study … 107 TABLE 5.5: Guidelines for sampling …………………………………. 114 TABLE 5.6: Main features, advantages and disadvantages of
sampling methods used ………………………………… 115
TABLE 5.7: Level of study and location of student respondents ….. 118 TABLE 5.8: Actual samples of research ……………………………... 119 TABLE 6.1: Rotated factor matrix for brand expectations …………. 130

(xii)
TABLE 6.2: Rotated factor matrix for brand experiences ………….. 133 TABLE 6.3: Multiple linear regression analysis (expectations):
Impact of brand identity variables on ‘Identity’ ………... 136
TABLE 6.4: Multiple linear regression analysis (experiences): Impact of brand identity variables on ‘Identity’ ………… 137
TABLE 6.5: Linear regression analysis (expectations):
Impact of brand identity on ‘image: academic’ ………... 139
TABLE 6.6: Linear regression analysis (experiences): Impact of brand identity on ‘image: academic’ ……….. 140
TABLE 6.7: Linear regression analysis (expectations):
Impact of brand identity on ‘image: recognition’ ………. 140
TABLE 6.8: Linear regression analysis (experiences): Impact of brand identity on ‘image: recognition’ ………. 141
TABLE 6.9: Results of t-tests ………………………………………… 143 TABLE 6.10: Relative importance of expectations and
actual experiences of NMMU brand …………………… 148

(xiii)
LIST OF FIGURES
Page
FIGURE 1.1: Comprehensive theoretical model on brand identity and brand image ………………………………………………. 2
FIGURE 1.2: Modified conceptual model on brand identity and brand
image ……………………………………………………… 7
FIGURE 2.1: Research design framework on NMMU brand identity and brand image …………………………………………. 19
FIGURE 3.1: The brand system ………………………………………… 52 FIGURE 3.2: Brand leadership – the evolving paradigm ……………. 58 FIGURE 3.3: Brand asset management process ……………………. 60 FIGURE 3.4: Linkage between corporate branding, strategic vision,
mission and key values, organisational culture and corporate image ………………………………………….. 64
FIGURE 3.5: Managing brand equity ………………………………….. 69
FIGURE 4.1: Brand identity system ……………………………………. 74 FIGURE 4.2: Dimensions of brand knowledge ………………………... 80 FIGURE 4.3: A model for the NMMU brand communication
process ……………………………………………………. 91 FIGURE 4.4: Comprehensive theoretical model on brand identity
and brand image …………………………………………. 93 FIGURE 4.5: Modified conceptual model on brand identity
and brand image …………………………………………. 94
FIGURE 5.1: Illustration of a Likert seven-point scale ……………….. 103 FIGURE 5.2: Target population, sampling frames and
sampling units of research ……………………………… 109
FIGURE 5.3: Selecting a sample ………………………………………. 112

(xiv)
FIGURE 6.1: Empirical model on brand identity and brand image … 152
FIGURE 7.1: Empirical model on brand identity and brand image … 161

(xv)
ABSTRACT
Since 1994, South Africa has witnessed the fundamental transformation and
restructuring of its Higher Education Sector. The restructuring of Higher
Education Institutions in the Eastern Cape Province is manifested by inter alia the
incorporation of the Port Elizabeth branch of the Vista University into the
University of Port Elizabeth as a first phase and, as the final phase, the merger
between the University of Port Elizabeth and the Port Elizabeth Technikon. A new,
comprehensive university, the Nelson Mandela Metropolitan University (NMMU),
emerged from this merger on 1 January 2005. The previous institutions each had
its own unique brand identity, brand image and brand name. With reference to the
newly established NMMU, the question can be raised whether the brand identity
of this newly established institution impacts on its perceived brand image among
all stakeholders who have an interest in the institution.
Given the merger background, the purpose of this research project is twofold:
firstly, to analyse the impact of independent variables (‘reputation’, ‘relevance’,
‘personality’, ‘performance’ and ‘relationship’) on brand identity (moderating
variable) and the impact of brand identity on brand image (dependent variable);
and secondly, to gauge the perceptions of NMMU stakeholders of the brand
image of the University in terms of both expectations and actual experiences. In
order to give effect to the above, a conceptual model on brand identity and brand
image based on secondary sources on branding, was empirically tested.
Given the purpose and nature of the research in question, a positivistic research
paradigm was adopted. By means of a Likert seven-point scale, primary data was
sourced from 1 092 respondents, who shared their perceptions on the
expectations and actual experiences of using the NMMU brand.
The statistical analysis of the data comprised six phases. Initially, the data was
subjected to an exploratory factor analysis to assess the discriminant validity of

(xvi)
the research instrument. This was followed by an assessment of the reliability of
the research instrument through an internal consistency measure (Cronbach
alpha reliability coefficients). The items that remained were included in the
multiple regression model to assess the impact of brand identity variables on
brand identity. The next phase comprised a regression analysis of the impact of
brand identity on brand image. Fifthly, to assess any differences between
stakeholders’ expectations and actual experiences when using the NMMU brand,
pair-wise t-tests were performed. Finally, to gauge the level of satisfaction of
NMMU stakeholders when using the brand, a “gap” analysis was conducted by
converting the mean scores into relative percentage ratings.
The empirical findings did not fully support the conceptual model. The testing of
the conceptual model revealed that the independent variable ‘relevance’ did not
demonstrate sufficient discriminant validity and, as a result, no evidence of
construct validity. This variable therefore had to be removed from the conceptual
model before it was subjected to further empirical assessment by means of the
multiple linear regression analysis. Based on this finding on ‘relevance’, NMMU
marketing communication strategists could perform an in-depth investigation on
the positioning of the brand.
Further, it was found that the dependent variable ‘brand image’ was not a
uni-dimensional construct as suggested in the conceptual model. Ideally, images
(in this case, brand images of the NMMU) should feed into strategic vision,
serving as a mirror in which a university can reflect on its true standing. This
implies that instead of using stakeholder images as exact assessments of brand
performance compared with strategic vision, images held by stakeholders of who
the university is and what it stands for (e.g. personality and relevance
comparisons) should become part of the strategic envisioning process. The
linkage between strategic intent and brand image should be evident.
The results of the pair-wise t-tests revealed that significant statistical differences

(xvii)
existed between stakeholders’ perceptions of the expected and actual
experiences when using the NMMU brand. To assess the magnitude of a possible
‘gap’ between stakeholders’ expectations and actual experiences of the NMMU
brand, mean score differences were converted into relative percentage ratings.
The most significant findings on actual experiences (on which the level of
satisfaction is based) of the NMMU brand are as follows:
All relative rating scores were below 92.05%. These relative satisfaction
percentages imply that respondents were not satisfied with the NMMU brand,
because their expectations were not fully met.
The highest rating percentage (92.05%) was obtained in respect of the
statement regarding “The NMMU slogan (‘for tomorrow’) reflects the NMMU
brand identity”.
The lowest rating percentage (78.33%) was given to the statement “The
NMMU brand exceeds expectations in terms of promises”.
The second lowest rating percentage (79.67%) was found for the statement
“The NMMU brand delivers on promises”.
The principal recommendations emanating from this study are summarised in
three groups of recommendations, namely:
Recommendations pertaining to the strategic implications of the findings for
the NMMU marketing communication strategists.
Recommendations pertaining to the interpretation of secondary sources on
brand literature, and
Recommendations for future research.
KEY WORDS: Brand communication; Brand identity; Brand image; Brand
performance; Brand personality; Brand relationship and
associations; Brand relevance; Brand reputation; Brands;
Corporate branding.

(1)
CHAPTER ONE
INTRODUCTION AND PROBLEM DEFINITION
1.1 INTRODUCTION AND BACKGROUND TO RESEARCH
South Africa is currently (2005) engaged in the fundamental transformation and
restructuring of its Higher Education Sector. The main thrust of this
transformation/restructuring is to integrate Higher Education Institutions into a
coherent and coordinated system that will promote social equity by enabling the
advancement of the historically disadvantaged groups of the South African
society. Other priorities of this new institutional landscape are developing
high-level human resources; addressing the pressing socio-economic
challenges facing South Africa; and building the country’s economy
(Transformation and restructuring: A new institutional landscape for higher
education, Ministry of Education 2002).
The restructuring of Higher Education Institutions in the vast Eastern Cape
Province of South Africa is manifested by inter alia the incorporation of the Port
Elizabeth branch of Vista University into the University of Port Elizabeth as a
first phase and, as the final phase, the merger between the University of Port
Elizabeth and the Port Elizabeth Technikon. A new comprehensive university,
the Nelson Mandela Metropolitan University (NMMU), emerged from this
merger and came into existence on 1 January 2005.
It is a reality that each of the aforementioned previous institutions had its own
unique brand identity, brand image and brand name. With reference to the
newly established NMMU, the question can be raised whether the new brand
identity of the newly established NMMU impacts on the perceived brand image
of the NMMU among all stakeholders who have an interest in the institution.
-2-
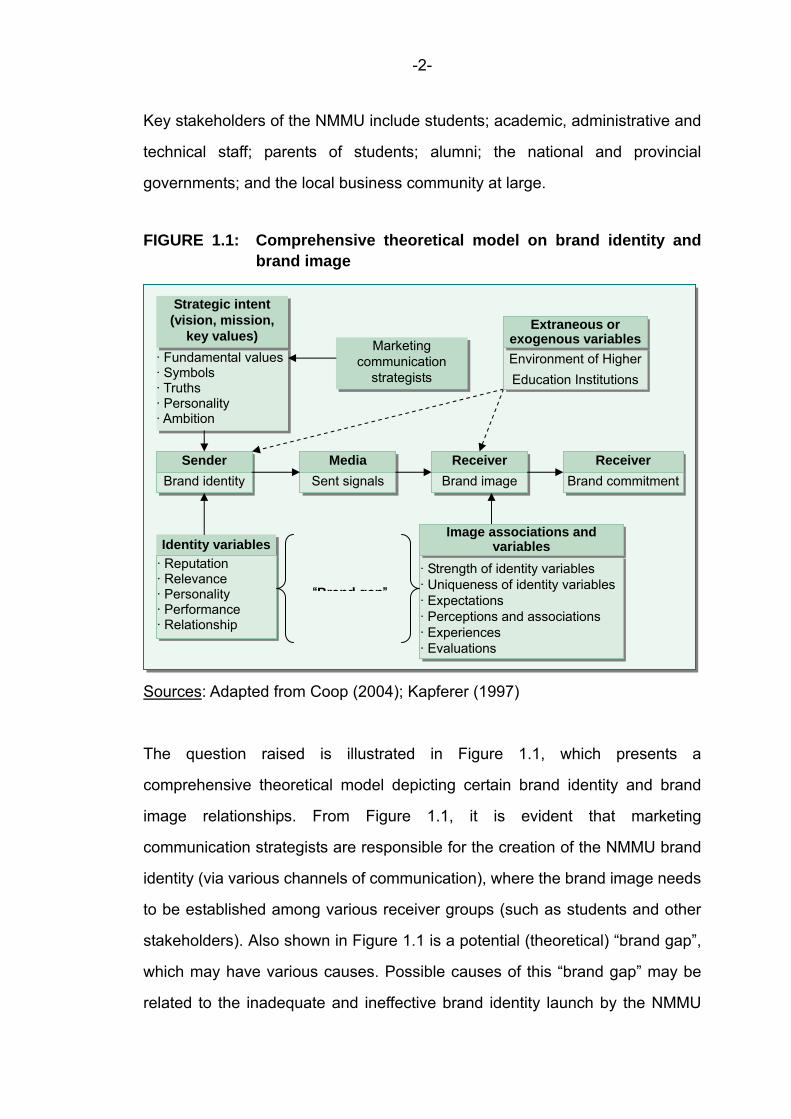
Key stakeholders of the NMMU include students; academic, administrative and
technical staff; parents of students; alumni; the national and provincial
governments; and the local business community at large.
FIGURE 1.1: Comprehensive theoretical model on brand identity and
brand image
Sources: Adapted from Coop (2004); Kapferer (1997)
The question raised is illustrated in Figure 1.1, which presents a
comprehensive theoretical model depicting certain brand identity and brand
image relationships. From Figure 1.1, it is evident that marketing
communication strategists are responsible for the creation of the NMMU brand
identity (via various channels of communication), where the brand image needs
to be established among various receiver groups (such as students and other
stakeholders). Also shown in Figure 1.1 is a potential (theoretical) “brand gap”,
which may have various causes. Possible causes of this “brand gap” may be
related to the inadequate and ineffective brand identity launch by the NMMU
Marketing communication
strategists · Fundamental values · Symbols · Truths · Personality · Ambition
Sender Brand identity
Media Sent signals
Receiver Brand image
Receiver Brand commitment
Identity variables · Reputation · Relevance · Personality · Performance · Relationship
· Strength of identity variables · Uniqueness of identity variables · Expectations · Perceptions and associations · Experiences · Evaluations
“Brand gap”
Strategic intent (vision, mission,
key values) Environment of Higher Education Institutions
Extraneous or exogenous variables
Image associations and variables

-3-
marketing communication strategists (the sender). On the receiver’s side,
insufficient brand image associations may apply, which in turn may have a
psychological grounding. The variables that impact on brand identity and brand
image require an in-depth investigation in the context of the NMMU. It is
important to note that, as shown in Figure 1.1, brand identity precedes brand
image (Kapferer 2004:98).
For the purpose of this research, brand identity is seen as the visual and verbal
expression of a brand. Identity supports, expresses, communicates,
synthesises and visualises the brand (Wheeler 2003:4). Brand identity is
described by Coop (2005:36) in terms of the psychological and emotional
associations that the brand aspires to maintain in the minds of consumers. The
role of the vision, mission and value statements of the NMMU (strategic intent)
must also be acknowledged in shaping the brand identity.
Brand identity in general is shaped by the laminating (bonding) effect of the
strategic intent, as well as by five key variables, namely the reputation;
relevance; personality; performance; and relationship of the brand. Ideally, the
corporate profile, vision, mission, key values and principles should be bonded
with the brand identity variables. These variables are associated with a number
of attributes that the marketing communication strategists should communicate,
either implicitly or explicitly. The core brand identity building attributes are listed
in Table 1.1.
To have a better understanding of the above concepts, and to further explain
Figure 1.1, it is appropriate to introduce the concept ‘brand knowledge’. Brand
knowledge (for the research in question, brand knowledge of the NMMU
specifically), is determined by brand awareness and brand image (Shimp
2003:38; Keller 1993:7). Brand awareness relates to brand recall and brand

-4-
recognition, whilst brand image is determined by the strength and uniqueness
of the brand associations (Shimp 2003:38; Keller 1993:7).
Building a reputable brand image is particularly relevant when the
organisational or corporate brand plays a prominent role in the branding
strategy that is adopted. The NMMU brand image may be reflected by the
associations and perceptions of students and other stakeholders about what
the NMMU stands for as a provider of educational services to the community at
large.
TABLE 1.1: Core brand identity variables and attributes
Variables Attributes
Brand reputation
Trust in the brand Reliability of the brand Honesty of the brand communication strategists Heritage, legacy and tradition of the brand Clear communication message Consistency – a clear brand identity to be communicated Credibility in advertising (marketing communication media)
Brand relevance
Needs to be satisfied – and values addressed Meaning fit of the brand (relevance to the institution, e.g. NMMU)Innovation and originality of the brand Academic value in harmony with stakeholders’ needs The brand is well accepted by stakeholders
Brand personality
Sincerity of the brand Level of excitement created by the brand Competence reflected by the brand Sophistication and superiority of the brand Ruggedness and resilience of the brand
Brand performance
Exceeds expectations Delivers on promises Delivers tangible benefits Reflects value for money
Brand relationship
Understand how stakeholders feel Stakeholders will use this brand for a long time Actively investigate what is important to stakeholders Stakeholders have to enjoy using the brand Probability of non-usage of the brand
Source: Adapted from Coop (2004:114)

-5-
Figure 1.1 further shows that the brand image is established via media signals,
such as printed marketing communication material. As indicated in the previous
paragraph, brand image can be defined as a reflection of brand associations
and perceptions (Keller 2003:66; Shimp 2003:52). In the case of the NMMU,
the brand associations and perceptions are those held by students and other
stakeholders. The brand image is more specifically shaped by six clusters of
associations and variables, namely strength; uniqueness; expectations;
perceptions; experiences; and evaluations of the brand.
Strength: The strength of a brand image (brand association) is determined
by the magnitude and complexity of the brand identity signals to which the
students and other stakeholders are exposed, as well as the complexity of
the processing of the signals.
Uniqueness: It is important to associate unique, meaningful attributes with
the NMMU brand in order to provide a competitive advantage and “reason
why” students and other stakeholders should use it (Keller 2003:730). The
uniqueness of the NMMU brand identity should be communicated by the
marketing communication strategists.
Expectations: Brand expectations are linked to how brand users expect the
brand to perform. NMMU brand expectations are determined by inter alia
generic educational service attributes and benefits, such as the quality of
educational services and the innovativeness of programme offerings.
Perceptions and associations: In this research, a strong brand image
association would involve the creation of student and stakeholder
perceptions (awareness) that the NMMU provides tertiary educational
services of the highest quality. An innovative brand association would
involve the creation of student and stakeholder perceptions that the NMMU
is developing new and unique academic programmes or improving existing
programmes (Keller 2003:545). For example, it may be that the former

-6-
University of Port Elizabeth’s brand image was that the University was
Eastern Cape based and even apartheid created, whereas the newly
established NMMU image could be regarded as that of a true African
university and a real global player, with an innovative brand association.
Experiences: Brand image associations can be shaped directly from
students’ and stakeholders’ actual experiences and contact with the NMMU
educational services and brand (Keller 2003:83).
Evaluations: Evaluations refer to how brand users interpret and evaluate
the NMMU brand and related marketing information. The brand image
evaluation is determined by the perceptions, expectations and, most
importantly, by the experiences of the brand in question (Coop 2004:235;
Keller 2003: 450).
Brand identity creates perceptions among stakeholders about brand image.
Linked to brand image is the concept ‘brand commitment’. In the context of the
NMMU, brand commitment relates to what stakeholders (for example, students
and the general public) feel and think about the NMMU. Hofmeyr and Rice
(2000:3) state that brand commitment reflects a state of mind, while Keller
(2003:474) is of the opinion that brand commitment is a dedication to continued
brand association and betterment of the relationship.
Also shown in Figure 1.1 is one group of extraneous or exogenous variables,
namely the environment of Higher Education Institutions. The latter may have
an effect on the brand identity and brand image of the NMMU. These
environmental variables may include competitors (such as other Higher
Education Institutions), and social influences, for example peer pressure, the
financial and social considerations of students, and their choices of Higher
Education Institutions.

-7-
Given the brand identity and brand image associations and variables as
summarised in Figure 1.1, it is now appropriate to introduce a modified
conceptual model that underlies this research and that will also be tested
empirically.
FIGURE 1.2: Modified conceptual model on brand identity and brand
image
Source: As modified from Figure 1.1
The modified conceptual model (Figure 1.2) is based on the more
comprehensive theoretical model, as shown in Figure 1.1. The modification
was effected in order to depict the impact of brand identity on the perceived
brand image of the NMMU in a more logical manner and to establish a link to
the stated research objectives (see Section 1.3).
It is well accepted in brand literature that brand image is probably the single
most important asset of any institution (Skinner, Von Essen & Mersam
Stakeholder expectations
Independent variables Moderating or interaction variable
Dependent variable
H1.1
H1.2
H1.3
H1.4
H1.5
H2.1
Actual stakeholder experiences
Possible gap
H3.0
H3.A
Reputation
Relevance
Personality
Relationship
Environment of Higher Education
Institutions
Perceived brand image
Brand identity
Performance

-8-
2001:272). Therefore, the maintenance and enhancement of brand image is of
the utmost importance, particularly for an institution of higher education, such
as the NMMU. This also implies the necessity of periodic brand image
assessments. Given the importance of brand image, the motivation
underpinning this research on NMMU brand identity should be clear. The
purpose of this research is to analyse the brand identity variables and their
impact on perceived brand image, leading to the assessment of stakeholder
perceptions of the brand image of the NMMU.
Based on the views of Kapferer (2004:98), Figure 1.2 shows that brand identity
precedes brand image. The influence of the independent variables on brand
identity and its shaping of brand image is depicted in Figure 1.2, which is the
modified conceptual model supporting this research.
Five independent variables that impact on the moderating (interaction) variable,
namely brand identity, are listed in Figure 1.2. As mentioned earlier, the
strategic intent should ideally be manifested in the brand identity variables. As
in Figure 1.1, it is implied in Figure 1.2 that the brand identity is shaped by five
key identity variables, namely reputation; relevance; personality; performance;
and relationship. The moderating variable, brand identity, is presented as a key
driver of brand image. As in the case of the comprehensive theoretical model
(Figure 1.1), a group of extraneous or exogenous variables, namely the
environment of Higher Education Institutions, are depicted in Figure 1.2. The
latter may have an effect on the moderating and dependent variables (see
Figure 1.2). Also illustrated in Figure 1.2, linked with dashed lines to perceived
brand image, are two ellipsoid (oval-shaped) areas (stakeholder expectations
and actual stakeholder experiences). This construct reflects the objective of
assessing the perceptions of stakeholders on expectations and actual
experience of the NMMU brand image. Further, three sets of hypotheses, which

-9-
will be tested empirically, are shown in Figure 1.2. These hypotheses are
presented in Section 1.4 of this chapter.
1.2 PURPOSE OF RESEARCH
The modified conceptual model underpinning this research (Figure 1.2) shows
that brand identity, which acts as the moderating variable, is shaped by five
independent brand identity variables, which further impact on the dependent
variable, namely brand image. Brand image may also be influenced by the
environmental variables linked to Higher Educational Institutions. This influence,
however, will not form part of the focus of this research. The purpose of this
analytical research project is twofold: firstly, to analyse the impact of the
independent variables on brand identity (moderating variable) and its shaping
of brand image; and, secondly, to gauge the perceptions of NMMU
stakeholders of the brand image (dependent variable) of the institution, in terms
of both expectations and actual experiences. In order to give effect to the above,
a modified conceptual model on branding, based on secondary sources, will be
empirically tested.
1.3 RESEARCH OBJECTIVES
1.3.1 Primary research objective
This analytical research project will investigate and analyse the impact of brand
identity on the perceived brand image of the NMMU, as depicted in Figure 1.2.
It is theoretically possible that NMMU stakeholders may have different
perceptions of the NMMU brand image, which is the prime focus of this
research. Only in a perfect world will all stakeholders have identical perceptions
of the brand image of an institution like the NMMU. Thus, the primary research

-10-
objective is to test the relationships as depicted in the modified conceptual
model (Figure 1.2). In order to achieve this objective, the opinions of
stakeholders of the perceived brand image of the NMMU, as shaped by the
brand identity, will be canvassed and presented.
1.3.2 Secondary research objectives
Six secondary research objectives are identified, namely:
(i) To investigate which research paradigms, research methodologies and
data collection methods and methods of analysis would be most
appropriate to research the problem in question. This objective implies
that the appropriate overall research design for the study must be
determined.
(ii) To construct (design) a research instrument that will canvass the opinions
of stakeholders of the perceived brand image of the NMMU, as shaped by
brand identity. This objective requires an in-depth analysis of secondary
sources dealing with brand identity, brand image and related concepts.
(iii) To source primary data to gauge the opinions of stakeholders of the
perceived NMMU brand image.
(iv) To empirically test the construct and hypotheses as depicted in Figure 1.2.
(v) To analyse the data and report on possible disparities (“gaps”) between
the expectations linked to the NMMU’s brand image and the actual
experience of this brand.
(vi) To make recommendations regarding which dimensions, if any, of the
NMMU brand identity need to be addressed to enhance the image of the
institution.
Both Figures 1.1 and 1.2 show the possible impact of the environment of Higher

-11-
Education Institutions on the moderating and dependent variables. Although
the possible impact of this environment is recognised in the theoretical and
modified conceptual models, this group of variables will not be further pursued
in this research, due to the potentially confounding (obscuring) effect thereof on
the moderating and dependent variables. It must be noted that in terms of the
modified conceptual model (Figure 1.2), brand commitment is not included in
this research.
1.4 RESEARCH QUESTIONS AND HYPOTHESES
1.4.1 Research questions Given the purpose of the research and the stated research objectives, a
number of research questions present themselves:
What is the impact of the identified independent brand identity variables on
the NMMU brand identity?
What is the impact of brand identity (moderating variable) on the dependent
variable, perceived brand image?
What are the perceptions of NMMU stakeholders of brand image?
What are the expectations and actual experiences of NMMU stakeholders
of brand image?
Are there any disparities (“gaps”) between NMMU stakeholders’
expectations and actual experiences with regard to the brand image?
Which dimensions of the perceived NMMU brand image, if any, need to be
addressed to enhance the image of the institution?
1.4.2 Research hypotheses Based on the modified conceptual model (Figure 1.2), three sets of hypotheses
can be formulated, as substantiated by secondary sources (literature) on

-12-
branding, brand identity and brand image. Two sets of hypotheses can be
labelled as directional (or relational) hypotheses, whilst the third set represents
a null and alternate hypothesis.
First set of hypotheses: Effect of brand identity variables on brand
identity.
H1.1: There is a positive relationship between the variable ‘reputation’
and brand identity.
H1.2: There is a positive relationship between the variable ‘relevance’ and
brand identity.
H1.3: There is a positive relationship between the variable ‘personality’
and brand identity.
H1.4: There is a positive relationship between the variable ‘performance’
and brand identity.
H1.5: There is a positive relationship between the variable ‘relationship’
and brand identity.
Second set of hypotheses: Effect of brand identity on perceived brand
image.
H2.1: There is a positive relationship between brand identity and
perceived brand image of the NMMU.
Third set of hypotheses: Perceptions of stakeholders of expectations
and actual experiences of the perceived NMMU brand image.
H3.0: There are no perceived differences between stakeholders’
expectations and actual stakeholders’ experiences of the NMMU brand

-13-
image.
H3.A: There are perceived differences between stakeholders’
expectations and actual stakeholders’ experiences of the NMMU brand
image.
1.5 ROLE OF SECONDARY SOURCES The constructs of Figure 1.1 and Figure 1.2 are derived from and built upon an
analysis of relevant secondary sources (literature). The purpose of the literature
review is to provide proof of scholarship; in other words, to demonstrate
understanding of the literature and proof of intellectual capacity to read it, and
to use it constructively within the context of this research. A good understanding
of the meaning and implications of concepts such as brand, brand identity,
brand image, brand knowledge, awareness and commitment was a prerequisite
for the construction of Figures 1.1 and 1.2.
Two chapters (Chapters Three and Four) are dedicated to the analysis of the
relevant secondary sources, which acquainted the researcher with the branding
theories underlying Figures 1.1 and 1.2.
1.6 PROPOSED RESEARCH METHODOLOGY The positivistic research paradigm is proposed for this research project. One of
the prime reasons for adopting a positivistic paradigm can be linked to the
relationships and hypotheses to be tested, as illustrated in Figure 1.2.
For postgraduate research, it is necessary to fully motivate the chosen research
paradigm. An entire chapter (Chapter Two) is dedicated to the explanation and
motivation of the research design and methodology adopted in this study.

-14-
1.7 DATA COLLECTION AND ANALYSIS
1.7.1 Data collection For the purpose of this research, the NMMU key stakeholders comprise only
the students; academic, administrative and technical staff members; alumni;
and organised businesses who are members of the Port Elizabeth Regional
Chamber of Commerce and Industry (PERCCI). The above stakeholder groups
represent the total target population of this research.
With regard to data collection, the sampling frames, method of primary data
collection, structure of the research instrument (questionnaire) and the
strategies followed in administering the research instrument, will be fully
explained.
1.7.2 Data analysis
The data analysis will be conducted in six phases. Firstly, the data will be
subjected to an exploratory factor analysis to assess the discriminant validity of
the research instrument. Secondly, the reliability (internal consistency) of the
research instrument will be assessed by means of Cronbach alpha reliability
coefficients. Next, a multiple linear regression analysis to assess the impact of
brand identity variables on brand identity will be performed. Fourthly, linear
regression analysis will be used to establish the relationship between brand
identity and brand image. Fifthly, to assess any differences between
stakeholders’ expectations and actual experiences when using the NMMU
brand, pair-wise t-tests will be conducted. Finally, to gauge the level of
satisfaction of NMMU stakeholders when using the brand, a “gap” analysis will
be undertaken, using the mean scores to find relative percentage ratings.

-15-
Activities in terms of these phases will be presented in detail in Chapter Six.
1.8 SCOPE AND DELIMITATION OF RESEARCH
In terms of the modified conceptual model (Figure 1.2), this research focuses
on the independent variables impacting on brand identity, and the influence of
brand identity on the NMMU brand image. The primary research objective
focuses on the relationship between brand identity and brand image, also
searching for possible disparities between NMMU stakeholders’ perceptions of
brand image and their actual experiences with regard to the brand. Although,
for the sake of completeness, Higher Education Institution environments were
included in both Figures 1.1 and 1.2, this group of variables has been excluded
from the research, for the reasons stated.
For cogent reasons, empirical perspectives on the NMMU brand commitment
have been excluded from this research. The first motivation for excluding this
component relates to the newness of the NMMU brand. Brand commitment
needs to be assessed on established brands. The second motivation for
excluding brand commitment from this research relates to the use of the
conversion model developed by Hofmeyr and Rice (2000, 1995), which would
have brought a further, extended dimension to this research. Brand
commitment and the implementation of the conversion model may obscure the
focus of the relationships identified in Figure 1.2, hence their exclusion.
1.9 PRIOR RESEARCH
The initial step in the research was to undertake a comprehensive international
as well as national literature search on branding, with particular emphasis on
aspects pertaining to brand identity, brand image and brand commitment. At

-16-
international level, the literature search entailed the usage of various library
facilities to acquire relevant and appropriate sources of information. Computer
searches through online databases such as SABINET, EBSCO host and
Google were conducted to obtain relevant indices and international dissertation
abstracts. Simultaneously, at national level, an in-depth library search was
undertaken. To assist in this regard, an Internet search was conducted for
relevant books, articles and other appropriate literature on research per se, and
on topics related to branding, brand identity and brand image.
It was established that, over the past decade, extensive research has been
undertaken on brand image, brand identity and brand commitment as
applicable to profit-seeking business enterprises. No stand-alone research has
been undertaken that focuses exclusively on Higher Education Institutions in
South Africa, except the two studies by Coop (2002, 2004), which both include
tertiary institutions such as business schools as a component of the empirical
investigations.
Coop (2002) investigated the importance and relevance of brand image and its
impact on customer-based brand equity in identified MBA business schools.
While a central focus of the thesis by Coop (2004) is the relative importance of
brand identity as a driver of brand commitment, the focus of this research is the
role of brand identity in shaping brand image, linked further to stakeholders’
perceptions of brand image expectations and their actual experiences with
regard to the NMMU brand.
1.10 PLAN OF RESEARCH
Chapter One provides the background to the research, leading to the
introduction and problem definition of the issues in question. The research

-17-
objectives, research questions and hypotheses were generated, linked to a
modified conceptual model, to be tested empirically.
In Chapter Two, the research design and methodology to be adopted for this
research will be explained and motivated.
Chapter Three, the first chapter dealing with the analysis of secondary sources,
will focus on brands and new paradigms on branding, as well as brand equity
and all theoretical background underlying the construct of Figure 1.2.
Chapter Four, the second chapter dedicated to secondary sources, will
provide greater clarify on brand identity, brand image and other related
concepts. The outcome of Chapters Three and Four is the modified conceptual
model (Figure 1.2), which will be tested empirically.
Chapter Five will focus on primary data collection and primary data sourcing
techniques.
The first part of Chapter Six contains an analysis of the primary data and
explains the data analysis phases and procedures. The empirical findings are
presented in the second part of Chapter Six.
Chapter Seven will present a summary of the research, with the emphasis on
the empirical findings. Based on the empirical findings, conclusions and
recommendations will be presented. These recommendations which will be of a
strategic nature, will be submitted for the consideration of the NMMU marketing
communication strategists. This chapter will also identify the possible
shortcomings of this research and directions for future research.
________ II ________

-18-
CHAPTER TWO
RESEARCH DESIGN AND METHODOLOGY
2.1 INTRODUCTION
This chapter addresses the first secondary research objective, as stated in
Section 1.3.2 of Chapter One, namely to investigate which research paradigms,
research methodologies and data collection methods and methods of analyses
would be most appropriate to the research problem in question. This objective
implies that an appropriate overall research design for the study must first be
determined.
There is consensus in research literature (Leedy & Ormrod 2005:1; Collis &
Hussey 2003:1; Zikmund 2003:5) that the features and purpose of research
revolve around the fact that research entails a process of thorough and rigorous
enquiry and investigation, systematic and methodical in nature, and aimed at
increasing knowledge. The aim of this study is to perform a rigorous enquiry
and investigation into the brand identity and brand image of the NMMU, in order
to increase knowledge on these issues.
In this study, which focuses on the relationships as depicted in Figure 1.2
(modified conceptual model) of Chapter One, effect will be given to the basic
features and purpose of research in general. A specific research problem, as
well as primary and secondary research objectives, were identified, as listed in
Section 1.3 of Chapter One.
A thorough and rigorous research approach has been adopted in the design
and execution of this research project, adhering to requirements of a good

-19-
FIGURE 2.1: Research design framework on NMMU brand identity and brand image
Source: Researcher’s own construct. Partly adapted from Collis & Hussey (2003:83)
2.3.3Positivistic
Outcomes
PURPOSE OF RESEARCH
Experience Skills
2.3RESEARCH PARADIGMS
RESEARCHER
2.4CRITERIA FOR
GOOD RESEARCH
2.4.1Reliability
2.4.2Validity
2.4.3Generalisability
2.4.4Other criteria
Knowledge
2.2.1♦ Quantitative♦ Qualitative 2.2.2
♦ Exploratory♦ Descriptive♦ Analytical ♦ Predictive
2.2.3♦ Deductive ♦ Inductive
2.2.4♦ Applied ♦ Basic
2.5.1Data sourcing
2.5.2Data analysis
Methods
2.1RESEARCH TITLE,
PROBLEM DEFINITION, RESEARCH OBJECTIVES, RESEARCH QUESTIONS
AND HYPOTHESES
2.3.2Phenomenological
2.2Types of research
2.5RESEARCH
METHODOLOGY

(20)
research project (Collis & Hussey 2003:1; 19).This chapter, which deals with
the overall research design, comprises four main sections. In order to elaborate
on the research design, a ‘research design framework’ was constructed, as
shown in Figure 2.1.
The centre square block in Figure 2.1 (numbered 2.1, which corresponds with
the introductory section of this chapter), reflects the research title, problem
definition, research questions, and the hypotheses of this research (the
research questions and hypotheses were initially stated in Section 1.4 of
Chapter One). This centre block is linked to the purpose and possible outcomes
of the research. In Chapter One, the purpose of the research was described as
twofold: firstly, to analyse the impact of the independent variables on brand
identity (moderating variable) and its shaping of brand image; and, secondly, to
gauge the perceptions of NMMU stakeholders of the brand image (dependent
variable) of the institution in terms of both expectations and actual experiences
of using the NMMU brand. The above implies the empirical testing of the
modified conceptual model (Figure 1.2 of Chapter One).
Research can be classified into different types (see Section 2.2 of this chapter).
An important pre-condition and requirement for any research project is a
motivated decision on the research paradigms and research methodologies to
be adopted. Section 2.3 of this chapter presents the different research
paradigms, as also shown in Figure 2.1, in which the same numbering as the
headings of this chapter is used.
The criteria for well-designed research are presented within the research
design framework, indicating that effect must be given to these requirements.
Section 2.4 elaborates on the criteria that will be considered and implemented
in this research (see Figure 2.1). The experience and skills of the researcher

-21-
are also accounted for in the research design and overall execution of this
project. Finally, the methodologies on data sourcing and data analysis will be
presented (Section 2.5).
2.2 TYPES OF RESEARCH
Different categories have been identified in which to classify research projects
and research in general. As bases of classification, Collis and Hussey (2003:10)
have distinguished between the purpose, the process, the logic and the
outcome of the research. Table 2.1 lists the main types of research and the
bases of classification.
TABLE 2.1: Classification of main types of research
Source: Adapted from Collis & Hussey (2003:10)
Each of the above types of research will now be examined and contextualised
to this research on the NMMU brand identity and brand image.
2.2.1 Quantitative and qualitative research
Generally speaking, it is possible to distinguish between two main research
approaches, namely the quantitative approach and the qualitative approach
(Blumberg, Cooper & Schindler 2005:124; Leedy & Ormrod 2005:94). The
outstanding features of quantitative and qualitative research can be
Type of research Basis of classification Quantitative or qualitative research Purpose of the research Exploratory, descriptive, analytical or predictive research Process of the research
Deductive or inductive research Logic of the research Applied or basic research Outcomes of the research

-22-
summarised as follows:
The quantitative approach to research is deemed to be objective in nature,
as it focuses on seeking the facts or causes of social phenomena
(Lancaster 2005:67; Collis & Hussey 2003:13). According to Leedy and
Ormrod (2005:94), quantitative research is undertaken to answer questions
about relationships between variables with the purpose of explaining,
predicting and controlling phenomena. Quantitative research is based on
positivistic methodologies, for developing knowledge (i.e. cause-and-effect
relationships; reduction of specific variables in the analysis; and the use of
statistical measurement and observation) (Creswell 2003:18; De Vos,
Strydom, Fouché & Delport 2002:79). Further, quantitative research
employs strategies of inquiry, such as experiments and surveys, and
collects data, using research instruments that yield statistical data. A
quantitative approach therefore involves collecting and analysing data that
can be mathematically and/or statistically interpreted and analysed (Collis &
Hussey 2003:13).
Qualitative research is typically used to answer questions about the
complex nature of phenomena, often with the purpose of describing and
understanding such phenomena from the participants’ point of view (Leedy
& Ormrod 2005:94). Lancaster (2005:67) argues that the qualitative
research approach is mainly used when the researcher needs to gather
and analyse detailed data that cannot be mathematically or statistically
interpreted and analysed, such as ideas, attitudes or feelings. Creswell
(2003:17) states that the qualitative researcher collects data using a
research instrument, or gathers information by means of a behavioural
checklist. Qualitative research is, therefore, fundamentally interpretive. This
implies that the researcher interprets the data and then draws conclusions

-23-
about its meaning (Creswell 2003:182; De Vos et al. 2002:79).
The question now arises into which category the research in question should be
classified. Given the relationships shown in Figure 1.2 of Chapter One and the
fact that the primary data on brand identity and brand image will be of a
quantitative nature, it is evident that this research should be classified as
quantitative. The quantitative approach is a more appropriate choice for a study
with this type of objective, namely to gain a deeper understanding of the
relationship between brand identity variables on brand identity and its shaping
of the brand image (cause-and-effect relationships). Further, when searching
for possible disparities (“gaps”) between the expectations linked to the NMMU’s
brand image and the actual experience of this brand, quantitative data is better
suited.
2.2.2 Exploratory, descriptive, analytical and predictive research
The concepts exploratory, descriptive, analytical and predictive must first be
briefly explained before a decision can be motivated on how the research in
question should be classified.
Exploratory research is undertaken to reveal the issues related to the
problem definition (Jankowicz 2005:199). An outstanding characteristic of
exploratory research is that it is ideally undertaken when few or no earlier
studies have been conducted on a research problem that may serve to
verify findings (Collis & Hussey 2003:10; Zikmund 2003:54-55). Gaining
insights and a better understanding of the research problem, which ensures
a more rigorous investigation, is a further feature of exploratory research.
This type of research looks for patterns, ideas or hypotheses, rather than
testing or confirming the hypotheses. As stated in Section 1.6 of Chapter

-24-
One, a substantial amount of prior research on brand identity and brand
image has been undertaken, implying that this study will not carry strong
exploratory features.
Descriptive research characteristically describes phenomena as they exist.
It is used to identify and obtain information on the characteristics of a
specific problem or issue (Zikmund 2003:55). The aim of descriptive
research is to describe or define a problem, often by creating a profile of a
group of problems, people or events (Blumberg et al. 2005:10). Descriptive
research examines problems more intensively than exploratory research,
since it also ascertains and describes the characteristics of the pertinent
issues (Collis & Hussey 2003:11). The variables of brand identity and brand
image associations were described in Chapter One and will be further
discussed in Chapters Three and Four.
Analytical or explanatory research goes beyond merely describing the
characteristics of phenomena; it also analyses and explains why or how
events are happening. The aim of analytical research is to understand
phenomena by discovering and measuring cause-and-effect relationships
between them (Collis & Hussey 2003:11; Zikmund 2003:56). In analytical
research, theories or hypotheses need to be constructed and formulated to
account for the forces that caused a certain phenomenon (Blumberg et al.
2005:10). An important element of analytical research is identifying and,
possibly, controlling the variables in the research activities, since this allows
for a better explanation of the critical variables or the causal links between
the characteristics. The characteristics of analytical research feature
prominently in a decision on how this study on NMMU brand identity and
brand image should be classified.

-25-
According to Blumberg et al. (2005:12), predictive research goes even
further than analytical research and is rooted equally in theory and
explanation. Predictive research generalises from the analysis by predicting
certain phenomena on the basis of hypothesised relationships. If the
predictive research can provide a valid, robust solution based on a clear
understanding of the relevant causes, the solution to a problem in a
particular study will be applicable to similar problems elsewhere (Collis &
Hussey 2003:12). This type of study often calls for a high level of inference.
Once a phenomenon can be explained and predicted, a capability to control
it is expected (Blumberg et al. 2005:12).
As explained in Section 1.2 of Chapter One, the purpose of this research is
firstly to analyse the impact of the independent variables on brand identity
(moderating variable) and its shaping of brand image (dependent variable); and,
secondly, to gauge the perceptions of NMMU stakeholders of the brand image
of the institution. Taking the purpose of the study and the objectives of the
research into account, this research can at best be defined as analytical.
Further, the modified conceptual model (Figure 1.2) of Chapter One reflects
that three sets of hypotheses will be tested. All these cause-and-effect features
clearly indicate that the current study should be classified as an analytical
research.
2.2.3 Deductive and inductive research
The concepts deductive and inductive pertain to the type of methodological
reasoning that takes place during the research process. Deductive research is
undertaken when a conceptual and theoretical structure is developed and then
tested by empirical observations (for example, the conceptual model as
depicted in Figure 1.2 of Chapter One). This reasoning implies that particular

-26-
instances are deduced from general inferences (Collis & Hussey 2003:15).
Deductive and inductive research is further characterised by the following
features:
Deductive research reasoning develops theories or hypotheses about a
problem and then tests these theories or hypotheses through empirical
observations (Lancaster 2005:22). A deduction is valid if it is impossible for
the conclusion to be false if the underlying premises in question are true
(Blumberg et al. 2005:22; Zikmund 2003:47-56). Deductive research is
further characterised by cause-and-effect relationships, which are clearly
associated with the positivistic research paradigm.
Inductive research reflects a reasoning process through which a general
proposition is established on the basis of the observation of particular facts
(Zikmund 2003:47). This mental process of inductive research implies that
general inferences are induced from particular instances. Therefore,
inductive research essentially reverses the process found in deductive
research and is a key feature of qualitative research (Lancaster 2005:25).
The research in question can evidently be labelled as deductive. As explained
in Chapter One, general theories on brand identity and brand image (from
secondary sources) were applied in developing the conceptual model, as
presented in Figure 1.2. The conceptual model, which depicts cause-and-effect
relationships, will also be tested by means of empirical observations, using
statistical data. As stated, the underlying deductive methodological assumption
clearly points towards a positivistic research paradigm, which will be discussed
further in Section 2.3 of this chapter.

-27-
2.2.4 Applied and basic research
It is possible to classify research into either applied or basic research. The
distinguishing features of applied and basic research are the following:
Applied research is characterised by the usage of the research findings to
solve a specific, existing problem (Collis & Hussey 2003:13; Zikmund
2003:7). Therefore, this type of research has a practical problem-solving
emphasis, which means that it is conducted in order to find answers to
specific questions (particularly business-related questions), related to
action, performance or policy needs (Blumberg et al. 2005:13).
Basic research, on the other hand, is sometimes also referred to as
fundamental or pure research. When the research problem is of a less
specific nature, and when the research is conducted primarily to improve
the understanding of general issues, without emphasis on immediate
application, basic research is undertaken (Collis & Hussey 2003:14;
Zikmund 2003:7). Blumberg et al. (2005:13) are of the opinion that basic
research is also problem-solving based. It aims to solve a perplexing
question of a theoretical nature that has little direct impact on action,
performance or policy decisions.
The aim of applied research is, as stated above, to apply its findings to solve
specific and existing problems, as also presented in the research questions on
the NMMU brand identity and brand image. Therefore, the nature of the
research in question does carry strong application and practical useful features.

-28-
2.2.5 Conclusions on types of research
Based on the discussion above, the following may be concluded: Firstly, the
research in question will be of a quantitative nature. This categorisation is
based on the relationship depicted in Figure 1.2 (Chapter One), which shows
that specific data will be sourced on independent brand identity variables, the
moderating variable (brand identity) and the dependent variable (brand image),
which will require statistical analysis. Secondly, the research clearly carries
typical analytical features, because the impact of the independent variables on
the moderating variable and the dependent variable will be assessed. Thirdly,
this research can be labelled as deductive, because general theories
(statements in the research instrument) on brand identity and brand image with
regard to the NMMU will be developed and then tested empirically. Finally, this
research may be classified as applied, because the findings of the research in
question may be useful to marketing communication strategists to enhance the
NMMU brand image.
2.3 DIFFERENT RESEARCH PARADIGMS
2.3.1 Introduction of two main research paradigms
Among the various basic research approaches that exist, two main research
paradigms or philosophies may be distinguished, despite considerable
overlapping, respectively referred to as “positivist” and “phenomenological”
(Collis & Hussey 2003:47). Some authors (Blumberg et al. 2005:18; Jankowicz
2005:111) prefer to use the philosophical perspective towards research to
prevent confusion with a methodology known as phenomenology. The
phenomenological paradigm is also known as the qualitative, subjectivist,
humanistic or interpretive research paradigm (Collis & Hussey 2003:47). The

-29-
positivistic paradigm is alternatively known as the quantitative, objectivist,
scientific, experimentalist or traditionalist research paradigm.
The methodological assumption underlying research is concerned with the
research process. Positivists usually apply a deductive reasoning process,
looking for cause-and-effect relationships, and their research is deemed to be
accurate and reliable, through validity and reliability. Phenomenologists, on the
other hand, apply the inductive process, searching for patterns that may be
repeated in other similar situations (Collis & Hussey 2003:50).
The two main paradigms will now be examined in greater detail to reach a
motivated decision regarding the adoption of an appropriate research paradigm
for this study.
2.3.2 Positivistic (quantitative) paradigm
Positivistic paradigms comprise several beliefs about how a researcher can
make sense to others. These paradigms are based on the assumption that
nobody is perfect; all human beings are fallible. Positivism is based on realism:
it searches for the truths ‘out there’. Truth can be recognised in only two ways:
by seeing that an assertion makes sense by itself and is consistent with
deductions made from it; or by recognising that it is supported by empirical
evidence (Jankowicz 2005:110).
The positivistic paradigm is founded on the belief that human behavioural
studies should be conducted in the same way as studies in the natural sciences.
This belief is based on the assumption that social reality is independent of
research objectives and exists regardless of whether or not we are aware of it.
Therefore, the ontological debate of what constitutes the nature of reality can

-30-
be kept distinct from the epistemological question of how a researcher can
obtain knowledge of that reality. The act of investigating reality has no effect on
that reality (Blumberg et al. 2005:18-19; Collis & Hussey 2003:52).
Positivists’ response to the question regarding the nature of the relationship
between the researcher and the problem is based on three fundamental
principles:
The social world exists externally and is viewed objectively.
Research is value-free.
The researcher is independent, taking the role of an objective analyst.
The above principles may be seen as the epistemological assumption (i.e. the
relationship of the researcher to what is researched) underlying the quantitative
approach (Blumberg et al. 2005:18).
2.3.3 Phenomenological (qualitative) paradigm
The phenomenological paradigm or mindset towards research is concerned
with understanding human behaviour from the participants’ own frame of
reference. Phenomenological mindsets focus on the meaning rather than on
the measurement of social problems (Collis & Hussey 2003: 53).
Phenomenological research describes the meaning several individuals attach
to the actual experiences related to a concept or a phenomenon (Miller &
Salkind 2002:51). This paradigm essentially searches for the care or central
underlying meaning of the experience related to the problem. This implies that
researchers who have adopted the phenomenological approach have to
interact personally with the objects (units of analysis) being investigated. They
would often seek an expert opinion to answer their research questions, rather

-31-
than sample a large group within the research population.
The principles of the phenomenological paradigm can be summarised in terms
of the following:
The social world is constructed and is given meaning subjectively by
people.
The researcher is part of what is observed.
Research is driven by the interests of the researcher (Blumberg et al.
2005:19).
Collis and Hussey (2003:53-55) are of the opinion that the phenomenological
paradigm developed as a result of criticism levelled against the positivistic
paradigm.
The phenomenological paradigm has the following features, namely:
It tends to produce qualitative data.
It is concerned with generating theories, using the inductive approach.
Data is rich and subjective.
It generalises from one setting to another.
It uses small samples.
2.3.4 Comparison between positivistic (quantitative) and phenomenological
(qualitative) paradigms
Table 2.2 recapitulates the key features of the two main research paradigms.

-32-
TABLE 2.2: Comparison between positivistic (quantitative) and phenomenological (qualitative) approaches
Positivistic (quantitative)
paradigm Phenomenological (qualitative)
paradigm Epistemological roots in positivism Epistemological roots in phenomenology Purpose is to test predictive and cause-and-effect hypotheses about social reality
Purpose is to construct detailed descriptions of social reality
Concerned with hypotheses testing Concerned with generating hypotheses Reasoning process utilises deductive logic Reasoning process utilises inductive logic Suitable for a study of phenomena that are conceptually and theoretically well developed; seeks to control phenomena
Suitable for a study of a relatively unknown terrain; seeks to understand phenomena
Concepts are converted into operational definitions; results appear in numeric form and are eventually reported in statistical language
Participants’ natural language is used in order to come to a genuine understanding of their world
The research design is standardised according to a fixed procedure and can be replicated
The research design is flexible and unique and evolves throughout the research process; there are no fixed steps that should be followed and the design cannot be exactly replicated
Data are obtained systematically and in a standardised manner
Data sources are determined by the information richness of settings; types of observations are modified to enrich understanding
Data are obtained systematically and in a standardised manner
Data sources are determined by the information richness of settings; types of observations are modified to enrich understanding
Tends to produce quantitative data Tends to produce qualitative data Uses large samples Uses small samples Data is highly specific and precise Data is rich and subjective Location is artificial Location is natural Reliability is high Reliability is low Validity is low Validity is high Generalises from sample to population Generalises from one setting to another
The unit of analysis is variables that are atomistic (i.e. elements that form the whole)
The unit of analysis is holistic, concentrating on the relationships between elements, contexts, etc.; the whole is always more than the sum
Sources: Adapted from Collis & Hussey (2003:55) and De Vos et al. (2002:81)

-33-
2.3.5 Conclusions: motivation for adopted research paradigm
Table 2.3 is further instrumental in providing final, convincing arguments in
favour of the positivistic paradigm as the appropriate research approach for this
study. Questions are posed in the first column of Table 2.3 and answered in
terms of both the positivistic and phenomenological approaches (second and
third columns). These questions must also be linked to the research problem,
research objectives, research questions and hypotheses of this study. It is
evident that the responses given in terms of the quantitative approach (second
column) mirrors the best when testing the modified conceptual model pertaining
to the brand identity and brand image of the NMMU.
TABLE 2.3: Motivation for the decision on positivistic (quantitative)
approach
Question Positivistic (quantitative) Phenomenological (qualitative)
What is the purpose of the research?
• To explain and predict • To confirm and validate • To test theory
• To describe and explain • To explore and interpret • To build theory
What is the nature of the research process?
• Focused • Known variables • Established guidelines • Predetermined methods • Somewhat context-free • Detached view
• Holistic • Unknown variables • Flexible guidelines • Emergent methods • Context-bound • Personal view
What is the data like, and how is it collected?
• Numeric data • Representative, large sample
• Standardized instruments
• Textual and/or image-based data • Informative, mall sample • Loosely structured or non-standardised observations and interviews
How is data analysed to determine its meaning?
• Statistical analysis • Stress on objectivity • Deductive reasoning
• Search for themes and categories • Acknowledgment that analysis is subjective and potentially biased
• Inductive reasoning
How are the findings communicated?
• Numbers • Statistics, aggregated data • Formal voice, scientific style
• Words • Narratives, individual quotes • Personal voice, literary style
Source: Adapted from Leedy & Ormrod (2005:96)

-34-
Besides the above arguments, the questions posed in Table 2.3 can collectively
be answered as follows:
Given the nature of the problem definition of the research in question, the
positivistic approach seems most appropriate to gauge the opinions
(perceptions) of the respondents on NMMU brand identity and brand image.
The construct of Figure 1.2 (Chapter One) shows a relationship between the
independent variables on the brand identity (moderating variable) and the
impact of brand identity on brand image (independent variable). Further,
quantitative data will also be sourced from different sampling frames. This
implies that large samples of respondents will be drawn to source primary data
that must be suitable for statistical analysis. The decision to employ the
positivistic paradigm requires the researcher to use a large sample, so that the
findings from a representative sample may be taken to be true for the entire
population.
As depicted in Figure 1.2 of Chapter One, stakeholder perceptions on brand
image must be assessed in this study. The positivistic research paradigm and
its associated data collection and data analysis methodologies are therefore
regarded as suitable to give effect to the research objectives and test the
hypotheses of this research, as stated in Section 1.4.2 of Chapter One.
The phenomenological paradigm is not relevant for this research, because a
modified conceptual model is to be tested empirically. Further, the research in
question will focus on testing hypotheses rather than generating theories, as
would apply in terms of the phenomenological paradigm.

-35-
2.4 CRITERIA FOR A WELL-DESIGNED RESEARCH PROJECT
Having explained why the positivistic paradigm has been identified as the
appropriate research methodology for this study, it is important to ensure that
the criteria for a well-designed research project are imbued in the overall design
framework of this study (see Figure 2.1 of this chapter). Three basic sets of
criteria are widely used to evaluate a well-designed research project. They are:
reliability; validity; and generalisability. Besides the above, a collection of other
criteria may be added. It is important to demonstrate how this research project
accommodates the above-mentioned criteria.
2.4.1 Reliability
According to Blumberg et al. (2005:385), reliability means many things to many
people, but in most contexts the notion of consistency emerges. Reliability
pertains to the accuracy and precision of a measurement procedure. Collis and
Hussey (2003:58) argue that reliability is concerned with the credibility of the
research findings. Research findings are supposedly reliable if another
researcher obtains the same results on replicating the research.
A research instrument is deemed to be reliable to the extent that it contributes
towards consistent results. A typical example is a bathroom scale that
consistently overweighs a person with five kilograms. If the scale erratically
overweighs from day to day, it is not reliable and can therefore not be regarded
as valid. Reliability is a necessary contributor to validity but is, however, not a
sufficient condition for validity (see Section 2.4.2 of this chapter) (Blumberg et al.
2005:385).
The reliability of the findings of a research project is closely linked to the

-36-
methods of data sourcing and the design of the research instruments.
Positivists can follow a number of reliability estimates to ensure the authenticity
of their findings. Several experts (Blumberg et al. 2005:385-389; Leedy &
Ormrod 2005:93; Collis & Hussey 2003:186-187; Zikmund 2003:300-301) are
of the opinion that the reliability of research responses (and the research
instrument) can be enhanced in the following three ways:
Test re-test method: In this method, the same questionnaire is administered
twice to the same respondents, but on two separate occasions. The
responses for the two ‘tests’ are correlated and a correlation coefficient for
the two sets of data is computed, thus providing an index of reliability. The
interpretation of correlation coefficients (zero, negative, positive) is
well-known in statistical literature.
Split-halves method or parallel forms: The questionnaires are divided into
two equal halves (numbers) and the correlation coefficient of the two sets of
data is then computed and interpreted.
Internal consistency: The aim of this method is to establish which items on
the research instrument are homogenous and reflect the same underlying
constructs, for example, the constructs on which the research in question is
founded (see modified conceptual model, Figure 1.2 of Chapter One).
Every item in the questionnaire (research instrument) is correlated with
every other item across the entire sample and the average inter-item
correlation is used as the index of reliability. The outcome of the
calculations is the Cronbach alpha reliability coefficients (Cooper
1983:141-146). For the research in question, Cronbach alpha reliability
coefficients will be calculated to assess the reliability of the research
instrument.
In addition to testing for acceptable Cronbach alpha coefficients, the reliability

-37-
of the research instrument was enhanced in several ways. Firstly, the research
instrument was extensively pilot tested, followed by a Cronbach alpha reliability
coefficients calculation to ensure that the items in the research instrument
actually were associated with each other. This was done before the research
instrument was administered. Secondly, the research instrument (questionnaire)
was administered in a consistent manner; in other words, a standardised
procedure was used to administer the questionnaire to the respondents. Thirdly,
specific criteria were established for this research, e.g. the choice of an
appropriate research design with appropriate data collection and analysis
methodologies. Fourthly, the research assistants who helped to administer the
research instrument were all well trained (Leedy & Ormrod 2005:93).
Measures taken to ensure the reliability of this research, included designing a
relevant and contextualised questionnaire (research instrument); using
secondary data sources (literature on brands, branding, corporate branding,
brand identity and brand image); and selecting appropriate methods of
choosing a sample and sample size. The choice and drawing of the sample, as
well as the statistical procedures used, will be described in Chapter Five.
2.4.2 Validity (internal validity)
It is important that research findings reflect accurately what is actually
happening ‘out there’, for example, the environment of the research (Collis &
Hussey 2003:58-59). A research instrument must have the ability to measure
what it intends to measure before claims of validity can be made (Blumberg et
al. 2005:380). Validity can also be defined in terms of the absence of
self-contradiction (Lancaster 2005:71).
Validity is closely linked to the research instrument used. As stated, the validity

-38-
of a research instrument is the extent to which it measures what it is supposed
to measure (Leedy & Ormrod 2005:28). Validity takes on different forms; each
form is important in different situations (Blumberg et al. 2005:380; Leedy &
Ormrod 2005:28; Zikmund 2003:301-304).
The various forms of validity include:
Face validity, which is the extent to which, on the surface, an instrument
appears to be measuring a particular characteristic. An example would be
when subjective agreement exists among professionals that a scale
logically appears to reflect accurately what it intends to measure (Zikmund
2003:302).
Content validity, which is the extent to which a research instrument is able
to reflect the findings in respect of a representative sample of the content
area (domain) being measured.
Criterion validity, which reflects the success of the measure used for
prediction or estimation.
Construct validity, which, according to Zikmund (2003:303), is established
by the degree to which a measure confirms a network of related
hypotheses generated from a theory based on the concepts. Construct
validity implies that the empirical evidence generated by a measure is
consistent with the theoretical logic about the concepts. When researchers
ask questions (or make statements) as a way of assessing an underlying
construct, they should have obtained some kinds of evidence that their
approach does, in fact, measure the construct in question (Leedy & Ormrod
2005:92). For this research, the construct as presented in Figure 1.2 of
Chapter One is based on an extensive analysis of secondary sources on
brands and brand concepts. Construct validity is established during the
statistical analysis of the data. The related concept, discriminant validity,

-39-
can be assessed only during the data analysis phase. This will be done in
Section 6.3.1 of Chapter Six.
As mentioned in previous sections, the positivistic paradigm focuses on the
precision of measurement and the ability to repeat the experiment. Research
errors, such as faulty research procedures, poor samples and inaccurate or
misleading measurement, can undermine validity (Collis & Hussey 2003:59).
Jankowicz (2005:111) also argues that measurement should be accurate,
reflecting the information contained in the data in an unbiased way, to ensure
validity.
For this research, it is imperative that validity be ensured. To meet this
requirement, preconditions are that the overall research design of the study
must be sound; that the most relevant research procedures be adopted; that
appropriate samples be drawn; and that suitable statistical procedures be
followed. More information on the primary data sourcing and statistical analysis
procedures followed in this study will be provided in Chapters Five and Six.
2.4.3 Generalisability (external validity)
Generalisability can be defined as the extent to which the researcher can come
to conclusions about one thing (often a population), based on information on
another (often a sample). In other words, generalisability is the ability to
generalise beyond the data of an experiment to other subjects or other groups
in the population under study (Zikmund 2003:273). Generalisability is
concerned with the application of research findings to cases or situations
beyond those examined in the study (Collis & Hussey 2003:59). With regard to
the research in question, generalisability implies that the findings of the NMMU
stakeholders’ sample can be applied to the entire population of stakeholders of

-40-
the NMMU who have certain perceptions of the brand image of the University.
2.4.4 Other criteria for a well-designed research project
In addition to reliability, validity and generalisability as important basic research
requirements, a good research project should display attributes such as the
following (Jankowicz 2005:55-56; Collis & Hussey 2003:19):
Originality: This requirement implies the capacity to act or to think
independently regarding the research and not to simply copy someone
else’s work. Originality is therefore an important attribute when research is
conducted. In this research, originality was inter alia demonstrated by the
construct of Figure 1.2 of Chapter One, as well as the research design
framework of this chapter (Figure 2.1).
A scientific theoretical base: This criterion refers to a critical and
contextualised literature review on which the research is founded. For the
research in question, an analysis of the relevant secondary sources will be
undertaken in Chapters Three and Four. This analysis of secondary
sources will be used to generate the statements in the research instrument
(questionnaire).
Purposiveness: This requirement pertains to the precondition that the
researcher should have a clear aim or objective in mind with the research,
as was demonstrated in Section 1.2 of Chapter One.
Logical research framework: This criterion is underpinned by Figure 2.1 of
this chapter, which depicts the research design framework of this research.
An analytical approach: The meaning and context of analytical research
was explained in Section 2.2.2 of this chapter.
Underpinned by conceptual framework: A conceptual framework that will be
tested empirically was presented in Figure 1.2 of Chapter One.

-41-
Integration between research methodology, literature review, data analysis
and conclusions: This holistic requirement will be demonstrated in Chapter
Seven, where the conclusions of the research, which follow logically from
the findings, will be presented. The research findings have to contribute
towards the existing body of knowledge on the field of branding. Further,
the implications will be explained and the recommendations made will be
robust in terms of practicality.
2.5 METHODS OF DATA SOURCING AND ANALYSIS
In Figure 2.1, ‘research methodology’ (numbered 2.5) is shown on the
right-hand side of the research title block. Methodology refers to the overall
approach to the research process, as explained in this chapter. Methods, on the
other hand, refer to the various means through which data can be collected
(sourced) and/or analysed.
Two types of data will be sourced in this study, namely secondary and primary
data. In this research, secondary data will be sourced from existing sources by
means of an extensive literature review of research methodologies, branding
and literature on related concepts (Chapters Three and Four), while primary
(raw) data will be sourced by means of a survey. A survey follows a positivistic
methodology, in terms of which a sample of subjects is drawn from a population
and studied to make inferences about the population. When the population is
large, as in the case of NMMU stakeholders, it would be too time-consuming
and expensive to collect data about all the members of the population, and
therefore only a sample of the whole population is used. The sample to be
drawn will be representative, to make it possible to use statistical techniques to
demonstrate the likelihood that the characteristics of the sample will also be
found in the whole population. In another words, it will be possible to generalise

-42-
from the research findings (Jankowicz 2005:221; Collis & Hussey 2003:63-64).
The primary data sourcing methods and the data analysis for this research will
be discussed in the following sections.
2.5.1 Primary data sourcing
As stated in Section 1.1 of Chapter One, the NMMU key stakeholders comprise
students; academic, administrative and technical staff members; parents of the
students; alumni; the national and provincial governments; and the business
community at large. The above stakeholder groups represent the total
population of this research.
For the purpose of this research, the sampling frame is limited to students, all
staff members, alumni and organised business. This limitation of the sampling
frame is based solely on practical considerations in sourcing the required data
from different stakeholder groups. Non-probability (convenience) and
judgmental (purposive) samples were drawn by administering the research
instrument to the identified sampling frames. The desired sample response is a
function of the number of statements in the research instrument times five (5),
in order to perform the required statistical analysis. Chapter Five will elaborate
on the sample size and response rates obtained.
2.5.2 Research instrument (questionnaire)
The research instrument comprises two sections. Section A consists of 60
statements on perceptions about expectations and actual experiences linked to
the NMMU brand. Respondents were requested to use a Likert seven-point
interval scale to indicate their perceptions about the NMMU brand. This interval

-43-
scaled instrument will enable the researcher to perform the inferential statistical
data analysis, as described in Section 2.5.3 of this chapter (Leedy & Ormrod
2005:26-27; Cooper & Schindler 2003:227-228).
Section B of the questionnaire canvasses biographical data of the respondents,
such as the designated sampling frame group (e.g. students, staff, gender and
level of study).
The design and compilation of the research instrument was based on an
intensive analysis of secondary sources on brands, branding, corporate
branding, brand identity and brand image. This analysis served to address the
important dimension of the validity of the research instrument. The newly
designed research instrument was first tested in a pilot study before it was
finally administered to respondents. All required steps were taken to ensure the
reliability, validity and generalisability of the research instrument (Leedy &
Ormrod 2005:27-29; Collis & Hussey 2003:58-60; Cooper & Schindler
2003:231-239).
The questionnaire was administered using several strategies. Students’
opinions were sourced by means of hard copies distributed during contact
lecture sessions. For staff and alumni, the research instrument was made
available on the NMMU Intranet. For organised businesses, the questionnaire
was included in a business journal, together with a reply-paid envelope.
A dedicated chapter (Chapter Five) deals with the primary data sourcing. A
complete explanation will be offered in Chapter Five on the methods of data
sourcing, the sample size, usable questionnaires, and other related
considerations.

-44-
2.5.3 Data analysis
As already indicated in Chapter One, the data analysis consisted of six phases.
Firstly, the data will be subjected to an exploratory factor analysis to assess the
discriminant validity of the research instrument. Secondly, the reliability (internal
consistency) of the research instrument will be assessed by means of
Cronbach alpha reliability coefficients. This phase will be followed by a multiple
linear regression analysis to assess the impact of brand identity variables on
brand identity. Fourthly, a linear regression analysis will be undertaken to
establish the relationship between brand identity and brand image. Fifthly, to
assess any differences between stakeholders’ expectations of and actual
experiences when using the NMMU brand, pair-wise t-tests will be conducted.
Finally, to gauge the level of satisfaction of NMMU stakeholders when using the
brand, a “gap” analysis will be done by using the mean scores to find relative
percentage ratings.
Chapter Six presents the data analysis and empirical findings. As in the case of
data sourcing, the methods of data analysis followed in this research will be
discussed.
2.6 SUMMARY AND CONCLUSIONS
This chapter described the overall research design and methodology to be
used in this study. The questions why, what, when, where, how and on to whom
the research was conducted, were answered in this chapter. At the beginning of
this chapter, a research design framework for the research on brand identity
and brand image was presented (Figure 2.1).
It was motivated that the research in question carries outstanding quantitative

-45-
features; it is labelled analytical due to the relationships to be researched, as
shown in Figure 1.2 of Chapter One; the method of reasoning is deductive and
the research findings have a strategic implication, which is a feature of applied
research.
An analysis of the research problem, the unit of analysis, research questions,
hypotheses and the type of data to be sourced collectively suggested that a
positivistic research methodology should be adopted. The criteria for a
well-designed research project were described, with an indication how these
requirements would be addressed in this research. Finally, a brief overview of
the strategies dealing with primary data sourcing and data analysis was
provided.
By presenting the research design framework, it is evident that the researcher
is aware of the:
types of research and how the research in question should be classified;
different research paradigms and the necessity to motivate the choice of
the adopted paradigm;
criteria for a good research project and the implementation thereof; and
methods of data sourcing and analysis.
The following chapter will present an analysis of secondary sources dealing
with brands, branding, corporate branding and brand equity.
________ II ________

-46-
CHAPTER THREE
PERSPECTIVES ON BRANDS, BRANDING AND BRAND EQUITY
3.1 INTRODUCTION This chapter and the next chapter address the second secondary research
objective as stated in Section 1.3.2 of Chapter One, namely to construct
(design) a research instrument that will canvass the opinions of stakeholders of
the perceived brand image of the NMMU, as shaped by brand identity. To give
effect to this objective requires an in-depth analysis of secondary sources
dealing with brand identity, brand image and all related issues. Secondary
sources refer to all related literature published on the research topic, and on
research per se. This research objective implies that the researcher must
explore and perform an analysis and scrutiny of secondary data dealing with
the research problem.
The fundamental purpose of sourcing and analysing secondary sources, which
is part of the overall data sourcing activity related to the research, is to become
more knowledgeable, gaining a holistic insight into the problem to be
researched. Only through acquiring a holistic understanding of the problem, will
it be possible to construct a theoretical model on brand identity and image of
the NMMU. The research objectives and research questions could not be
phrased without an in-depth understanding of the related terms, concepts,
knowledge of the field of marketing communication, brand identity variables,
brand image, brand equity, brand knowledge, brand awareness and brand
loyalty, to name a few. Further, the prime motivation for undertaking a thorough
and systematic analysis of secondary sources was to design an effective
research instrument, i.e. the questionnaire that will be administered to the
respondents.
-47-
From the above, the important role and function of the systematic sourcing and
analysis of literature should be evident. An analysis of secondary sources must
be done with great care in an effort to condense the meaning of the various
business management models and theories (like marketing models on branding)
underlying the research. Before using any secondary sources, the credibility of
such sources must first be assessed. In respect of previously published
research on brands and related concepts, the following must be ascertained:
What was the purpose of the study, and how does it differ from other
studies and the research in question?
How was the research conducted, and how does it differ from other studies
and the research question?
What were the findings, and how do they differ from the findings of other
similar studies?
What were the limitations and weaknesses of the previous studies?
In addition to the above pertinent questions, the following should also be
assessed to further gauge the credibility and relevance of previously published
research:
The objectivity in the case of research reports.
Is the unit of analysis properly demarcated?
Are the hypotheses or research questions unambiguously stated?
Were appropriate research methodologies used?
How was the data collection done? How? When? By whom?
Secondary data quality is of great importance to any researcher. Books,
journals, research publications, government statistics and business
publications should be screened in terms of data quality. In this respect, issues

-48-
such as the following should be considered:
What was the purpose of the publication? (Why? For whom? How?)
Who has written it? Is the author knowledgeable?
Who has funded the publication?
Overall relevancy of the sources?
The purpose of assessing secondary data quality is to ensure validity, reliability,
accuracy and relevance (Collis & Hussey 2003:84-86).
To obtain the best data quality for the research in question, all of the above
probing questions were asked to assess the credibility of the secondary
sources.
Chapters Three and Four will present a synthesis of the literature dealing with
concepts such as brands, corporate brands, branding, corporate branding,
brand equity, brand identity, brand image, brand perceptions and association,
brand knowledge, brand awareness and brand loyalty and brand commitment.
The role of brand communication will also be investigated. Collectively, the
analysis of all the relevant concepts will be instrumental in the construct of the
conceptual framework of this research and the design of the research
instrument, which should be seen as important outcomes of the analysis of
secondary sources.
This first chapter dealing with secondary sources, focuses on relevant key
concepts such as brands, corporate brands, traditional and contemporary
perspectives on branding and the concept brand equity. The chapter concludes
with indications how the concepts described, are linked to the conceptual model
underpinning the research.

-49-
3.2 THE CONCEPTS ‘BRANDS’ AND ‘CORPORATE BRANDS’
In Chapter One, mention was briefly made of the merger that resulted in the
establishment of the NMMU. It was also indicated that each of the pre-merger
institutions, namely the University of Port Elizabeth, the Port Elizabeth
Technikon and the Port Elizabeth Branch of Vista University, had its own
distinctive brand, brand identity and brand image. Against this background, the
concepts ‘brands’ and ‘corporate brands’ will now be explained.
Increasingly, both profit- and non-profit seeking institutions are realising that
among their most valuable assets are the brand names associated with their
services and products (Keller 2003:2). Institutions experience and appreciate
the numerous benefits offered by a strong brand. Firstly, a strong brand name
simplifies consumer/client decision-making (in the case of the NMMU, the
students and other stakeholders); it reduces risk; and sets expectations.
Creating strong brands that deliver on those expectations, and maintaining and
enhancing the strength of those brands over time, is therefore a management
imperative.
In literature on branding, a distinction is made between the concepts ‘brands’
and ‘corporate brands’. In this section, the similarities and principal differences
between these concepts will be investigated, and the relevance of the concepts
to the research on the NMMU.
3.2.1 Brands defined
A traditional definition of a brand is: “… the name, associated with one or more
items in the product line, that is used to identify the source of character of the
item(s)” (Kotler 2000:396). A brand can also be defined as a contract, one

-50-
which is implicit in nature and which governs the relations between a given
organisation and its customers (Chevalier & Mazzalovo 2004:15).
For the purpose of the proposed research, it is important to note that a branded
product may be a physical good, a service, a store, a place, an organisation, or
an idea. A brand is a name that influences buyers. This definition captures the
essence of a brand: a name with power to influence buyers or, as in the case of
the NMMU, users of educational services (Kapferer 2004:11).
Given the above interpretation, a good contemporary definition of a brand has
been provided by the American Marketing Association (AMA). The AMA defines
a brand as a name, term, sign, symbol, or design, or a combination of these,
intended to identify the goods and services of one seller or group of sellers (and
service providers) and to differentiate them from those of the competition
(Keller 2003:3). This view, technically speaking, reflects that whenever a
marketer (such as a Higher Education Institution like the NMMU) creates a new
name, logo, or symbol for a new product or service, it creates a ‘brand’. This is
exactly what transpired from the incorporation of the Port Elizabeth branch of
Vista University into the University of Port Elizabeth and, finally, the merger
between the University of Port Elizabeth and the Port Elizabeth Technikon, to
form the NMMU. From the above, it should be evident that the NMMU is a new
brand.
It is important to note that a brand is a name that influences buyers. This
definition captures the essence of a brand: a name with power to influence
buyers or users of services (Kapferer 2004:11). In terms of this research, the
NMMU is the brand that was created in the minds of its stakeholders (Wheeler
2003:2).

-51-
Given the above interpretation, the main prerequisites for the establishment of
successful brands can be summarised as follows (Melewar & Walker
2003:168):
Brands should be linked to business strategy.
Brands should reflect a shorthand summary of their business.
Brands should be constantly manifested through the marketing mix.
Brands should be consistently positioned across markets.
Brands should deliver value, which should be expressed in consumer/client
terms.
Brands should portray a continuous relationship between the business and
its brand users.
Good brands should provide a platform for innovation and differentiation.
A Higher Education Institution such as the NMMU should understand its
micro market and macro business environments. Equally important are
considerations such as competitive forces, cultural dynamics and national
identity.
From the above, it is clear that a brand exists when a name has acquired power
to influence the market. What makes a name acquire the power of a brand is
the product or service, together with the people at points of contact with the
market, the price, the places, the communication and all the sources of
cumulative brand experience. This is why brands as active systems comprise
three dimensions: products or services; name; and concept, as illustrated in
Figure 3.1.
The brand system, as presented in Figure 3.1, relates to a concept with
inherent value to products and services that are identified by a name and set of
proprietary signs (that is, the logo and other symbols). This system reflects the

-52-
conditional nature of the brand asset: it exists only if products and services also
exist. Further, differentiation is summarised by the brand concept, which is a
unique set of attributes (both tangible and intangible) that constitutes the value
proposition of the brand.
FIGURE 3.1: The brand system
Source: Adapted from Kapferer (2004:12)
3.2.2 Comparison between product and corporate brands
With reference to contemporary brand management, it is possible to
differentiate between the concepts “product brands” and “corporate brands”.
Product brands can be seen as the name, term, sign, symbol, design, or some
combination of these elements, that helps to identify the products of one firm
and to differentiate them from competitors’ offerings (Boone & Kurtz 1996:390;
Schoell, Dessler & Reinecke 1993:408). Corporate brands, on the other hand,
are defined at the level of the business. At this level, the brand defines that the
business will deliver and stand behind the offering. Therefore, the corporate
brand is defined primarily by business associations (Aaker 2004:7). Corporate
brands can also be seen as an informal contract, in the sense that the business
needs to articulate its accord with its key stakeholders by demonstrating
unceasingly and over time that it has kept true to its corporate branding pledge.
Product or service
Brand concept(value proposition)
Brand name and symbols

-53-
Corporate brands differ from product brands in several respects. The
distinctions between corporate and product brands are summarised in Table
3.1.
TABLE 3.1: Comparison between product and corporate brands
Dimensions Product brands Corporate brands
Focus attention on The product The organisation
Values Contrived Real
Managed by Middle manager CEO
Attract attention and gain support of
Customers Multiple stakeholders
Functional responsibility Marketing Whole organisation
Communication mix Marketing communication
Total corporate communication
Brand gestation Short (life of product) Long (life of organisation)
Importance to company Functional Strategic
Commitment Consumer commitment
Stakeholder commitment (internal and external constituencies)
Emphasis on Product performance Identity (Corporate attributes/sub-cultures)
Sources: Adapted from Hatch & Schultz (2003:1044); Balmer (2001)
From Table 3.1, it is evident that, when the functional responsibility rests on the
entire business, the focus of the branding effort shifts from the product brand to
the corporate brand. In fact, many businesses that traditionally based their
success on product brands, have now adopted a corporate brand in an effort to
make business actions, values and missions more salient. This adoption of a
corporate brand focus can also diffuse specific added values.

-54-
A second outstanding difference in conceptualisation is that corporate brand
values tend to be grounded in the values and affinities of business founders
(entrepreneurs), owners, management and personnel, whereas product brand
values tend to be contrived in the product itself, which does not require
considerable skills of invention by marketing and advertising specialists
(Kapferer 2004:29; Balmer & Gray 2002:8). A third difference is that a corporate
brand is an important element of a business strategy and is clearly a senior
management concern. In contrast, a product brand is primarily a middle
management concern and falls largely within the domain of marketing only
(Balmer & Gray 2002:8).
The fourth difference between product and corporate brands relates to the
attraction and support of the brand. While product brands mainly target
customers or clients, corporate brands also contribute to the images formed
and held by all organisational stakeholders (Hatch & Schultz 2003:1045). A fifth
difference between a product and a corporate brand concerns the entity that is
responsible for the branding effort. Corporate branding requires much more
complicated and sophisticated business practices than product branding
(Balmer 2001). Corporate branding requires business-wide support, whereas
product branding could be handled within the marketing department of a
business (Hatch & Schultz 2003:1045).
A sixth difference between product brands and corporate brands relates to the
channel of communication used. Balmer (2001) argues that the deliberate and
orchestrated communication of a corporate brand depends on the total
corporate communication mix, as corporate branding requires the integration of
internal and external communication, as well as the creation of coherence of
expression across a multiplicity of channels and news media. Finally, the
temporal or permanency dimension constitutes another difference between

-55-
product and corporate brands. Product brands live in the present. They are
short term in their ambitions to attract potential customers and help deliver
sales. In contrast, corporate brands live both in the past and the future.
Corporate brands stimulate associations with heritage and articulate strategic
visions of what is to come. A typical example of a long-lived corporate brand is
General Motors, with Chevrolet as one of its product brands.
This research on the brand identity and brand image of the NMMU will therefore
concern itself with the corporate brand. To build and entrench the NMMU
corporate brand, stakeholder commitment from both internal and external
constituencies is vital, in contrast to product brands, which thrive on consumer
commitment only. Further, to shape the NMMU brand, the University staff must
understand the brand’s vision and mission, and be totally committed to
delivering it. It follows that great emphasis should be placed on effective
internal communication in the University. This reality implies that the NMMU
needs to pay attention to its culture, ethos and core values, since these
encompass the values of staff and assumptions that affect their behaviour and
eventually influence stakeholders’ perceptions (Mottram 1998). Should the
above be achieved, the NMMU should show progress in terms of shaping its
corporate identity.
3.3 PERSPECTIVES ON BRANDING
Branding is about identity. It is about creating, communicating and maintaining
an identity that appears value-based and credible in the long run (Ramlau
2002:5). Branding can also be seen as the process through which the product
or service is given a name, logo or symbol to distinguish it from the range of
other products or services offered by competitors or even by the same
organisation (Needle 2004:492; Griffin & Ebert 1999:311).

-56-
With reference to the meaning of the concept ‘branding’, in this research, the
newly merged University (on 1 January 2005) was given a name, the NMMU
(Nelson Mandela Metropolitan University), a logo, and a slogan (‘for tomorrow’).
The purpose of this branding process was to distinguish the NMMU from other
Higher Education Institutions.
An analysis of the literature on branding points to a significant shift in emphasis
in brand building over the last decade, namely from the traditional paradigm to
a contemporary paradigm.
3.3.1 Traditional perspectives on branding
Traditionally, brands were just another step in the overall marketing of products
or services, with the aim of selling these. In terms of the traditional mindset,
brands were treated in an off-hand fashion, as a part of the product (Urde
1999:119). With the traditional branding model, the goal was to build brand
image, which represented a tactical approach, focusing only on driving
short-term results (Aaker & Joachimsthaler 2000:7). Brands served to identify
products (or services) and to distinguish these from the offerings of competitors.
The challenge was to create a strong and distinctive brand image (Kohli &
Thakor 1997:208). In terms of the traditional branding model, the brand
management team was responsible for creating and coordinating the brand’s
management programme. The brand manager did not figure high in the
hierarchy of the business. The focus was merely on the short-term financial
results of single brands and single products in single markets. The basic
objective was to achieve efficient coordination with the manufacturing and sales
departments in order to prevent or solve problems concerning sales and market
share.

-57-
3.3.2 Contemporary perspectives on branding
In recent years, four different contemporary perspectives (or mindsets) on
branding have emerged, namely brand orientation; brand leadership; brand
asset management; and the Logman model, as discussed below.
(i) Brand orientation
Given the importance of strategic imperatives within a business and an industry,
a new approach to branding gradually emerged. In terms of the contemporary
views on branding, brand orientation as a brand building model emerged,
focusing on brands as strategic resources of the business or institution in
question (Keller 2003:730-732; Urde 1999:117-118). Brand orientation is an
approach in which the processes of the organisation revolve around the
creation, development and protection of brand identity in an ongoing interaction
with target customers, with the aim of achieving lasting competitive advantages.
In terms of the brand orientation model, the starting point in brand building is to
create a clear understanding of the internal brand identity. The brand then
becomes a strategic platform that provides a framework for the satisfaction of
customers’ needs and wants (Urde 1999:129). Applied to the research in
question, the NMMU brand should support the needs and wants of
stakeholders, and lead to the fulfillment of the dreams and aspirations of its
students stakeholder group in particular.
(ii) Brand leadership
Another contemporary development relates to the brand leadership model
developed by Aaker and Joachimsthaler (2000). The brand leadership model
emphasises business strategy as well as tactics.

-58-
FIGURE 3.2: Brand leadership – the evolving paradigm
Source: Adapted from Aaker & Joachimsthaler (2000)
In this model, the brand management process acquires different characteristics,
namely strategic and visionary perspectives. Further, the brand manager
occupies a senior position within the organisational hierarchy and, as a
strategist as well as the leader of the communications team, has a longer job
horizon. The prime objective is to build brand equity and develop brand equity
measures. In short, brand identity and creating brand value become the drivers
of strategy.
CLASSIC BRAND BRAND MANAGEMENT LEADERSHIP
MODEL MODEL FROM TACTICAL TO STRATEGIC MANAGEMENT
FROM LIMITED TO BRAND FOCUS
FROM SALES TO BRAND IDENTITY AS DRIVER OF STRATEGY
BRAND LEADERSHIP –THE EVOLVING PARADIGM
PERSPECTIVE
BRAND MANAGER STATUS
CONCEPTUAL MODEL
FOCUS
Tactical and reactive
Less experienced,shorter time horizon
Tactical and reactive
Tactical and reactive
Strategic and visionary
Higher in the organization, longer time horizon
Brand equity
Brand equity measures
PRODUCT-MARKET SCOPE
BRAND STRUCTURES
NUMBER OF BRANDS
COUNTRY SCOPE
BRAND MANAGER’S COMMUNICATIONS ROLE
COMMUNICATION FOCUS
Single products and markets
Simple
Focus on single brands
Single country
Coordinator of limitedoptions
External/customer
Multiple products and markets
Complex brand architectures
Category focus – multiple brands
Global perspective
Team leader of multiple communication options
Internal as well as external
DRIVER OF STRATEGY Brand identity Sales and share

-59-
As summarised in Figure 3.2, the brand leadership model comprises three
distinctive parts, namely from tactical to strategic management; from a limited
to brand focus; and from sales to brand identity as driver of strategy. The model
emphasises strategy as well as tactics, its scope is broader, and it is driven by
brand identity as well as sales. The brand leadership paradigm is based on the
premise that brand building not only creates assets, but is necessary for the
success (and often the survival) of the enterprise. It is possible that building
brands results in a competitive advantage that will pay off financially. Applied to
this research, it may be assumed that the NMMU brand should reflect a
value-driven university, transformation for equity, and a people-centred
institution.
(iii) Brand asset management
Brand asset management is another relevant contemporary concept related to
brand management (Davis 2000). Brand asset management may be defined as
a balanced investment approach for building the meaning of the brand,
communicating it internally and externally, and leveraging it to increase brand
profitability, brand asset value, and brand returns over time (Davis & Dunn
2002:15). Davis and Dunn (2002) argue that brands, along with people, are an
organisation’s most valuable asset. This becomes relevant given that the top
three strategic goals for brand strategy are increasing customer loyalty;
differentiating the brand from the competition; and establishing market
leadership. With regard to the above strategic roles, it is important for any
organisation to revolutionise its thinking on brand asset management. In order
to adopt this perspective, brand management have to report all the way to the
executive management of the organisation and have to involve every functional
area (Davis & Dunn 2002:9).

-60-
FIGURE 3.3: Brand asset management process
Source: Adapted from Davis (2000:18)
The brand asset management process, as shown in Figure 3.3, involves four
distinct phases and eleven steps in totality. The first phase involves developing
a brand vision, which consists of a single step: developing the elements of a
brand vision. The basic objective of this step is to clearly state what the
branding efforts must achieve to meet the goals of the organisation. The
second phase involves determining the organisation’s “brand picture” by
understanding consumer/client perceptions of the brand and competitors’
brands. This phase consists of three steps, namely determining the brand’s
image; creating the brand’s contract, for example, a listing of customers/clients’
perceptions of all the current promises the brand makes; and crafting a
brand-based customer/client model, which allows for understanding how
Step 1Elements of a brand vision
Phase 1: Developing brand vision
Step 2Determining brand image
Step 3Creating brand
contract
Step 4 Brand-based
customer model
Phase 2: Determining brand picture
Step 5 Positioning the brand
Step 6Extending the brand
Phase 3: Developing a brand asset management strategy
Step 7Communicating
brand’s positioning
Step 8Leveraging the brand
Step 9 Pricing
the brand
Step 10Measuring return on
brand investment
Step 11Establishing a
brand-based culture
Phase 4: Supporting a brand management culture

-61-
consumers/clients act and think, and how and why they make their purchase
decisions.
The third phase entails developing a brand asset management strategy for
achieving goals according to the brand vision. This phase comprises five steps:
positioning the brand; extending the brand; communicating the brand’s
positioning; leveraging the brand; and pricing the brand. Finally, the fourth
phase involves supporting a brand asset management culture. This final phase
consists of two steps: creating a measure of the return on brand investment;
and establishing a brand-based culture.
From the above discussion, it is evident that brand asset management is a
proven process for managing brands as assets in order to maximise their value.
The brand asset management perspective is extremely relevant to this
research. For example, it could be important for the NMMU brand:
to reflect an academic value in line with stakeholder needs;
to reflect value for money;
to act as a strategic resource of the institution;
to reflect the competitive advantages of the institution (‘reasons why’
stakeholders should use the brand); and
to reflect strong values of the institution.
(iv) LOGMAN model
With reference to contemporary brand management, the logical brand
management or LOGMAN model needs to be introduced (Logman 2004:98).
The LOGMAN model combines insights from Kaplan and Norton’s balanced
scorecard method, the Boston Consulting Group’s brand value creation method,

-62-
the path analysis method, the gap analysis method, and the house of quality
method (Kaplan & Norton 1996).
The LOGMAN model proposes a logical brand consistency audit by presenting
the following questions:
Is there a logical interaction between the organisation’s brand drivers?
Are the organisation’s brand drivers perceived by customers/clients the way
the organisation wants them to be?
Are the organisation’s brand drivers perceived by customers/clients the way
the customers/clients want them to be?
Are the external brand drivers perceived by customers/clients the way the
organisation wants them to be?
Is there a logical consistency between the organisation’s brand drivers
across the different customer/client segments addressed?
Is there a logical consistency between the organisation’s brand objectives
at different perspective levels?
Is there a logical consistency between the brand drivers over time?
According to Logman (2004), answering these questions helps to identify real
problems and key drivers to find solutions and analyse brand policy in a specific
context.
With reference to the Logman model, it could be important for the NMMU brand
to:
be well-accepted by stakeholders;
exceed expectations in terms of promises; and
reflect the diversity of stakeholders.

-63-
In concluding this section, it can be stated that the outstanding feature of the
contemporary paradigms on branding is the strategic dimensions incorporated
into branding. The branding process has become a top level business strategy.
3.3.3 Corporate branding
Given the contemporary perspectives on branding, a further development has
been the shifting of focus in businesses from product branding to corporate
branding (Hatch & Schultz 2003:1041; De Chernatony 1999:158). Corporate
branding is currently seen as one of the most fashionable management trends
(Morsing 2002:33). The corporate branding perspective is a consequence of
the strategic approach towards brands and branding.
In Section 3.2.2 of this chapter, the concepts product and corporate brands
were introduced. It was also pointed out (at the beginning of Section 3.3) that
branding was the process through which a product or service was given a name,
logo or symbol to distinguish it from the range of other products or services
offered by competitors or even by the same organisation. The emergence of the
NMMU brand was also discussed.
This section explores the literature on corporate branding, seeking for further
relevant linkages to the NMMU as a corporate brand. It is logical to say that corporate branding is based on the same principles as
product branding, but with the difference that the focus is on the business itself,
and not on the product or service as the prime object of the branding (Morsing
2002:36). Corporate branding implies that the aim of the branding activities is to
communicate a clear message to the world about the business as well as its
products or services. This message should convey what the business stands
for, and to which kind of values the business subscribes. The main goal of

-64-
corporate branding is to create a uniform perception of the business identity
among all its stakeholders.
FIGURE 3.4: Linkage between corporate branding, strategic vision,
mission and key values, organisational culture and corporate image
Source: Adapted from Hatch & Schultz (2003:1047)
A useful linkage between corporate branding, vision, culture and image is given
by Hatch and Schultz (2003:1047-1051). This relationship is depicted in Figure
3.4, which shows a framework linking corporate branding to strategic vision,
mission and key values, organisational culture and corporate image. These
three dimensions form the foundation of corporate branding:
Strategic vision, mission and key values –
• Strategic vision relates to the future orientation of the institution that
embodies and expresses executive management’s aspirations for what
the institution will achieve in the future.
• Mission is a statement of key (or core) values that defines the purpose
of the institution and its distinctive competitiveness.
Organisational culture – the internal values, beliefs and basic assumptions
that embody the heritage of the institution (if any) and communicate its
Corporatebranding
Vision, mission and key values
Culture Image

-65-
meanings to its members; culture manifests itself in the ways employees
feel about the institution they are working for.
Corporate image – views of the institution developed by its stakeholders;
the outside world’s overall impression of the business, including the views
of customers, shareholders, the media, the general public; and so on.
Although vision can stretch the business toward new goals and levels of
achievement, it must also connect authentically with the heritage of the
institution, where applicable. By implication, strategic vision, mission, key
values and organisational culture are strongly linked and there is a need for
perceived long-term mutual support between them. Further, when brand values
are consistent with organisational culture and business values, they will create
credibility in the eyes of key stakeholders (e.g. an innovative and trustworthy
university). Corporate images feed into strategic vision, serving as a mirror in
which executive managers can reflect on who they are. This implies that,
instead of using stakeholder images as exact assessments of brand
performance compared with strategic vision, images held by stakeholders of
who the business is and what it stands for (for example, personality
comparisons) can become part of the strategic envisioning process.
From the preceding analysis of literature on corporate branding, a number of
potential relevant statements on NMMU branding were identified. They include
the following:
The NMMU brand reflects a true ‘African’ university.
The NMMU brand reflects the University’s vision and mission.
The NMMU brand is differentiated from those of other Higher Education
Institutions.
The NMMU brand reflects a visual expression of the institution.

-66-
The NMMU brand is a verbal expression of the institution.
The NMMU brand reflects the University’s lingual identity (official
languages are Xhosa, Afrikaans and English).
The NMMU brand creates high levels of awareness.
The NMMU logo reflects the NMMU brand identity.
The NMMU slogan (‘for tomorrow’) reflects the NMMU brand identity.
The NMMU brand reflects a values-driven university.
The NMMU brand reflects transformation for equity.
The NMMU brand reflects a people-centred institution.
The NMMU brand is nationally recognised.
The NMMU brand reflects the leadership qualities and vision of Nelson
Mandela.
The NMMU has a strong brand image.
The above statements will be incorporated in the research instrument
(questionnaire) that will first be pilot tested for validity.
3.4 BRAND EQUITY
3.4.1 Defining brand equity
From the literature, it is evident that brand equity has been examined and
presented from financial and customer-based perspectives (Keller 2003; Kim,
Kim & An 2003; Shimp 2003; Aaker & Joachimsthaler 2000; Aaker 1996b;
Simon & Sullivan 1993). Financial perspectives on brand equity focus on the
value of the brand to the business activities, whilst the customer-based
perspectives relate to the value of the brand for the customer.
Outstanding features of the customer-based and financial based perspectives

-67-
on brand equity are:
From a customer based perspective, brand equity can be seen as brand
assets linked to a brand’s name and symbol that add to, or subtract from, a
product or service (Aaker & Joachimsthaler 2000:17; Shimp 2003:33).
Keller (2003:60) has explicated the concept customer-based brand equity,
defining it as the differential effect that brand knowledge has on consumer
responses to the marketing of the specific brand. There are three key
ingredients to this definition: differential effect; brand knowledge; and
consumer response to marketing. Customer-based brand equity occurs
when the consumer has a high level of awareness of and familiarity with the
brand and has some strong, favourable and unique brand associations
(Keller 2003:67). The customer-based perspective to brand equity is part of
the marketing decision-making process (Kim et al. 2003).
From the financial perspective, brand equity can be viewed in terms of
incremental free cash flows that are added by the brand itself to the overall
organisation’s value as an entity (Shimp 2003:33; Simon & Sullivan
1993:29). According to Aaker (1996b:109), brand equity comprises a set of
assets (or liabilities) linked to a brand’s name and symbol that adds to (or
subtracts from) the value provided by the product or service to a firm and/or
that firm’s customers. The incremental value of the brand is higher the
stronger the brand is established. This statement has the following
implications. Firstly, strong brands usually give the opportunity for
successful brand extensions and for brand licensing. Secondly, strong
brands are able to stabilise and even grow profits during periods of
recession.
To illustrate the financial perspective towards brand equity, Table 3.2 presents
the most valuable global brands (listed in terms of value):

-68-
TABLE 3.2: Top ten global brands
2005 Brand Rank
Brand Name Parent Company Country 2005
Brand value ($Mil)
1 Coca-Cola Coca-Cola U.S. 67 525 2 Microsoft Microsoft U.S. 59 941
3 IBM International Business Machines Corporation
U.S. 53 376
4 General Electric General Electric U.S. 46 996 5 Intel Intel U.S. 35 588 6 Nokia Nokia Finland 26 452 7 Disney Walt Disney Company U.S. 26 441 8 McDonald’s McDonald’s Corporation U.S. 26 014 9 Toyota Toyota Motor Corporation Japan 24 837
10 Marlboro Altria Group U.S. 21 189 Source: Adapted from Top 100 global brands scoreboard
(http://bwnt.businessweek.com/brand/2005/index.asp)
The brand equity of, for example the Coca-Cola and Microsoft brands, was
driven over time by means of incremental free cash flows. These incremental
free cash flows were transformed into corporate values, given the riskiness of
the free cash flows. From the examples (Table 3.2), the importance of creating
brand equity should be evident. The same basic principle is applicable to
service rendering institutions like universities. Educational services rendered
over time create intrinsic values (i.e. values based on facts), which shape the
brand equity of the institution.
3.4.2 Managing brand equity
Brand equity has been defined as assets (liabilities) linked to a brand’s name
and symbol that add to, or subtract from, a product or service. According to
Aaker and Joachimsthaler (2000:17), these assets (brand equity), as shown in
Figure 3.5, can be grouped into four dimensions, namely brand awareness,
perceived quality, brand associations, and brand loyalty.

-69-
Brand awareness is an often undervalued asset; however, awareness has
been shown to affect perceptions and even taste.
Perceived quality is a special type of association, partly because it
influences brand associations in many contexts and partly because it has
been empirically shown to affect profitability.
Brand associations can be anything that connects the customer to the
brand. It can include user imagery, product attributes, use situations,
organisational associations, brand personality, and symbols.
Brand loyalty is at the heart of any brand’s value. The concept is to
strengthen the size and intensity of each loyalty segment.
FIGURE 3.5: Managing brand equity
Error!
Source: Adapted from Aaker & Joachimsthaler (2000:17)
The four dimensions guide the overall development, management, and
measurement of the brand.
3.5 SUMMARY AND CONCLUSIONS
This chapter presented an analysis of secondary sources on brands, branding
and brand equity. At the beginning of this chapter, the concepts ‘brand’ and
‘corporate brand’ were introduced. The two concepts opened the discussion on
Brand equity
Brand awareness
Perceived quality
Brand associations
Brand loyalty

-70-
the process of branding by all types of organisations, which interacts with
consumers who have a need for the products or services. It was ascertained
that through a branding process, the NMMU brand was given a name, logo and
slogan to distinguish itself from other Higher Education Institutions.
From the analysis of the perspectives (paradigms) on branding, the importance
of the strategic approach towards branding emerged. From this section it was
possible to phrase certain statements dealing with the NMMU brand, which will
be tested empirically.
The analysis of corporate branding, introducing the vision, mission and key
values, and the culture and image of the organisation as building blocks
towards corporate branding contributed towards an even better understanding
of branding per se.
The theories embedded in corporate branding will contribute towards the
phrasing of statements applicable to the NMMU brand. Likewise, the underlying
theories on brand equity will contribute towards the design of the research
instrument to be administered in this research project.
The next chapter investigates brand identity, brand image, brand perceptions
and association, brand knowledge, brand awareness, brand loyalty, brand
commitment and brand communication.
________ II ________

-71-
CHAPTER FOUR
UNDERSTANDING BRAND IDENTITY,
BRAND IMAGE AND OTHER RELATED CONCEPTS
4.1 INTRODUCTION
Chapter Four constitutes a continuation of the analysis of secondary sources,
with the objective of gaining a holistic understanding of brands and related
concepts. As stated in Chapter Three, the desired outcomes of the extensive
literature analysis are twofold: firstly, to identify possible statements/questions
to be included in the research instrument and tested empirically; and,
secondly, to design a conceptual model on brand identity and brand image
applicable to the NMMU.
This chapter takes a closer look at brand identity and brand image, as well as
other related concepts such as brand knowledge, brand awareness, brand
loyalty, brand commitment and brand communication. The chapter concludes
with the presentation of a conceptual model applicable to this research, which
will be tested empirically.
4.2 BRAND IDENTITY
4.2.1 Brand identity defined
The identity of a brand provides the direction, purpose and meaning of the
brand, and as such is central to the brand’s strategic vision. It is the driver of
one of the four principal dimensions of brand equity, which are the heart and
soul of the brand (Aaker 1996a:68). Aaker (1996a) describes brand identity
as the cornerstone of brand strategy and brand building. It is therefore critical
to the long-term sustainability of any brand.
De Chernatony (1999) suggests that in passing from brand management to

-72-
brand identity management, special attention should be paid to the internal
aspect of brand building. He argues that more emphasis needs to be placed on
brand identity. Identity, he contends, comprises the ethos, aims and values that
present a sense of individuality, differentiating the brand from its competitors
(De Chernatony 1999:165). This author further conceptualises brand identity in
terms of the vision and culture that drive positioning, personality, and any other
subsequent relationships of the brand. In this sense, employee and staff
members’ vision and culture affect the brand building process. This implies that
more focus should be placed on internal aspects of branding, such as the role
staff members play in shaping a brand’s values. De Chernatony’s (1999) view
that staff members play a vital role in the shaping of a brand’s values is of
particular relevance to the NMMU, being a people-centered institution, as
explained in Section 3.3.3 of Chapter Three.
Aaker and Joachimsthaler (2000:43) define brand identity in terms of a
unique set of brand associations that the brand strategist aspires to create or
maintain. These associations imply a promise to customers/clients from the
organisation’s members who are building the brand. Brand identity should
help establish a relationship between the brand and the customer by
generating a value proposition potentially involving functional, emotional, or
self-expressive benefits or by providing credibility for endorsed brands (Aaker
& Joachimsthaler 2000:43).
The views of Kapferer (2004:96) on brand identity are also noteworthy. Brand
identity means being true to yourself, driven by a personal goal that is both
different from others’ and resistant to change. Brand identity will be clearly
defined once the following questions have been answered:
What is the brand’s particular vision and aim?
What makes it different?
What need is the brand fulfilling?
What is its permanent nature?
What is/are its value or values?

-73-
What are its fields of competence and of legitimacy?
What are the signs that make the brand recognisable?
In the brand building activities of the NMMU, clear responses to the above
questions are of pivotal importance. The purpose of brand identity is to specify
the brand’s meaning, aim and self-image. In terms of brand management,
identity precedes image (Kapferer 2004:98).
An explicit elaboration of the concept brand identity has three goals. Firstly, it
should reduce ambiguity by adding interpretation and detail to the elements of
the brand identity, thereby making it easier to define decisions and programmes
that will strengthen the brand. Secondly, it should enhance decision-makers’
ability to assess the capacity of identity dimensions to resonate with customers
and differentiate the brand. Thirdly, elaboration can introduce ideas and
concepts that are useful in developing on-target, effective brand-building efforts
(Aaker & Joachimsthaler 2000:43).
Aaker and Joachimsthaler (2000:43) have identified twelve categories of brand
identity elements, as shown in Figure 4.1, organised around four perspectives.
These four perspectives are: brand as product (product scope, product
attributes, quality/value, use experience, users and country of origin); brand as
organisation (organisational attributes, local versus global); brand as person
(brand personality, customer/brand relationships); and brand as symbol (visual
imagery/metaphors and brand heritage). Further, the same authors are of the
opinion that the brand identity structure includes a core identity, an extended
identity, and a brand essence. The core identity is most likely to remain
constant as the brand is extended to new markets and products/services. If
customers/clients perceive the brand according to the core identity, the
objective will be achieved. The extended identity includes all of the brand
identity elements that are not in the core, organised into meaningful groupings.
The brand essence should have several characteristics and, most importantly, it
should resonate with customers and drive the value proposition. It should also
be ownable, providing differentiation from competitors that will persist through

-74-
time. Finally, brand identity should be compelling enough to energise and
inspire the employees and owners of the business (Aaker & Joachimsthaler
2000: 43-45).
FIGURE 4.1: Brand identity system
Source: Adapted from Aaker & Joachimsthaler (2000:44)
From the above overview of the literature on brand identity, it should be clear
that brand identity is tangible and appeals to the senses. Truly, brand identity
can be seen as the visual and verbal expression of a brand. According to
Wheeler (2003:4), brand identity is the shortest, fastest, most ubiquitous form of
communication available. It increases awareness and builds businesses.
Identity supports, expresses, communicates, synthesises and visualises the
brand. The role of brand identity will be illustrated within the context of this
research.
4.2.2 Brand identity variables
There is consensus amongst leading researchers that brand identity is shaped
by five key brand identity variables, namely the reputation; relevance;
personality; performance; and relationship of the brand (Coop 2005; Ind 2003;
Brand as symbol 11.Visual image
and metaphors 12.Brand heritage
Extended
Core
Brandessence
Brand as product 1.Product scope 2.Product attributes 3.Quality/Value 4.Uses 5.Users 6.Country of origin
Brand as organisation7.Organisational
attributes (e.g. innovation, consumer concern, trustworthiness)
8.Local versus global
Brand as person 9. Personality (e.g.
genuine, energetic, rugged)
10.Customer/Brand relationship

-75-
Perry & Wisnom 2003; Dowling 2001; Aaker 1997). As explained in Section 1.1
of Chapter One, ideally, the strategic intent of a Higher Education Institution like
the NMMU must be manifested in the brand identity variables. These variables
are associated with a number of attributes that the marketing communication
strategists should communicate, either implicitly or explicitly. The core brand
identity building attributes were listed in Chapter One to describe the research
problem and are reproduced in Table 4.1 for ease of reference.
TABLE 4.1: Core brand identity variables and attributes
Variables Attributes
Brand reputation
Trust in the brand Reliability of the brand Honesty of the brand communication strategists Heritage, legacy and tradition of the brand Clear communication message Consistency – a clear brand identity to be communicated Credibility in advertising (marketing communication media)
Brand relevance
Needs to be satisfied – and values addressed Meaning fit of the brand (relevance to the institution, e.g. NMMU)Innovation and originality of the brand Academic value in harmony with stakeholders’ needs The brand is well accepted by stakeholders
Brand personality
Sincerity of the brand Level of excitement created by the brand Competence reflected by the brand Sophistication and superiority of the brand Ruggedness and resilience of the brand
Brand performance
Exceeds expectations Delivers on promises Delivers tangible benefits Reflects value for money
Brand relationship
Understand how stakeholders feel Stakeholders will use this brand for a long time Actively investigate what is important to stakeholders Stakeholders have to enjoy using the brand Probability of non-usage of the brand
Source: Adapted from Coop (2004:114)

-76-
Each of the identified brand identity variables will now be briefly explained:
Brand reputation is defined as a collective representation of a brand’s past
actions and results that describes the brand’s ability to deliver valued
outcomes to multiple stakeholders (Fombrun & Rindova 1996). The
attributed values of brand reputation (such as honesty, trustworthiness and
integrity) are evoked from an institution’s brand image (Dowling 2001:19).
Brand relevance can be described as how well the brand ‘speaks’ to
individual audiences. The articulation of a brand should be relevant to those
audience’s needs and desires, not merely differentiated (Perry & Wisnom
2003:9). Brand relevance, for example, does what it says on the label of a
product. By ensuring that the values that drive a brand are those that best
unite its stakeholders, organisations lay the foundations of their own future
(Ind 2003:80). With regard to this research, brand relevance can be seen
as how well the NMMU brand communicates to stakeholders in terms of
their needs.
Brand personality reflects the brand's emotional characteristics. These
characteristics are represented by the metaphor of personality, which,
amongst other sources, evolves from the brand's core values (Harris & De
Chernatony 2001:444). According to Aaker (1997:347), brands often serve
a symbolic or self-expressive function, because consumers imbue brands
with human personality traits. Brand personality can also be viewed as the
set of human characteristics associated with a brand and can be measured
along five dimensions, namely sincerity, level of excitement, competence,
sophistication, and ruggedness.
Brand performance is directly related to the levels at which consumers
perceive that the primary and actual characteristics of a brand will operate.
Performance contains an element of perceived quality on the part of the
product/service or brand. Perceived quality, according to Keller (2003:238),
can be defined as customers’ perception of the overall quality or superiority
of a product or service relative to relevant alternatives and with respect to
its intended purpose.
Brand relationship evolves as a relationship between the brand and its

-77-
customers, which is characterised by the values inherent in the brand's
personality (Harris & De Chernatony 2001:444). Fournier (1998:344)
contends that through the interaction of relationship and personality,
employees significantly affect a brand's relationship with its consumers.
Therefore, marketing communication strategists need to help employees
understand the types of relationships that are appropriate among other
employees, consumers and other stakeholders, based on the brand's core
values.
The aforegoing presentation of the brand identity variables was useful in
identifying at least 36 statements to be used in the research instrument relating
to brand reputation, relevance, personality, performance and relationship.
Some examples of the above are:
Brand reputation
• The NMMU brand signifies trustworthiness.
• The NMMU brand signals legitimacy.
Brand relevance
• The NMMU brand reflects my educational needs.
• The NMMU brand fulfills specific stakeholders’ needs.
Brand personality
• The NMMU brand conveys sincerity.
• The NMMU brand creates a degree of excitement.
Brand performance
• The NMMU brand offers tangible academic benefits.
• The NMMU brand delivers on promises.
Brand relationship
• The NMMU brand is strongly preferred by stakeholders.
• The NMMU brand reflects what is important to stakeholders.
4.2.3 Benefits of creating a brand identity Given the definition of brand identity and the interpretation of brand identity

-78-
variables, there are compelling reasons to invest in brand identity. According to
Wheeler (2003:13) a clear brand identity is associated with specific benefits.
Brand identity:
Makes it easy for stakeholders to use the brand. Compelling brand identity
presents any business, any size, anywhere, with an immediately
recognisable, distinctive, professional image that positions it for success.
An identity helps manage the perception of a business and differentiates it
from its competitors. A smart system conveys respect for the customer and
makes it easy to understand the brand’s features and benefits. An effective
identity encompasses elements such as a name (logo) that is easy to
remember or a package design that wants to be owned.
Makes it easy for the sales force to sell. Strategic brand identity works
across diverse audiences and cultures to build an awareness and
understanding of a business and its strengths. By making intelligence
visible, effective identity seeks to clearly communicate a business’s unique
value proposition.
Makes it easy to build brand equity. A brand, or a business’s reputation, is
considered to be one of the most valuable business assets. Higher
Education Institutions such as the NMMU also need to build brand equity.
Their future relevance is dependent on building public awareness,
preserving their reputations, and upholding their values. A strong brand
identity will help build brand equity through increased recognition,
awareness and stakeholder loyalty, which in turn will help make the
University more relevant to the country’s development needs.
4.2.4 Some views on corporate identity
Over the past decade, corporate identity has become a prominent paradigm
and has been increasingly linked to the strategic management of organisations
(Balmer & Gray 2000:256). In line with the contemporary perspective of
branding, corporate identity may be seen as a visual system for controlling how

-79-
the business is perceived to be. In essence, corporate identity is the reality and
uniqueness of an organisation that is integrally related to its external and
internal image and reputation through corporate communication.
Corporate identity is formed by the aggregate of messages and experiences
received about a business’s products and services by an individual, group or
groups over a period of time (Balmer 1998:970). The question now is: What are
the distinguishing features of corporate identity? Balmer (1998:979-980)
responds to this question as follows:
The concept of corporate identity is fundamentally concerned with reality,
‘What an organisation is,’ i.e. its strategy, philosophy, history, business
scope, the range and type of products and services offered and its
communication, both formal and informal;
Corporate identity is multi-faceted and draws on several disciplines; and
Corporate identity is based on the corporate personality, i.e. it is based on
the values present within the organisation.
4.3 BRAND KNOWLEDGE Brand knowledge (for the research in question, brand knowledge of the NMMU),
as shown in Figure 4.2, is determined by brand awareness and brand image
(Shimp 2003:38; Keller 1993:7). Brand awareness is shaped by brand
recognition and brand recall, whilst brand image is determined by the types of
brand associations, and the favourability, strength and uniqueness of the brand
associations. Brand image will be discussed in Section 4.5 of this chapter.
The brand knowledge model (Figure 4.2) presents a logical structure and
approach from which to begin and, secondly, visually demonstrates the
complexity surrounding the study of branding.
The basic premise of the brand knowledge model is that the power of a brand
lies in what customers have learned, felt, seen, and heard about the brand as a

-80-
result of their experiences (Keller 2003:59). Contextualised to the research in
question, understanding the content and structure of the NMMU brand
knowledge is important, because it may influence what comes to mind when
NMMU stakeholders think about the NMMU brand (Keller 1993:7).
FIGURE 4.2: Dimensions of brand knowledge
Sources: Adapted from Shimp (2003:38); Keller (1993:7)
4.4 BRAND AWARENESS Brand awareness has been achieved when a brand name comes to mind when
consumers think about a particular product/service category and the ease with
which the name is evoked. Figure 4.2 shows that brand awareness is
determined by brand recognition and brand recall. Brand awareness relates to
brand equity. From the vantage point of stakeholders, the NMMU brand has no
equity unless stakeholders are at least aware of the existence of the brand
(Shimp 2003:34-35).
Brand awareness can affect both consumer perceptions and attitudes towards
the brand. It is possible to differentiate between different levels of brand
Brand recognition
Brand recall
Types of brand associations
Favourability, strength, and uniqueness of
brand associations
Attributes
Benefits
Overall evaluation (attitude)
Non-product related (e.g. price, packaging, user and usage imagery)
Brand knowledge
Brand awareness
Brand image
Product-related (e.g. colour, size, design features)
Functional
Symbolic
Experiential

-81-
awareness, namely: brand recognition, spontaneous brand recall, brand
dominance, brand knowledge and brand opinion (Aaker 1996a:114). Since the
recognition is usually ‘attached’ to new brands, the brand knowledge is
appropriate for well-established brands.
According to Keller (2003:68), brand awareness plays an important role in
consumer decision-making, for three main reasons:
Learning advantages: Brand awareness influences the formation and
strength of the brand associations that make up the brand image.
Consideration advantages: It is important that consumers think of and
consider the brand whenever they are making a purchase for which the
brand could potentially be acceptable.
Choice advantages: Brand awareness can affect choices among brands in
the consideration set, even if there are no other associations with those
brands.
The above views are particularly applicable within the context of the NMMU
brand scenario: it can enable students to foster brand association and
contribute towards decision-making to study at the NMMU.
4.5 BRAND IMAGE
4.5.1 Brand image defined
Brand image has long been recognised as an important concept in marketing
(Keller 2003:64). Keller (2003:66) defines brand image as the perceptions of a
brand as reflected by the brand associations held in consumer memory (see
Figure 4.2). The brand associations may be described in terms of attributes,
benefits and attitudes (based on experience of the brand).
According to Park, Jaworski and MacInnis (1986:135), brand image is the
understanding consumers derive from the total set of brand-related activities

-82-
engaged by the organisation (see Figure 4.2). Image research focuses on the
way in which certain groups perceive a product or service, a brand, a politician,
an organisation or a country or, for the research in question, an university. The
image refers to the way in which these groups decode all the signals emanating
from the products, services and communication covered by the brand (Kapferer
2004:98-99). An image is a synthesis presented to the public of all the various
brand messages, for example, brand name, visual symbols, attributes, products
or service, and the benefits of advertisements, sponsoring, patronage and
promotion articles. An image results from decoding a message, extracting
meaning, and interpreting signs (Nandan 2005:268). From the above, it seems
that brand image may be described as a holistic impression of the relative
position of a brand by its users, compared with that of its perceived competitors
(Coop 2004:1). See also Figure 4.2 for a summary of the variables that shape
brand image.
A positive brand image is created by marketing communication programmes
that link strong, favourable and unique associations of the brand to the relevant
receivers of the brand. Brand associations can also be created in a variety of
other ways: by direct experience; from information communicated about the
brand by the organisation or other commercial or nonpartisan sources (e.g.
consumer reports or other media vehicles) and word-of-mouth; and by
assumptions or inferences from the brand itself (for example, its name or logo);
or from the identification of the brand with a company, country, channel of
distribution, or some particular person, place or event (Keller 2003:70).
Developing a set of brand beliefs by consumers/customers about where each
brand stands according to various attributes is also important (Kotler 2003:206).
The set of beliefs about a brand eventually comprises the brand image.
A consumer’s brand image will vary according to his/her experiences of the
brand, as filtered by the effects of selective perception, selective distortion, and
selective retention.
To summarise views on the concept brand image, the contributions by Dobni

-83-
and Zinkhan (1990) are relevant:
Brand image is the concept of a brand that is held by the users of the brand.
Brand image is largely a subjective and perceptual phenomenon that is
formed through the interpretation of users, whether reasoned or emotional.
Brand image is not inherent in the technical, functional or physical concerns
of the product/service or brand. Rather, it is effected and moulded by
marketing activities, by context variables, and by the characteristics of the
perceiver.
4.5.2 Brand image associations and variables Literature on brand communication indicates that the brand image is
established via media signals such as printed marketing communication
material (Nandan 2005). As indicated in the previous section, brand image can
be defined as a reflection of brand associations and perceptions (Keller
2003:66; Shimp 2003:52). In the case of the NMMU, the brand associations
and perceptions are those held by students and other stakeholders.
From the literature on brand image, it was possible to identify a number of
associations and variables (Coop 2004; Keller 2003; Smith 2003; Van Gelder
2003; Nilson & Surrey 1998). As presented in Chapter One, the brand image is
more specifically shaped by six associations and variables, namely strength,
uniqueness, expectations, perceptions, experiences and evaluations of the
brand. These brand image associations and variables are repeated here but
contextualised to the research in question.
Strength: The strength of a brand image (brand association) is determined
by the magnitude and complexity of the brand identity signals to which the
NMMU students and other stakeholders are exposed, as well as the
complexity of the processing of the signals (Keller 2003:730).
Uniqueness: It is important to identify unique, meaningful attributes of the
NMMU brand in order to provide a competitive advantage and “reason why”
students and other stakeholders should use it (Keller 2003:730). The

-84-
uniqueness of the NMMU brand identity should be communicated by the
marketing communication strategists.
Expectations: Brand expectations are linked to how brand users expect the
brand to perform. NMMU brand expectations are determined by inter alia
generic educational service attributes and benefits, such as the quality of
educational services and the innovativeness of programme offerings (Smith
2003:97-111).
Perceptions and associations: A strong brand image association involves
the creation of student and stakeholder perceptions (awareness) that the
NMMU provides tertiary educational services of the highest quality. An
innovative brand association involves the creation of student and
stakeholder perceptions that the NMMU develops new and unique
academic programmes, especially with respect to new programme
introductions or improvements to existing programmes (Keller 2003:545;
Van Gelder 2003 176-179; Nilson & Surrey 1998:64-66). For example, it
may be that the former UPE brand image was that the institution was an
Eastern Cape based and even apartheid created university, whereas the
newly established NMMU image could now be seen as a true African
university and a real global player, with an innovative brand association.
Experiences: Brand image associations can be shaped directly from
students’ and stakeholders’ actual experiences and contact with the NMMU
educational services and brand (Keller 2003:83; Nilson & Surrey
1998:64-66).
Evaluations: Evaluations refer to how brand users interpret and evaluate
the NMMU brand and related marketing information. The brand image
evaluation is determined by the perceptions, expectations and, most
importantly, the experiences of the brand in question (Coop 2004:235;
Keller 2003: 450).
4.5.3 Some views on corporate image Corporate image is the totality of stakeholders’ perceptions of the way an
organisation presents itself, either deliberately or accidentally. It is the net result

-85-
of the interaction of all the experiences, beliefs, feelings, knowledge and
impressions that each stakeholder has about an organisation (Melewar
2003:214; Balmer 1998:966-967).
Corporate image is the impression created by ‘how you look, what you say, and
what you do’. A business with a good corporate image enjoys the following
advantages:
The public is more likely to assume that it produces good products or
services.
The public is more likely to pay more for its products or services and buy its
new products or services.
The public is more likely to consider the intrinsic assets of an institution,
such as the knowledge value of the NMMU, to be valuable.
The above advantages of a solid corporate image should be real drivers for the
NMMU to establish itself as a Higher Education Institution with a strong image
amongst its stakeholders.
4.6 COMPARISION OF BRAND IDENTITY AND BRAND IMAGE
Having focused on the meaning and content of brand identity and brand image,
it is appropriate to summarise the differences between these two concepts and
provide a contextualisation to the research on the NMMU brand identity and
brand image.
Table 4.2 summarises the differences between the brand identity and brand
image of the NMMU. Firstly, brand identity is focused on the University,
whereas brand image is focused on the stakeholders. Secondly, brand identity
is created by executive managers or marketing communication strategists,
whilst brand image is created by perceptions of stakeholders. Thirdly, the
message is ‘packaged’ or ‘wrapped’ in terms of brand identity, and it is
‘unpackaged’ or ‘unwrapped’ by stakeholders in the form of brand image. Finally,

-86-
brand identity is established by marketing communication strategists, which
represents the institution’s reality, while brand image is received or perceived
by the stakeholders, which represents the perceptions of the stakeholders.
These differences between brand identity and brand image are noteworthy, and
are further amplified by the view of Kapferer (2004:98) that brand identity
precedes brand image.
TABLE 4.2: Differences between brand identity and brand image of the NMMU
Brand identity Brand image
NMMU focused Receiver or stakeholder focused Created by CEO and marketing communication strategists
Created by perceptions of the NMMU stakeholders
The message is designed and ‘packed’ by ‘brand originator’, the NMMU
Decoded by ‘brand receivers’ or stakeholders, such as students
NMMU brand identity is sent to stakeholders
NMMU brand image is received or perceived by stakeholders
Source: Adapted from Nandan (2005:268)
4.7 BRAND PERCEPTIONS AND ASSOCIATIONS The concept ‘perception’ needs clarification within the context of this research.
According to Schiffman and Kanuk (1997:146), perceptions can be described
as how we see the world and events around us. Two individuals may be subject
to the same stimuli under the same apparent conditions, but how each
recognises, selects, organises, and interprets them is a highly individual
process based on each person’s own needs, values and expectations.
Schiffman and Kanuk (1997:146) further define perception as the process
through which an individual selects, organises and interprets stimuli into a
meaningful and coherent picture of the world.
Perceptions about the NMMU brand, its identity and image play an important
role in this research. Perceptions of the NMMU brand image are formed in the

-87-
mindsets of students and various other stakeholders. It is an inescapable reality
that diverse individuals tend to see (perceive) the world and events in their own
special way. Reality for an individual (and, for the purpose of this research, the
NMMU stakeholders) is merely the reflection of that individual’s perception of
what is ‘out there’, or of what has taken place. Individuals usually act and react
on the basis of their perceptions, not on the basis of objective reality (Schiffman
& Kanuk 1997:146).
The above observations were important considerations when phrasing
statements dealing with the NMMU brand image.
4.8 BRAND LOYALTY Brand loyalty is a behavioural criterion that must be encouraged. When
consumers are loyal to a particular brand, the competitive position of the
marketer is strengthened (Cronjé, Du Toit, Marais & Motlatla 2004:302). Oliver
(1999:34) describes brand loyalty as a deeply held commitment to re-buy or
re-patronise a preferred product or service consistently in the future, thereby
causing repetitive same-brand or same brand-set purchasing, despite
situational influences and marketing efforts having the potential to cause
switching behaviour. This definition highlights the two distinct aspects of brand
loyalty, namely behavioural and attitudinal dimensions. Behavioural or
purchase loyalty consists of dispositional commitment in terms of some unique
value associated with the brand.
Brand loyalty is the desired outcome of successful branding strategies; it
manifests itself when consumers make repeat purchases of the same branded
product or service (Needle 2004:494). Brand loyalty is at the heart of any
brand’s value. The concept behind brand loyalty is to strengthen the size and
intensity of each loyalty segment (Aaker & Joachimsthaler 2000:17).
Brand loyalty can be measured on different levels. The first level relates to
brand awareness, which means that people are likely to buy a product or

-88-
service because they are familiar with (aware of) and recognise the object. It
has been indicated that brand awareness is closely related to brand recall and
brand recognition. The next level pertains to brand preference. At this level,
people purchase the product or service, if it is available, from among competing
brands. Customers will be willing to experiment with alternatives only if they
cannot find the preferred brand. The ultimate level of brand loyalty is
characterised by brand insistence. Customers who insist on a brand will accept
no substitute for a preferred brand (Mescon, Bovee & Thill 1999:399; Boone &
Kurtz 1996:392).
In terms of the research in question, it is imperative that brand identity and
brand image be in harmony in order to build and maintain brand loyalty. Value
for the NMMU, as well as for all the stakeholders involved, can be created only
when the stakeholders fully understand and appreciate the brand message.
The NMMU brand also has to be perceived to address stakeholder needs in a
manner superior to the competing brands of other Higher Education Institutions.
Alumni of Higher Education Institutions and organised businesses are key
contributors of funds to further provide for facilities and, bursary funds and to
enhance the growth of the institution. Brand loyalty plays an important role,
particularly for alumni. From a communication perspective, there are cogent
reasons to believe that a strong link between brand identity and brand image
will lead to enhanced brand loyalty (Nandan 2005:270-271).
4.9 BRAND COMMITMENT
Brand commitment follows from brand image. Brand commitment is defined by
Hofmeyr and Rice (2000:21) as being psychological rather than behavioural in
nature, implying a cognitive process involving thoughts and feelings. According
to Hofmeyr and Rice (2000:2), the key to successful marketing is knowing
what’s in the consumer’s mind and managing the relationship appropriately.
They refer to the above as commitment-led marketing. It is about understanding
that customer satisfaction is a poor predictor of behaviour, but that commitment
is an excellent predictor. It is important to differentiate between brand
commitment and brand loyalty. Brand loyalty refers to what consumers do,

-89-
while brand commitment refers to what consumers think and feel (Hofmeyr &
Rice 2000:3).
The distinction between brand loyalty and brand commitment is also explained
by Jacoby and Chestnut (Ceurvorst 1993), who define commitment as a
psychological bond between a brand and a consumer, whilst loyalty is the
behavioural response (usually manifested as a purchase or use of a service)
arising as a consequence of commitment. Thus, brand commitment provides
an essential basis for distinguishing between brand loyalty and other forms of
repeat purchasing behaviour. In summary, commitment is the psychological
cause, and loyalty is the behavioural result.
From the above, it is clear that commitment is more than simply ‘loyalty’. It
includes a psychological attachment. Committed people usually willingly act in
a loyal manner. Loyal people, on the other hand, may be grudging in their
loyalty and behaviourally at risk (Hofmeyr & Rice 1995). If Higher Education
Institutions like the NMMU have truly committed stakeholders, the ‘ultimate’
outcome of the branding activity will have been achieved.
4.10 ROLE OF BRAND COMMUNICATION
Integrated brand communication refers to activities where various
communicational tools, strategies and media sources are used, such as event
sponsorships, the Internet, corporate communication, and personal selling.
Together with advertising, integrated brand communication has to build and
maintain brand identity, brand awareness, brand image and brand preference in
a coordinated manner. When marketing communication strategists use
advertising in conjunction with other marketing communication tools, as in the
case of the NMMU, they create an integrated brand communication that
highlights brand features and brand equity. Over the past 30 years, the
advertising and marketing communication industry has evolved to recognise
that the integration and coordination of marketing communication elements is
the key to effective communication and lasting brand identity (O’Guinn, Allen &
Semenik 2005:41).

-90-
In the context of brands, the communication between the NMMU and its
stakeholders can be examined in terms of brand identity and brand image
relationships (Nandan 2005:265). Communicating a brand identity to a target
segment has long been regarded as an important marketing activity. A
well-communicated identity should help to establish brand image, insulate the
brand from competition, and therefore enhance the brand’s market
performance.
Figure 4.3 presents a model for the NMMU brand communication process. The
figure also shows that the key difference between brand identity and brand
image pertains to the fact that brand identity stems from the source or institution,
whereas brand image is perceived by the receivers or the stakeholders. The
brand message is ‘packaged’ or ‘wrapped’ in terms of brand identity, and it is
‘unpackaged’ or ‘unwrapped’ by the NMMU stakeholders in the form of brand
image. Brand identity represents the NMMU’s reality, whilst brand image
represents the perceptions of the stakeholders (Nandan 2005:268).
Figure 4.3 depicts the pivotal roles and mutual relationships of the three
components of the brand communication process. The inseparability of brand
identity, brand communication, and brand image must collectively ensure a
competitive advantage for the owner of the brand. It can be seen that brand
communication forms a tripartite bridge between brand identity and the
resultant brand image.
4.11 CONCLUSIONS: CONSTRUCT OF COMPREHENSIVE THEORETICAL AND
MODIFIED CONCEPTUAL MODELS ON BRAND IDENTITY AND BRAND
IMAGE
Based on the analysis of secondary sources, specific conclusions can be made

-91-
FIGURE 4.3: A model for the NMMU brand communication process
Source: Adapted from Balmer & Gray (2000:260)
NMMU brand identity • Values and purposes • Corporate strategy • Organisational culture • Organisational structure
Primary communication • Products and services • Marketing behaviour • Behaviour towards
employees • Employees’ behaviour to
other stakeholders • Non-market behaviour Secondary communication• Formal, corporate and
communications (advertising, PR, graphic design, etc.).
• Visual identification systems
Exogenous factors
Feedback Feedback
Creates
Creates
Through Can lead to
Tertiary communications• Word-of-mouth • Media interpretation and
spin • Competitors
Stakeholders • Students • Academic, administrative
and technical staff • Parents of students • Alumni • National and provincial
governments • Local business community• General public
NMMU brand image The immediate mental picture that individuals or individual stakeholder groups have of the NMMU
NMMU brand reputation Evolves over time as a result of consistent performance reinforced by the three types of communication shown above
Competitive advantage The reputation of the NMMU in the eyes of individuals and stakeholder groups will influence their willingness to either provide or withhold support for the NMMU
Exogenous factors
Perceptions of the NMMU and therefore the strength of competitive advantage can be influenced by a number of factors including: • Environment of Higher
Education Institutions • Industry image and
reputation, etc.
Primary communication
Secondary communication
Stakeholders
Tertiary communication
Stakeholders
NMMU BRAND IDENTITY
NMMU BRAND IMAGE AND
BRAND REPUTATION
POLITICAL ECONOMIC ETHICAL SOCIAL & TECHNICAL ENVIRONMENTAL FORCES
COMPETITIVE ADVANTAGE

-92-
for the research in question. Being informed about the meaning and context of
the concepts ‘brands’ and ‘branding’, the contemporary perspectives on
branding, brand equity, brand identity, brand knowledge, brand awareness,
brand image, brand loyalty, brand commitment and the role of brand
communications, enabled the researcher to give effect to two groups of
research objectives, namely, to construct the research instrument that will
assess the relationships as depicted in the modified conceptual model; and to
construct two theoretical models (see Section 1.3.2 of Chapter One).
Based on the analysis of secondary sources, it was possible to identify 60
contextualised statements on the NMMU brand variables, which were included
in the research instrument. The 60 statements on the brand variables are
subdivided as follows:
Brand reputation: 7 statements;
Brand relevance: 7 statements;
Brand personality: 7 statements;
Brand performance: 9 statements;
Brand relationship: 6 statements;
Brand identity: 14 statements;
Brand image: 10 statements.
The structure of the research instrument is described in Section 5.2.2 of
Chapter Five. The complete research instrument is attached to this study as
Annexure A. In addition the actual design of the research instrument, the
constructs of the two models and their application will be presented as the main
conclusions and outcomes to Chapters Three and Four.
The first model was labelled in Chapter One as the ‘comprehensive theoretical

-93-
model on brand identity and brand image’ (Figure 1.1), and was simplified and
then named the modified conceptual model on brand identity and brand image
(Figure 1.2).
FIGURE 4.4: Comprehensive theoretical model on brand identity and
brand image
Sources: Adapted from Coop (2004); Kapferer (1997)
One of the major outcomes of the analysis of secondary sources is Figure 1.1
of Chapter One, here reproduced for ease of reference as Figure 4.4. Figure
4.3 (A model the NMMU brand communication process) precedes Figure 4.4,
the former emphasising the pivotal role of marketing communication strategists
in the overall brand communication process. The sender of the brand message
has to be aware of the contemporary strategic branding paradigms
communicating the strategic intent of the institution (vision, mission, key values)
to stakeholders. The analysis of secondary sources further enabled the
identification of the brand identity variables, as shown in Figure 4.4. From the
“Brand gap”
Marketing communication
strategists · Fundamental values · Symbols · Truths · Personality · Ambition
Sender Brand identity
Media Sent signals
Receiver Brand image
Receiver Brand commitment
Identity variables · Reputation · Relevance · Personality · Performance · Relationship
· Strength of identity variables · Uniqueness of identity variables · Expectations · Perceptions and associations · Experiences · Evaluations
Strategic intent (vision, mission,
key values) Environment of Higher Education Institutions
Extraneous or exogenous variables
Image associations and variables

-94-
literature, it became clear that brand image is receiver (stakeholder) audience
focused. Brand image is created by the perceptions of stakeholders and thus
decoded by brand receivers. Brand image is thus a consequence of
stakeholders’ perceptions of the brand. The brand image associations and
variables are shown in Figure 4.4. In Section 4.9 of this chapter, the
implications of brand commitment were explained.
A simplification was done by reconstructing Figure 1.1, culminating in Figure
1.2 (reproduced here as Figure 4.5). This simplification, leading to the modified
conceptual model on brand identity and brand image, is better suited to give
effect to the research objectives and to test the hypotheses as stated in Section
1.4.2 of Chapter One. The modified conceptual model is also better suited to
illustrate the expected and actual experience of using the NMMU brand.
FIGURE 4.5: Modified conceptual model on brand identity and brand
image
Source: As modified from Figure 4.4
Stakeholder expectations
Independent variables Moderating or interaction variable
Dependent variable
H1.1
H1.2
H1.3
H1.4
H1.5
H2.1
Actual stakeholder experiences
Possible gap
H3.0
H3.A
Reputation
Relevance
Personality
Relationship
Environment of Higher Education
Institutions
Perceived brand image
Brand identity
Performance

-95-
The constructs of Figure 4.4 and Figure 4.5 were not possible without the
analysis and understanding of the relevant secondary sources. One of the most
important observations is that brand identity precedes brand image, an
observation which is the cornerstone of the model depicted in Figure 4.5.
________ II ________

-96-
CHAPTER FIVE
PRIMARY DATA SOURCING
5.1 INTRODUCTION This chapter gives effect to the third secondary research objective, as stated in
Section 1.3.2 of Chapter One, namely to source primary data to gauge the
opinions of stakeholders on the perceived NMMU brand image. This objective
implies that an appropriate overall survey design for sourcing the primary data
of this research must firstly be planned and then executed. The correct
planning and execution of the data sourcing phase according to prescribed
guidelines would contribute to the validity, reliability, credibility and relevancy of
the data to be used for eventual statistical analysis. This chapter on primary data sourcing consists of three main sections. Firstly,
the overall design and structure of the research (measuring) instrument will be
explained. A motivation why the Likert seven-point interval scale was adopted
will be given. Secondly, the modus operandi followed in the pilot study will be
explained, after which the findings of the pilot study (to assess the reliability of
the research instrument) will be reported. Finally, information will be supplied on
the target population (N), and the sampling frames and sampling units, which
led to the actual sample (n). An explanation will also be offered on the sampling
methods used. Based on all of the above, various conclusions will be
presented.
5.2 DESIGN AND STRUCTURE OF RESEARCH INSTRUMENT
5.2.1 Background to the design of the research instrument Questionnaires as research or measuring instruments to source primary (raw)

-97-
data are associated with both positivistic and phenomenological methodologies.
Collis and Hussey (2003:173) describe a questionnaire as a list of carefully
structured questions, chosen after considerable testing, with a view of eliciting
reliable responses from a chosen sample. In the research in question, the
purpose of the questionnaire was to source primary data in order to ascertain
what NMMU stakeholders’ perceptions were about the NMMU brand. The
statements contained in the questionnaire were all sourced from secondary
sources on branding, as explained in Chapters Three and Four. In phrasing the
statements on the NMMU brand, the requirements of a well-designed
questionnaire were considered, such as:
Statements should be as short as possible;
The logical structure of the questionnaire is important;
The statements should be as simple as possible (for example, jargon, or an
over-complex language or question structure should be avoided);
Ambiguous statements should be avoided (for example, linked statements
in the questionnaire);
Leading statements should not be included (statements that anticipate a
particular response); and
The wording of the covering letter should give clear instructions to the
respondents on how they should complete the questionnaire. The purpose
of the research should also be explained in the covering letter.
5.2.2 Structure of research instrument
The broad structure of the research instrument was already introduced in
Section 2.5.2 of Chapter Two. The covering letter explained the purpose of the
research as well as instructions on how to respond to the statements. The
survey was conducted under the auspices of the Centre for Applied Business

-98-
Management, a registered research centre at the NMMU.
The research instrument itself comprised two sections. Section A consisted of
60 statements (items); respondents were requested to give their
opinions/perceptions, using a Likert seven-point interval scale on the NMMU
brand. The statements contained in the questionnaire dealt with stakeholders’
perceptions of expectations as well as actual experiences linked to the NMMU
brand. This interval scaled research instrument enabled the researcher to
perform the inferential statistical data analysis, as described in Section 5.2.3 of
this chapter (Leedy & Ormrod 2005:26-27; Cooper & Schindler 2003:227-228).
As indicated, Section A, which dealt with stakeholders’ perceptions of the
NMMU brand identity and brand image, assessed the stakeholders’ rating of
their expectations and actual experiences of the NMMU brand. According to
Churchill (1997:67), it is expedient to assess expectations at the time of
purchase, and actual experience at some point after the purchase. The
structure of the research instrument enabled the researcher to give effect to the
view of Churchill. Next to the statements, two columns were provided; the first
column catered for expectations of the NMMU brand, using a Likert seven-point
scale. The second column made provision for the actual experiences of
respondents, also according to a Likert seven-point scale. To summarise: the
research instrument gauged both the NMMU stakeholders’ expectations
(perceptions) and actual experiences of the NMMU brand.
The respondents were requested to express their opinions/views/perceptions
by interpreting the Likert seven-point interval scale (1 = strongly disagree;
7 = strongly agree). The heading of Section A of the research instrument is
reproduced in Table 5.1. The complete research instrument is included in
Annexure A.

-99-
TABLE 5.1: Heading of research instrument
The 60 statements on the NMMU brand can be subdivided in terms of the
identified research variables. Table 5.2 provides the subdivision and number of
statements per research variable.
TABLE 5.2: Brand variables and number of statements per variable
Statements on Number of statements
Brand reputation
Brand relevance
Brand personality
Brand performance
Brand relationship
Brand identity
Brand image
7
7
7
9
6
14
10
Total 60
Section B of the questionnaire canvassed biographic data of the respondents,
such as the designated sampling frames (for example, students, staff, gender
and level of study). The biographical information provided in Section B assisted
in classifying the data in terms of the different sampling frames.
Expectations
of NMMU brand
Actual experiences
of NMMU brand STATEMENTS ON
NMMU BRAND IDENTITY
AND BRAND IMAGE
Strongly disagree
Disagree
Som
ewhat disagree
Neutral or no opinion
Som
ewhat agree
Agree
Strongly agree
Not applicable
Strongly disagree
Disagree
Som
ewhat disagree
Neutral or no opinion
Som
ewhat agree
Agree
Strongly agree
Not applicable

-100-
5.2.3 Operationalisation of variables of research instrument
The modified conceptual model (Figure 1.2 of Chapter One) shows five
independent variables impacting on brand identity (moderating variable). It
further hypothesises a relationship between brand identity and brand image
(dependent variable).
Based on the interpretation of secondary sources, each of the seven variables
was defined and described in Chapters Three and Four. Previous research has
not been replicated in this study, in the sense that all statements used in the
research instrument were newly generated by the researcher, based on
secondary sources.
More particularly in Chapter Four, each of the seven variables was defined for
the proposed conceptual model. For ease of reading, the definitions of these
variables as used in this research are repeated:
Brand reputation is defined as a collective representation of a brand’s past
actions and results that describes the brand’s ability to deliver valued
outcomes to multiple stakeholders.
Brand relevance is defined as how well the brand ‘speaks’ to individual
audiences. With regard to this research, brand relevance is seen as how
well the NMMU brand communicates to stakeholders in terms of their
needs.
Brand personality reflects the brand’s emotional characteristics and is
defined as the set of human characteristics associated with a brand, such
as the level of excitement, competence, sophistication, and ruggedness.
Brand performance is directly related to the levels at which consumers
perceive that the primary and actual characteristics of a brand will operate.

-101-
Performance contains an element of perceived quality on the part of the
product/service or brand.
Brand relationship is defined as a relationship between the brand and its
customers, which is characterised by the values inherent in the brand’s
personality.
Brand identity is defined as the direction, purpose and meaning of the
brand, and as such is central to the brand’s strategic vision, and the
cornerstone of brand strategy and brand building.
Brand image is defined as the perception of a brand, as reflected by the
brand associations held in consumer memory. The brand associations may
be described in terms of attributes, benefits and attitudes (based on
experience of the brand).
Before the research instrument was administered, it was extensively pilot
tested for reliability. The pilot testing procedure and results will be reported in
Section 5.3 of this chapter.
5.2.4 Measurement scales
The decision on the measurement scales (nominal, ordinal, interval or ratio)
used in a research instrument to collect the data has important implications for
the type of statistical analysis that a researcher may perform. As indicated
earlier, a decision was taken to use the Likert seven-point interval scale. Before
motivating this decision in this research, it is necessary to briefly introduce the
four scales of measurement.
(i) Nominal scale of measurement
Leedy and Ormrod (2005:25) provide a fitting description of the nominal scale

-102-
of measurement by explaining that the word ‘nominal’ comes from the Latin
nomen, which means ‘name’. Data can thus be ‘measured’ by assigning names
to it. This scale allows researchers only to classify data, which allows
inferences on equality or difference, but nothing else (Collis & Hussey
2003:161). For example, a sample of objects, such as staff members, can be
classified (named) according to a variable ‘function’, which allows the
researcher to count the number of directors, executive managers, financial
managers, and the like.
Because nominal measurement is elemental and unrefined, allowing only a few
statistics appropriate for analysing nominal data, this scale was judged to be
inappropriate for the statistical data analysis requirements of the research in
question.
(ii) Ordinal scale of measurement
An ordinal scale arranges objects or alternatives according to their magnitude
in an ordered relationship (Zikmund 2003:297). In such an event, the
researcher may argue in terms of > (greater than) or < (less than). This scale
allows the researcher to rank-order data, hence the name ‘ordinal’ (Leedy &
Ormrod 2005:26).
An ordinal scale allows an extension of the range of statistical techniques that
can be used for data analysis, such as the median and percentile rank. The
extent of the relationship between two characteristics can also be determined
by means of Spearman’s rank order correlation (Leedy & Ormrod 2005:26).
To summarise, a typical ordinal scale allows respondents to rate, for example,
the brand image of the NMMU as ‘excellent’, ‘good’, ‘fair’, or ‘poor’, but such a

-103-
rating does not specify how much better is ‘good’ in relation to ‘fair’.
Despite the greater statistical data analysis possibilities associated with ordinal
data, its inherent weaknesses make it unsuitable as a measurement scale for
the research in question.
(iii) Interval scale of measurement
Interval scales of measurement have the power (abilities) of nominal and
ordinal scales, plus one additional strength: they incorporate the concept of
equality of interval (the distance between 1 and 2 equals the distance between
2 and 3, 3 and 4, and so on) (Blumberg et al. 2005:376). Besides the equality
described above, interval scales also have a zero point that has been
established arbitrarily (Leedy & Ormrod 2005:26).
The rating scales employed in survey research are assumed to be interval
scales. For the research in question, it was decided to use a Likert seven-point
interval scale, as shown in Figure 5.1. As also indicated in Figure 5.1, the
‘equidistances’ between the numbers are the same.
FIGURE 5.1: Illustration of a Likert seven-point scale
Source: Adapted from Leedy & Ormrod (2005:26)
1 2 3 4 5 6 7 Strongly Agree
Neutral or no opinion
Strongly Disagre
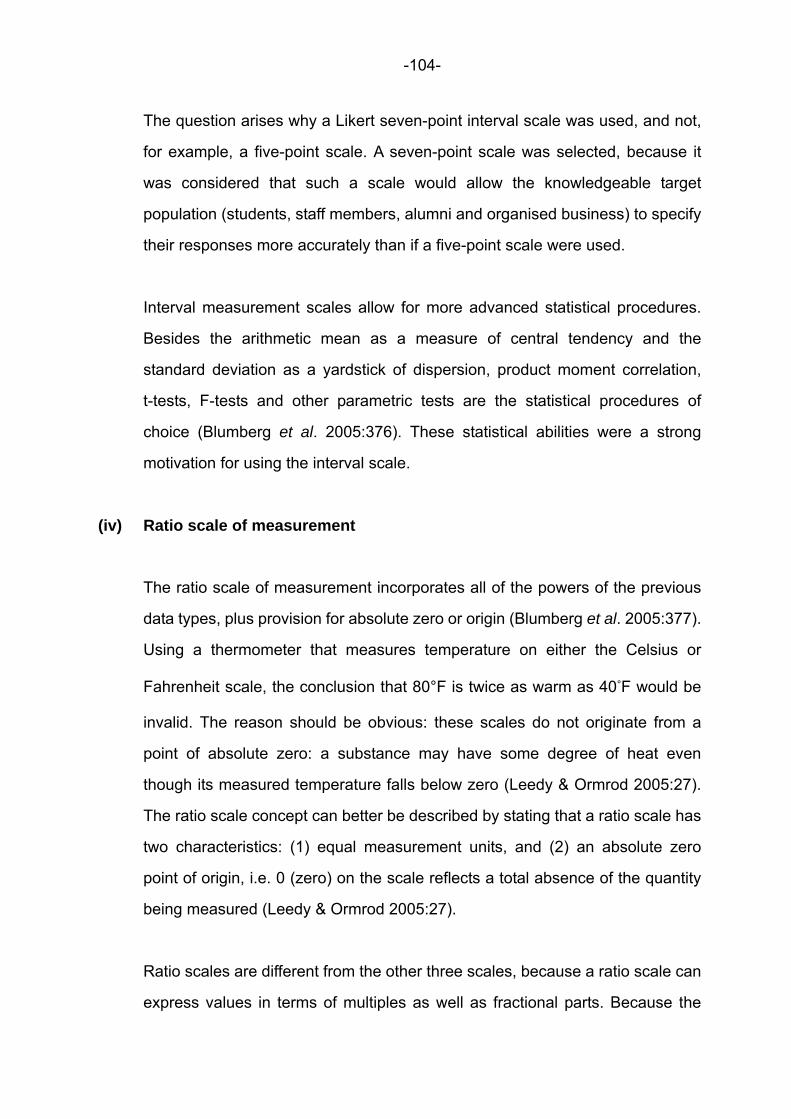
-104-
The question arises why a Likert seven-point interval scale was used, and not,
for example, a five-point scale. A seven-point scale was selected, because it
was considered that such a scale would allow the knowledgeable target
population (students, staff members, alumni and organised business) to specify
their responses more accurately than if a five-point scale were used.
Interval measurement scales allow for more advanced statistical procedures.
Besides the arithmetic mean as a measure of central tendency and the
standard deviation as a yardstick of dispersion, product moment correlation,
t-tests, F-tests and other parametric tests are the statistical procedures of
choice (Blumberg et al. 2005:376). These statistical abilities were a strong
motivation for using the interval scale.
(iv) Ratio scale of measurement
The ratio scale of measurement incorporates all of the powers of the previous
data types, plus provision for absolute zero or origin (Blumberg et al. 2005:377).
Using a thermometer that measures temperature on either the Celsius or
Fahrenheit scale, the conclusion that 80°F is twice as warm as 40°F would be
invalid. The reason should be obvious: these scales do not originate from a
point of absolute zero: a substance may have some degree of heat even
though its measured temperature falls below zero (Leedy & Ormrod 2005:27).
The ratio scale concept can better be described by stating that a ratio scale has
two characteristics: (1) equal measurement units, and (2) an absolute zero
point of origin, i.e. 0 (zero) on the scale reflects a total absence of the quantity
being measured (Leedy & Ormrod 2005:27).
Ratio scales are different from the other three scales, because a ratio scale can
express values in terms of multiples as well as fractional parts. Because the

-105-
usage of ratio scales outside the physical sciences is relatively rare, such
scales were not considered to be a prerequisite for this research.
TABLE 5.3: Summary of measurement scales
Measurement scale
Characteristics of the scale
Statistical possibilities of the scale
Nominal scale
A scale that ‘measures’ in terms of names or designations of discrete units or categories
Enables one to determine the mode, the percentage values, or the chi-square Non-interval
scales
Ordinal scale
A scale that ‘measures’ in terms of such values as ‘more’ or ‘less’, ‘ larger’ or ‘smaller’, but without specifying the size of the intervals
Enables one also to determine the median, percentile rank, and rank correlation
Interval scale
A scale that measures in terms of equal intervals or degrees of difference but whose zero point, or point of beginning, is arbitrarily established
Enables one also to determine the mean, standard deviation, and product moment correlation; allows one to conduct most inferential statistical analyses Interval
scales
Ratio scale
A scale that measures in terms of equal intervals and an absolute zero point of origin
Enables one also to determine the geometric mean and the percentage variation; allows one to conduct virtually any inferential statistical analysis
Source: Adapted from Leedy & Ormrod (2005:28)
The outstanding features of the four scales of measurement are as follows
(Leedy & Ormrod 2005:27):
A nominal scale: One object is different from another;
An ordinal scale: One object is bigger or better or more of anything than
-106-
another;
An interval scale: One object is so many units (degrees, inches) more than
another;
A ratio scale: One object is so many times as big or bright or tall or heavy
than another.
Table 5.3 provides a summary of measurement scales, their characteristics and
statistical implications. Of decisive importance is the statistical possibilities
associated with the measurement scales. An interval scale allows the
researcher to conduct the inferential statistical analysis required for this study.
5.3 PILOT TESTING OF RESEARCH INSTRUMENT
The data gathering phase of the research process actually begins with a pilot
study or pilot testing. In this phase, the objective is to test the research
instrument, to ascertain whether the instrument actually meets its purpose. The
crucial question is whether the research instrument really sources the data that
it is designed (or intended) to source. A pilot study is an excellent way to
determine the feasibility of a research project. Pilot testing of the research
instrument can reveal weaknesses in its design. Basically, pilot testing is a
simulation before the start of the actual primary data collection phase.
In this study, a pilot test was conducted to assess the reliability of the
measuring instrument. The questionnaire was administered to 252 students
doing their second semester course in Business Management at the South
Campus of the NMMU. The purpose of the research was explained to the
students when the questionnaire was administered.
To verify the consistency of the inter-item reliability of the questionnaire,

-107-
Cronbach alpha reliability coefficients were calculated. Reliability coefficients
lower than 0.60 were deemed to be questionable; those close to 0.70 as
acceptable; while coefficients larger that 0.80 were regarded as good (Sekaran
1992: 174, 284, 287). The Cronbach alpha coefficients for the student pilot
study respondents are presented in Table 5.4. The SPSS programme was used
for the calculation of the Cronbach alpha reliability coefficients for the pilot
testing phase.
TABLE 5.4: Cronbach alpha reliability coefficients for pilot study
NMMU brand Brand variables Expectations Actual experiences
Reputation
Relevance
Personality
Performance
Relationship
Identity
Image
0.878
0.832
0.858
0.886
0.849
0.897
0.862
0.852
0.850
0.848
0.877
0.856
0.896
0.890
Table 5.4 shows that, for the pilot study, all Cronbach alpha coefficients were in
excess of 0.80 for all the variables, both for expectations and actual
experiences of the NMMU brand. Given this favourable result, it was decided to
proceed with the administering of the questionnaire without further changes.
5.4 PHASES IN SAMPLING DESIGN
The phases leading towards the sampling design include concepts such as
population, target population, sampling frames, sampling units, sampling and
sample size. The sampling methods used are another relevant set of

-108-
information that needs to be reported. For the purpose of primary data sourcing,
it is important to have a common understanding with regard to the
abovementioned concepts.
5.4.1 Population and target population
A population or universe is any complete group or body of people or any
collection of items under consideration for the research purpose (Collis &
Hussey 2003:155; Zikmund 2003:369). For the research in question, the
population refers to the diverse NMMU stakeholder groups, i.e. students, all
staff members, parents of students, alumni, national and provincial
governments, and the business community at large. Apart from the registered
students, NMMU staff, parents of students, alumni and the business community,
it is difficult to physically count all the units in order to arrive at the population (N)
for this research.
The above broad definition of the population was narrowed down to the target
population, which comprises the complete group of specific population
elements relevant to the research project (Blumberg et al. 2005:209-210;
Zikmund 2003:373). This narrowing down was done solely for pragmatic
reasons. The target population included as stakeholder groups registered
students, all staff members, those alumni whose electronic mail addresses
were available, and members of the Port Elizabeth Regional Chamber of
Commerce and Industry (PERCCI), the latter representative of the business
community.
The above delimitation of the target population was important in order to identify
the source from which the primary data was obtained.

-109-
FIGURE 5.2: Target population, sampling frames and sampling units of research
South Campus (10 634)
Second Avenue Campus (3 683)
Vista Campus (1 757)
All NMMU staff with access to PCs (1 900)
Identified alumni (287)
PERCCI members (900)
All NMMU staff with access to PCs (1 900)
Identified alumni (287)
PERCCI members (900)
Target population
Sampling frames
Sampling units
• Business management, Entrepreneurship (Degree Programmes);
• Marketing, Logistics Management (Diploma Programmes).
NMMU stakeholders
Students registered at all campuses (16 074)
All NMMU staff (2 130) Identified alumni (287)
PERCCI members (900)

-110-
Figure 5.2 presents an overall picture of the four target population subsets:
Contact students registered at the various NMMU campuses (excluding
distance education enrolments) (N =16 074);
All NMMU staff (N = 2 130);
Alumni with electronic mail addresses available (N = 287); and
Members of PERCCI (N = 900).
5.4.2 Sampling frames
The sampling frame is closely related to the target population. The sampling
frame is the list of elements from which the sample is actually drawn. In actual
practice, the sample will be drawn from a list of population elements that is
often somewhat different from the target population that has been defined
(Zikmund 2003:373).
For this research, the sampling frames for the target student subset comprised
only three NMMU campuses, namely South Campus (N = 10 634), Second
Avenue Campus (N = 3 683), and Vista Campus (N = 1 757). Practical
considerations limited the sampling frames to only three of the NMMU
campuses where Business Management and associated fields of study were
presented.
Because the research instrument was made available electronically to NMMU
staff, the staff sampling frame comprised only those staff members with access
to PCs (N = 1 900). For alumni, the same line of argument was followed: only
alumni whose e-mail addresses were available (N = 287) were judged to be the
relevant alumni sampling frame. For organised businesses, 900 questionnaires
were distributed (N = 900).

-111-
5.4.3 Sampling units
Zikmund (2003:375) is of the opinion that during the actual sampling process,
the elements of the target population must be selected according to a certain
procedure. The sampling unit is a single element or group of elements subject
to selection in the sample. For the research in question, and as shown in Figure
5.2, the sampling units comprised the identified groups of students at the South,
Second Avenue, and Vista Campuses taking courses in Business Management
and associated disciplines. These sampling units represented the units of
analysis for the research.
The identification of sampling units among staff members, alumni and PERCCI
members was complicated by the structure of the overall population. In the
case of the students’ sampling frames, it was possible to perform a finer
classification into sampling units (only students doing Business Management
and associated disciplines).
For NMMU staff, alumni and PERCCI members, no further subdivision was
done: All staff members with access to PCs were invited to share their opinions
on the NMMU brand, and likewise, the alumni on the address list supplied by
the Alumni Office of the NMMU and the members on the PERCCI membership
list. Therefore, the sampling frames and sampling units for these three target
population groups were deemed to be the same.
5.4.4 Sampling and sample size
A sample is a subset from a target population is which the researcher is
interested (De Vos et al. 2002:199). The process of sampling involves any
procedure using a small number of parts of the whole population to draw

-112-
conclusions regarding the whole population. The purpose of sampling is to
enable researchers to estimate some unknown characteristic of the population,
for example, stakeholders’ perceptions of the NMMU brand (Collis & Hussey
2003:155; Zikmund 2003:369).
For the student sampling units, the sample comprised groups of students
enrolled for similar types of Business Management courses on the three NMMU
campuses. Several decisions had to be made to secure a sample. Figure 5.3
presents these decisions as a series of sequential stages, even though the
order of decisions did not always follow this particular sequence. These
decisions are generally highly interrelated (Blumberg et al. 2005:208-209; Collis
& Hussey 2003:155-156; Zikmund 2003:372).
FIGURE 5.3: Selecting a sample
Sources: Adapted from Blumberg et al. (2005:208-209); Collis & Hussey
(2003:155-156); Zikmund (2003:372)
Define the target population
Obtain or construct sampling frame
Determine sampling method
Determine sample size
Select actual sampling units
Conduct fieldwork (collect the data)

-113-
As discussed in Section 2.3 of Chapter Two, the research in question can be
labelled as positivistic. In a positivistic study, a representative or good sample
can be taken to be true for the whole population. In other words, the results can
be generalised to the whole population.
A good sample must be:
chosen at random (every member of the population must have a chance of
being chosen);
large enough to satisfy the needs of the investigation being undertaken;
and
unbiased and representative of the population from which it is drawn (Collis
& Hussey 2003:155).
Certain principles that influence sample size include (Blumberg et al.
2005:213):
The greater the dispersion or variance within the population, the larger the
sample must be to provide estimation precision;
The greater the desired precision of the estimate, the larger the sample
must be;
The narrower the interval range, the larger the sample must be, for example,
using a Likert seven-point scale against a five-point scale;
The higher the confidence level required in the estimate, the larger the
sample must be;
The greater the number of sub-groups of interest within a sample, the
greater the sample size must be, as each sub-group must meet minimum
sample size requirements;
If the calculated sample size exceeds five per cent of the population,

-114-
sample size may be reduced without sacrificing precision.
Larger samples enable researchers to draw more representative and more
accurate conclusions and to make more accurate predictions than do smaller
samples. Table 5.5 presents an indication of what the size of a sample ought to
be, given the size of the population (De Vos et al. 2002:200-201).
TABLE 5.5: Guidelines for sampling
Population Percentage suggested Number of respondents(actual sample)
20 30 50
100 200 500
1 000 10 000
100 000 200 000
100% 80% 64% 45% 32% 20% 14%
4,5% 2% 1%
20 24 32 45 64
100 140 450
2 000 2 000
Source: De Vos et al. (2002:201)
In this study, the research instrument (as described in Section 5.2) comprised
60 statements contextualised to the NMMU brand. To perform the required
statistical analysis and to test the hypotheses formulated, a target minimum of
300 respondents was required.
5.4.5 Sampling methods employed
According to Figure 5.3, the construct of the sampling frame is followed by the
determination the sampling method. Research literature (Blumberg et al.
2005:214-225; Zikmund 2003:376-398) describes a wide variety of sampling

-115-
methods. Sampling methods can be divided into two main categories, namely
probability and non-probability samples. Probability sampling may be described
as a sampling method in which every member of the population has a known in
advance, non-zero probability of selection. Non-probability sampling, on the
other hand, represents a sampling method in which units of the sample are
selected on the basis of personal judgment or convenience (Zikmund
2003:379).
TABLE 5.6: Main features, advantages and disadvantages of sampling
methods used
Sampling method
Main features Advantages Disadvantages
Convenience sampling
Approach population
Talk to randomly chosen respondent
Check target group
Unrestricted
Simple Fast Low
non-response Acceptable in
research to obtain an initial impression
Impossible to calculate mathematical sample margins
Not very reliable Not a representative
sample
Judgment sampling
Approach experts in a certain field
Purposive
Simple Fast Acceptable in
research to obtain an initial impression
Impossible to calculate mathematical sample margins
Not very reliable Not a representative
sample
Quota sampling
Population in sub-population
Sample from each sub-population (at random)
Indicate number in advance (quota)
Purposive
More reliable than the two methods above
Important population characteristics are included
The cells are selectively filled in
May not be representative with regard to characteristics left out
Chance of fraud by pollsters
Source: Adapted from Zikmund (2003:379-398)
From the description of the sampling frames and sampling units (see Figure
5.2), it is clear that non-probability sampling methods were used in this
-116-
research. More specifically, a combination of convenience sampling, judgment
(purposive) and quota sampling was employed. The motivation for this decision
will be clear once the main features, advantages and disadvantages of the
three sampling methods are explained, as summarised in Table 5.6.
From Table 5.6, it is evident that convenience sampling pertains to sampling by
obtaining units or people who are most conveniently available (Zikmund
2003:280). For example, in this study, the students were present in the
Business Management classes and were willing to share their opinions on
NMMU brand identity and brand image. The respondents were randomly
selected to participate, leading to low non-responses (refusal to participate).
Convenience sampling does not always lead to representative samples.
Judgmental or purposive sampling is a non-probability sampling technique in
which an experienced individual selects the sample, based on his or her
judgment about some appropriate characteristic required of the sample
members (Zikmund 2003:382). For the research in question, Business
Management students were selected on purpose, because, given their field of
study, were expected to have prior knowledge on brand issues and to be in a
better position to express a view on branding, as compared to, for example,
students in Chemistry. Judgmental sampling as a stand-alone sampling method
is not very reliable and also not representative of the population.
Quota sampling is a non-probability sampling procedure. The purpose of quota
sampling is to ensure that the various subgroups in a population are
represented on pertinent sample characteristics to the exact extent that the
investigators desire (Zikmund 2003:383). Because the purpose of this survey
was to gauge students’ perceptions (as one group of stakeholders) of the
NMMU brand, it was decided to focus primarily on students doing courses in

-117-
Business Management and Entrepreneurship as respondents. This basically
implied that the overall student population was broken down into
sub-populations at different levels of study, which is one of the main features of
quota sampling. Important population characteristics were included in terms of
different levels of study. Collectively, the end result was that a more
knowledgeable sample of students responded to the brand statements in the
questionnaire.
5.4.6 Administering research instrument and actual samples (responses)
The overall structure of the research instrument was presented in Section 5.2.2
of this chapter. The procedures through which the questionnaire was
administered to the students, NMMU staff members, alumni and PERCCI
members will now be described.
Administering questionnaire to student sampling units
The student sampling units on the three NMMU campuses were identified.
Because the research topic was Business Management, more particularly
marketing related, students taking modules in the field of study comprised the
planned sample. Lecturers knowledgeable in the field of Business
Management/Marketing administered the questionnaire. The purpose of the
research was briefly explained and the students received a copy of the
questionnaire. The same procedure was followed on the three campuses
involved.
As shown in Figure 5.2, the South and Vista Campuses of the NMMU offer the
Baccalaureus Commercii degree, with Business Management/Marketing as
one of the majors. The Second Avenue Campus offers a range of programmes
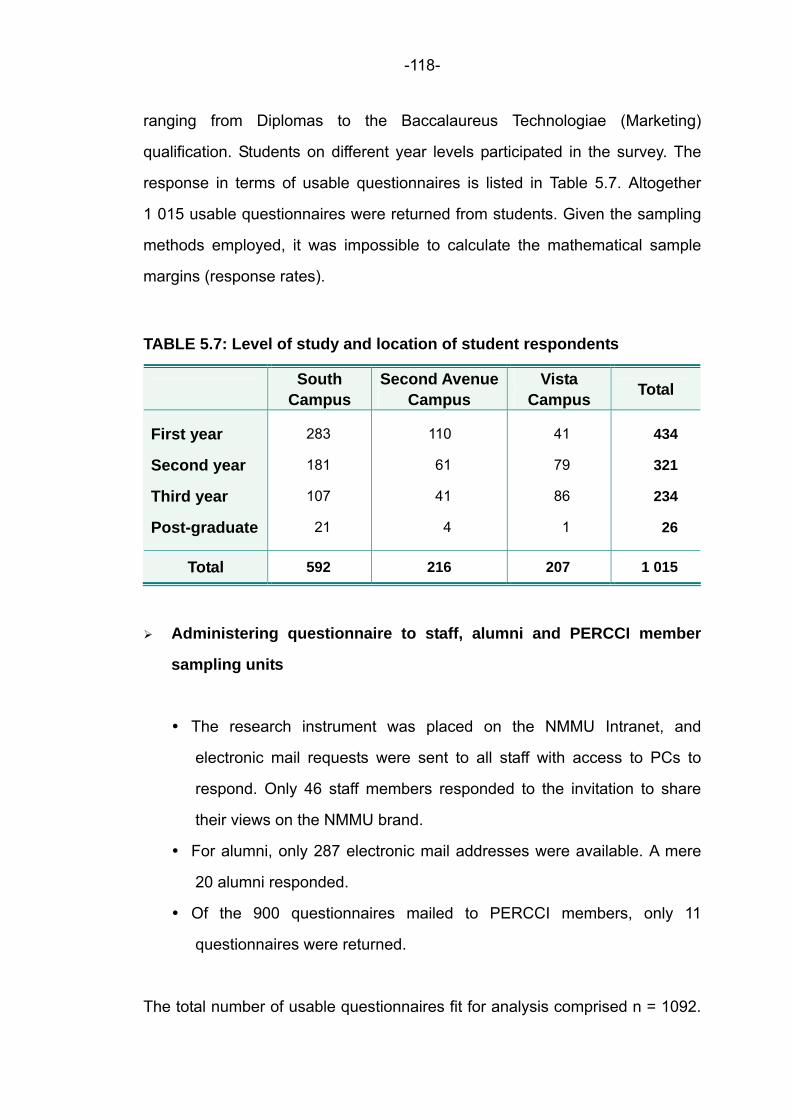
-118-
ranging from Diplomas to the Baccalaureus Technologiae (Marketing)
qualification. Students on different year levels participated in the survey. The
response in terms of usable questionnaires is listed in Table 5.7. Altogether
1 015 usable questionnaires were returned from students. Given the sampling
methods employed, it was impossible to calculate the mathematical sample
margins (response rates).
TABLE 5.7: Level of study and location of student respondents
South Campus
Second Avenue Campus
Vista Campus Total
First year
Second year
Third year
Post-graduate
283
181
107
21
110
61
41
4
41
79
86
1
434
321
234
26
Total 592 216 207 1 015
Administering questionnaire to staff, alumni and PERCCI member
sampling units
The research instrument was placed on the NMMU Intranet, and
electronic mail requests were sent to all staff with access to PCs to
respond. Only 46 staff members responded to the invitation to share
their views on the NMMU brand.
For alumni, only 287 electronic mail addresses were available. A mere
20 alumni responded.
Of the 900 questionnaires mailed to PERCCI members, only 11
questionnaires were returned.
The total number of usable questionnaires fit for analysis comprised n = 1092.

-119-
The breakdown is summarised in Table 5.8.
TABLE 5.8: Actual samples of research
Number of actual samples Percentage (%)
Students Staff members Alumni PERCCI members
1 015 46 20 11
93.0 4.2 1.8 1.0
Total 1 092 100.0
The question arose whether the respondents (actual sample) were adequate
for performing inferential statistical analysis to give effect to the research
problem and to test the stated hypotheses. At least two guidelines point to the
affirmative. Table 5.2, which is based on the views of De Vos et al. (2002:201),
indicates that a population of 10 000 require an actual sample of 450. Should a
linear relationship be assumed and applied to the numbers of Table 5.2, a
student population of 20 000 require an actual sample of 900. Given the 60
statements in the research instrument, a target minimum actual sample of 300
was specified. According to Table 5.7, the actual number of student
respondents was 1 015, significantly in excess of the minimum specified.
With a staff complement of 1 900, no valid conclusions could be made from the
46 staff respondents. The same applied for the alumni (n = 20) and PERCCI
member (n = 11) respondents.
Viewed against the primary objective of this research, namely to investigate
and analyse the impact of brand identity on the perceived brand image of the
NMMU, a sufficient number of responses were sourced to arrive at valid and
credible findings.

-120-
As the questionnaire probed the expectations and actual experiences of
stakeholders using the NMMU brand, it can be argued that the students were
the only stakeholder group who could really express their actual experiences.
Alumni and PERCCI members were possibly too far removed from the realities
transpiring at the newly established NMMU to express a serious opinion.
5.5 SUMMARY AND CONCLUSIONS
The design of the research instrument used in this study was based on
secondary sources, and a questionnaire was designed. The Likert seven-point
interval measuring scale was adopted, as it met the statistical data analysis
requirements of the research.
Secondly, the pilot testing of the research instrument yielded favourable results
in terms of the Cronbach alpha reliability coefficients. This finding provided a
clear signal to proceed with the research. Thirdly, the target population,
sampling frames and sampling units were identified. Suitable sampling
methods were described. A yield of 1 092 usable questionnaires was obtained,
significantly in excess of the minimum specified to test the conceptual model on
brand identity and brand image.
________ II ________

-121-
CHAPTER SIX
DATA ANALYSIS AND EMPIRICAL FINDINGS
6.1 INTRODUCTION
This chapter reports on the data analysis and empirical findings. More
specifically, effect is given to research objectives (iv) and (v), as stated in
Section 1.3.2 of Chapter One, namely to empirically test the construct and three
sets of hypotheses, as depicted in the modified conceptual model on brand
identity and brand image (Figure 1.2 of Chapter One); and to analyse the data
and report on possible disparities (“gaps”) between the expectations linked to
the NMMU’s brand image and the actual experience of this brand.
This chapter consists of three main sections. Firstly, the procedures for the data
cleaning will be explained, followed by a description of the statistical
procedures used in the research. Particular emphasis will be placed on the
validity and reliability of the research instrument, the types of regression
analyses performed, pair-wise t-tests, and the calculation of mean scores and
relative percentage ratings of the NMMU brand performance. Thirdly, the
empirical findings will be reported on, comprising the findings on the
discriminant and construct validity of the research instrument, and the
hypothesised relationships of the modified conceptual model will be assessed.
6.2 DATA INSPECTION
Table 5.7 of Chapter Five summarises the responses from the four samples as
derived from the sampling units. A decision was taken to aggregate the
responses of the four sample groups, which produced 1 092 usable responses
suitable for statistical analysis. The decision to aggregate the samples was
based on the objective to test a theoretical construct, namely the modified
conceptual model (Figure 1.2 of Chapter One). For this reason, all of the
stakeholders’ responses were retained for further statistical analysis.

-122-
On the completed questionnaires, some respondents marked the N/A (not
applicable) column for some statements (items) only. The mean values for
these items were entered which is an acceptable way to deal with missing data.
After the completion of the data cleaning exercise, the per item mean and
standard deviation values were calculated, with the objective to visually inspect
the data.
The actual statistical analysis of the data consisted of six phases. Initially, the
data was subjected to an exploratory factor analysis to assess the discriminant
validity of the measuring instrument. Items that did not load to a significant
extent (loadings ≥ 0.35) and on a unique factor were deleted. This was followed
by an assessment of the reliability of the research instrument by means of an
internal consistency measure (Cronbach alpha reliability coefficients). The
items that remained, were included in the multiple regression model to assess
the impact of brand identity variables on brand identity. The next phase
comprised a regression analysis of brand identity on brand image. Fifthly, to
assess any differences between stakeholders’ expectations and actual
experiences when using the NMMU brand, pair-wise t-tests were performed.
Finally, to gauge the level of satisfaction of NMMU stakeholders when using the
brand, a “gap” analysis was performed by using the mean scores to find relative
percentage ratings (to be explained in Section 6.3.6).
6.3 STATISTICAL PROCEDURES
6.3.1 Validity of research instrument
The first phase of data analysis entailed an assessment of the discriminant
validity of the research instrument. The validity of a research instrument refers
to the extent to which a measure or set of measures correctly represents the
concept of study. Validity is therefore concerned with how well the concept is
defined by the measure(s) (Hair, Anderson, Tatham & Black 1998:90).
As described in Section 2.4.2 of Chapter Two, it is possible to differentiate

-123-
between the construct and discriminant validity of a research instrument.
Construct validity refers to the ability of the research instrument to measure the
statements (items) posed and the extent to which the research instrument
confirms the stated hypotheses. As explained in Section 2.4.2 of Chapter Two,
construct validity is established by the degree to which a research instrument
confirms a network of related hypotheses generated from a theory based on the
concepts. In other words, construct validity for the research in question
determines whether the empirical evidence is consistent with the theoretical
logic about aspects of the brand identity and image of institutions like the
NMMU. Discriminant validity in this context refers to the ability of the research
instrument to assess the uni-dimensionality of underlying brand dimensions. A
research instrument has discriminant validity when it has low correlation with
measures of dissimilar concepts (Zikmund 2003:302-304).
The multivariate technique of exploratory factor analysis was used in this study
to assess the discriminant and construct validity of the research instrument.
The main purpose of exploratory factor analysis is to identify the substructures
in the data matrix. The computer program BMDP4M was used to conduct the
exploratory factor analysis (Frane, Jennrich & Solomon 1990).
Factor analysis is a technique that enables a researcher to analyse data of a
relatively large number of variables and generate a smaller group of factors,
based on linear combinations of the original data (Parasuraman 1991:757; Lee
1985:79-80). Data reduction is also achieved by performing a factor analysis.
By means of a factor analysis, the variables that are associated with each other
are identified (for this research, variables such as ‘reputation’, ‘relevance’,
‘personality’, ‘performance’, ‘relationship’, ‘identity’ and ‘image’) and brought
together with those variables that measure or evaluate the same aspect
(Cooper 1983:141-146). Such a group of variables that adjudicate or measure
the same aspect, form a factor (Gombola & Ketz 1983:46). In this study, each
factor represents independent, moderating or dependent variables in the
modified conceptual model (Figure 1.2 of Chapter One).

-124-
By using the intercorrelations of the responses, factor analyses were performed
on the data, with the objective of identifying possible communalities, patterns
and extracting factors, hereby also assessing the discriminant and construct
validity of the research instrument.
Principal component analysis was the technique used by the BMDP-program
for the initial iterations to extract the factors (Lee 1985:889-892). A direct
oblimin rotation was specified to allow for probable intercorrelations between
the factors. When the data approached a normal distribution around the mean,
and to improve the eigenvalues, the principal component factor analysis was
discarded. Thereafter, maximum likelihood was specified as the method of
factor extraction, and a direct quartimin oblique rotation of the original matrix
was used (Jennrich & Sampson 1996). The method of maximum likelihood was
preferred, due to the fact that all factors extracted were expected to be
correlated with each other. A direct quartimin oblique rotation was used, since
the latent variables (factors) are usually correlated in a study of this nature.
6.3.2 Reliability of research instrument
In this research, Cronbach alpha reliability coefficients were used to assess the
internal consistency of the entire scale. This phase of the data analysis focused
on the assessment of the reliability (internal consistency) of the research
instrument by means of a reliability analysis. In each step of this procedure,
Cronbach alpha reliability coefficients of the research instrument were
computed so that individual variables (items) could be removed to improve the
reliability of the research instrument, if necessary. The computer program SAS
PROC CORR (SAS Institute 1998) was used for this purpose.
The generally agreed lower limit for Cronbach alpha reliability coefficients is
0.70, although the requirement may be lowered to 0.60 in the case of
exploratory research (Hair et al. 1998:118). Generally speaking, reliability
coefficients lower than 0.60 are deemed to be questionable; those close to 0.70
as acceptable; and coefficients larger than 0.80 as good (Bernardi, 1994:767;

-125-
Sekaran, 1992:174, 284, 287).
6.3.3 Multiple linear regression analysis (brand identity variables on brand
identity)
Multiple linear regression analysis was performed to assess whether the
identified brand identity variables impacted on brand identity. Multiple linear
regression analysis is an extension of bivariate regression analysis, which
allows for the simultaneous investigation of the effect of two or more
independent variables on a single interval-scaled or ratio-scaled dependent
variable (Blumberg et al. 2005:743; Zikmund 2003:576). Multiple linear
regression analysis was performed to assess whether the identified
independent variables exerted a significant influence on brand identity. The
computer program SAS PROC CORR (SAS Institute 1998) was used for this
procedure.
For the purpose of this research, the first of the three sets of hypotheses will be
tested by using multiple linear regression analysis.
First set of hypotheses: Effect of brand identity variables on brand
identity.
H1.1: There is a positive relationship between the variable ‘reputation’
and brand identity.
H1.2: There is a positive relationship between the variable ‘relevance’ and
brand identity.
H1.3: There is a positive relationship between the variable ‘personality’
and brand identity.
H1.4: There is a positive relationship between the variable ‘performance’
and brand identity.
H1.5: There is a positive relationship between the variable ‘relationship’
and brand identity.

-126-
6.3.4 Linear regression analysis (brand identity on brand image)
According to the construct of the modified conceptual model, brand identity
impacts on brand image. Linear regression analyses were performed to
establish the relationships as formulated in the relevant set of hypotheses.
Linear regression analysis is a technique for measuring the linear association
between an independent and a dependent variable. Linear regression analysis
assumes that the dependent variable is predictively linked to the preceding
variable (Zikmund 2003:556).
Second set of hypotheses: Effect of brand identity on perceived brand
image.
H2.1: There is a positive relationship between brand identity and
perceived brand image of the NMMU.
6.3.5 Pair-wise t-tests
A t-test is a technique used to test the hypothesis that the mean scores on
some interval-scaled variables are significantly different for two independent
samples or groups (Blumberg et al. 2005:664; Zikmund 2003:524). Pair-wise
t-tests were conducted to assess any differences in perceptions between
expectations and actual experiences of the stakeholders of the perceived
NMMU brand image.
For this purpose, the third set of hypotheses was tested.
Third set of hypotheses: Perceptions of stakeholders of expectations
and actual experiences of the perceived NMMU brand image.
H3.0: There are no perceived differences between stakeholders’
expectations and actual stakeholders’ experiences of the NMMU brand
image.

-127-
H3.A: There are perceived differences between stakeholders’
expectations and actual stakeholders’ experiences of the NMMU brand
image.
6.3.6 Mean scores and relative percentage ratings
To further explore the third set of hypotheses, which deals with expectations
and actual experiences of using the NMMU brand, an analysis of the mean
scores was performed and the resultant statistics were expressed in terms of a
possible “gap”. Besides the above, this analysis was further extended by
expressing the mean scores in terms of relative levels of satisfaction by using
the NMMU brand. Such relative levels of satisfaction may also be interpreted as
the actual performance of the NMMU brand.
The methodologies of the above-mentioned analyses will be described together
with the relevant tables in Section 6.4.4 of this chapter.
6.4 EMPIRICAL FINDINGS
6.4.1 Discriminant and construct validity findings (exploratory factor analysis)
The following procedures were followed when performing the exploratory factor
analysis for the 60 statements (items) on both expectations and experiences of
the NMMU brand. Initially, the scores of the respondents on the brand
statements (items) were fed into the programme with no restriction specified on
the number of factors. Kaiser’s rule was used to establish the number of factors,
i.e. factors with eigenvalues of ≥ 1 were retained (Green, Tull & Albaum,
1988:577).
In each of the further iterations of the exploratory factor analysis, individual
items were removed from the research instrument to improve the discriminant
and thus the construct validity of the research instrument, if necessary. The
procedure was repeated until all the items demonstrated acceptable levels of

-128-
discriminant validity (all the items loaded on one common factor only) and
construct validity (all the measurements of each item had factor loadings of at
least 0.35, which was considered to be significant, based on the reality of the
large sample size).
(i) Discriminant validity of brand expectation items
Exploratory factor analysis was used to assess the discriminant validity for the
brand expectation items. For brand expectations, the exploratory factor
analyses procedures were repeated several times until the most interpretable
factor solution emerged. Several solutions were considered, but the most
interpretable solution (iteration result) is the one reported in Table 6.1. The
seven factors in Table 6.1 explain 58.48% of the variance in the brand
expectation data. All items loaded to a significant extent (loadings of ≥ 0.35),
and loaded on a single factor only. Table 6.1 also shows the Cronbach reliability
coefficients, ranging from 0.805 to 0.902. Given the interpretation of the
Cronbach alphas and the alpha values empirically found, the reliability of the
research instrument can be regarded as good.
Although the eigenvalues of two of the seven factors were marginally below the
customary cut-off point of 1, both were retained because the items which
loaded on them implied an interpretable factor. Further, the result is in harmony
with opinions as reported in the literature on branding. The actual testing for the
reliability of the research instrument confirmed the good initial results obtained
from the pilot testing (see Section 5.3 of Chapter Five).
Of the 60 brand statements of the research instrument, gauging stakeholders’
expectations of the NMMU brand, only 36 items loaded on the seven factors.
The seven factors to emerge from the exploratory factor analysis were named
as follows (see also Table 6.1): Factor one: ‘Identity’ Fourteen brand identity statements were included in the research instrument.

-129-
Of these, 10 items (Table 6.1: items 39, 41, 42, 43, 44, 45, 46, 48, 49 and 50)
loaded, as expected, onto one factor only. One item (Table 6.1: item 52), which
was expected to measure brand image also loaded onto this factor. Because
the respondents interpreted this ‘image’ item as such, it was regarded as an
additional measure of the variable ‘identity’. Factor one supports the modified
conceptual model (Figure 1.2 of Chapter One).
Factor two: ‘Reputation’
Of the statements in the research instrument used to measure the variable
‘reputation’, all seven items (Table 6.1: items 1, 2, 3, 4, 5, 6 and 7) loaded onto
factor two, as expected. Factor two supports the modified conceptual model
(Figure 1.2 of Chapter One).
Factor Three: ‘Performance’
Nine statements on ‘performance’ were included in the research instrument, of
which six items (Table 6.1: items 23, 24, 25, 26, 27 and 28) loaded onto the
same factor, as expected. Factor three supports the modified conceptual model
(Figure 1.2 of Chapter One).
Factor Four: ‘Image: Academic’
The exploratory factor analysis revealed that the variable ‘image’, as measured
by the items on the research instrument, was not a uni-dimensional construct.
Table 6.1 shows these items split into two distinct sub-dimensions, namely
‘image: academic’ and ‘image: recognition’. The following emanated: of the ten
statements on brand image, three items (Table 6.1: items 57, 58 and 59) loaded
as image statements related to academic matters such as teaching and
research at the NMMU. Thus, factor four is named ‘image: academic’. Factor
four therefore does not support the modified conceptual model (Figure 1.2 of
Chapter One).

-130-
TABLE 6.1: Rotated factor matrix for brand expectations Factor 1 Factor 2 Factor 3 Factor 4 Factor 5 Factor 6 Factor 7 Item
number * Identity Reputation Performance Image: Academic
Image: Recognition Personality Relationship
39 0.444 0.043 0.030 0.024 0.038 -0.065 0.098 41 0.479 0.020 0.025 0.044 0.021 0.062 0.201 42 0.596 0.107 -0.018 0.062 0.045 -0.034 0.040 43 0.500 0.024 -0.022 0.049 0.001 0.059 0.150 44 0.538 -0.009 -0.023 0.145 0.029 0.140 0.092 45 0.752 -0.035 0.101 -0.027 -0.038 0.002 -0.003 46 0.774 -0.006 0.030 -0.063 -0.043 0.072 -0.033 48 0.475 0.000 0.039 0.021 0.134 0.057 0.089 49 0.429 0.077 0.029 0.049 0.154 0.063 0.026 50 0.585 0.084 -0.009 0.040 0.078 0.014 -0.106 52 0.437 0.059 0.067 0.096 0.058 -0.005 -0.013 1 0.018 0.629 0.016 0.026 0.007 0.064 0.018 2 0.090 0.615 0.013 0.070 -0.085 0.052 -0.050 3 0.038 0.644 -0.010 0.043 -0.011 -0.066 -0.036 4 0.005 0.758 0.059 -0.088 0.043 -0.074 0.002 5 -0.028 0.757 0.003 -0.034 0.027 0.031 0.058 6 -0.012 0.672 0.030 0.023 0.000 0.035 0.000 7 -0.024 0.658 -0.041 -0.010 0.034 0.155 0.110
23 0.023 0.134 0.575 -0.008 0.051 0.072 0.001 24 0.011 0.079 0.509 0.063 -0.025 0.080 0.063 25 0.015 -0.059 0.846 -0.049 -0.031 0.019 0.072 26 0.072 0.006 0.744 -0.018 0.035 -0.001 -0.050 27 0.017 0.105 0.406 0.239 0.062 0.034 0.002 28 -0.002 0.061 0.447 0.275 0.032 -0.017 0.042 57 0.000 0.007 0.008 0.786 0.072 0.070 0.028 58 0.066 0.012 0.047 0.669 0.069 0.073 0.009 59 0.145 0.037 0.094 0.501 0.106 -0.022 0.112 54 0.095 0.013 -0.016 0.025 0.796 0.028 -0.065 55 -0.031 -0.013 0.024 0.079 0.750 -0.008 0.089 17 0.035 0.148 0.076 0.144 -0.011 0.473 0.081 18 0.072 0.043 0.052 0.107 -0.024 0.643 0.001 19 0.142 0.063 0.062 0.006 0.114 0.542 -0.000 20 -0.026 0.044 0.211 -0.120 0.239 0.403 0.155 35 0.001 0.052 0.042 0.029 0.082 0.092 0.620 36 0.165 0.062 0.090 0.092 -0.034 -0.014 0.584 37 0.214 0.054 0.088 0.014 0.130 0.011 0.428
Variance explained
14.282 1.586 1.077 0.949 0.704 0.542 0.473
Eigenvalues 14.764 2.083 1.568 1.249 1.111 0.909 0.887 Cronbach
alpha 0.902 0.878 0.864 0.857 0.815 0.831 0.805
Total variance explained = 58.48% Loadings ≥ than 0.35 were considered significant * See Annexure B for the wording of the statements (items).

-131-
Factor Five: ‘Image: Recognition’
The items (Table 6.1: items 54 and 55) that loaded onto factor five relate to the
national and international recognition of the NMMU. Factor five only partially
supports the modified conceptual model (Figure 1.2 of Chapter One).
As a result of the factors that emerged on ‘image’ variables, the conceptual
model and some of the hypotheses had to be modified.
Factor Six: ‘Personality’
Seven statements were used to measure the variable ‘personality’. Only four
items (Table 6.1: items 17, 18, 19 and 20) loaded onto factor six, which
supported the modified conceptual model (Figure 1.2 of Chapter One).
Factor Seven: ‘Relationship’
Based on the consulted literature on branding, six ‘relationship’ statements
were included in the research instrument. Only two items (Table 6.1: items 35
and 36) loaded onto this factor. One ‘identity’ item (Table 6.1: item 37) also
loaded onto factor seven, interpreted by respondents as a ‘relationship’ item
and thus regarded as such. Factor seven supports the modified conceptual
model (Figure 1.2 of Chapter One).
Table 6.1 shows that the items expected to measure the variable ‘relevance’ in
the conceptual model did not load onto a separate factor. As these items did not
demonstrate sufficient discriminant validity and, as a result, no evidence of
construct validity, this variable had to be removed from the conceptual model
before it was subjected to further empirical assessment by means of multiple
linear regression analysis.
Annexure B contains the wording of the relevant statements (items) for each of
the seven factors on expectations, also showing the associated factor loadings,

-132-
item correlations and Cronbach alpha coefficients after the deletion of an item.
(ii) Discriminant validity of brand experience items
The same exploratory factor analysis procedures were followed for assessing
stakeholders’ brand experiences. Of the 60 statements in the research
instrument, 46 items loaded onto seven factors. The sorted rotated factor matrix
for actual experiences of the NMMU brand appears in Table 6.2. The seven
factors in Table 6.2 explain 50% of the variance in the brand experiences data.
All items loaded to a significant extent (loadings of ≥ 0.35), and loaded onto a
single factor only. Table 6.2 also shows the Cronbach alpha reliability
coefficients, ranging from 0.762 to 0.908. Given the interpretation of the
Cronbach alphas and the alpha values empirically found, the reliability of the
research instrument can be regarded as good. The factors were named as
follows:
Factor One: ‘Reputation’
All seven items (Table 6.2: items 1, 2, 3, 4, 5, 6 and 7) that were used to
measure the variable ‘reputation’ loaded onto factor one. Two items (Table 6.2:
items 8 and 11) related to ‘relevance’ were also included in factor one, being
regarded by respondents as being related to ‘reputation’. Factor one supports
the modified conceptual model (Figure 1.2 of Chapter One).
Factor Two: ‘Identity’
Of the 14 items used to measure ‘identity’, 11 items (Table 6.2: items 38, 39, 41,
42, 44, 45, 46, 47, 48, 49 and 50) loaded onto factor two, as expected. Three
‘image’ items (Table 6.2: items 51, 52 and 53) also loaded onto factor two. The
respondents thus regarded these items as additional measures of the variable
‘image’. Factor two supports the modified conceptual model (Figure 1.2 of
Chapter One).

-133-
TABLE 6.2: Rotated factor matrix for brand experiences
Loadings ≥ than 0.35 were considered significant * See Annexure C for the wording of the statements (items).
Factor 1 Factor 2 Factor 3 Factor 4 Factor 5 Factor 6 Factor 7 Item number * Reputation Identity Image:
Academic Performance Relationship Image: Recognition Personality
1 0.704 -0.013 -0.067 0.032 0.146 -0.022 -0.029 2 0.714 0.042 0.049 -0.085 -0.015 0.030 -0.052 3 0.531 0.094 0.026 -0.030 -0.025 0.045 0.050 4 0.607 0.077 -0.094 0.095 -0.063 0.068 0.039 5 0.704 -0.058 -0.006 0.024 0.111 -0.001 0.076 6 0.678 -0.019 0.020 0.109 -0.070 0.023 -0.015 7 0.641 -0.036 0.010 0.017 0.073 0.045 0.127 8 0.418 0.086 0.267 0.035 -0.016 -0.038 0.048 11 0.383 0.092 0.152 0.097 -0.007 -0.017 0.136 38 0.084 0.413 0.062 -0.037 0.149 0.044 0.042 39 0.019 0.533 -0.090 0.062 0.006 0.080 -0.113 41 0.061 0.431 -0.012 0.109 0.224 -0.018 0.031 42 0.162 0.449 0.106 -0.013 0.077 0.030 0.034 44 0.053 0.409 0.223 0.024 0.111 -0.001 0.126 45 0.016 0.614 0.083 -0.046 0.074 -0.061 0.142 46 0.069 0.551 0.000 0.008 0.054 -0.007 0.144 47 -0.043 0.454 -0.028 0.061 0.005 0.174 0.035 48 0.011 0.402 0.050 0.055 0.053 0.129 0.162 49 0.014 0.447 0.107 0.036 -0.023 0.023 0.211 50 0.124 0.476 0.206 -0.039 -0.044 0.035 0.065 51 0.087 0.429 0.232 0.021 0.013 0.085 0.064 52 0.066 0.555 0.017 0.079 -0.017 0.032 -0.083 53 0.062 0.380 0.084 0.088 0.139 0.111 -0.016 27 0.068 -0.034 0.511 0.172 0.042 0.013 0.087 28 0.032 0.043 0.400 0.245 0.005 -0.039 0.021 29 -0.006 0.082 0.539 0.019 0.021 0.007 0.011 57 0.016 -0.036 0.751 -0.020 0.032 0.134 0.047 58 0.001 0.015 0.605 0.035 0.058 0.162 0.012 59 0.082 0.167 0.432 0.060 0.124 0.150 -0.070 23 0.137 0.074 0.038 0.609 -0.052 0.009 -0.020 24 0.090 -0.009 0.141 0.430 0.020 -0.018 0.090 25 -0.092 -0.004 -0.050 0.867 0.062 0.011 0.029 26 0.058 -0.012 0.056 0.666 0.041 0.043 0.030 31 0.119 0.031 0.038 0.049 0.404 0.156 0.092 32 0.167 0.012 0.296 0.041 0.383 0.037 -0.091 33 0.103 0.178 0.164 0.136 0.423 -0.007 -0.114 34 0.022 0.234 0.141 0.171 0.384 -0.041 0.012 35 0.026 -0.021 0.004 0.073 0.578 0.098 0.182 36 0.032 0.152 0.037 0.097 0.463 0.031 0.131 37 0.064 0.190 -0.024 0.050 0.367 0.184 0.101 54 0.045 0.065 0.029 0.005 -0.040 0.786 0.011 55 0.010 -0.017 0.087 -0.008 0.049 0.700 0.035 18 0.128 0.052 0.068 0.109 0.042 0.035 0.449 19 0.145 0.079 0.072 0.112 -0.021 0.079 0.524 20 0.065 -0.052 -0.035 0.100 0.183 0.197 0.496 21 0.082 0.158 0.004 0.050 0.109 0.093 0.472
Variance explained 17.2683 1.3386 1.2388 1.0198 0.9648 0.6247 0.5457
Eigenvalues 17.7777 1.9358 1.7177 1.4864 1.3475 1.0933 0.9893 Cronbach
alpha 0.908 0.861 0.814 0.762 0.790 0.822 0.870
Total variance explained = 50.00%

-134-
Factor Three: ‘Image: Academic’
As in the case of brand expectations (Table 6.1), ‘image’ items for actual brand
experiences also loaded onto two separate factors, namely factors three and
six. Three ‘image’ items (Table 6.2: items 57, 58 and 59) loaded on factor three,
all related to academic matters, such as teaching and research at the NMMU.
This factor was then labelled as ‘image: academic’. A further three items (Table
6.2: items 27, 28 and 29) related to ‘performance’ also loaded onto factor three.
The variable ‘image: academic’ was thus measured by six items. Factor three
does not support the modified conceptual model (Figure 1.2 of Chapter One), in
the sense that the image variable, as originally modelled in the modified
conceptual framework, was a uni-dimensional construct.
Factor Four: ‘Performance’
Only four of the nine ‘performance’ items (Table 6.2: items 23, 24, 25 and 26)
loaded onto factor four. Factor four supports the modified conceptual model
(Figure 1.2 of Chapter One).
Factor Five: ‘Relationship’
The six ‘relationship’ items (Table 6.2, items 31, 32, 33, 34, 35, 36) as identified
in the research instrument loaded onto factor five. One ‘identity’ item (Table 6.2:
item 37) also loaded onto factor five, regarded by respondents as an additional
‘relationship’ measure. Factor five supports the modified conceptual model
(Figure 1.2 of Chapter One).
Factor Six: ‘Image: Recognition’
The second image factor ‘recognition’ consists of two items (Table 6.2: items 54
and 55) that relate to national and international recognition. Factor six was thus
labelled as ‘image: recognition’. Factor six does not support the modified
conceptual model (Figure 1.2 of Chapter One).

-135-
Factor Seven: ‘Personality’
Four of the seven items (Table 6.2: items 18, 19, 20 and 21) used to measure
‘personality’ loaded onto factor seven, as expected. Factor seven supports the
modified conceptual model (Figure 1.2 of Chapter One).
As in the case of expectations, the wording of the statements and additional
statistics for the seven factors on experiences are provided. The associated
factor loadings, item correlations and Cronbach alpha coefficients after the
deletion of an item are shown in Annexure C.
(iii) Findings on exploratory factor analysis of expectations and actual
experiences
The empirical factor structures as reported in Tables 6.1 and 6.2 differ to some
extent from what was expected (Figure 1.2: Modified conceptual model) and
may cast some doubt on the discriminant validity of the research instrument.
However, the reliability analyses and exploratory factor analyses ensured that
only items with empirical evidence of reliability and discriminant validity were
used in the next phase of the data analysis.
Tables 6.1 and 6.2 also show that as a result of the exploratory factor analysis,
the dependent variable (in this research, ‘brand image’) split into two separate
variables, namely ‘image: academic’ and ‘image: recognition’. Based on this
finding, the original second set of hypotheses had to be reformulated as
follows:
H2.A: There is a positive relationship between brand identity and perceived
brand ‘image: academic’ of the NMMU.
H2.B: There is a positive relationship between brand identity and perceived
brand ‘image: recognition’ of the NMMU.

-136-
6.4.2 Assessing hypothesised relationships in modified conceptual model
(i) Findings on first set of hypotheses: Effect of brand identity variables on
brand identity
Multiple linear regression analysis was performed to assess whether the
identified independent variables exerted a significant influence on brand
identity.
The multiple linear regression results are reported in Table 6.3 (for expectations)
and Table 6.4 (for actual experiences). The statistics of both tables show that
the four independent variables, namely ‘reputation’, ‘performance’, ‘personality’
and ‘relationship’ for both expectations and experiences exert a significant
(p<0.001) positive influence on the moderating variable ‘identity’. As reported in
Section 6.4.1 (iii), one of the independent variables hypothesised, ‘relevance’,
did not load onto a separate factor.
In total, the independent variables (‘reputation’, ‘performance’, ‘personality’ and
‘relationship’) explain 60.71% of the variance in the moderating variable
(‘identity’), as shown in Table 6.3 (for expectations).
TABLE 6.3: Multiple linear regression analysis (expectations): Impact of
brand identity variables on ‘Identity’
Moderating variable: Identity
Parameter Estimate (Beta coefficient) t-value Exceedance
probability Std error of
estimate
Intercept Reputation Performance Personality Relationship
15.3568 0.321 0.285 0.392 0.909
13.92 8.82 6.64 6.09
12.94
0.0001 0.0001 0.0001 0.0001 0.0001
*** *** *** ***
1.104 0.036 0.043 0.064 0.072
R2 C.V. Root MSE Identity mean 60.71% 12.11 6.9674 57.53
* = p < 0.05 ** = p < 0.01 *** = p < 0.001

-137-
Table 6.4 reveals that the modelled independent variables (‘reputation’,
‘performance’, ‘personality’ and ‘relationship’) explain 62% of the variation in
the moderating variable (‘identity’) (for actual experiences).
TABLE 6.4: Multiple linear regression analysis (experiences): Impact of
brand identity variables on ‘Identity’ Moderating variable: Identity
Parameter Estimate (Beta coefficient) t-value Exceedance
probability Std error of
estimate Intercept Reputation Performance Personality Relationship
15.9174 0.286 0.144 0.528 0.812
13.21 7.89 2.01 6.83
15.81
0.0001 0.0001 0.0001 0.0001 0.0001
*** *** *** ***
1.205 0.036 0.071 0.077 0.051
R2 C.V. Root MSE Identity mean 62.00% 14.06 9.0438 64.32
* = p < 0.05 ** = p < 0.01 *** = p < 0.001
The t-values reported in Tables 6.3 and 6.4 need to be interpreted. The higher
the t-values, the stronger the impact of the independent variables on ‘identity’.
Noteworthy is that both for expectations (Table 6.3) and actual experiences
(Table 6.4), the independent variable ‘relationship’ has the strongest impact on
‘identity’. Equally noteworthy is the t-value of ‘performance’ (t = 2.01) for
experiences (Table 6.4). This low t-value indicates the weakest relationship
between the independent variables and ‘identity’.
Testing of hypotheses:
H1.1: There is a positive relationship between the variable ‘reputation’ and
brand identity.
• Both Tables 6.3 and 6.4 report a statistically significant positive
relationship between the identity variable ‘reputation’ and brand identity
(p < 0.001) for both expectations and experiences.
• H1.1 is not rejected.
H1.2: There is a positive relationship between the variable ‘relevance’ and

-138-
brand identity.
• Brand relevance items were excluded during the exploratory factor
analysis. The items used to measure this variable did not demonstrate
acceptable levels of discriminant and construct validity.
• H1.2 is rejected.
H1.3: There is a positive relationship between the variable ‘personality’ and
brand identity.
• Tables 6.3 and 6.4 report a statistically significant positive relationship
between the identity variable ‘personality’ and brand identity for both
expectations and experiences.
• H1.3 is not rejected.
H1.4: There is a positive relationship between the variable ‘performance’ and
brand identity.
• Tables 6.3 and 6.4 report a statistically significant positive relationship
between the identity variable ‘performance’ and brand identity (p < 0.001)
for both expectations and experiences.
• H1.4 is not rejected.
H1.5: There is a positive relationship between the variable ‘relationship’ and
brand identity.
• Tables 6.3 and 6.4 report a statistically significant positive relationship
between the identity variable ‘relationship’ and brand identity (p < 0.001)
for both expectations and experiences.
• H1.5 is not rejected.
(ii) Findings on second set of hypotheses: Effect of brand identity on
perceived brand image
The findings of the exploratory factor analysis on expectations and actual
experiences revealed two distinct sub-dimensions of image factors (Tables 6.1
and 6.2). The dependent variable, as originally modelled, did not prove to be

-139-
uni-dimensional and, as reported, ‘image’ split into two sub-dimensions, namely
‘academic’ and ‘recognition’. Based on this finding, the original second set of
hypotheses was reformulated in Section 6.4.1 (iii), which is repeated here for
ease of reading.
H2.A: There is a positive relationship between brand identity and perceived
brand ‘image: academic’ of the NMMU.
H2.B: There is a positive relationship between brand identity and perceived
brand ‘image: recognition’ of the NMMU.
Two separate sets of linear regression analyses were conducted to test the
above hypotheses.
‘Image: Academic’
The statistical values for ‘image: academic’ are reproduced in Table 6.5 (for
expectations) and in Table 6.6 (for experiences).
TABLE 6.5: Linear regression analysis (expectations): Impact of brand
identity on ‘image: academic’
Dependent variable: Image: academic
Parameter Estimate (Beta coefficient) t-value Exceedance
probability Std error of
estimate
Intercept Identity
3.7722 0.2214
8.49 29.21
0.0001 0.0001
***
0.444 0.008
R2 C.V. Root MSE Image: academic mean 43.95% 16.81 2.7754 16.5092
* = p < 0.05 ** = p < 0.01 *** = p < 0.001
Table 6.5 reveals that the modelled moderating variable (‘identity’) explains
43.95% of the variation in the dependent variable ‘image: academic’.
From Table 6.6, it appears that the moderating variable (‘identity’) explains only

-140-
5.81% of the variance in the dependent variable ‘image: academic’.
It is difficult to explain the low R2 value in Table 6.6. A possible explanation may
be negative experiences by respondents with regard to academic matters. This
low R2 may also be ascribed to confounding variables that obscured the
interpretation of image variables.
TABLE 6.6: Linear regression analysis (experiences): Impact of brand
identity on ‘image: academic’ Dependent variable: Image: academic
Parameter Estimate (Beta coefficient) t-value Exceedance
probability Std error of
estimate
Intercept Identity
8.4881 0.3253
3.24 8.20
0.0012 0.0001
*** 2.619 0.040
R2 C.V. Root MSE Image: academic mean 5.81% 65.23 19.19 29.4147
* = p < 0.05 ** = p < 0.01 *** = p < 0.001
‘Image: Recognition’
The statistical values for ‘image: recognition’ are reported in Table 6.7 (for
expectations) and in Table 6.8 (for experiences).
TABLE 6.7: Linear regression analysis (expectations): Impact of brand
identity on ‘image: recognition’ Dependent variable: Image: recognition
Parameter Estimate (Beta coefficient) t-value Exceedance
probability Std error of
estimate
Intercept Identity
1.8687 0.1526
4.69 22.44
0.0001 0.0001
*** 0.398 0.007
R2 C.V. Root MSE Image: recognition mean 31.63% 23.88 2.49 10.6468

-141-
* = p < 0.05 ** = p < 0.01 *** = p < 0.001
Table 6.7 reveals that the modelled moderating variable (‘identity’) explains only
31.63% of the variation in the dependent variable ‘image: recognition’.
The moderating variable (‘identity’) explains only 33.23% of the variance in the
dependent variable ‘Image: recognition’, as shown in Table 6.8.
TABLE 6.8: Linear regression analysis (experiences): Impact of brand
identity on ‘image: recognition’
Dependent variable: Image: recognition
Parameter Estimate (Beta coefficient) t-value Exceedance
probability Std error of
estimate
Intercept Identity
0.6021 0.1305
1.63 23.27
0.1040 0.0001
*** 0.370 0.006
R2 C.V. Root MSE Image: recognition mean 33.23% 30.13 2.71 8.9972
* = p < 0.05 ** = p < 0.01 *** = p < 0.001
From Tables 6.5 and 6.6 (impact of ‘identity’ on ‘image: academic’) and Tables
6.7 and 6.8 (impact of ‘identity’ on ‘image: recognition’), the following findings
seem evident:
p < 0.001 (smaller than all the exceedance probabilities of the four tables).
This implies that a statistically significant positive relationship exists
between ‘identity’ and ‘image: academic’ at the 99.9% confidence level.
This implies that H2.A is not rejected;
A statistically significant positive relationship exists between ‘identity’ and
‘image: recognition’ at the 99.9% confidence level. This implies that H2.B is
not rejected;
Although the R2 values for Tables 6.6, 6.7 and 6.8 are low, it must be
emphasised that a positive correlation was found between the variables as
-142-
described;
The above findings require the modification of the modified conceptual
model (Figure 1.2 of Chapter One) on the strength of the empirical findings.
6.4.3 Findings: Third set of hypotheses; Pair-wise t-tests
The third set of hypotheses relates to the perceptions of stakeholders’
expectations and actual experiences of the perceived NMMU brand image.
As defined earlier, a t-test is a technique used to test the hypothesis that the
mean scores on some interval-scaled variable are significantly different for two
independent samples or groups (Blumberg et al. 2005:664; Zikmund
2003:524).
Table 6.9 reports the statistical values of the t-tests. It must be noted that no
items (statements) were deleted for the purpose of the t-tests; the motivation
was that not the same items loaded in the exploratory factor analysis for
expectations and actual experiences. An inspection of Table 6.9 reveals that all
the significant difference scores for all the items are statistically different (p <
0.0001) at the 99.99% confidence level.
The above findings require that H3.0 be rejected. Significant statistical
differences do exist between the expectations and actual experiences of the
NMMU brand. The alternative hypothesis H3.A is thus not rejected.
6.4.4 Findings: Third set of hypotheses; Mean scores and relative percentage
ratings
In the previous section, H3.A was not rejected, indicating that statistical
differences did exist in terms of ‘expectations’ and ‘actual experiences’ of the
NMMU brand. The unanswered question remains: What is the magnitude of the
“gap” between ‘expectations’ and ‘actual experiences’ with regard to the NMMU
brand?

-143-

-144-
TABLE 6.9: Results of t-tests
Statements on NMMU brand identity and brand image
Expectation mean
Experience mean Mean diff. t value Significance
1 The NMMU brand signifies trustworthiness. 5.126 4.317 -0.809 16.910 0.000
2 The NMMU brand signals legitimacy. 5.191 4.610 -0.581 14.721 0.000
3 The NMMU brand is advertised in a credible manner. 5.411 4.844 -0.567 12.840 0.000
4 The NMMU brand sends clear communication messages to stakeholders. 5.166 4.411 -0.755 15.551 0.000
5 The NMMU brand conveys a sense of reliability. 5.247 4.397 -0.850 17.636 0.000
6 The NMMU brand is communicated in an honest manner. 5.353 4.678 -0.675 15.301 0.000
7 The NMMU brand creates a high level of confidence. 5.341 4.551 -0.790 15.509 0.000
8 The NMMU brand reflects my educational needs. 5.584 4.878 -0.706 15.232 0.000
9 The NMMU brand has real meaning (relevance) for me. 5.045 4.413 -0.632 13.943 0.000
10 The NMMU brand is innovative. 5.077 4.455 -0.622 14.141 0.000
11 The NMMU brand reflects an academic value in line with stakeholders’ needs. 5.266 4.598 -0.668 15.786 0.000
12 The NMMU brand is well accepted by stakeholders. 4.979 4.299 -0.680 14.629 0.000
13 The NMMU brand is modern and up to date. 5.445 4.777 -0.668 14.452 0.000
14 The NMMU brand fulfills specific stakeholders’ needs. 5.071 4.395 -0.676 14.312 0.000
15 The NMMU brand conveys sincerity. 5.064 4.391 -0.673 15.318 0.000
16 The NMMU brand creates a degree of excitement. 4.973 4.111 -0.862 17.340 0.000
17 The NMMU brand reflects competence. 5.327 4.591 -0.736 15.792 0.000
18 The NMMU brand reflects sophistication. 5.080 4.378 -0.702 15.670 0.000
19 The NMMU brand is resilient (strong). 5.301 4.686 -0.615 13.923 0.000
20 The NMMU brand is superior to competition. 4.972 4.193 -0.779 15.758 0.000

-145-
TABLE 6.9: Results of t-tests (continued)
Statements on NMMU brand identity and brand image
Expectation mean
Experience mean Mean diff. t value Significance
21 The NMMU brand has a strong personality. 5.183 4.544 -0.639 14.442 0.000
22 The NMMU brand offers tangible academic benefits. 5.394 4.753 -0.641 14.331 0.000
23 The NMMU brand delivers on promises. 5.028 4.006 -1.022 19.016 0.000 24 The NMMU brand reflects value for money. 5.031 4.202 -0.829 15.175 0.000 25 The NMMU brand exceeds expectations in terms of promises. 4.657 3.648 -1.009 18.876 0.000
26 The NMMU brand is performing well in terms of expectations. 4.867 3.992 -0.875 16.697 0.000
27 The NMMU brand provides high quality academic programmes. 5.670 5.006 -0.664 15.116 0.000
28 The NMMU brand always delivers academic services on time. 5.329 4.423 -0.906 18.433 0.000 29 The NMMU academic staff is knowledgeable and proficient. 5.748 5.091 -0.657 14.859 0.000 30 The NMMU brand is a strategic resource of the institution. 5.295 4.747 -0.548 14.781 0.000 31 The NMMU brand is strongly preferred by stakeholders. 4.920 4.203 -0.717 15.695 0.000 32 I enjoy studying at the NMMU. 5.702 4.965 -0.737 15.232 0.000 33 The NMMU brand supports the needs of stakeholders. 5.121 4.332 -0.789 18.422 0.000 34 The NMMU brand reflects what is important to stakeholders. 5.131 4.407 -0.724 16.803 0.000
35 I prefer the NMMU brand to those of other Higher Education Institutions. 4.877 4.205 -0.672 13.791 0.000
36 The NMMU brand lets me feel part of the institution. 5.024 4.259 -0.765 15.629 0.000
37 The NMMU brand identity is strongly established in the mind of stakeholders. 4.933 4.274 -0.659 14.094 0.000
38 The NMMU brand reflects diversity of stakeholders. 5.140 4.639 -0.501 12.543 0.000
39 The NMMU brand reflects a true ‘African University’. 5.103 4.559 -0.544 11.269 0.000
40 The NMMU brand reflects a competitive advantage (‘reasons why’ stakeholders should use the brand). 5.147 4.410 -0.737 15.641 0.000

-146-
TABLE 6.9: Results of t-tests (continued)
Statements on NMMU brand identity and brand image
Expectation mean
Experience mean Mean diff. t value Significance
41 The NMMU brand reflects engagement with all stakeholders. 4.970 4.228 -0.742 16.219 0.000 42 The NMMU brand reflects the university’s vision and mission. 5.370 4.806 -0.564 13.653 0.000
43 The NMMU brand is differentiated from those of other Higher Education Institutions. 5.413 4.905 -0.508 12.871 0.000
44 The NMMU brand reflects strong values. 5.342 4.685 -0.657 15.195 0.000 45 The NMMU brand reflects a visual expression of the institution. 5.113 4.574 -0.539 12.130 0.000 46 The NMMU brand is a verbal expression of the institution. 5.023 4.445 -0.578 13.315 0.000
47 The NMMU brand reflects the university’s lingual identity (official language are Xhosa, Afrikaans and English). 4.956 4.311 -0.645 12.735 0.000
48 The NMMU brand creates high levels of awareness. 5.104 4.543 -0.561 13.490 0.000 49 The NMMU logo reflects the NMMU brand identity. 5.278 4.780 -0.498 11.506 0.000
50 The NMMU slogan (‘for tomorrow’) reflects the NMMU brand identity. 5.510 5.072 -0.438 10.712 0.000
51 The NMMU brand reflects a values-driven university. 5.247 4.582 -0.665 15.332 0.000 52 The NMMU brand reflects transformation for equity. 5.289 4.581 -0.708 16.199 0.000 53 The NMMU brand reflects a people-centred institution. 5.288 4.485 -0.803 16.746 0.000 54 The NMMU brand is nationally recognised. 5.485 4.772 -0.713 15.383 0.000 55 The NMMU brand is internationally recognised. 5.158 4.223 -0.935 17.561 0.000
56 The NMMU brand reflects the leadership qualities and vision of Nelson Mandela. 5.196 4.332 -0.864 16.975 0.000
57 The NMMU brand reflects high quality teaching. 5.602 4.892 -0.710 15.709 0.000
58 The NMMU brand reflects high quality research. 5.419 4.773 -0.646 15.753 0.000
59 The NMMU brand leads to the fulfillment of the dreams and aspirations of students. 5.483 4.667 -0.816 17.283 0.000
60 The NMMU has a strong brand image. 5.431 4.703 -0.728 15.308 0.000

-147-
Procedures for the calculation of mean scores and relative percentage ratings:
As reported earlier, altogether 60 items on the NMMU brand were included in
the research instrument. The respondents were requested to express their
perceptions of the relative importance of individual brand statements (items)
using the Likert seven-point interval scale (1 = strongly disagree to 7 = strongly
agree) for both expectations and actual experiences. The mean scores for
expectations and actual experiences are reported in Table 6.10. Panel A of
Table 6.10 shows the relative importance mean score of NMMU brand
expectations, while Panel B indicates the relative importance mean scores with
regard to the respondents’ perceptions of the actual NMMU brand experience
they had been exposed to. A further linear transformation was performed to
map mean scores derived from the Likert seven-point interval scale into relative
rating percentages, i.e. 1 = 0 per cent; …; 4 = 50 per cent; …; 7 = 100 per cent.
In order to establish the level of satisfaction, the differences between the mean
scores and relative rating percentages (Panel B minus Panel A) were
calculated, as shown in Panel C of Table 6.10.
However, the statistics indicated in Panel D (level of satisfaction) of Table 6.10
are even of greater significance in terms of interpretation than the mean scores
and relative percentage ratings of Panels A, B and C. Panel D provides insight
in terms of the level of satisfaction as perceived by stakeholders in using the
NMMU brand. To further facilitate the interpretation of the mean differences (of
Panel C) and to estimate the relative percentage rating of the level of
satisfaction, the mean scores per item of the actual experiences were divided
by the mean score for expectations. In doing so, it is possible to indicate which
items dealing with expectations were perceived as delivered. For example, if
both the expectations and actual experiences had mean scores of 2.00, the
level of satisfaction would be 100%. Alternatively, if the mean score for
expectations was 4.00 and the actual experiences mean score was 2.00, then
the level of satisfaction would be 50% only.

-148-
The most significant findings on expectations of the NMMU brand (Panel A, Table 6.10) are as follows:
All mean scores were equal or above 4.657, implying that ratings were
above 66.53%. These high ratings imply that the respondents had high
expectations about the NMMU brand.
The lowest mean score (4.657) was obtained for the statement “The NMMU
brand exceeds expectations in terms of promises” (statement 25), with a
relative rating of 66.53%.
The highest mean score (5.748) was obtained for the statement “The
NMMU academic staff is knowledgeable and proficient” (statement 29), with
a relative rating of 82.11%. This high mean score signals that respondents
expected that the academic knowledge and quality of the NMMU’s lecturers
had to be of a high standing.
“I enjoy studying at the NMMU” (statement 32) obtained a relative rating of
81.46%, which is another noteworthy finding.
The most significant findings on actual experiences of the NMMU brand (Panel B, Table 6.10) are as follows:
All mean scores were equal or below 5.091, implying relative rating
percentages of below 72.73%.
The lowest mean score (3.648) was obtained in respect of the statement:
“The NMMU brand exceeds expectations in terms of promises” (statement
25), with a relative rating of 52.11%.
The highest mean score (5.091) was obtained in respect of the statement
“The NMMU academic staff is knowledgeable and proficient” (statement 29),
with a relative rating of 72.73%.
The most significant findings on differences in perceptions of the NMMU brand (Panel C, Table 6.10) are as follows:
All mean difference scores were negative, implying that respondents were

-148-
TABLE 6.10: Relative importance of expectations and actual experiences of NMMU brand
Panel A: Expectations
Panel B: Actual experiences
Panel C: Differences in perceptions
Panel D: Level of satisfaction Statements on NMMU
brand identity and brand image Mean SD Rating% Mean SD Rating% Mean diff.
Rating% difference
Rating% Ranking
1 The NMMU brand signifies trustworthiness. 5.126 1.452 73.23 4.317 1.487 61.67 -0.809 -11.56 84.22 51 2 The NMMU brand signals legitimacy. 5.191 1.330 74.16 4.610 1.405 65.86 -0.581 -8.30 88.81 11 3 The NMMU brand is advertised in a credible manner. 5.411 1.397 77.30 4.844 1.512 69.20 -0.567 -8.10 89.52 6
4 The NMMU brand sends clear communication messages to stakeholders. 5.166 1.520 73.80 4.411 1.583 63.01 -0.755 -10.79 85.39 43
5 The NMMU brand conveys a sense of reliability. 5.247 1.428 74.96 4.397 1.529 62.81 -0.850 -12.15 83.80 52
6 The NMMU brand is communicated in an honest manner. 5.353 1.447 76.47 4.678 1.565 66.83 -0.675 -9.64 87.39 23
7 The NMMU brand creates a high level of confidence. 5.341 1.587 76.30 4.551 1.657 65.01 -0.790 -11.29 85.21 44 8 The NMMU brand reflects my educational needs. 5.584 1.469 79.77 4.878 1.586 69.69 -0.706 -10.08 87.36 24 9 The NMMU brand has real meaning (relevance) for me. 5.045 1.619 72.07 4.413 1.629 63.04 -0.632 -9.03 87.47 22 10 The NMMU brand is innovative. 5.077 1.511 72.53 4.455 1.553 63.64 -0.622 -8.89 87.75 18
11 The NMMU brand reflects an academic value in line with stakeholders’ needs. 5.266 1.412 75.23 4.598 1.491 65.69 -0.668 -9.54 87.31 27
12 The NMMU brand is well accepted by stakeholders. 4.979 1.549 71.13 4.299 1.536 61.41 -0.680 -9.72 86.34 36
13 The NMMU brand is modern and up to date. 5.445 1.500 77.79 4.777 1.684 68.24 -0.668 -9.55 87.73 19
14 The NMMU brand fulfills specific stakeholders’ needs. 5.071 1.408 72.44 4.395 1.459 62.79 -0.676 -9.65 86.67 32
15 The NMMU brand conveys sincerity. 5.064 1.409 72.34 4.391 1.432 62.73 -0.673 -9.615 86.71 31
16 The NMMU brand creates a degree of excitement. 4.973 1.683 71.04 4.111 1.695 58.73 -0.862 -12.31 82.67 56
17 The NMMU brand reflects competence. 5.327 1.435 76.10 4.591 1.557 65.59 -0.736 -10.51 86.18 38
18 The NMMU brand reflects sophistication. 5.080 1.503 72.57 4.378 1.539 62.54 -0.702 -10.03 86.18 39
19 The NMMU brand is resilient (strong). 5.301 1.476 75.73 4.686 1.566 66.94 -0.615 -8.79 88.40 14
20 The NMMU brand is superior to competition. 4.972 1.702 71.03 4.193 1.706 59.90 -0.779 -11.13 84.33 50

-149-
TABLE 6.10: Relative importance of expectations and actual experiences of NMMU brand (continued)
Panel A: Expectations
Panel B: Actual experiences
Panel C: Differences in perceptions
Panel D: Level of satisfaction Statements on NMMU
brand identity and brand image Mean SD Rating% Mean SD Rating% Mean diff.
Rating% difference
Rating% Ranking
21 The NMMU brand has a strong personality. 5.183 1.482 74.04 4.544 1.583 64.91 -0.639 -9.13 87.67 21 22 The NMMU brand offers tangible academic benefits. 5.394 1.469 77.06 4.753 1.597 67.90 -0.641 -9.16 88.12 16 23 The NMMU brand delivers on promises. 5.028 1.667 71.83 4.006 1.635 57.23 -1.022 -14.60 79.67 59 24 The NMMU brand reflects value for money. 5.031 1.698 71.87 4.202 1.734 60.03 -0.829 -11.84 83.52 53
25 The NMMU brand exceeds expectations in terms of promises. 4.657 1.666 66.53 3.648 1.580 52.11 -1.009 -14.42 78.33 60
26 The NMMU brand is performing well in terms of expectations. 4.867 1.576 69.53 3.992 1.573 57.03 -0.875 -12.50 82.02 57
27 The NMMU brand provides high quality academic programmes. 5.670 1.337 81.00 5.006 1.577 71.51 -0.664 -9.49 88.29 15
28 The NMMU brand always delivers academic services on time. 5.329 1.604 76.13 4.423 1.762 63.19 -0.906 -12.94 83.00 55
29 The NMMU academic staff is knowledgeable and proficient. 5.748 1.330 82.11 5.091 1.523 72.73 -0.657 -9.38 88.57 12
30 The NMMU brand is a strategic resource of the institution. 5.295 1.333 75.64 4.747 1.360 67.81 -0.548 -7.83 89.65 5
31 The NMMU brand is strongly preferred by stakeholders. 4.920 1.484 70.29 4.203 1.473 60.04 -0.717 -10.25 85.43 42 32 I enjoy studying at the NMMU. 5.702 1.422 81.46 4.965 1.688 70.93 -0.737 -10.53 87.07 28 33 The NMMU brand supports the needs of stakeholders. 5.121 1.351 73.16 4.332 1.370 61.89 -0.789 -11.27 84.59 49
34 The NMMU brand reflects what is important to stakeholders. 5.131 1.301 73.30 4.407 1.363 62.96 -0.724 -10.34 85.89 40
35 I prefer the NMMU brand to those of other Higher Education Institutions. 4.877 1.785 69.67 4.205 1.843 60.07 -0.672 -9.60 86.22 37
36 The NMMU brand lets me feel part of the institution. 5.024 1.640 71.77 4.259 1.726 60.84 -0.765 -10.93 84.77 48
37 The NMMU brand identity is strongly established in the mind of stakeholders. 4.933 1.437 70.47 4.274 1.464 61.06 -0.659 -9.41 86.64 33
38 The NMMU brand reflects diversity of stakeholders. 5.140 1.388 73.43 4.639 1.448 66.27 -0.501 -7.16 90.25 4
39 The NMMU brand reflects a true ‘African University’. 5.103 1.703 72.90 4.559 1.808 65.13 -0.544 -7.77 89.34 9
40 The NMMU brand reflects a competitive advantage (‘reasons why’ stakeholders should use the brand). 5.147 1.439 73.53 4.410 1.510 63.00 -0.737 -10.53 85.68 41

-150-
TABLE 6.10: Relative importance of expectations and actual experiences of NMMU brand (continued)
Panel A: Expectations
Panel B: Actual experiences
Panel C: Differences in perceptions
Panel D: Level of satisfaction Statements on NMMU
brand identity and brand image Mean SD Rating% Mean SD Rating% Mean diff.
Rating% difference
Rating% Ranking
41 The NMMU brand reflects engagement with all stakeholders.
4.970 1.375 71.00 4.228 1.445 60.40 -0.742 -10.60 85.07 46
42 The NMMU brand reflects the university’s vision and mission.
5.370 1.379 76.71 4.806 1.564 68.66 -0.564 -8.50 89.50 7
43 The NMMU brand is differentiated from those of other Higher Education Institutions. 5.413 1.378 77.33 4.905 1.535 70.07 -0.508 -7.26 90.62 2
44 The NMMU brand reflects strong values. 5.342 1.353 76.31 4.685 1.461 66.93 -0.657 -9.38 87.70 20
45 The NMMU brand reflects a visual expression of the institution.
5.113 1.381 73.04 4.574 1.475 65.34 -0.539 -7.70 89.46 8
46 The NMMU brand is a verbal expression of the institution.
5.023 1.401 71.76 4.445 1.477 63.50 -0.578 -8.26 88.49 13
47 The NMMU brand reflects the university’s lingual identity (official language are Xhosa, Afrikaans and English). 4.956 1.746 70.80 4.311 1.868 61.59 -0.645 -9.21 86.99 30
48 The NMMU brand creates high levels of awareness. 5.104 1.409 72.91 4.543 1.521 64.90 -0.561 -8.01 89.01 10 49 The NMMU logo reflects the NMMU brand identity. 5.278 1.491 75.40 4.780 1.618 68.29 -0.498 -7.11 90.56 3 50 The NMMU slogan (‘for tomorrow’) reflects the NMMU
brand identity. 5.510 1.416 78.71 5.072 1.604 72.46 -0.438 -6.25 92.05 1
51 The NMMU brand reflects a values-driven university. 5.247 1.318 74.96 4.582 1.413 65.46 -0.665 -9.50 87.33 25 52 The NMMU brand reflects transformation for equity. 5.289 1.365 75.56 4.581 1.527 65.44 -0.708 -10.12 86.61 34 53 The NMMU brand reflects a people-centred institution. 5.288 1.344 75.54 4.485 1.541 64.07 -0.803 -11.47 84.81 47 54 The NMMU brand is nationally recognised. 5.485 1.536 78.36 4.772 1.798 68.17 -0.713 -10.19 87.00 29 55 The NMMU brand is internationally recognised. 5.158 1.739 73.69 4.223 1.850 60.33 -0.935 -13.36 81.87 58 56 The NMMU brand reflects the leadership qualities and
vision of Nelson Mandela. 5.196 1.663 74.23 4.332 1.749 61.89 -0.864 -12.34 83.37 54
57 The NMMU brand reflects high quality teaching. 5.602 1.383 80.03 4.892 1.541 69.89 -0.710 -10.14 87.33 26 58 The NMMU brand reflects high quality research. 5.419 1.388 77.41 4.773 1.455 68.19 -0.646 -9.22 88.08 13
59 The NMMU brand leads to the fulfillment of the dreams and aspirations of students.
5.483 1.433 78.33 4.667 1.587 66.67 -0.816 -11.66 85.12 45
60 The NMMU has a strong brand image. 5.431 1.452 77.59 4.703 1.680 67.19 -0.728 -10.40 86.60 35

-151-
not satisfied with the NMMU brand, because their expectations were not
met.
The largest mean difference score (-1.022) was obtained in respect of the
statement that the NMMU brand delivered on promises (statement 23).
This implies a level of dissatisfaction with brand delivery.
The lowest mean difference score (-0.438) was recorded for “The NMMU
slogan (‘for tomorrow’) reflects the NMMU brand identity” (statement 50).
Panel D of Table 6.10 shows the relative satisfaction percentages. The
statistics of Panel D amplifies the findings of Panel C. The most
significant findings on actual experiences (on which the level of
satisfaction is based) of the NMMU brand are as follows:
All relative rating scores were below 92.05%. These relative satisfaction
percentages imply that respondents were not satisfied with the NMMU
brand, because their expectations were not fully met.
The highest rating percentage (92.05%) was obtained in respect of the
statement “The NMMU slogan (‘for tomorrow’) reflects the NMMU brand
identity” (statement 50).
The lowest rating percentage (78.33%) was given to the statement that “The
NMMU brand exceeds expectations in terms of promises” (statement 25).
The second lowest rating percentage (79.67%) was found for “The NMMU
brand delivers on promises” (statement 23).
Also listed under Panel D are the rankings for the level of satisfaction.
Statement 50, “The NMMU slogan (‘for tomorrow’) reflects the NMMU brand
identity” (92.05%) is ranked first, followed by statement 43, “The NMMU
brand is differentiated from those of other Higher Education Institutions”
(90.62%), followed by statement 25, “The NMMU brand exceeds
expectations in terms of promises” (78.33%).
The pair-wise t-tests have revealed statistically significant differences between
‘expectations’ and ‘actual experiences’. The findings as reflected in Table 6.10
give a better insight into the magnitude of the “gap” between the expectations

-152-
and actual experiences of using the NMMU brand.
6.5 SUMMARY AND CONCLUSIONS
The research instrument was first tested for discriminant and construct validity
by means of exploratory factor analysis. The reliability of the research
instrument was assessed by calculating Cronbach alpha reliability coefficients.
All of the above statistical procedures produced very good interpretable results.
Based on the discriminant and construct validity findings, Figure 1.2 (modified
conceptual model) had to be reconstructed. This reconstructed model was
renamed the empirical model on brand identity and brand image (Figure 6.1).
FIGURE 6.1: Empirical model on brand identity and brand image
Source: Empirical findings as reported
As explained in Section 6.4.1, the items used to measure the independent
variable ‘relevance’ did not load onto a separate factor. Further, the exploratory
factor analysis revealed two sub-dimensions of the ‘image’ statements
Gap
Independent variables
Moderating or interaction variable
Dependent variable
Reputation
Personality
Performance
Relationship
Brand identity
Image: academic
Image: recognition
Stakeholder expectations
Actual stakeholder experiences

-153-
(‘academic’ and ‘recognition’). This uni-dimensional construct of the original
conceptual model had to be reconstructed, as shown in Figure 6.1, which
required a reformulation of the relationships to be tested in the second set of
hypotheses.
The findings on the hypotheses and statistical analysis are as follows:
Multiple linear regression analyses were done to test the first set of hypotheses.
First set of hypotheses: Effect of brand identity variables on brand
identity.
H1.1: There is a positive relationship between the variable ‘reputation’
and brand identity.
• H1.1 is not rejected.
H1.2: There is a positive relationship between the variable ‘relevance’
and brand identity.
• H1.2 is rejected.
H1.3: There is a positive relationship between the variable ‘personality’
and brand identity.
• H1.3 is not rejected.
H1.4: There is a positive relationship between the variable ‘performance’
and brand identity.
• H1.4 is not rejected.
H1.5: There is a positive relationship between the variable ‘relationship’
and brand identity.
• H1.5 is not rejected.

-154-
Regression analyses were performed for the second set of hypotheses.
Second set of hypotheses: Effect of brand identity on perceived brand
image.
H2.A: There is a positive relationship between brand identity and
perceived brand ‘image: academic’ of the NMMU.
• H2.A is not rejected.
H2.B: There is a positive relationship between brand identity and
perceived brand ‘image: recognition’ of the NMMU.
• H2.B is not rejected.
Pair-wise t-tests were conducted for the inferential statistical analyses to test
the third set of hypotheses.
Third set of hypotheses: Perceptions of stakeholders of expectations
and actual experiences of the perceived NMMU brand image.
H3.0: There are no perceived differences between stakeholders’
expectations and actual stakeholders’ experiences of the NMMU brand
image.
• H3.0 is rejected.
H3.A: There are perceived differences between stakeholders’
expectations and actual stakeholders’ experiences of the NMMU brand
image.
• H3.A is not rejected.
Besides the pair-wise t-tests, further descriptive statistical analyses were also
performed to assess the magnitude of the “gap” between expectations and

-155-
actual experiences when using the NMMU brand. The findings revealed that
the NMMU stakeholders were not completely satisfied with their actual
experiences when using the NMMU brand.
________ II ________

-156-
CHAPTER SEVEN
SUMMARY, CONCLUSIONS AND RECOMMENDATIONS
7.1 INTRODUCTION In the previous chapter, the empirical findings of this study were reported and
the validity and reliability of the research instrument was discussed. The
findings of the conceptual model and hypotheses, which were subjected to
empirical testing, were also presented.
The above issues will be revisited in this chapter during an overview of the
significant findings and contributions of this research. When the conclusions
and recommendations are made, the only research objective not yet discussed
[research objective (vi)], namely to make recommendations on which
dimensions, if any, of the NMMU brand identity need to be addressed to
enhance the image of the institution, will be covered. The recommendations will
also pertain to secondary sources dealing with brand literature and guidelines
for future research.
This section will be followed by a discussion of the limitations of this research. A
section dealing with learning and reflection, as experienced by the researcher,
will conclude this chapter.
7.2 SUMMARY: HOLISTIC PERSPECTIVES AND CONTRIBUTIONS OF THIS
RESEARCH
7.2.1 Purpose of the research and research objectives
The purpose of this analytical research project was described in a twofold

-157-
manner in Section 1.2 of Chapter One; firstly, to analyse the impact of the
independent variables (reputation, relevance, personality, performance and
relationship) on brand identity (moderating variable) and the shaping of brand
image (dependent variable) by brand identity; and, secondly, to gauge the
perceptions of NMMU stakeholders of the brand image of the institution, in
terms of both expectations and actual experiences. In order to give effect to the
above, a conceptual model on branding, based on secondary sources, was
empirically tested.
The research objectives of this study were explained in Section 1.3 of Chapter
One. For expediency, the research objectives are restated below.
The primary research objective was to test the relationships as depicted in the
modified conceptual model (Figure 1.2 of Chapter One). In order to achieve this
objective, the opinions of stakeholders of the perceived brand image of the
NMMU, as shaped by the brand identity, were canvassed and discussed.
The following six secondary research objectives were identified, namely:
(i) To investigate which research paradigms, research methodologies and
data collection methods and methods of analysis would be most
appropriate to research the problem in question. This objective implied
that the appropriate overall research design for the study also had to be
determined.
(ii) To construct (design) a research instrument to canvass the opinions of
stakeholders of the perceived brand image of the NMMU, as shaped by
brand identity. This objective required an in-depth analysis of secondary
sources dealing with brand identity, brand image and related concepts.
(iii) To source primary data to gauge the opinions of stakeholders of the

-158-
perceived NMMU brand image.
(iv) To test empirically the construct and hypotheses as depicted in Figure 1.2.
(v) To analyse the data and report on possible disparities (“gaps”) between
the expectations linked to the NMMU’s brand image and the actual
experience of this brand.
(vi) To make recommendations on which dimensions, if any, of the NMMU
brand identity needed to be addressed to enhance the image of the
institution.
The research questions and hypothesised relationships will be dealt with in
Section 7.3 of this chapter.
7.2.2 Research design and methodology
Chapter Two was dedicated to the important issue of an appropriate research
design and methodology for this study. In addition, the research paradigm
adopted was also motivated. By doing this, effect was given to the first of the
secondary research objectives (Section 1.3.2 of Chapter One). The research
design and methodology was selected based on secondary sources on
research to contextualise the purpose and nature of the research.
It was also motivated in Chapter Two that the research in question carried
outstanding quantitative features; it was labelled analytical based on the
relationships to be researched, as shown in Figure 1.2 of Chapter One. The
method of reasoning was deductive and the research findings had strategic
implications, which is an important feature of applied research.
An analysis of the research problem, the unit of analysis, research questions,
hypotheses and the type of data to be sourced, collectively indicated that a

-159-
positivistic research paradigm had to be adopted. The criteria for a
well-designed research project were described, with an indication of how these
requirements would be addressed in this research.
7.2.3 Literature review
A critical phase of this research project was the analysis of secondary sources.
The purpose of the literature review was not only to provide evidence of
scholarship, but more specifically to formulate statements to be tested
empirically in the research instrument. The literature analysis also revealed
certain relationships between reputation, relevance, personality, performance
and relationship to brand identity, and also between brand identity and brand
image. The outcome of the analysis of secondary sources was therefore of a
dual nature: the design of the research instrument was achieved, and the
modified conceptual model, as shown in Figure 1.2 of Chapter One, was
constructed.
The analysis of the secondary sources enabled the researcher to give effect to
the primary research objective and the second of the secondary research
objectives (Section 1.3 of Chapter One).
7.2.4 Primary data sourcing
Chapter Five was devoted to the sourcing of primary data, giving effect to the
third set of secondary objectives. For the purpose of data sourcing, pivotal
decisions had to be taken on the measurement scales of the research
instrument. For the required inferential statistical analyses, a decision was
taken to choose a Likert seven-point interval scale. The pilot testing of the
research instrument actually constituted the first phase of the data collection

-160-
activity. The target population, sampling frames and sampling units were
identified. Suitable sampling methods used in this research were described. A
yield of 1 092 usable questionnaires was obtained, a number significantly in
excess of the minimum specified for testing the conceptual model on brand
identity and brand image.
7.2.5 Data analysis
The statistical analysis of the data consisted of six phases and related to
secondary research objectives (iv) and (v). Initially, the data was subjected to
an exploratory factor analysis to assess the discriminant validity of the
measuring instrument. Items that did not load to a significant extent (loadings ≥
0.35) or on a unique factor, were deleted. This was followed by an assessment
of the reliability of the research instrument by means of an internal consistency
measure (Cronbach alpha reliability coefficients). Only the items that remained,
were further used in the multiple regression analysis to assess the impact of
brand identity variables on brand identity. The next phase comprised a
regression analysis of brand identity on brand image. Fifthly, to assess any
differences between stakeholders’ expectations and actual experiences when
using the NMMU brand, pair-wise t-tests were performed. Finally, to gauge the
level of satisfaction of NMMU stakeholders when using the brand, a “gap”
analysis was performed by using the mean scores to find relative percentage
ratings.
7.3 OVERVIEW OF SIGNIFICANT FINDINGS
Based on the discriminant and construct validity findings, Figure 1.2 (modified
conceptual model) had to be reconstructed. This reconstructed model was
renamed the empirical model on brand identity and brand image, which is now

-161-
reproduced below as Figure 7.1 for ease of reading.
FIGURE 7.1: Empirical model on brand identity and brand image
Source: Empirical findings as reported
It was explained in Section 6.4.1 of Chapter Six that the items used to measure
the independent variable ‘relevance’ did not load onto a separate factor. Further,
the exploratory factor analysis revealed two sub-dimensions of the ‘image’
construct, namely ‘academic’ and ‘recognition’. This uni-dimensional construct
of the original conceptual model had to be reconstructed, as shown in Figure
7.1, which also required the reformulation of the relationships to be tested in the
second set of hypotheses.
Multiple linear regression analyses were performed to test the first set of
hypotheses.
First set of hypotheses: Effect of brand identity variables on brand
Gap
Independent variables
Moderating or interaction variable
Dependent variable
Reputation
Personality
Performance
Relationship
Brand identity
Image: academic
Image: recognition
Stakeholder expectations
Actual stakeholder experiences

-162-
identity.
H1.1: There is a positive relationship between the variable ‘reputation’
and brand identity.
• H1.1 is not rejected.
H1.2: There is a positive relationship between the variable ‘relevance’ and
brand identity.
• H1.2 is rejected.
H1.3: There is a positive relationship between the variable ‘personality’
and brand identity.
• H1.3 is not rejected.
H1.4: There is a positive relationship between the variable ‘performance’
and brand identity.
• H1.4 is not rejected.
H1.5: There is a positive relationship between the variable ‘relationship’
and brand identity.
• H1.5 is not rejected.
Regression analyses were performed for the second set of hypotheses.
Second set of hypotheses: Effect of brand identity on perceived brand
image.
H2.A: There is a positive relationship between brand identity and
perceived brand ‘image: academic’ of the NMMU.

-163-
• H2.A is not rejected.
H2.B: There is a positive relationship between brand identity and
perceived brand ‘image: recognition’ of the NMMU.
• H2.B is not rejected.
Pair-wise t-tests were conducted for the inferential statistical analyses to test
the third set of hypotheses.
Third set of hypotheses: Perceptions of stakeholders of expectations
and actual experiences of the perceived NMMU brand image.
H3.0: There are no perceived differences between stakeholders’
expectations and actual stakeholders’ experiences of the NMMU brand
image.
• H3.0 is rejected.
H3.A: There are perceived differences between stakeholders’
expectations and actual stakeholders’ experiences of the NMMU brand
image.
• H3.A is not rejected.
Besides the pair-wise t-tests, further descriptive statistical analyses were
performed to assess the magnitude of the “gap” between expectations and
actual experiences when using the NMMU brand. The findings revealed that
the NMMU stakeholders were not completely satisfied with their actual
experiences when using the NMMU brand.

-164-
7.4 CONCLUSIONS AND RECOMMENDATIONS
Three sets of conclusions and recommendations follow from this research,
namely the strategic implications of the findings for the NMMU marketing
communication strategists; conclusions and recommendations on secondary
sources dealing with brand literature; and, finally, recommendations for future
research.
7.4.1 Strategic implications of findings for the NMMU marketing
communication strategists
Although the primary research objective was geared towards the empirical
testing of relationships in a modified conceptual model dealing with brand
identity variables, brand identity and brand image, some of the secondary
research objectives provided ample scope for gauging perceptions of the
NMMU brand that could be reported. The last secondary research objective (vi)
specifically referred to recommendations on which dimensions, if any, of the
NMMU brand identity had to be addressed to enhance the image of the
institution.
This research objective is in line with the basic feature and purpose of research,
namely to increase knowledge and, for the research in question, knowledge of
the perceptions of stakeholders on the NMMU brand identity and brand image.
Further, in Section 2.2.4 of Chapter Two, this study was described as applied
research, which is characterized by the usage of the research findings to solve
a specific problem.
As reported when the modified conceptual model was tested, the independent
variable ‘relevance’ did not demonstrate sufficient discriminant validity and, as a

-165-
result, no evidence of construct validity. This variable had to be removed from
the conceptual model before it was subjected to further empirical assessment
by means of the multiple linear regression analysis. This finding on ‘relevance’
should be a triggering cue for NMMU marketing communication strategists to
perform an in-depth investigation on the brand variables, i.e. the items used to
test the variable ‘relevance’, should be subject to close scrutiny.
Further, the finding that the dependent variable ‘brand image’ was not a
uni-dimensional construct as suggested in the conceptual model, has further
strategic implications. Ideally, as reported in the literature on corporate branding
(Section 3.3.3 of Chapter Three), corporate (in this case, NMMU) images
should feed into strategic vision, serving as a mirror in which executive
managers can reflect on who they are. This implies that, instead of using
stakeholder images as exact assessments of brand performance compared
with strategic vision, images held by stakeholders of who the NMMU is and
what it stands for (e.g. personality and relevance comparisons) should become
part of the strategic envisioning process. From this finding, the inseparatable
linkage between the strategic intent and brand image should be evident.
The findings as presented in Section 6.4.3 of Chapter Six revealed significant
statistical differences between the expectations and actual experiences of using
the NMMU brand at the 99.99% confidence level. Further, the statistics of Table
6.10, particularly panels C and D, manifested that the actual experiences of
stakeholders using the NMMU brand were contradictory to their expectations.
Clearly, several problems related to the NMMU brand were identified which do
have strategic implications. An inspection of Table 6.10, panels C and D,
reveals that respondents were of the opinion that:
The NMMU brand does not completely meet expectations in terms of

-166-
promises (statement 25, level of satisfaction: 78.33%);
The NMMU brand does not completely deliver on promises (statement 23,
level of satisfaction: 79.67%);
The NMMU brand is not fully internationally recognised (statement 55, level
of satisfaction: 81.87%);
The NMMU brand is not performing as well as expected (statement 26, level
of satisfaction: 82.02%);
The NMMU brand does not in all respects create a degree of excitement
amongst stakeholders (statement 16, level of satisfaction: 82.67%);
The NMMU brand does not always deliver academic services on time
(statement 28, level of satisfaction: 83.00%).
Other areas of concern are linked to the following statements:
Statement 56: The NMMU brand reflects the leadership qualities and vision
of Nelson Mandela (level of satisfaction: 83.37%);
Statement 24: The NMMU brand reflects value for money (level of
satisfaction: 83.52%);
Statement 5: The NMMU brand conveys a sense of reliability (level of
satisfaction: 83.80%);
Statement 1: The NMMU brand signifies trustworthiness (level of
satisfaction: 84.22%);
Statement 20: The NMMU brand is superior to competition (level of
satisfaction: 84.33);
Statement 33: The NMMU brand supports the needs of stakeholders (level
of satisfaction: 84.59%);
Statement 36: The NMMU brand lets me feel part of the institution (level of
satisfaction: 84.77);
Statement 53: The NMMU brand reflects a people-centered institution (level

-167-
of satisfaction: 84.81%);
Statement 41: The NMMU brand reflects engagement with all stakeholders
(level of satisfaction: 85.07);
Statement 59: The NMMU brand leads to the fulfillment of the dreams and
aspirations of students (level of satisfaction: 85.12%);
Statement 7: The NMMU brand creates a high level of confidence (level of
satisfaction: 85.21%);
Statement 4: The NMMU brand sends clear communication messages to
stakeholders (level of satisfaction: 85.39%);
Statement 31: The NMMU brand is strongly preferred by stakeholders (level
of satisfaction: 85.43%);
Statement 40: The NMMU brand reflects a competitive advantage (‘reasons
why’ stakeholders should use the brand) (level of satisfaction: 85.68%);
Statement 34: The NMMU brand reflects what is important to stakeholders
(level of satisfaction: 85.89%);
The abovementioned areas of concern may also be regarded as perceived
weaknesses of the NMMU brand.
Besides the above negative perceptions highlighted, numerous positive
dimensions of the NMMU brand need to be emphasised, for example:
Statement 50: The NMMU slogan (‘for tomorrow’) reflects the NMMU brand
identity, (level of satisfaction: 92.05%);
Statement 43: The NMMU brand is differentiated from those of Higher
Education Institutions (level of satisfaction: 90.62%);
Statement 49: The NMMU logo reflects the NMMU brand identity (level of
satisfaction: 90.56%);
Statement 38: The NMMU brand reflects diversity of stakeholders (level of

-168-
satisfaction: 90.25%);
Statement 30: The NMMU brand is a strategic resource of the institution
(level of satisfaction: 89.65%).
The positive dimensions of the NMMU brand may also be viewed as strengths
associated with the brand.
It is also useful to inspect panel A (expectations) of Table 6.10 for the highest
mean scores:
Statement 29: The NMMU academic staff is knowledgeable and proficient
(mean score of 5.748);
Statement 32: I enjoy studying at the NMMU (mean score of 5.702);
Statement 27: The NMMU brand provides high quality academic
programmes (mean score of 5.670).
In concluding this section, it is recommended that NMMU marketing
communication strategists perform a comprehensive SWOT (Strengths,
Weaknesses, Opportunities and Threats) analysis to manage the brand
strategically. From this analysis, action plans can be devised and strategies
implemented to enhance the strong dimensions of the NMMU brand, to
counteract weak dimensions, to exploit opportunities that avail themselves, and
to take proactive steps to manage threats. Threats can also be turned into
opportunities by the crafting and implementation of suitable strategies.
7.4.2 Secondary sources on brand literature
Relevant conclusions and recommendations can be made with reference to
secondary sources used to generate statements for the research instrument

-169-
and to design the theoretical and modified conceptual models.
Academic textbooks representing secondary sources on brands and related
concepts usually contain normative theories on how brands should be
managed. A theory entails a systematic set of associated concepts, definitions
and statements presented to predict certain phenomena, for example, theories
that impact on brand identity, and theories on how brand image is shaped by
brand identity. These theories must be verified before they may be deemed as
part of a science and thus a component of the body of knowledge. In the brand
literature, brand image was identified as one of the most important assets of
any institution. The maintenance and enhancement of brand image was
identified as of great importance for an institution like the NMMU. This reality
requires a periodic brand image assessment.
In this research, the modified conceptual model, based on brand theories, was
subjected to empirical testing. As reported, the conceptual model had to be
reconstructed, because the relevance statements did not demonstrate sufficient
discriminant validity and, as a result, no evidence of construct validity. Further,
the image variable split into two distinct sub-dimensions, namely ‘image:
academic’ and ‘image: recognition’.
This reconstruction of the modified conceptual model does not necessarily
imply that branding theories are distorted, but at the minimum that the research
must be replicated. Should the same findings emerge, the relevance of existing
branding theories pertaining to Higher Education Institutions should be
revisited.
From the brand literature, numerous normative guidelines on branding
emerged, as highlighted in Chapters Three and Four. Of the many normative

-170-
guidelines presented in Chapters Three and Four, the following are
re-emphasised:
To build and entrench the NMMU corporate brand, stakeholder commitment
from both internal and external constituencies is vital, in contrast to product
brands, that thrive on consumer commitment only. To shape the NMMU
brand, the university staff must understand the brand’s vision and mission,
and be totally committed to delivering it. It follows that great emphasis
should be placed on effective internal communication. This reality implies
that the NMMU needs to pay attention to its culture, ethos, core values and
principles, since these encompass the values of staff and assumptions that
affect their behaviour and eventually influence other stakeholders’
perceptions. Should the above objective be achieved, the NMMU should
show progress in terms of shaping its corporate image.
In terms of the brand orientation model, the starting point in brand building is
to create a clear understanding of the internal brand identity. The brand then
becomes a strategic platform that provides the framework for the
satisfaction of customers’ needs and wants. Applied to the NMMU brand, it
should support the needs and wants of stakeholders and lead to the
fulfillment of the dreams and aspirations of its stakeholder groups.
According to brand asset management, the NMMU brand should:
• reflect an academic value in line with stakeholder needs;
• reflect value for money;
• act as a strategic resource of the institution;
• reflect the competitive advantages of the institution (‘reasons why’
stakeholders should use the brand); and

-171-
• reflect strong values and principles of the institution.
With reference to the Logman model, it should be important for the NMMU
brand to:
• be well accepted by stakeholders;
• exceed expectations in terms of promises; and
• reflect the diversity of stakeholders.
As reported in the literature, managing brand equity, in respect of both the
customer and financial perspectives, has strategic implications for the
NMMU. To manage brand equity and the dimensions thereof, namely brand
awareness, perceived quality, brand associations, brand loyalty, and brand
commitment, requires a well directed marketing communication strategy.
As indicated above, the role of effective brand communication cannot be
underestimated. A model for the NMMU brand communication process was
proposed (Figure 4.3 of Chapter Four), based on the secondary sources on
brand literature.
7.4.3 Recommendations for future research
Areas for further research on brands and branding are virtually unlimited.
Based on this research, the potential for research on brands and branding in
the following domains have been identified:
Replication of the research, focusing on other faculties, and larger samples
from alumni, staff and organised business as principal respondents;
Replication of the research in question, incorporating the environment of

-172-
Higher Educational Institutions;
Assessment of the NMMU brand image applying phenomenological
research paradigms;
Research on brand loyalty of the NMMU;
An assessment of all the variables of the brand knowledge model on brand
knowledge per se (see Figure 4.2 of Chapter Four). A reconstruction of the
dimensions of the brand knowledge model is proposed. Brand recognition,
brand recall, types of brand associations, and the favourability, strength and
uniqueness of brand associations should be reconstructed as independent
variables, with brand knowledge as the dependent variable;
Research on brand commitment, using the conversion model of Hofmeyr
and Rice (2000; 1995);
Empirical verification of the proposed NMMU brand communication model
(Figure 4.3 of Chapter Four);
Comparative research on brand awareness by respondents (national and
international) of South African Higher Education Institutions;
South African Higher Education Institutions tend to be a favourite
destination for many international students. The core question is if Higher
Education Institution brands and brand communication are decisive for
international students to decide where to study abroad.
7.5 LIMITATIONS OF RESEARCH
Although all precautions were taken to ensure the meeting of the criteria for a
good research project, like reliability, validity and generalisability, it is with the
benefit of hindsight, possible to identify some limitations to this research like the
following:
Different authors on brands and branding offer different interpretations to the

-173-
variables that impact on brand identity and associations related to brand
image. For example, the strategic intent of organisations is usually merged
with the brand identity variables. The question is if strategic intent should
not be considered as a sixth independent variable. However, leading
authors indicated a closer linkage between brand image and the strategic
intent, suggesting that findings on brand image should shape the strategic
intent (vision, mission and key values). The faulty interpretation by the
various authors is therefore a possibility;
For the purpose of this research, a conceptual diagram was constructed and
tested empirically. Some of the PERCCI respondents also wrote marginal
notes on the questionnaire, expressing their desire to be part of a focus
group to share views on the NMMU brand. Thus, instead of testing a
theoretical construct, the phenomenological research paradigm could have
provided “rich” data in a more natural location, enhancing the validity of the
findings. Methodological triangulation is another option that could have been
explored;
More innovative strategies could have been implemented to elicit a higher
response rate from alumni, staff and members of PERCCI;
It is possible to conduct further statistical analysis to gauge the differences,
if any, in the responses between the sampling frames [different campuses
and sampling units (degree versus diploma programmes)];
Table 6.10 of Chapter Six provides a wealth of information that could be
reported more extensively;
The biographical data sourced from respondents, given the theoretical
construct that was tested, was not fully exploited.
7.6 LEARNING EXPERIENCES AND REFLECTION
The recommendations for further research and the limitations of the research

-174-
as listed above are in many respects symbiotic and should be assessed
simultaneously.
The research exposed the researcher to a wide range of learning experiences
and immersion in various challenges, which required high levels of resilience.
These learning experiences can also be seen as distinct contributions and are
summarised under the same headings as the chapter titles.
Introduction and problem definition (Chapter One)
The importance of researching the brand identity and brand image for the
NMMU was identified and justified. It was a challenge for the researcher to
identify the research problem, together with a justification of the wider
relevance thereof within the NMMU context. Another learning experience was
to construct the modified conceptual model on brand identity and brand image.
This construct augmented the background of the research, to obtain a better
understanding of the research objectives, research questions and hypotheses.
Collectively, the analysis of the secondary sources and the construct of the
modified conceptual model, introduced the researcher to the utilisation of a
sophisticated analytical technique called Structural Equation Modeling. This by
itself, is seen as a contribution to the knowledge base on branding.
The Structural Equation Model enabled the researcher to specify and phrase
the research objectives, research questions and hypotheses. Care was taken to
ensure that each of the research objectives was addressed and contextualised
in respect of the NMMU brand identity and brand image. The researcher
realised that the strategic importance of the research findings for the NMMU
marketing communication specialists must be highlighted.

-175-
Research design and methodology (Chapter Two)
By using Structural Equation Modeling, the researcher realised that the
research design and methodology of this dissertation must demonstrate
thoroughness and rigour at all stages of the research process. For this reason,
a separate chapter was devoted to research design and methodology. It was
important for the researcher to explain that the adopted research paradigm and
data collection strategies met the purpose of the research and gave effect to all
the stated research objectives. This required a thorough discussion of the
research paradigms, with a comprehensive justification of the choices made.
The research design framework (Figure 2.1 of Chapter Two) is innovative and
reflects the researcher’s own construct. Bringing together all the criteria of a
sound research project, is another learning experience and contribution of this
study.
Review of secondary sources (Chapters Three and Four)
The critical review of the secondary sources presented the researcher with a
real scholarly experience in respect of brands and related concepts. The
relevance of the secondary sources was demonstrated by the compilation of
the research instrument and the introduction to Structural Equation Modeling
through the construction of the theoretical and modified conceptual models. In
this process, evidence of relevance and comprehension of the secondary
sources was demonstrated by the researcher.
Primary data sourcing (Chapter Five)
In line with the research design and methodology as proposed in Chapter Two,
the strategies for primary data sourcing were identified and described. In order

-176-
to be able to claim that the empirical results would be valid, reliable and
generalisable, the researcher realised that it was important to take a
defendable decision on the measuring scales. Therefore, an elaboration on the
measurement scales was provided, with a motivation why an interval scale was
chosen. The results of the pilot test were reported as the first phase in primary
data sourcing.
Data analysis and empirical findings (Chapter Six)
By adopting the positivistic research paradigm, the researcher came to the
early conclusion that an understanding of inferential statistics is an important
prerequisite for the successful completion of the study. It was necessary to
describe, and execute the phases of data analysis and the statistical
procedures used, as indicated in the literature. A logical presentation of
empirical findings was required, based on the data analysis. Contrary findings
were presented, which culminated in the empirical model, which is a
reconstruction of the modified conceptual model on brand identity and brand
image.
Summary, conclusions and recommendations (Chapter Seven)
In terms of the requirements for writing up the research, the researcher realised
that the summary, conclusions and recommendations had to follow logically
from the empirical findings. The identified strategic implications for the NMMU
marketing communication strategists had to be highlighted. Likewise, the
conclusions and recommendations must be based on empirical evidence.
Recommendations for future research had to be specified, as well as certain
weaknesses of the research in question.

-177-
Final remarks All the research objectives of this research as stated in Section 1.3 of Chapter
One were met. In the execution of the research objectives numerous
contributions were made as highlighted in the aforegoing sections.
All in all, an enriching learning experience was encountered by the researcher.
________ II ________

-178-
BIBLIOGRAPHY
Aaker, D. A. 2004. Leveraging the corporate brand. California Management Review,
46(3): 6-18.
Aaker, D.A. 1996a. Building strong brands. New York: Free Press.
Aaker, D.A. 1996b. Measuring brand equity across products and markets. California
Management Review, 38(3):102-118.
Aaker, D. A. & Joachimsthaler, E. 2000. Brand leadership. U.K: Free Press.
Aaker, J.L. 1997. Dimensions of brand personality. Journal of Marketing Research,
34(8): 347-356.
Ash, R. & Kindersley, D. 2004. Top 10 of everything 2005. Sunday Times, December 22.
Balmer, J.M.T. 2004, in He, H.W. & Balmer, M.T. 2004. The oneworld alliance brand: a
preliminary inquiry. Working Paper No. 04/39. West Yorkshire: Bradford School of
Management.
Balmer, J.M.T. 2001. The three virtues and seven deadly sins of corporate branding.
Journal of General Management, 27(1):1-17.
Balmer, J.M.T. 1998. Corporate identity and the advent of corporate marketing. Journal
of Marketing Management, (14):963-996.
Balmer, J.M.T. & Gray, E. 2002. Comprehending corporate brands. Working Paper No.
02/33. West Yorkshire: Bradford School of Management.

-179-
Balmer, J.M.T. & Gray, E.R. 2000. Corporate identity and corporate communications:
creating a competitive advantage. Industrial and Commercial Training, 32(7):256-261
Bernardi, R.A. 1994. Validating research results when Cronbach’s alpha is below .70: A
methodological procedure. Educational and psychological measurement,
54(3):755-766.
Blumberg, B., Cooper, D.R. & Schindler, P.S. 2005. Business research methods.
London: The McGraw-Hill Companies, Inc.
Boone, L.E. & Kurtz, D.L. 1996. Contemporary Business. 8th Edition. New York: The
Dryden Press.
Ceurvorst, R.W. 1993. Measuring consumer commitment and potential for change. In
American Marketing Association 24th Annual Attitude Research Conference. [online],
Available: http:// www. conversionmodel. com/ [ Accessed 19 May 2005].
Chandon, P. 2003. Note on measuring brand awareness, brand image, brand equity and
brand value. Insead Working Paper Series.
Chevalier, M. & Mazzalovo, G. 2004. Pro logo: brands as a factor of progress. New York:
Palgrave Macmillan.
Churchill, G.A. 1979. A paradigm for developing better measures of marketing
constructs. Journal of Marketing Research, Vol. XVI. USA.
Collis, J. & Hussey, R. 2003. Business research: A practical guide for undergraduate
and postgraduate students. 2nd Edition. London: Palgrave Macmillan.

-180-
Coop, W.F. 2005. A question of identity. Journal of Marketing, 11(1):36-37.
Coop, W.F. 2004. Brand identity as a driver of brand commitment. Unpublished doctoral
thesis, Cape Technikon, Cape Town.
Coop, W.F. 2002. Brand image of MBA business schools in South Africa as driver of
customer-based brand equity. Unpublished Master’s dissertation, Cape Technikon,
Cape Town.
Cooper, D.R. & Schindler, P.S. 2003. Business research methods. 8th Edition. New York:
The McGraw-Hill Companies, Inc.
Cooper, J.B.C. 1983. Factor analysis: An overview. American Statistician, 37(2):
141-157.
Creswell, J.W. 2003. Research design: qualitative, quantitative, and mixed methods
approaches. 2nd Edition. Thousand Oaks: Sage Publications.
Cronjé, G.D.J., Du Toit, G., Marais, M.D.C. & Motlatla, A.D.K. 2004. Introduction to
business management. 6th Edition. Cape Town: Oxford University Press.
Davis, S.M. 2000. Brand asset management: driving profitable growth through your
brand. San Francisco: Josey Bass.
Davis, S.M. & Dunn, M. 2002. Building the brand-driven business: operationalize your
brand to drive profitable growth. San Francisco: Josey Bass.
De Chernatony, L. 1999. Brand management through narrowing the gap between brand
identity and brand reputation. Journal of Marketing Management, (15):157-179.

-181-
De Chernatony L. & Riley, F.D. 1997. The chasm between managers’ and consumers’
views of brands. Journal of Strategic Marketing, (5):89-104.
De Vos, A.S., Strydom, H., Fouché, C.B. & Delport, C.S.L. 2002. Research at grass
roots: for the social sciences and human service professions. 2nd Edition. Pretoria: Van
Schaik Publishers.
Dobni, D. & Zinkhan, G.M. 1990. In search of brand image: a foundation analysis.
Advances in Consumer Research, 17(1): 110-119.
Dowling, G. 2001. Creating corporate reputation: identity, image and performance.
Oxford: Oxford University Press.
Doyle, P. 2001. Shareholder-value-based brand strategies. Brand Management, 9
(1):20-30.
Fombrun, C. & Rindova, V. 1996. Who’s tops and who decides? The social construction
of corporate reputations. Working paper, New York: Stern Business School, New York
University.
Fournier, S. 1998. Consumers and their brands: developing relationship theory in
consumer research. Journal of Consumer Research, 24(4): 343-373.
Frane, J., Jennrich, R.I., and Solomon, P.F. 1990. In Tait, M. 1996. Die invloed van
geselekteerde bestuursveranderlikes op die diensgehalte by finansiele instellings: ’n
interne bemarkingsperspektief. Unpublished doctoral thesis, University of Port Elizabeth,
Port Elizabeth.
Gombola, M.F. & Ketz, J.E. 1983. Financial ratio patterns in retail and manufacturing
organisations. Financial Management. Summer.

-182-
Green, P.E., Tull, D.S. & Albaum, G. 1988. Research for marketing decisions. 5th Edition.
Englewood Cliffs: Prentice-Hall.
Griffin, R.W. & Ebert, R.J. 1999. Business. 5th Edition. New Jersey: Prentice-Hall
International, Inc.
Hair, J.F., Anderson, R.E., Tatham, R.L. & Black, W.C. 1998. Multivariate data analysis.
5th Edition. Englewood Cliffs, New Jersey: Prentice-Hall.
Harris, F. & De Chernatony, L. 2001. Corporate branding and corporate brand
performance. European Journal of Marketing, 35(3/4): 441-456.
Hatch, M.J. & Schultz, M. 2003. Bringing the corporation into corporate branding.
European Journal of Marketing, 37(7/8):1041-1064.
He, H.W. & Balmer, M.T. 2004. The oneworld alliance brand: a preliminary inquiry. Work
Paper No. 04/39. West Yorkshire: Bradford School of Management.
Hofmeyr, J. & Rice, B. 2000. Commitment-led marketing: the key to brand profits is in
the customer’s mind. Chichester: Wiley.
Hofmeyr, J. & Rice, B. 1995. Integrating the psychological conversion model with
database information to measure and manage customer equity, The Journal of
Database Marketing. [online], vol.2, no.1. Available: http://www.conversionmodel.
com/ [Accessed 19 May 2005].
Holt, D.B. 2004. How brands become icons: the principles of cultural branding. Boston:
Harvard Business School Press.
Ind, N. 2003. Beyond branding. London: Kogan Page.

-183-
Ind, N. 1998. The company and the product: the relevance of corporate associations.
Corporate Reputation Review, 2(1):88-92. Jankowicz, A.D. 2005. Business research projects. 4th Edition. London: Thomson.
Jennrich, R.I. & Sampson, P.F. 1996. Rotation for simple loadings. Psychometrika,
(33):313-323.
Kapferer, J.N. 2004. The new strategic brand management: creating and sustaining
brand equity long term. London: Kogan Page.
Kapferer, J.N. 1997. Strategic brand management: creating and sustaining brand equity
long term. 2nd Edition. London: Kogan Page.
Kaplan, R.S. & Norton, D.P. 1996. The balanced scorecard: translating strategy into
action. Boston: Harvard Business School Press.
Keller, K.L. 2003. Strategic brand management: building, measuring, and managing
brand equity. New Jersey: Prentice-Hall.
Keller, K.L. 2001. Building customer-based brand equity. Marketing Management,
10(2):14-19.
Keller, K.L. 1993. Conceptualizing, measuring, and managing customer-based brand
equity. Journal of Marketing, 57 (1):1-22.
Kim, H.W., Kim, W.G. & An, J.A. 2003. The effect of consumer-based brand equity on
firms’ financial performance. Journal of Consumer Marketing, 20(4):335-351.
Knox, S. & David, B. 2003. The six conventions of corporate branding. European
Journal of Marketing, 37 (7/8):998-1016.

-184-
Kohil, C. & Thakor, M. 1997. Branding consumer goods: insights from theory and
practice. Journal of Consumer Marketing, 14(3):206-219.
Kotler, P. 2003. Marketing management. 11th Edition. Upper Saddle River, New Jersey:
Prentice-Hall.
Kotler, P. 2000. Marketing management. The Millennium Edition. Upper Saddle River:
Prentice-Hall.
Lancaster, G. 2005. Research methods in management. London: Elsevier
Butterworth-Heinemann.
Lassar, W., Mittal, B. & Sharma, A. 1995. Measuring customer-based brand equity.
Journal of Consumer Marketing, 12 (4):11-19.
Lee, C.F. 1985. Financial analysis and planning: Theory and application. Reading:
Addison-Wesley.
Leedy, P.D. & Ormrod, J.E. 2005. Practical research: planning and design. International
Edition. New Jersey: Pearson Prentice-Hall.
Logman, M. 2004. The LOGMAN model: a logical brand management model. Journal of
Product and Brand Management, 13(2):94-104.
Mc William 1991, in De Chernatony, L. & Riley, F.D. 1997. The Chasm between
managers’ and consumers’ views of brands. Journal of Strategic Marketing, (5): 89-104.
Mc William, G. & Dumas, A. 1997. Using metaphors in new brand design. Journal of
Marketing Management, (13):265-284.

-185-
Melewar, T.C. 2003. Determinants of the corporate identity construct: a review of the
literature. Journal of Marketing Communications, 9:195-220.
Melewar T.C. & Walker C. 2003. Global corporate brand building: guidelines and case
studies. Journal of Brand Management, 11(2):157-170. Mescon, M.H., Bovee, C.L. & Thill, J.V. 1999. Business today. 9th Edition. New Jersey:
Prentice-Hall.
Miller, D.C. & Salkind, N.J. 2002. Handbook of Research Design and Social
Mesurement. 6th Edition. Thousand Oaks: Sage Publications.
Morsing, M. 2002. Corporate branding basics. Design DK, 1(4):33-44.
Mottram, S. 1998, branding the corporation. in De Chernatony, L. 1999. Brand
management through narrowing the gap between brand identity and brand reputation.
Journal of Marketing Management, 15:157-179.
Nandan, S. 2005. An exploration of the brand identity-brand image linkage: A
communications perspective. Brand Management, 12(4):264-278.
Needle, D. 2004. Business in context: an introduction to business and its environment.
4th Edition. Italy: Thomson.
Nilson, T.H. & Surrey, N.C.L. 1998. Competitive branding: winning in the market place
with value-added brand. Chichester: John Wiley & Sons Ltd.
O’Guinn, T.C., Allen, C.T. & Semenik, R.J. 2005. Advertising and integrated brand
promotion. 4th edition. USA: Thomson South-Western.
Oliver, R.L. 1999. Whence consumer loyalty? Journal of Marketing, 63(4):33-44.

-186-
Parasuraman, A. 1991. Marketing research. 2nd Edition. Texas: Addison-Wesley.
Park, C.W., Jaworski, B.J. & MacInnis, D.J. 1986. Strategic brand concept image
management. Journal of Marketing, 50 (10):135-145.
Perry, A. & Wisnom, D. III. 2003. Before the brand: creating the unique DNA of an
enduring brand identity. New York: McGraw-Hill.
Ramlau, U.H. 2002. Branding is here to stay. Design DK, 1(4):4-7.
SAS Institute Inc. 1998. SAS/STATTM User’s Guide: Release 6.03. Gary, N.C.: AS
Institute Inc.
Schiffman, L.G. & Kanuk, L.L. 1997. Consumer behavior. 6th Edition. USA: Prentice-Hall
International, Inc.
Schoell, W.F., Dessler, G. & Reinecke, J.A. 1993. Introduction to business: opening
doors. 7th Edition. Boston: Allyn and Bacon.
Sekaran, U. 1992. Research methods for business: A skill building approach. 2nd Edition.
New York: John Wiley.
Shimp, T.A. 2003. Advertising, promotion, & supplemental aspects of integrated
marketing communications. 6th Edition. USA: Thomson South-Western.
Simon, C.J. & Sullivan, M.W. 1993. The measurement and determinants of brand equity:
a financial approach. Marketing Science, 12(Winter):28-52.
Skinner, C., Von Essen, L. & Mersam, G. 2001. Handbook of public relations. 6th Edition.
Cape Town: Oxford University Press.

-187-
Smith, S. 2003, in Clifton, R. & Simmons, J. 2003. Brands and branding. London: The
Economist Newspaper Ltd.
Top 100 global brands scoreboard. [online], Available: http://bwnt.business
week.com/brand/2005/index.asp [Accessed 23 Oct 2005].
Transformation and restructuring: a new institutional landscape for Higher Education,
Ministry of Education, 2002.
Urde, M. 2003. Core value-based corporate brand building. European Journal of
Marketing, 37(7/8):1017-1040.
Urde, M. 1999. Brand orientation: a mindset for building brands into strategic resources.
Journal of Marketing Management, (15):117-133.
Van Gelder, S. 2003. Global brand strategy: unlocking brand potential across countries,
cultures & markets. London: Kogan Page Limited.
Venter, E., Boshoff, C. & Maas, G. 2003. The influence of organisational factors on
successful succession in family business. Management Dynamics, 12(4): 2-17.
Wheeler, A. 2003. Designing brand identity: a complete guide to creating, building, and
maintaining strong brands. New Jersey: John Wiley & Sons, Inc.
Zikmund, W. G. 2003. Business research methods. 7th Edition. USA: Thomson
South-western.

-188-
ANNEXURE A
THE RESEARCH INSTRUMENT

-189-
23 September 2005 Dear NMMU student, As a Nelson Mandela Metropolitan University (NMMU) student, your views as a key stakeholder on the brand identity and brand image of the NMMU are of utmost importance. Will you kindly share your opinion and perceptions on the NMMU brand identity and brand image with us. PURPOSE OF THE SURVEY The Centre for Applied Business Management (CABM) is a research unit functioning under the auspices of the Department of Business Management at the Nelson Mandela Metropolitan University (NMMU). The CABM is currently (2005) conducting research on the brand identity and perceived brand image of the NMMU. The purpose of the research is to gauge the perceptions of NMMU stakeholders on brand image expectations and actual experiences when using the NMMU brand. Your willingness to participate in the survey could enable the marketing communication strategists to identify which strategies must be considered to enhance the NMMU brand image. The NMMU brand identity can be seen as the visual and verbal expression of the brand. It may also be seen as a unique set of NMMU brand associations that brand strategists aspire to create or maintain. The NMMU brand image is the perceptions of the brand, as reflected by the NMMU brand associations held in stakeholders’ memory. Because you are an important stakeholder of the NMMU, it is essential to source your opinions (perceptions) of the NMMU brand identity and brand image. Please complete the attached questionnaire, which has been compiled to gauge your perceptions in this regard. All information will be used for research purposes only. The confidentiality of your opinions will be respected. You are not required to identify yourself in the questionnaire. The questionnaire should not take longer than 15 - 20 minutes to complete. There are no right or wrong answers only your opinion is important! THE STRUCTURE OF THE QUESTIONNAIRE IS AS FOLLOWS: Section A of the questionnaire consists of a number of statements where you have to indicate under the first column your expectations of the NMMU brand and, under the second column, your actual experiences when using the NMMU brand. Section B of the questionnaire canvasses basic biographic data. Please send your completed questionnaire as soon as possible but before Friday 21 October 2005 to:
By email: [email protected]
By internal NMMU mail: Centre for Applied Business Management, 5th floor, Main Building, NMMU South Campus
By mail: Centre for Applied Business Management
Department of Business Management Summerstrand South Campus PO Box 77000٠Nelson Mandela Metropolitan University Port Elizabeth٠6031
THANK YOU FOR GIVING YOUR TIME TO COMPLETE THIS QUESTIONNAIRE. RESEARCH LEADERS: Dr E Venter Prof. JK Bosch

-190-
SECTION A: STAKEHOLDER PERCEPTIONS ON THE NMMU BRAND IDENTITY AND BRAND IMAGE
Instructions:
This section requires a rating (assessment) of your perceptions about the NMMU brand identity and
brand image. The newly launched NMMU brand may have established certain expectations in your
mindset. On the other hand, having used the NMMU brand, you may also have actual experiences.
Please read the statements carefully, and then indicate in the first column your expectations and, in
the second column, your actual experience when using the NMMU brand. In cases where you have
no experience of the particular statement, please place a check (√) in the ‘Not Applicable’ box.
Please indicate your response to the statements by indicating the relevant numbers in both columns
“expectations” and “actual experience”. The interpretation of the numbers is as follows: 1 = strongly disagree; 2 = disagree; 3 = somewhat disagree; 4 = neutral or no opinion; 5 = somewhat agree; 6 = agree; 7 = strongly agree.
Expectations of NMMU brand
Actual experiences of NMMU brand
STATEMENTS ON
NMMU BRAND IDENTITY
AND BRAND IMAGE
Strongly disagree
Disagree
Som
ewhat disagree
Neutral or no opinion
Som
ewhat agree
Agree
Strongly agree
Not applicable
Strongly disagree
Disagree
Som
ewhat disagree
Neutral or no opinion
Som
ewhat agree
Agree
Strongly agree
Not applicable
A 1 The NMMU brand signifies trustworthiness. 1 2 3 4 5 6 7 N/A 1 2 3 4 5 6 7 N/A
2 The NMMU brand signals legitimacy. 1 2 3 4 5 6 7 N/A 1 2 3 4 5 6 7 N/A
3 The NMMU brand is advertised in a credible manner. 1 2 3 4 5 6 7 N/A 1 2 3 4 5 6 7 N/A
4 The NMMU brand sends clear communication messages to stakeholders. 1 2 3 4 5 6 7 N/A 1 2 3 4 5 6 7 N/A
5 The NMMU brand conveys a sense of reliability. 1 2 3 4 5 6 7 N/A 1 2 3 4 5 6 7 N/A
6 The NMMU brand is communicated in an honest manner. 1 2 3 4 5 6 7 N/A 1 2 3 4 5 6 7 N/A
7 The NMMU brand creates a high level of confidence. 1 2 3 4 5 6 7 N/A 1 2 3 4 5 6 7 N/A

-191-
Expectations of NMMU brand
Actual experiences of NMMU brand
STATEMENTS ON
NMMU BRAND IDENTITY
AND BRAND IMAGE
Strongly disagree
Disagree
Som
ewhat disagree
Neutral or no opinion
Som
ewhat agree
Agree
Strongly agree
Not applicable
Strongly disagree
Disagree
Som
ewhat disagree
Neutral or no opinion
Som
ewhat agree
Agree
Strongly agree
Not applicable
B8 The NMMU brand reflects my educational needs. 1 2 3 4 5 6 7 N/A 1 2 3 4 5 6 7 N/A
9 The NMMU brand has real meaning (relevance) for me. 1 2 3 4 5 6 7 N/A 1 2 3 4 5 6 7 N/A
10 The NMMU brand is innovative. 1 2 3 4 5 6 7 N/A 1 2 3 4 5 6 7 N/A
11 The NMMU brand reflects an academic value in line with stakeholders’ needs. 1 2 3 4 5 6 7 N/A 1 2 3 4 5 6 7 N/A
12 The NMMU brand is well accepted by stakeholders. 1 2 3 4 5 6 7 N/A 1 2 3 4 5 6 7 N/A
13 The NMMU brand is modern and up to date. 1 2 3 4 5 6 7 N/A 1 2 3 4 5 6 7 N/A
14 The NMMU brand fulfills specific stakeholders’ needs. 1 2 3 4 5 6 7 N/A 1 2 3 4 5 6 7 N/A
C15 The NMMU brand conveys sincerity. 1 2 3 4 5 6 7 N/A 1 2 3 4 5 6 7 N/A
16 The NMMU brand creates a degree of excitement. 1 2 3 4 5 6 7 N/A 1 2 3 4 5 6 7 N/A
17 The NMMU brand reflects competence. 1 2 3 4 5 6 7 N/A 1 2 3 4 5 6 7 N/A
18 The NMMU brand reflects sophistication. 1 2 3 4 5 6 7 N/A 1 2 3 4 5 6 7 N/A
19 The NMMU brand is resilient (strong). 1 2 3 4 5 6 7 N/A 1 2 3 4 5 6 7 N/A
20 The NMMU brand is superior to competition. 1 2 3 4 5 6 7 N/A 1 2 3 4 5 6 7 N/A
21 The NMMU brand has a strong personality. 1 2 3 4 5 6 7 N/A 1 2 3 4 5 6 7 N/A
D 22 The NMMU brand offers tangible academic benefits. 1 2 3 4 5 6 7 N/A 1 2 3 4 5 6 7 N/A
23 The NMMU brand delivers on promises. 1 2 3 4 5 6 7 N/A 1 2 3 4 5 6 7 N/A
24 The NMMU brand reflects value for money. 1 2 3 4 5 6 7 N/A 1 2 3 4 5 6 7 N/A
25 The NMMU brand exceeds expectations in terms of promises. 1 2 3 4 5 6 7 N/A 1 2 3 4 5 6 7 N/A
26 The NMMU brand is performing well in terms of expectations. 1 2 3 4 5 6 7 N/A 1 2 3 4 5 6 7 N/A
27 The NMMU brand provides high quality academic programmes. 1 2 3 4 5 6 7 N/A 1 2 3 4 5 6 7 N/A
28 The NMMU brand always delivers academic services on time. 1 2 3 4 5 6 7 N/A 1 2 3 4 5 6 7 N/A

-192-
Expectations of NMMU brand
Actual experiences of NMMU brand
STATEMENTS ON
NMMU BRAND IDENTITY
AND BRAND IMAGE
Strongly disagree
Disagree
Som
ewhat disagree
Neutral or no opinion
Som
ewhat agree
Agree
Strongly agree
Not applicable
Strongly disagree
Disagree
Som
ewhat disagree
Neutral or no opinion
Som
ewhat agree
Agree
Strongly agree
Not applicable
29 The NMMU academic staff is knowledgeable and proficient. 1 2 3 4 5 6 7 N/A 1 2 3 4 5 6 7 N/A
30 The NMMU brand is a strategic resource of the institution. 1 2 3 4 5 6 7 N/A 1 2 3 4 5 6 7 N/A
E 31 The NMMU brand is strongly preferred by stakeholders. 1 2 3 4 5 6 7 N/A 1 2 3 4 5 6 7 N/A
32 I enjoy studying at the NMMU. 1 2 3 4 5 6 7 N/A 1 2 3 4 5 6 7 N/A
33 The NMMU brand supports the needs of stakeholders. 1 2 3 4 5 6 7 N/A 1 2 3 4 5 6 7 N/A
34 The NMMU brand reflects what is important to stakeholders. 1 2 3 4 5 6 7 N/A 1 2 3 4 5 6 7 N/A
35 I prefer the NMMU brand to those of other Higher Education Institutions. 1 2 3 4 5 6 7 N/A 1 2 3 4 5 6 7 N/A
36 The NMMU brand lets me feel part of the institution. 1 2 3 4 5 6 7 N/A 1 2 3 4 5 6 7 N/A
F 37 The NMMU brand identity is strongly established in the mind of stakeholders. 1 2 3 4 5 6 7 N/A 1 2 3 4 5 6 7 N/A
38 The NMMU brand reflects diversity of stakeholders. 1 2 3 4 5 6 7 N/A 1 2 3 4 5 6 7 N/A
39 The NMMU brand reflects a true ‘African University’. 1 2 3 4 5 6 7 N/A 1 2 3 4 5 6 7 N/A
40 The NMMU brand reflects a competitive advantage (‘reasons why’ stakeholders should use the brand).
1 2 3 4 5 6 7 N/A 1 2 3 4 5 6 7 N/A
41 The NMMU brand reflects engagement with all stakeholders. 1 2 3 4 5 6 7 N/A 1 2 3 4 5 6 7 N/A
42 The NMMU brand reflects the university’s vision and mission. 1 2 3 4 5 6 7 N/A 1 2 3 4 5 6 7 N/A
43 The NMMU brand is differentiated from those of other Higher Education Institutions. 1 2 3 4 5 6 7 N/A 1 2 3 4 5 6 7 N/A
44 The NMMU brand reflects strong values. 1 2 3 4 5 6 7 N/A 1 2 3 4 5 6 7 N/A
45 The NMMU brand reflects a visual expression of the institution. 1 2 3 4 5 6 7 N/A 1 2 3 4 5 6 7 N/A
46 The NMMU brand is a verbal expression of the institution. 1 2 3 4 5 6 7 N/A 1 2 3 4 5 6 7 N/A
47 The NMMU brand reflects the university’s lingual identity (official language are Xhosa, Afrikaans and English).
1 2 3 4 5 6 7 N/A 1 2 3 4 5 6 7 N/A
48 The NMMU brand creates high levels of awareness. 1 2 3 4 5 6 7 N/A 1 2 3 4 5 6 7 N/A
49 The NMMU logo reflects the NMMU brand identity. 1 2 3 4 5 6 7 N/A 1 2 3 4 5 6 7 N/A
50 The NMMU slogan (‘for tomorrow’) reflects the NMMU brand identity. 1 2 3 4 5 6 7 N/A 1 2 3 4 5 6 7 N/A

-193-
Section B: Biographic Information The following questions are related to biographic information. Please indicate your response by making a check (√) in the appropriate block. 1. Please indicate your gender:
Male □ Female □
2. Please indicate which stakeholder group you present:
Staff (member) of the NMMU □ Students □ Alumni □
Expectations of NMMU brand
Actual experiences of NMMU brand
STATEMENTS ON
NMMU BRAND IDENTITY
AND BRAND IMAGE
Strongly disagree
Disagree
Som
ewhat disagree
Neutral or no opinion
Som
ewhat agree
Agree
Strongly agree
Not applicable
Strongly disagree
Disagree
Som
ewhat disagree
Neutral or no opinion
Som
ewhat agree
Agree
Strongly agree
Not applicable
G51 The NMMU brand reflects a values-driven university. 1 2 3 4 5 6 7 N/A 1 2 3 4 5 6 7 N/A
52 The NMMU brand reflects transformation for equity. 1 2 3 4 5 6 7 N/A 1 2 3 4 5 6 7 N/A
53 The NMMU brand reflects a people-centred institution. 1 2 3 4 5 6 7 N/A 1 2 3 4 5 6 7 N/A
54 The NMMU brand is nationally recognised. 1 2 3 4 5 6 7 N/A 1 2 3 4 5 6 7 N/A
55 The NMMU brand is internationally recognised. 1 2 3 4 5 6 7 N/A 1 2 3 4 5 6 7 N/A
56 The NMMU brand reflects the leadership qualities and vision of Nelson Mandela. 1 2 3 4 5 6 7 N/A 1 2 3 4 5 6 7 N/A
57 The NMMU brand reflects high quality teaching. 1 2 3 4 5 6 7 N/A 1 2 3 4 5 6 7 N/A
58 The NMMU brand reflects high quality research. 1 2 3 4 5 6 7 N/A 1 2 3 4 5 6 7 N/A
59 The NMMU brand leads to the fulfillment of the dreams and aspirations of students. 1 2 3 4 5 6 7 N/A 1 2 3 4 5 6 7 N/A
60 The NMMU has a strong brand image. 1 2 3 4 5 6 7 N/A 1 2 3 4 5 6 7 N/A

-194-
Other (Please specify)_____________________
3. Please indicate on which NMMU campus the majority of your contact sessions are presented:
South Campus (ex UPE Campus) □ North Campus (ex PET Campus) □ Second Avenue Campus (ex PET Campus) □ Vista Campus □ Algoa Campus □ George Campus □ Bird Street Campus □
4. What is your current level of study, e.g. B.Com, (second year); B.Sc. (first year, etc.).
_______________________________________________________________. 5. If you were studying at a higher education institution in 2004, at which institution did you study?
Former UPE, Summerstrand Campus □ Former Vista Campus □ Former PE Technikon □ Another university □ I was in Grade 12 at school in 2004 □
Please send your completed questionnaire as soon as possible but before Friday 21 October 2005 to:
By email: [email protected]
By internal NMMU mail: Centre for Applied Business Management, 5th floor, Main Building,
NMMU South Campus
By mail: Centre for Applied Business Management Department of Business Management Summerstrand South Campus PO Box 77000٠Nelson Mandela Metropolitan University Port Elizabeth٠6031

-195-
ANNEXURE B: CRONBACH ALPHA COEFFICIENTS, CORRELATIONS AND FACTOR LOADINGS (EXPECTATIONS)
Item number
Statements on NMMU brand identity and brand image
Loading Correlation Cronbach alpha after
deletion FACTOR ONE: IDENTITY Cronbach alpha: 0.902
39 The NMMU brand reflects a true ‘African University’. 0.444 0.528 0.900
41 The NMMU brand reflects engagement with all stakeholders. 0.479 0.661 0.892
42 The NMMU brand reflects the university’s vision and mission. 0.596 0.679 0.891
43 The NMMU brand is differentiated from those of other Higher Education Institutions. 0.500 0.613 0.894
44 The NMMU brand reflects strong values. 0.538 0.710 0.889
45 The NMMU brand reflects a visual expression of the institution. 0.752 0.681 0.891
46 The NMMU brand is a verbal expression of the institution. 0.774 0.677 0.891
48 The NMMU brand creates high levels of awareness. 0.475 0.638 0.893
49 The NMMU logo reflects the NMMU brand identity. 0.429 0.637 0.893
50 The NMMU slogan (‘for tomorrow’) reflects the NMMU brand identity. 0.585 0.613 0.895
52 The NMMU brand reflects transformation for equity. 0.437 0.580 0.896
FACTOR TWO: REPUTATION Cronbach alpha: 0.878
1 The NMMU brand signifies trustworthiness. 0.629 0.665 0.860
2 The NMMU brand signals legitimacy. 0.615 0.647 0.863
3 The NMMU brand is advertised in a credible manner. 0.644 0.584 0.871
4 The NMMU brand sends clear communication messages to stakeholders.
0.758 0.676 0.859
5 The NMMU brand conveys a sense of reliability. 0.757 0.715 0.854
6 The NMMU brand is communicated in an honest manner. 0.672 0.654 0.862
7 The NMMU brand creates a high level of confidence. 0.658 0.688 0.857
FACTOR THREE: PERFORMANCE Cronbach alpha: 0.864
23 The NMMU brand delivers on promises. 0.575 0.676 0.838
24 The NMMU brand reflects value for money. 0.509 0.612 0.849
25 The NMMU brand exceeds expectations in terms of promises. 0.846 0.715 0.830
26 The NMMU brand is performing well in terms of expectations. 0.744 0.686 0.836
27 The NMMU brand provides high quality academic programmes. 0.406 0.632 0.845
28 The NMMU brand always delivers academic services on time. 0.447 0.626 0.847

-196-
ANNEXURE B: CRONBACH ALPHA COEFFICIENTS, CORRELATIONS AND FACTOR LOADINGS (EXPECTATIONS) (continued)
Item number
Statements on NMMU brand identity and brand image
Loading Correlation Cronbach alpha after
deletion FACTOR FOUR: IMAGE: ACADEMIC Cronbach alpha: 0.857
57 The NMMU brand reflects high quality teaching. 0.786 0.754 0.776
58 The NMMU brand reflects high quality research. 0.669 0.743 0.786
59 The NMMU brand leads to the fulfillment of the dreams and aspirations of students. 0.501 0.692 0.834
FACTOR FIVE: IMAGE: RECOGNITION Cronbach alpha: 0.815 54 The NMMU brand is nationally recognised. 0.796 0.687 ----
55 The NMMU brand is internationally recognised. 0.750 0.687 ----
FACTOR SIX: PERSONALITY Cronbach alpha: 0.831 17 The NMMU brand reflects competence. 0.473 0.654 0.788
18 The NMMU brand reflects sophistication. 0.643 0.669 0.781
19 The NMMU brand is resilient (strong). 0.542 0.683 0.775
20 The NMMU brand is superior to competition. 0.403 0.627 0.800
FACTOR SEVEN: RELATIONSHIP Cronbach alpha: 0.805
35 I prefer the NMMU brand to those of other Higher Education Institutions. 0.620 0.655 0.731
36 The NMMU brand lets me feel part of the institution. 0.584 0.673 0.712
37 The NMMU brand identity is strongly established in the mind of stakeholders. 0.428 0.630 0.757

-197-
ANNEXURE C: CRONBACH ALPHA COEFFICIENTS, CORRELATIONS AND FACTOR LOADINGS (ACTUAL EXPERIENCES)
Item number
Statements on NMMU brand identity and brand image
Loading Correlation Cronbach alpha after
deletion FACTOR ONE: REPUTATION Cronbach alpha: 0.861
1 The NMMU brand signifies trustworthiness. 0.704 0.655 0.840
2 The NMMU brand signals legitimacy. 0.714 0.639 0.841
3 The NMMU brand is advertised in a credible manner. 0.531 0.573 0.848
4 The NMMU brand sends clear communication messages to stakeholders. 0.607 0.619 0.843
5 The NMMU brand conveys a sense of reliability. 0.704 0.708 0.834
6 The NMMU brand is communicated in an honest manner. 0.678 0.253 0.877
7 The NMMU brand creates a high level of confidence. 0.641 0.684 0.837
8 The NMMU brand reflects my educational needs. 0.418 0.581 0.847
11 The NMMU brand reflects an academic value in line with stakeholders’ needs. 0.383 0.598 0.845
FACTOR TWO: IDENTITY Cronbach alpha: 0.908 38 The NMMU brand reflects diversity of stakeholders. 0.413 0.571 0.904
39 The NMMU brand reflects a true ‘African University’. 0.533 0.476 0.907
41 The NMMU brand reflects engagement with all stakeholders. 0.431 0.613 0.902
42 The NMMU brand reflects the university’s vision and mission. 0.449 0.648 0.901
44 The NMMU brand reflects strong values. 0.409 0.677 0.900
45 The NMMU brand reflects a visual expression of the institution. 0.614 0.665 0.900
46 The NMMU brand is a verbal expression of the institution. 0.551 0.642 0.901
47 The NMMU brand reflects the university’s lingual identity (official language are Xhosa, Afrikaans and English). 0.454 0.528 0.905
48 The NMMU brand creates high levels of awareness. 0.402 0.619 0.902
49 The NMMU logo reflects the NMMU brand identity. 0.447 0.600 0.903
50 The NMMU slogan (‘for tomorrow’) reflects the NMMU brand identity. 0.476 0.641 0.901
51 The NMMU brand reflects a values-driven university. 0.429 0.689 0.899
52 The NMMU brand reflects transformation for equity. 0.555 0.578 0.903
53 The NMMU brand reflects a people-centred institution. 0.380 0.621 0.902
FACTOR THREE: IMAGE: ACADEMIC Cronbach alpha: 0.763
27 The NMMU brand provides high quality academic programmes. 0.511 0.582 0.707
28 The NMMU brand always delivers academic services on time. 0.400 0.060 0.833
29 The NMMU academic staff is knowledgeable and proficient. 0.539 0.512 0.726
57 The NMMU brand reflects high quality teaching. 0.751 0.698 0.675
58 The NMMU brand reflects high quality research. 0.605 0.633 0.693
59 The NMMU brand leads to the fulfillment of the dreams and aspirations of students. 0.432 0.613 0.699

-198-
ANNEXURE C: CRONBACH ALPHA COEFFICIENTS, CORRELATIONS AND FACTOR LOADINGS (ACTUAL EXPERIENCES) (continued)
Item number
Statements on NMMU brand identity and brand image
Loading Correlation Cronbach alpha after
deletion FACTOR FOUR: PERFORMANCE Cronbach alpha: 0.814
23 The NMMU brand delivers on promises. 0.609 0.629 0.768
24 The NMMU brand reflects value for money. 0.430 0.537 0.811
25 The NMMU brand exceeds expectations in terms of promises. 0.867 0.670 0.734
26 The NMMU brand is performing well in terms of expectations. 0.666 0.671 0.748
FACTOR FIVE: RELATIONSHIP Cronbach alpha: 0.870 31 The NMMU brand is strongly preferred by stakeholders. 0.404 0.619 0.854
32 I enjoy studying at the NMMU. 0.383 0.606 0.856
33 The NMMU brand supports the needs of stakeholders. 0.423 0.659 0.849
34 The NMMU brand reflects what is important to stakeholders. 0.384 0.660 0.849
35 I prefer the NMMU brand to those of other Higher Education Institutions. 0.578 0.665 0.848
36 The NMMU brand lets me feel part of the institution. 0.463 0.661 0.849
37 The NMMU brand identity is strongly established in the mind of stakeholders. 0.367 0.639 0.852
FACTOR SIX: IMAGE: RECOGNITION Cronbach alpha: 0.790
54 The NMMU brand exceeds expectations in terms of promises. 0.786 0.653 ----
55 The NMMU brand is performing well in terms of expectations. 0.700 0.653 ----
FACTOR SEVEN: PERSONALITY Cronbach alpha: 0.822
18 The NMMU brand reflects sophistication. 0.449 0.597 0.798
19 The NMMU brand is resilient (strong). 0.524 0.681 0.760
20 The NMMU brand is superior to competition. 0.496 0.653 0.773
21 The NMMU brand has a strong personality. 0.472 0.651 0.773