Embed Size (px)
Citation preview

Summary At the Wind River Canopy Crane Facility insoutheastern Washington State, USA, we examined pheno-typic variation between upper- and lower-canopy branches ofold-growth Thuja plicata J. Donn ex D. Don (western red ce-dar). Lower-canopy branches were longer, sprouted fewerdaughter branches per unit stem length and were more horizon-tal than upper-canopy branches. Thuja plicata holds its foliagein fronds, and these had less projected area per unit mass, mea-sured by specific frond area, and less overlap, measured by sil-houette to projected area ratio (SPARmax), in the lower canopythan in the upper canopy. The value of SPARmax, used as an in-dicator of sun and shade foliage in needle-bearing species, didnot differ greatly between upper- and lower-canopy branches.We suggest that branching patterns, as well as frond structure,are important components of morphological plasticity inT. plicata. Our results imply that branches of old-growthT. plicata trees have a guerilla growth pattern, responding tochanges in solar irradiance in a localized manner.
Keywords: branch morphology, foliage angle, shoot silhouettearea, SPAR, STAR, western red cedar.
Introduction
Thuja plicata J. Donn ex D. Don, the only native Thuja speciesin western North America, is widespread throughout PacificNorthwest coast forests with an additional isolated interiorrange (Minore 1990, Trevor and Burton 1999). Although it iscommercially and ecologically important, its physiology andgrowth have not been researched extensively (DeBell andGartner 1997, Trevor and Burton 1999). Individuals can live800 to 2000 years and the species is present at all stages of suc-cession (Minore 1990). The ability to develop at each stage isattributed to T. plicata’s high shade tolerance (Minore 1990),which is the reason for its classification as a climax species(Minore 1990, Feller and Klinka 1998), especially at slightlydry sites (Carter and Klinka 1992). Besides its high shade tol-erance, unique characteristics of T. plicata among old-growthspecies of the Pacific Northwest include an indeterminategrowth pattern (Parker and Johnson 1987) and frond or fern-like foliage (Parker and Johnson 1987) made up of small
scale-like leaves typical of the Cupressceae family (Lauben-fels 1953).
Classification of T. plicata as a climax species leads to thequestion of how the species acclimates to the variable light en-vironment of Pacific Northwest forests (Parker 1997). Mor-phological plasticity in response to light environment has beenreported for T. plicata seedlings (Krasowski and Owens 1991,Carter and Klinka 1992, Wang et al. 1994, Khan et al. 2000)and young trees (Parker and Johnson 1987, Barclay 2001). Re-sponses to shading include increased height to caliper ratio, in-creased leaf area index (Wang et al. 1994), decreased terminalgrowth of the main axis relative to lateral growth (Parker andJohnson 1987), decreased shoot to root mass, decreased drymass (Khan et al. 2000) and more horizontal leaf angles(Barclay 2001). In each of these studies, the degree of responserelative to other conifer species was attributed to T. plicata’sdesignation as a shade-tolerant species. However, except inBarclay’s (2001) study, morphological plasticity in T. plicatawas measured only in seedlings and young trees. It is possiblethat T. plicata, like Pseudotsuga menziesii (Mirb.) Franco var.menziesii (Ishii and Ford 2002), exhibits variation in these re-sponses with age. Also, possible plasticity throughout thecrowns of large trees has not been considered.
Studies of old-growth needle-bearing conifer species haveshown morphological plasticity with respect to light environ-ment in individual trees (Carter and Smith 1985, Leverenz andHinckley 1990, Sprugel et al. 1996, Stenberg et al. 1998,1999). Examples of needle morphological plasticity in a singletree include increased needle length, decreased needle thick-ness (Abies amabilis Dougl. ex Forbes, Sprugel et al. 1996),decreased needle width, increased specific needle area (Piceasitchensis (Bong.) Carr., Ford 1982; Picea abies (L.) Karst.,Stenberg et al. 1999; Pseudotsuga menziesii, Ishii et al. 2002)and increased silhouette area to needle area (Piceaengelmannii Parry ex Engelm., Abies lasiocarpa (Hook.) Nutt.and Pinus contorta Engelm., Carter and Smith 1985; Piceaabies, Stenberg et al. 1999) in needles grown in shade com-pared to needles grown in sun. The silhouette to area ratio is re-ferred to as STAR or SPAR, depending on whether totalfoliage surface area or projected area is taken as the denomina-tor, respectively (Stenberg 1998). A higher value of STAR, as
TREE PHYSIOLOGY ONLINE at http://heronpublishing.com
Tree Physiology 23, 649–662© 2003 Heron Publishing—Victoria, Canada
Branch and foliage morphological plasticity in old-growth Thujaplicata
ZOE R. EDELSTEIN1 and E. DAVID FORD1,2
1 College of Forest Resources, Box 352100, University of Washington, Seattle, WA 98195-2100, USA2 Author to whom correspondence should be addressed ([email protected])
Received June 27, 2002; accepted December 30, 2002; published online June 2, 2003
at Oxford Journals on Septem
ber 6, 2013http://treephys.oxfordjournals.org/
Dow
nloaded from

found in shade needles, can indicate less needle overlap and isassociated with reduced needle packing (Carter and Smith1985). There is debate as to whether needle structure is solelyadaptated to light capture or additionally reflects adaptation tothe severity of winter weather (Sprugel 1989, Smith andBrewer 1994). Studies have shown that artificial shading caninduce some of the morphological and physiological changesassociated with shade foliage (Abies amabilis, Brooks et al.1994). Based on these studies of foliage structure, measure-ments of forest productivity (Leverenz and Hinckley 1990)and studies of needle biochemistry, Leverenz (1996) hypothe-sized that needle architectural variation, as estimated bySTAR, is more important than variation in leaf biochemistry indetermining variation in growth and productivity among spe-cies. Leverenz emphasized the relative importance of architec-tural variation even though studies had found definiteacclimation responses in needle biochemistry (Leverenz andJarvis 1979, Brooks et al. 1994).
The unique foliage and bifurcating branch structure ofT. plicata suggest that several characteristics may be subject tomorphological plasticity in response to variation in solarirradiance. The most consistent morphological plastic re-sponses of plants to low light availability predicted by the for-aging model (Hutching and de Kroon 1994) are internodeelongation and reduced branching. Because internode elonga-tion generally takes place without a corresponding increase infoliage mass, the prediction of the foraging model is similar tothat of the cost-benefit model used in Stenberg et al.’s (1999)analysis of needle structure acclimation. The cost-benefitmodel predicts that shade foliage limits its tissue mass relativeto leaf area. Otherwise the cost of tissue would outweigh itsbenefit in a sunfleck light environment. Thus, the foragingmodel can be used to predict branching patterns and the cost-benefit model to predict foliage morphology.
To determine whether there was morphological plasticity inresponse to light environment in old-growth T. plicata, we di-vided our study into two parts: analysis of branching patternsand analysis of foliage structure. We predicted that responseswould be evident in both parts of the study, perhaps followingthe predictions of the foraging and cost-benefit models. Tostudy branching patterns, we measured lengths, intervals be-tween branches, foliage abundance and accumulation inbranches of multiple orders. We predicted that these measure-ments would follow the predictions of the foraging model insome combination, resulting in a relatively higher concentra-tion of foliage in favorable light conditions. We also measuredbranch angles and presence of epicormic branches as thesequantities can also indicate foraging. Branch angles in youngT. plicata are more horizontal in low light conditions (Barclay2001) and as Sprugel et al. (1991) and studies of asymmetricalcanopy structure (Umeki 1997, Brission 2001) emphasize, for-aging in large trees occurs in three dimensions. Epicormicbranches are a reiterative structure in some trees (Pseudotsugamenziesii, Ishii and Ford 2001), implying that the ability toproduce them is an opportunistic characteristic (Hallé et al.1978).
To examine foliage structure, we measured specific frondarea (SFA) and silhouette to projected area ratio (SPAR). Wepredicted that these measurements would be similar to thosefor needle-bearing conifers, with both measurements increas-ing in the lower, more shaded, section of the canopy.
Materials and methods
Basic structure of T. plicata
Thuja plicata has a bifurcating branch system with multipleorders (Figures 1a and 1b). New branches are formed one at atime, on alternating sides of each terminal bud. A series ofbranches of more or less equal length is produced rather thanwhorls of branches as in other coniferous species (Parker andJohnson 1987). Branches would occur in a single plane were itnot for the bending and twisting that occurs during growth(Parker and Johnson 1987). The over-wintering bud does notcontain fully preformed shoots. At each order, there is somephotosynthetic tissue, and in a centrifugal ordering system, thelower orders (i.e., closest to the main stem axis) have the leastphotosynthetic tissue (Briand et al. 1992). The photosynthetictissue consists of small scale-like leaves (Minore 1990). Thesefall into Laubenfels’s (1953) Type III grouping, whereCupressaceae is further classified as having flattened lateralleaves in the mature branches that differ from facial leaves.Thuja plicata’s leaves are cupressoid scale leaves with theadaxial surface predominantly adpressed to the shoot. Leavesare in pairs at right angles to each other and stem leaves areusually in whorls of four leaves and occasionally in whorls ofthree leaves (Trevor and Burton 1999). This structure makes itpotentially inaccurate to determine age without destructivesampling, especially when examining individuals in a singleseason as was done in this study. It also makes it potentially in-accurate to use branching order to measure age.
Our objective was to compare functionally equivalent termi-nal ends of main branches in three contexts: within the uppercanopy, within the lower canopy and between these two sec-tions of the canopy. Therefore, we developed a branch nomen-clature (Figures 1a and 1b) similar to the centrifugal orderingsystem used by Briand et al. (1992) for Thuja occidentalis L.Unlike the young trees studied by Briand et al. (1992), how-ever, old-growth T. plicata has large terminal branches in thelower canopy that can be anywhere from two to six ordersaway from the trunk. Accordingly, the branch typing used inthis study was centrifugal but with a lateral branch, or mainaxis, as Branch Type I instead of the trunk used by Briand et al.(1992). For upper-canopy branches, Branch Type I was alwaysthe lateral branch extending from the bole. For lower-canopybranches, Branch Type I was two or three orders away from thebole but always the lowest-order branch associated with a ter-minal end.
An alternative branch nomenclature is provided by theStahler method, in which orders are numbered in the directionof the bole instead of away from it, so the lateral branches havesimilar orders. In our study, this method would have led tocomparisons within the canopy positions between branches
650 EDELSTEIN AND FORD
TREE PHYSIOLOGY VOLUME 23, 2003
at Oxford Journals on Septem
ber 6, 2013http://treephys.oxfordjournals.org/
Dow
nloaded from

that were not functional equivalents. This is because, as timepasses, a given shoot of T. plicata accumulates additional or-ders of branching. However, at any given age of the originalshoot, it appears that the newest shoots are at the highest or-ders. Therefore, when examining a large set of branches,counting backward from the most terminal branch wouldmean that a main axis would be assigned a different order de-pending on the shoot from which one started (Figure 1a).
With our nomenclature, Branch Types I to V are similar toBriand et al.’s (1992) orders II to VI. Green foliage is foundmainly on Branch Types III to V, with a substantial amount onBranch Type II and a small amount at the tip of Branch Type I.The nomenclature does not imply an exact foliage status nordoes it predict size, although all the individual Branch Type IIstended to be smaller than the Branch Type Is from which theybranched and Type IIIs were smaller than Type IIs, and soforth.
Study site
The study was conducted at the Thorton T. Munger ResearchNatural Area of the Wind River Experimental Forest inGifford Pinchot National Forest, an old-growth forest in south-western Washington State (45°49′ N, 121°57′ W; altitude355 m). The stand is about 500 years old and has experiencedlittle human disturbance (Franklin and DeBell 1988). Itis dominated by Pseudotsuga menziesii var. menziesii(Douglas-fir) and Tsuga heterophylla (Raf.) Sarg. (westernhemlock) in terms of basal area. Thuja plicata, Abies amabilis(Pacific silver fir) and Taxus brevifolia Nutt. (Pacific yew) arealso abundant (Franklin and DeBell 1988). The old-growthtrees at the site were accessed with an 87-m tall Biebherr con-struction crane operated by the Wind River Canopy Crane Re-search Facility (WRCCRF).
Sampling
We chose three old-growth T. plicata trees of similar height(mean height 47.4 m) with abundant new and 1-year-oldcones. Measurements were made mainly between mid-Julyand mid-August 2000, and in summer 2001. On each tree, weexamined six Branch Type Is, three from the upper canopy
(2.6–3.1 m from the tree top) and three from the lower canopy(19.5–32.1 m from the tree top) (Table 1). All upper-canopybranches were in the estimated bright zone of the crane circledetermined by Parker (1997) based on photosynthetically ac-tive radiation and UV-B. Access to lower-canopy brancheswas restricted to those on the outer parts of the crowns. One ofthe lower-canopy branches in Tree 1 was located in whatParker (1997) designated the dim zone, whereas the rest of thelower-canopy branches were in Parker’s estimated transitionzone. Radiation at different wavelengths was measured at eachsampled branch, as discussed below.
Nondestructive sampling was limited by crane time. Six to10 Branch Type IIs were measured on the 18 selected BranchType Is. The first Branch Type II measured was Number 14from the tip of the Branch Type I and then every third branch inthe direction of the tip was examined with substitutions made
TREE PHYSIOLOGY ONLINE at http://heronpublishing.com
MORPHOLOGICAL PLASTICITY IN THUJA PLICATA 651
Figure 1. Thuja plicata’sbranching structure. BranchTypes in T. plicata were or-dered centrifugally, withBranch Type I representing alateral branch main axis. Thelabels in (a) the illustration(not drawn to scale) and (b)the photograph are positionedat the branching points of eachof the branch types.
Table 1. Branch Type I locations. The three study trees were of similarheight (mean height 47.4 m) and on each tree, we studied six BranchType Is. Branch heights are approximations based on the canopycrane’s location at the branch and are accurate to within 1 m. The dis-tances from treetops are based on tree heights gathered by theWRCCRF.
Tree number Branch Canopy Height Distancenumber position (m) from
treetop(m)
1 (Thuja 137) 1–3 Upper 45.7 2.81 Lower 21.5 27.02 Lower 16.4 32.13 Lower 11.8 26.7
2 (Thuja 3096) 1–3 Upper 42.9 2.61 Lower 20.1 25.42 Lower 20.1 25.43 Lower 15.7 29.8
3 (Thuja 3228) 1–3 Upper 45.2 3.11 Lower 26.5 21.82 Lower 27.5 20.83 Lower 28.8 19.5
at Oxford Journals on Septem
ber 6, 2013http://treephys.oxfordjournals.org/
Dow
nloaded from

for damaged branches. A total of 64 upper-canopy BranchType IIs and 53 lower-canopy Branch Type IIs were measured.The Thorton T. Munger Natural Research Area restricts theamount of material that may be sampled destructively. To en-sure that we had enough foliage for analysis, we excised fiveupper-canopy and four lower-canopy Branch Type IIs of simi-lar length (mean length 34.5 ± 1.9 cm), rather than similarlynumbered from the tip. On each clipped Branch Type II, allBranch Type IIIs were measured with the destructive andnondestructive protocols described below. Additionally, onone clipped Branch Type II from the upper canopy and onefrom the lower canopy, we examined one and three BranchType IIIs, respectively, measuring all the Branch Type IVs toexplore the possibility of preserved patterns throughout the or-ders of branching.
Nondestructive measurements
On each Branch Type II sampled, we measured distances be-tween attachment points and lengths of all Branch Type IIIs.We measured angles to the horizon of each Branch Type II,and to account for branch curvature (noted by Barclay 2001),we took three measurements: one at the point of connection tothe Branch Type I, one at the estimated midpoint, and one atthe tip. The angle measurement protocol was repeated in sum-mer 2001 for Branch Type IIIs on Branch Type IIs on one up-per-canopy and one lower-canopy Branch Type I per tree.Each branch was chosen at random from those already mea-sured at that station and four to six Branch Type IIs were mea-sured on each Branch Type I. Additional observations onBranch Type IIs included amount of deviation from the alter-nating pattern of branch development, as well as presence ofcones and epicormics. Epicormics are shoots that originatefrom dormant preventitious buds and secondary daughter budsthat proliferate from them (Kozlowski 1971, Ishii and Ford2001). For the nondestructive measurement sample set foreach branch type, we compared branches that were similarlynumbered from the tip of the previous order.
Destructive measurements
Silhouette to projected area ratio (SPAR) and specific frondarea (SFA) were measured for all Branch Type IIIs. Silhou-ettes were measured with a Cohu solid-state camera with aNikon 28-mm lens and analyzed with the Optimus 3.01 imageanalysis system. The middle of the Branch Type II was pinnedto a rotator and silhouette area was measured starting at 0° tothe camera and then in increments of 30° (cf. Stenberg et al.1998). Unlike the procedure used by Stenberg et al. (1998),our measurement at 0° was taken when the shoot was parallelto the direction of view (camera) with the tip pointed towardthe lens. At 90° the branch axis was perpendicular to the direc-tion of view, and at 180° the branch axis was again parallel tothe direction of view, but now with the point of connectionpointed toward the lens.
The measurement at 90°, SPAR90, was used as the maximumvalue for the rotator measurements. The value of SPAR90 wassimilar to the maximum values reported in other studies (e.g.,Stenberg et al. 1999). In our study, SPARmax was calculated
with an additional measure of silhouette area where theBranch Type II was placed on a flat surface without flattening(cf. plane of the leaf; Barclay 2001). We used this silhouettemeasurement because of the flatness of the frond and the flop-piness of the branches pinned to the rotator.
Projected frond area was measured with the camera and im-age analysis system used to determine SPAR. To determine fo-liage area, the upper side of a planar frond’s surface area wasmeasured as described by Ishii et al. (2002) (cf. Leverenz andHinckley 1990). Foliage was weighed after drying to constantmass at 70 °C. The results from the destructive sample set werecompared on the basis of branches of similar length (meanlength 34.5 ± 1.9 cm). That is, the excised upper-canopyBranch Type IIs were farther away from the tip of BranchType I than the lower-canopy Branch Type IIs (see the sectionSampling above).
Light measurements
Our objective was to estimate differences between sampledbranches in the quantity of visible radiation intercepted and itsred/far red ratio, both of which affect morphology (Gilbert et.2001). Radiation at 400, 500, 600, 660 and 730 nm was mea-sured with an LI-1800 (Li-Cor, Lincoln, NE). First, measure-ments were made above each tree by cycling through thewavelengths for three replicates. Then measurements weremade at the three sample branches at one canopy position onone tree, again cycling through the wavelengths three times foreach branch. Above-tree measurements were repeated, fol-lowed by measurements at another branch in a different treeand canopy position. Measurements above trees were used tocalculate changes in the diurnal radiation pattern. Reductionratios (branch irradiation/above-canopy irradiation) for thesample branches were calculated based on a time-correctedmean for above-canopy radiation. Red/far red ratios were cal-culated by comparing the 660 nm measurements to the 730 nmmeasurements at each of the branches and reduction ratioswere calculated in the same manner for these comparisons.
Data analysis
In general, mean values between upper- and lower-canopymeasurements were compared by paired t-tests (n = 3; P-value = Pt). However, because the power may be low for an ef-fective test, we also performed an unpaired test in which all thedata were analyzed as replicates (n ≈ 100–2000 depending onbranch type; P-value = Pf). In cases where there was a possibil-ity of between-tree differences at both canopy positions, ananalysis of variance (ANOVA; P-value = P) was used to deter-mine whether there was a within-canopy-position tree effect inaddition to a possible canopy position effect; i.e., upper can-opy versus lower canopy.
Results
Branching patterns
Branch Type II lengths Branch Type IIs were longer in thelower canopy than in the upper canopy (Table 2a). There was
652 EDELSTEIN AND FORD
TREE PHYSIOLOGY VOLUME 23, 2003
at Oxford Journals on Septem
ber 6, 2013http://treephys.oxfordjournals.org/
Dow
nloaded from

no significant within-canopy-position tree effect (upper can-opy and lower canopy P > 0.10). In the lower and upper canopy,length of Branch Type IIs increased linearly with number fromthe tip of Branch Type I (Figures 2a and 3). Thus, foliatedshoots extended at a constant rate relative to each other and therate was greater in the lower canopy than in the upper canopy(Figure 2a).
Branch Type II foliage abundance and foliage accumulation
Upper-canopy Branch Type IIs had more Branch Type IIIbranches per unit length, i.e., greater foliage abundance, thanlower-canopy Branch Type IIs (Table 2b). In addition, ANOVArevealed a significant within-canopy-position tree effect forboth the lower-canopy and upper-canopy Branch IIs (uppercanopy P < 0.001; lower canopy P < 0.006) for foliage abun-dance.
For Branch Type IIs, the relationship between length andamount of Type III branches that they supported was linear(Figure 2b). Furthermore, the slope of the relationship was
greater in the upper canopy than in the lower canopy. Linearitywas preserved when length on the x-axis was replaced byamount of Branch Type II from the tip of its parent Type I.However, there was no significant difference in these slopes,called foliage accumulation slopes, between the upper andlower canopy (Figure 2c) for the destructively sampled dataset. Nonetheless, examination of the foliage accumulationslopes of the 18 Branch Type IIs indicated that the slopetended to be greater in the lower canopy than in the upper can-opy, as seen in the significant difference between the meanfoliage accumulation slopes (Table 2c).
Branch Type II angles Upper-canopy Branch Type IIs hadsignificantly greater angles (mean angle 123.8°) from the verti-cal than lower-canopy Branch Type IIs (mean angle 114.0°)when measurements at the node, midpoint and tip were aver-aged (Table 3). There were similar differences (upper > lower)for measurements at points along the branch (Table 3), exceptfor measurements at the node (Table 3). This indicates that,
TREE PHYSIOLOGY ONLINE at http://heronpublishing.com
MORPHOLOGICAL PLASTICITY IN THUJA PLICATA 653
Table 2. Upper- and lower-canopy means and associated statistics for each characteristic studied. The intervals are 95% confidence intervals. Thefourth column contains P-values for an unpaired t-test with individual branches as replicates; numbers in parenthesis are the degrees of freedom(df). The last column contains paired t-test results with mean tree values as replicates (n = 3, because the test pairs the upper- and lower-canopy re-sults on each of the three trees). Significant values (P < 0.05) are in bold.
Characteristic Upper mean Lower mean Pf (df) Pt (n = 3)
a. Branch Type II lengths (cm) 23.07 ± 2.22 61.01 ± 10.25 < 0.001 (100) 0.013
b. Branch Type II foliage abundance 0.814 ± 0.064 0.402 ± 0.031 < 0.001 (100) 0.066(amount of IIIs/length of II (cm))
c. Branch Type II foliage accumulation 2.19 ± 0.251 3.18 ± 0.650 0.026 (14) 0.091regression slopes
d. Branch Type III lengths 6.38 ± 0.248 14.23 ± 0.62 < 0.001 (2075) 0.002(from Branch Type IIs of similar numbers) (cm)
e. Branch Type IIIs lengths 11.91 ± 1.39 12.36 ± 1.53 0.679 (121) 0.145
f. Branch Type III intervals 1.44 ± 0.12 3.22 ± 0.18 < 0.001 (2203) < 0.001(from Branch Type IIs of similar numbers) (cm)
g. Branch Type III intervals 1.78 ± 0.16 2.75 ± 0.256 < 0.001 (111) 0.008(from Branch Type IIs of similar lengths) (cm)
h. Branch Type III foliage abundance 1.66 ± 0.11 1.47 ± 0.142 0.041 (109) 0.025(from Branch Type IIs of similar lengths)(amount of IVs/length of III (cm))
i. Branch Type IV lengths (cm) 4.94 ± 0.74 6.04 ± 0.66 0.076 (90)
j. Branch Type IV increments (cm) 0.80 ± 0.13 0.98 ± 0.08 0.022 (90)
k. Branch Type III total foliage area (cm2) 534.3 ± 587.5 506.8 ± 333.5 0.9334 (4)
l. Branch Type III SFA (cm2 g–1) 34.77 ± 0.073 50.76 ± 3.04 < 0.001 (107) 0.091
m. Branch Type III SPAR90 0.768 ± 0.035 0.821 ± 0.043 0.070 (72) 0.398
n. Branch Type III SPARmax 0.879 ± 0.017 0.917 ± 0.018 0.003 (56) 0.122
o. Branch Type IV SFA (cm2 g–1) 39.92 ± 3.86 50.56 ± 1.67 < 0.001 (68)
p. Branch Type IV SPAR90 0.901 ± 0.024 0.849 ± 0.018 0.008 (62)
q. Branch Type IV SPARmax 0.928 ± 0.056 0.914 ± 0.012 0.450 (62)
at Oxford Journals on Septem
ber 6, 2013http://treephys.oxfordjournals.org/
Dow
nloaded from

compared with lower-canopy Branch Type IIs, upper-canopyBranch Type IIs drooped more, but not because of differencesin the angle at the point of attachment to Branch Type I.
Branch Type III lengths Similar to Branch Type IIs, lower-canopy Branch Type IIIs were longer than upper-canopyBranch Type IIIs on Branch Type IIs with the same number(numbers 3–14 from the tip of the parent Branch Type I) (Ta-ble 2d). However, there were some differences between the pat-terns at the two orders. First, ANOVA showed a significantwithin-canopy-position tree effect for Branch Type III lengthsin the upper and lower canopy (upper canopy P < 0.001; lowercanopy P = 0.002). Mean Branch Type III lengths in the uppercanopy of Trees 1 to 3 were 4.7, 6.7 and 7.7 cm, respectively,and corresponding mean lengths in the lower canopy were13.5, 16.1 and 16.1 cm. Second, the linear relationship betweenBranch Type II length and its number from the tip of its parentBranch Type I, which was observed in all 18 Branch Type Is,was found in just more than half of Branch Type IIIs on Branch
Type IIs (upper canopy = 60.9%; lower canopy = 63.4%). TheBranch Type IIs for which the Branch Type III length showed anonlinear relationship generally followed a pattern in whichthe lengths were shorter at both the tip and the point of attach-ment of the Branch Type II, with maximum lengths in the mid-dle of the branch (Figure 3). Within a Branch Type I, theBranch Type IIs with a linear length pattern of Branch Type IIIstended to be those farther away from the tip of the Branch TypeI, followed by a switch to a nonlinear length pattern closer tothe tip of the Branch Type I. Eight out of nine of the upper-can-opy Branch Type Is and seven out of nine of the lower-canopyBranch Type Is exhibited this switch, indicating similaritybetween canopy positions.
In several cases, there was cycling of alternating BranchType III lengths (Figure 4). That is, one side of the branch hadlonger branches than the other side. Cycling occurred in 41%of the lower-canopy Branch Type IIs, but in only 13% of theupper-canopy Branch Type IIs.
A comparison of destructively sampled Branch Type IIIstaken from Branch Type IIs of similar length showed no signif-icant difference in Branch Type III lengths between the upperand lower canopy (Table 2e). However, to obtain Branch TypeIIs of similar length (mean length 34.5 ± 1.9 cm), those sam-pled from the upper canopy had higher branch numbers thanthose sampled from the lower canopy, which is in agreementwith the Branch Type II length results (Table 2a, Figure 2a) ob-tained from the nondestructive measurements. Therefore,Branch Type IIs at the same branch number from the tip of theBranch Type I had longer daughter branches in the lower can-opy than in the upper canopy. However, when Branch Type IIs
654 EDELSTEIN AND FORD
TREE PHYSIOLOGY VOLUME 23, 2003
Figure 2. Branching patterns forBranch Type IIs. Upper canopy BranchType IIs (�) are compared withlower-canopy Branch Type IIs (�) inthe relationships between (a) length ofBranch Type II and Branch Type IInumber from the Branch Type I tip(upper r2 = 0.67; lower r2 = 0.73), (b)amount of Branch Type IIIs and lengthof Branch Type II (upper r2 = 0.50;lower r2 = 0.74), and (c) amount ofBranch Type IIIs and Branch Type IInumber from the tip of Branch Type I(upper r2 = 0.73; lower r2 = 0.65). Allrelationships are linear (r2 > 0.05) andlinear regression estimates of theslopes are (a) upper = 2.43 ± 0.47,lower = 10.79 ± 1.92; (b) upper = 0.61± 0.17, lower = 0.24 ± 0.04; and (c)upper = 2.18 ± 0.38, lower = 2.88 ±0.62.
Figure 3. Illustration of linear (a) versus nonlinear (b) length patternsin Branch Type IIIs (not drawn to scale).
at Oxford Journals on Septem
ber 6, 2013http://treephys.oxfordjournals.org/
Dow
nloaded from

of the same length (but different branch number) were com-pared between upper and lower canopy there was no differ-ence in length of the Branch Type IIIs they supported.
Intervals between Branch Type IIIs The distance betweenBranch Type IIIs along their parent Branch Type II was signifi-cantly greater for lower-canopy branches than for upper-can-opy branches, when comparing mean Branch Type III intervalson Branch Type IIs of similar branch number and when com-paring Branch Type IIs of similar length (Table 2f and 2g).However, the difference in mean values of Branch Type III in-tervals between the upper and lower canopy was greater when
comparing similarly numbered Branch Type IIs (1.78 cm) thanwhen comparing Branch Type IIs of similar length (0.97 cm).There was a significant within-canopy-position tree effect inthe upper canopy (P < 0.0001), but not in the lower canopy (P >0.10). The upper-canopy mean intervals for Trees 1 to 3 were0.98, 1.44 and 1.46 cm, respectively.
Foliage abundance on Branch Type IIIs When comparingBranch Type IIIs on Branch Type IIs of similar length, theBranch Type IIIs from the upper canopy had more Branch TypeIVs per unit length than Branch Type IIIs from the lower can-opy (Table 2h).
TREE PHYSIOLOGY ONLINE at http://heronpublishing.com
MORPHOLOGICAL PLASTICITY IN THUJA PLICATA 655
Table 3. Upper- and lower-canopy mean declination angles and associated statistics. The intervals are 95% confidence intervals. The fourth col-umn contains P-values for an unpaired t-test with individual branches as replicates; numbers in parenthesis are the degrees of freedom (df). Thelast column contains paired t-test results with mean tree values as replicates (n = 3, because the test pairs the upper- and lower-canopy results oneach of the three trees). Angles were measured at the node or point of attachment, midpoint and tip and averaged for each branch. For Branch TypeIIs, with the exception of the measurement at the node, the lower-canopy branches were more horizontal than the upper-canopy branches. This wasalso true at the node of the Branch Type IIIs, but the difference was not significant for the mean at this order. A dash indicates that no data wereavailable.
Upper-canopy mean Lower-canopy mean Pf (df) Pt (n = 3)
Branch Type IINode 87.6 ± 5.9 94.2 ± 8.9 < 0.231 (90) 0.510Midpoint 123.4 ± 8.6 99.4 ± 9.7 < 0.001 (89) –Tip 159.9 ± 3.6 142.4 ± 8.1 < 0.005 (53) 0.008Mean 123.8 ± 3.6 114.0 ± 6.3 < 0.014 (90) 0.164
Branch Type IIINode 136.7 ± 3.6 128.5 ± 4.5 < 0.005 (484) 0.375Mean 144.2 ± 3.0 143.9 ± 3.9 < 0.657 (467) 0.616
Figure 4. Eight examples of upper-can-opy (�) and lower-canopy (�) BranchType III lengths versus branch numberfrom the tip of their parent BranchType II. These Branch Type IIs are ontwo different Branch Type Is: upper-and lower-canopy branches of the sametree. As the branch number decreases,the Branch Type II becomes closer tothe tip of the Branch Type I. Note theprogression from linear to nonlinearlength patterns (Figures 5a–5d) as theBranch Type II becomes closer to thetip of its parent Branch Type I. Alsonote the cycling, which is when oneside of the branch has longer branchesthan the other side. This is most evi-dent in the lower-canopy Branch TypeII 8.
at Oxford Journals on Septem
ber 6, 2013http://treephys.oxfordjournals.org/
Dow
nloaded from
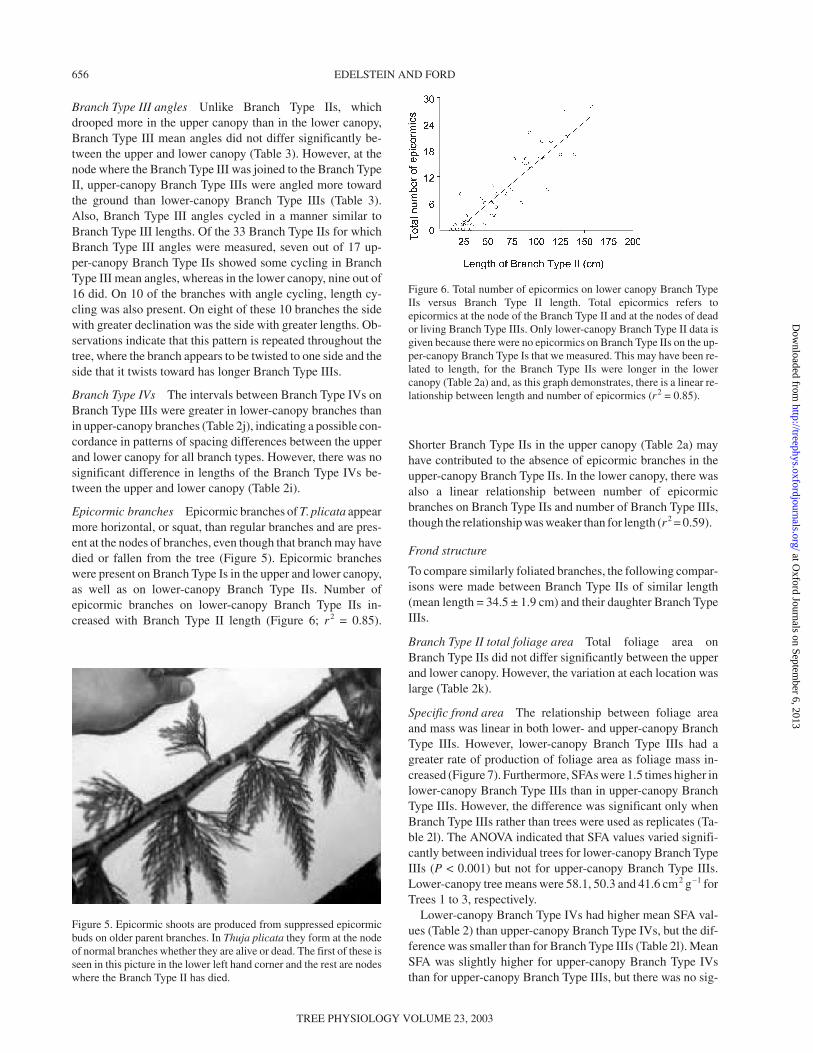
Branch Type III angles Unlike Branch Type IIs, whichdrooped more in the upper canopy than in the lower canopy,Branch Type III mean angles did not differ significantly be-tween the upper and lower canopy (Table 3). However, at thenode where the Branch Type III was joined to the Branch TypeII, upper-canopy Branch Type IIIs were angled more towardthe ground than lower-canopy Branch Type IIIs (Table 3).Also, Branch Type III angles cycled in a manner similar toBranch Type III lengths. Of the 33 Branch Type IIs for whichBranch Type III angles were measured, seven out of 17 up-per-canopy Branch Type IIs showed some cycling in BranchType III mean angles, whereas in the lower canopy, nine out of16 did. On 10 of the branches with angle cycling, length cy-cling was also present. On eight of these 10 branches the sidewith greater declination was the side with greater lengths. Ob-servations indicate that this pattern is repeated throughout thetree, where the branch appears to be twisted to one side and theside that it twists toward has longer Branch Type IIIs.
Branch Type IVs The intervals between Branch Type IVs onBranch Type IIIs were greater in lower-canopy branches thanin upper-canopy branches (Table 2j), indicating a possible con-cordance in patterns of spacing differences between the upperand lower canopy for all branch types. However, there was nosignificant difference in lengths of the Branch Type IVs be-tween the upper and lower canopy (Table 2i).
Epicormic branches Epicormic branches of T. plicata appearmore horizontal, or squat, than regular branches and are pres-ent at the nodes of branches, even though that branch may havedied or fallen from the tree (Figure 5). Epicormic brancheswere present on Branch Type Is in the upper and lower canopy,as well as on lower-canopy Branch Type IIs. Number ofepicormic branches on lower-canopy Branch Type IIs in-creased with Branch Type II length (Figure 6; r 2 = 0.85).
Shorter Branch Type IIs in the upper canopy (Table 2a) mayhave contributed to the absence of epicormic branches in theupper-canopy Branch Type IIs. In the lower canopy, there wasalso a linear relationship between number of epicormicbranches on Branch Type IIs and number of Branch Type IIIs,though the relationship was weaker than for length (r 2 = 0.59).
Frond structure
To compare similarly foliated branches, the following compar-isons were made between Branch Type IIs of similar length(mean length = 34.5 ± 1.9 cm) and their daughter Branch TypeIIIs.
Branch Type II total foliage area Total foliage area onBranch Type IIs did not differ significantly between the upperand lower canopy. However, the variation at each location waslarge (Table 2k).
Specific frond area The relationship between foliage areaand mass was linear in both lower- and upper-canopy BranchType IIIs. However, lower-canopy Branch Type IIIs had agreater rate of production of foliage area as foliage mass in-creased (Figure 7). Furthermore, SFAs were 1.5 times higher inlower-canopy Branch Type IIIs than in upper-canopy BranchType IIIs. However, the difference was significant only whenBranch Type IIIs rather than trees were used as replicates (Ta-ble 2l). The ANOVA indicated that SFA values varied signifi-cantly between individual trees for lower-canopy Branch TypeIIIs (P < 0.001) but not for upper-canopy Branch Type IIIs.Lower-canopy tree means were 58.1, 50.3 and 41.6 cm2 g–1 forTrees 1 to 3, respectively.
Lower-canopy Branch Type IVs had higher mean SFA val-ues (Table 2) than upper-canopy Branch Type IVs, but the dif-ference was smaller than for Branch Type IIIs (Table 2l). MeanSFA was slightly higher for upper-canopy Branch Type IVsthan for upper-canopy Branch Type IIIs, but there was no sig-
656 EDELSTEIN AND FORD
TREE PHYSIOLOGY VOLUME 23, 2003
Figure 5. Epicormic shoots are produced from suppressed epicormicbuds on older parent branches. In Thuja plicata they form at the nodeof normal branches whether they are alive or dead. The first of these isseen in this picture in the lower left hand corner and the rest are nodeswhere the Branch Type II has died.
Figure 6. Total number of epicormics on lower canopy Branch TypeIIs versus Branch Type II length. Total epicormics refers toepicormics at the node of the Branch Type II and at the nodes of deador living Branch Type IIIs. Only lower-canopy Branch Type II data isgiven because there were no epicormics on Branch Type IIs on the up-per-canopy Branch Type Is that we measured. This may have been re-lated to length, for the Branch Type IIs were longer in the lowercanopy (Table 2a) and, as this graph demonstrates, there is a linear re-lationship between length and number of epicormics (r2 = 0.85).
at Oxford Journals on Septem
ber 6, 2013http://treephys.oxfordjournals.org/
Dow
nloaded from
nificant difference between these branch types for lower-can-opy branches.
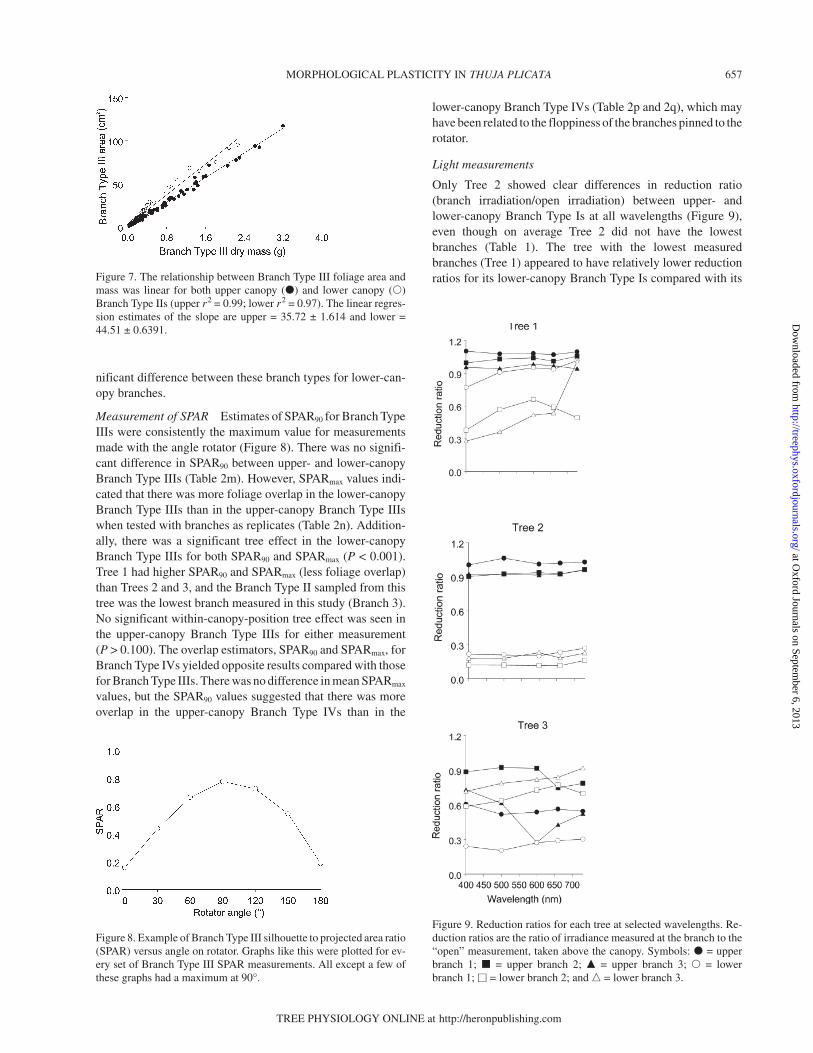
Measurement of SPAR Estimates of SPAR90 for Branch TypeIIIs were consistently the maximum value for measurementsmade with the angle rotator (Figure 8). There was no signifi-cant difference in SPAR90 between upper- and lower-canopyBranch Type IIIs (Table 2m). However, SPARmax values indi-cated that there was more foliage overlap in the lower-canopyBranch Type IIIs than in the upper-canopy Branch Type IIIswhen tested with branches as replicates (Table 2n). Addition-ally, there was a significant tree effect in the lower-canopyBranch Type IIIs for both SPAR90 and SPARmax (P < 0.001).Tree 1 had higher SPAR90 and SPARmax (less foliage overlap)than Trees 2 and 3, and the Branch Type II sampled from thistree was the lowest branch measured in this study (Branch 3).No significant within-canopy-position tree effect was seen inthe upper-canopy Branch Type IIIs for either measurement(P > 0.100). The overlap estimators, SPAR90 and SPARmax, forBranch Type IVs yielded opposite results compared with thosefor Branch Type IIIs. There was no difference in mean SPARmax
values, but the SPAR90 values suggested that there was moreoverlap in the upper-canopy Branch Type IVs than in the
lower-canopy Branch Type IVs (Table 2p and 2q), which mayhave been related to the floppiness of the branches pinned to therotator.
Light measurements
Only Tree 2 showed clear differences in reduction ratio(branch irradiation/open irradiation) between upper- andlower-canopy Branch Type Is at all wavelengths (Figure 9),even though on average Tree 2 did not have the lowestbranches (Table 1). The tree with the lowest measuredbranches (Tree 1) appeared to have relatively lower reductionratios for its lower-canopy Branch Type Is compared with its
TREE PHYSIOLOGY ONLINE at http://heronpublishing.com
MORPHOLOGICAL PLASTICITY IN THUJA PLICATA 657
Figure 8. Example of Branch Type III silhouette to projected area ratio(SPAR) versus angle on rotator. Graphs like this were plotted for ev-ery set of Branch Type III SPAR measurements. All except a few ofthese graphs had a maximum at 90°.
Figure 9. Reduction ratios for each tree at selected wavelengths. Re-duction ratios are the ratio of irradiance measured at the branch to the“open” measurement, taken above the canopy. Symbols: � = upperbranch 1; � = upper branch 2; � = upper branch 3; � = lowerbranch 1; � = lower branch 2; and � = lower branch 3.
Figure 7. The relationship between Branch Type III foliage area andmass was linear for both upper canopy (�) and lower canopy (�)Branch Type IIs (upper r2 = 0.99; lower r2 = 0.97). The linear regres-sion estimates of the slope are upper = 35.72 ± 1.614 and lower =44.51 ± 0.6391.
at Oxford Journals on Septem
ber 6, 2013http://treephys.oxfordjournals.org/
Dow
nloaded from

upper-canopy Branch Type Is. The difference in radiation be-tween the upper and lower canopy was not as large as ex-pected. However, the lowest individual branch on Tree 1,Branch 3, had relatively lower reduction ratios except at730 nm. This branch was the only branch of the 18 BranchType Is that was located in the WRCCRF dim zone as desig-nated by Parker (1997). The red/far red reduction ratiosshowed similar patterns to the wavelength reduction ratios andvariable light environments were observed in the lower canopy(Table 4).
Discussion
Although the reduction in radiation in the lower canopy ofT. plicata was less than might have been expected in a forestplantation (Leverenz and Hinckley 1990, Stenberg et al.1999), the characteristics seen in T. plicata fit well into theframework of the foraging and cost-benefit models for lightadaptation. The foraging model applies to the branching pat-tern. Lower-canopy branches in their variable, and at timeslimited, light environment must forage for light differentlythan upper-canopy branches. The cost-benefit model helps ex-plain the difference in foliage structure between the upper andlower canopy. It predicts how lower-canopy foliage developsmore photosynthetically efficient morphological structuresthan upper-canopy foliage.
Application of the foraging model
The predictions of the foraging model apply toT. plicata’s morphological plasticity in branching structure(summarized in Table 5). The model predicts two responses toincreased irradiance: reduced spacer length and increasedbranching intensity. These responses result in a concentrationof foliage in those areas with more light to maximize light in-terception (Hutchings and de Kroon 1994). The opposite re-sponse in low light environments makes it possible for plantsto forage for light. Elements of the foraging model are seen inT. plicata seedlings; they demonstrate an opportunistic growthpattern, where the shoots are capable of rapid responses toshort-term environmental changes (Wang et al. 1994). Thefirst predicted response of decreased spacer length in more fa-vorable light conditions corresponds to our interval results formultiple orders (Table 2f and 2j) and types of comparison (Ta-ble 2g). Similarly, T. plicata seedlings respond to shade condi-tions by increased height through an increase in mean lengthand not number of stem units (Krasowski and Owens 1991).The foliage abundance estimates of Branch Type IIs andBranch Type IIIs (Table 2b and 2h) indicated a greater branch-ing intensity in the upper canopy, which concurs with the sec-ond prediction of the foraging model.
We found other characteristics associated with canopy posi-tion that are not an explicit part of Hutchings and de Kroon’s(1994) description of the foraging model but that fit implica-tions of the model (Table 5). For example, to forage for light inthe varied light environment of the lower canopy, branchesmight grow longer to increase the individual frond’s unshadedsurface area per unit foliage. Additionally, greater lengths mayreduce the cost of creating greater total foliage surface area perbranch, because it is probably more costly for a branch to pro-duce new foliated branches than to develop longer branches inan existing structure. However, where there were significantdifferences between the upper and lower canopy in the intervaland foliage abundance measures in Branch Type IIIs onBranch Type IIs of similar length, there was no significant can-opy position effect on the length of Branch Type IIIs (Ta-ble 2i). Thus taken altogether, the differences between theupper and lower canopy suggest that branch structure is proba-bly not simply a result of overall differences in length of parentbranches or branch age.
Branch angle results (Table 3) can be interpreted in terms ofthe foraging model for three dimensions. Angles of lower-can-opy Branch Type IIs were more horizontal than those of up-per-canopy Branch Type IIs, which probably increases lightcapture per unit foliage area in the reduced light environmentof the lower canopy. Overall, the difference in Branch Type IIangles between the upper and lower canopy is caused by dif-ferences in the midpoint and tip angles (Table 3), and it is theseangles that could change as the branch grows longer. Therewere no differences at the node (Table 3); however, for BranchType IIIs there was a difference between the upper and lowercanopy at the point of connection (Table 3), but not in meanangle. A more detailed analysis of the development of branchcurvature is required to clarify the relationship between length
658 EDELSTEIN AND FORD
TREE PHYSIOLOGY VOLUME 23, 2003
Table 4. Red/far red reduction ratio and conditions at each of theBranch Type Is. The red/far red ratio is the ratio of irradiances at 600and 730 nm. The differences in reduction ratios between the upper-and lower-canopy Branch Type Is were small, which may be related tothe light conditions described in the third column.
Branch Type I number Reduction Conditionsratio
Tree 1 (Thuja 137)Upper-canopy branch 1 0.9710 Bright sunUpper-canopy branch 2 0.9500 Bright sunUpper-canopy branch 3 1.0212 Bright sunLower-canopy branch 1 0.9169 Bright sun, in gapLower-canopy branch 2 2.6013 Partial shade/sunflecksLower-canopy branch 3 0.5470 Shade/sunflecks
Tree 2 (Thuja 3096)Upper-canopy branch 1 0.9919 Partially cloudyUpper-canopy branch 2 0.9601 Partially cloudyUpper-canopy branch 3 0.9629 Partially cloudyLower-canopy branch 1 0.8703 Partially cloudyLower-canopy branch 2 0.7147 Partially cloudyLower-canopy branch 3 0.8111 Partially cloudy
Tree 3 (Thuja 3228)Upper-canopy branch 1 0.9982 Partial shadeUpper-canopy branch 2 0.9036 Partial shadeUpper-canopy branch 3 0.8173 Partial shadeLower-canopy branch 1 0.8167 Partial shade/sunflecksLower-canopy branch 2 1.1900 Light partial shadeLower-canopy branch 3 0.9055 Direct sun, in gap
at Oxford Journals on Septem
ber 6, 2013http://treephys.oxfordjournals.org/
Dow
nloaded from

differences and branch angles between the upper and lowercanopy for Branch Type IIs and IIIs. Nonetheless, changes inbranch angle over time suggest continuing morphologicalplasticity over time in order to maintain branch angles asbranch structure changes. Our branch angle results comple-ment the study of Barclay (2001), who found that leaf anglesof T. plicata were less randomly arranged than those of otherconifers (e.g., Abies grandis, Tsuga heterophylla, Pseudo-tsuga menziesii, Picea sitchensis, Pinus contorta) and becameless horizontal in the upper portion of taller trees (~50 yearsold). It appears from our study that branch angles in old-
growth T. plicata are adapted to catch light from gaps in thecanopy at a more nearly vertical direction, as they are in theyounger trees Barclay (2001) measured.
The different lengths of Branch Type IIIs on opposite sidesof the parent Branch Type II are also an indication of opportu-nistic growth patterns (Figure 4). This cycling was more fre-quent in the lower canopy than in the upper canopy, and wasoften accompanied by variation in angle. This may be a local-ized response to light, with a branch twisted to and producingmore photosynthetic tissue on its least shaded side.
Another morphological change that we observed in thelower canopy was the development of “mini-trees” (Fig-ure 10), a possible reiteration unit. This branching pattern oc-curs when the main axis curves up, such that at the tip it isvertical to the horizon, and the daughter branches come off aslateral branches around this axis. The growth of this “main”axis is much reduced relative to its daughter branches. Themini-tree arrangement increases the probability of sun expo-sure, because the daughter branches forage for sunflecks lo-cally in multiple directions. Reiteration units are a form ofopportunistic architecture and are responses to damage, envi-ronmental stress or supraoptimal conditions (Hallé et al.1978).
Application of the cost-benefit model
We examined foliage structure by using a cost-benefit modelthat predicts a limit on the cost of tissue development inlow-light conditions (Table 5). Greater SFA (Branch Type IV)in the lower canopy (Table 2l and 2o) means a reduced cost oflight interception per unit mass (Stenberg 1999). The greaterrate of production of foliage mass relative to foliage area inlower-canopy Branch Type IIIs (Figure 7) reflects this reducedcost. Upper- and lower-canopy Branch Type IIIs of the same
TREE PHYSIOLOGY ONLINE at http://heronpublishing.com
MORPHOLOGICAL PLASTICITY IN THUJA PLICATA 659
Table 5. Predictive frameworks for Thuja plicata. The foraging model is described by Hutching and de Kroon (1994) and the cost-benefit modelwas derived from the study by Stenberg et al. (1998). The former model describes T. plicata’s response to light conditions in terms of branchingpatterns, whereas the latter model predicts foliage structure.
Framework and overarching Predictions for favorable Concordance between results Additional results thattheory light conditions and predictions in the upper potentially follow the
canopy framework’s overarchingtheory but are not includedunder predictions
Foraging model predicts Decreased internode length Smaller mean intervals at all More vertical angles in theincreased foliage concentration orders studied upper canopyin favorable light conditions
Increased branching intensity Greater branching intensity at Greater lengths of lower-all orders studied canopy branches
Possible reiteration units ofmini-trees and epicormicbranches in the lower canopy
Cost-benefit model predicts Decreased area per unit mass Lower mean SFA at all orders Increased difference betweenlimited expenditure on foliage (specific area) studied canopy positions in frondstructure in unfavorable
Decreased silhouette to Lower mean SPARmax butarea with increased mass
light conditionsprojected area ratio (SPAR) relatively small canopy position
effect and slightly varied results
Figure 10. Photograph of a “mini-tree,” a reiteration unit in the lowercanopy where the main axis curves up, such that at the tip it is verticalto the horizon (A) and growth is reduced relative to its daughterbranches (B). The daughter branches, then, can forage for local lightresources by laterally extending in multiple directions.
at Oxford Journals on Septem
ber 6, 2013http://treephys.oxfordjournals.org/
Dow
nloaded from

leaf area not only have different masses depending on their po-sition in the canopy, but as branches gain foliage area, the dif-ference between the foliage masses of the canopy positionsincreases. Thus, when comparing a lower- and upper-canopyBranch Type III, we predict that, at given foliage area, thelarger that area, the greater the difference in SFA between theupper and lower canopy.
High SPAR estimates indicate less foliage overlap (Carterand Smith 1985) as was found for Branch Type IIIs in thelower canopy (Table 2n). Less overlap potentially reducescosts of tissue development in a low-light environment by us-ing the space available effectively for increased light capture(Stenberg et al. 1998).
Although SPARmax is not the usual way to measure silhou-ette to area ratio, it may be the most accurate for this speciesbecause of the lack of rigidity of the branches (Barclay 2001).Traditionally, rotator measurements are used to quantify lightexposure, because foliage can intercept light from multiple an-gles (Stenberg et al. 1999). The angles are not meant to repre-sent true positioning to the tree, so given the planar nature ofT. plicata foliage, it is reasonable to use STARmax in makingcomparisons between canopy positions. We note that the op-posite difference was found for STAR90 of Branch Type IVs(Table 2p), where STAR90 values were significantly less in thelower canopy than in the upper canopy. This was probably a re-sult of the confounding factor of floppiness, and indicates thatthe important morphological variation is how Branch TypeIVs are arranged to form Branch Type IIIs. As seen in theSTARmax results (Table 2q), the Branch Type IVs in both theupper and lower canopy had little overlap when laid flat, prob-ably because the lengths of their daughter foliage, BranchType V, were too short to overlap (Figure 1b). Thus, their sil-houette area accounts for about 90% of their overall area inboth the upper- and lower-canopy Branch Type IVs.
In addition to the large differences in various measures be-tween the upper and lower canopy, there were smaller but sta-tistically significant differences between trees within canopypositions. The ANOVA indicated differences in Branch TypeIII intervals between branches and lengths, with Tree 1 havingthe longest lengths in the upper and lower canopy, and also thegreatest intervals in the upper canopy compared with Trees 2and 3.
However, differences between trees were largely overshad-owed by differences between the upper and lower canopy,which were highly significant in both types of t-test. Within-canopy-position tree effects of SFA and SPAR in the lowercanopy were of interest because paired t-tests indicated no sig-nificance difference between the upper and lower canopy. Thelower canopy of Tree 1, whose samples were deepest in thecanopy, had the largest mean values of SFA, STAR90 andSPARmax and the lowest red/far red ratio (Table 4). Thesewithin-canopy-position tree effects suggest the possibility of areaction norm (Sterns 1989), in which there is not one type offoliage structure in the lower canopy in juxtaposition to one inthe upper canopy, but rather a continuum between the two po-sitions, and possibly between light environments. Continuums
in specific needle area and silhouette to area ratios have beenseen in conifers such as Abies amabilis (Stenberg et al. 1998)and Picea abies (Stenberg et al. 1999), and there is a direct re-lationship between these measures and loss of canopy open-ness.
Silhouette to area ratios are one of the ways sun and shadeneedles have been defined in recent literature, and we foundsome significant differences in SPAR. The differences inSPAR between canopy positions were not large when com-pared with responses in other conifers (Table 6). This may bebecause radiation differences between the upper- and lower-canopy branches that we accessed from the canopy crane werenot as large as differences in other studies. If the tree effect in-dicates a plastic continuum of SPAR values within the lowercanopy, the difference in SPAR that we observed between theupper and lower canopy may not be as large as is possible forT. plicata, because the lower branches that we studied were notthe most shaded within this old-growth canopy (Figure 8) andtherefore did not have the highest SPAR values. Alternatively,the small difference in SPAR values between the upper andlower canopy could be a result of the alternately branched, pla-nar structure, which makes it less likely for foliage overlap tooccur within a branch, especially in the upper-canopy BranchIIIs where their daughter branches are shorter.
We conclude that for studies of within-canopy plasticity forspecies with frond-like foliage, branching structure must beconsidered in addition to foliage overlap. From only SPAR re-
660 EDELSTEIN AND FORD
TREE PHYSIOLOGY VOLUME 23, 2003
Table 6. Values of silhouette to total area ratio (STARmax) or silhouetteto projected area ratio (SPARmax) in sun and shade for various coniferspecies.
Species Sun Shade
Picea engelmanni1 0.12 ± 0.03 0.18 ± 0.03Abies lasiocarpa1 0.15 ± 0.04 0.31 ± 0.05Pinus contorta1 0.13 ± 0.02 0.14 ± 0.03Sequoia sempervirens2 0.98 ± 0.03Abies grandis2 0.99 ± 0.04Pseudotsuga menziesii2 0.87 ± 0.08Abies amabilis2,3 0.87 ± 0.1Tsuga heterophylla2 0.85 ± 0.02Picea abies2,3 0.84 ± 0.01Picea orientalis2 0.82 ± 0.08Picea sitchensis2 0.74 ± 0.08Abies procera2 0.73 ± 0.06Abies lasiocarpa2 0.67 ± 0.08Pinus sylvestris2,4 0.54 ± 0.05Pinus contorta2 0.50 ± 0.1
1 Maximum STARmax = 0.5 (denominator was total surface area)(Carter and Smith 1985).
2 Measurement = Rmax; maximum = 1.0; denominator was projectedarea (similar to SPAR) (Leverenz and Hinckley 1990).
3 Known to have decreased STARmax or SPARmax with canopy open-ness (STAR, Abies amabilis, Stenberg et al. 1998; SPAR, Piceaabies, Stenberg et al. 1999).
4 Known to have decreased STAR with canopy openness (Stenberget al. 2001).
at Oxford Journals on Septem
ber 6, 2013http://treephys.oxfordjournals.org/
Dow
nloaded from

sults we might have concluded that T. plicata showed littleplasticity between the upper and lower canopy. However, themeasurements of length, distance between branches and anglesuggest that T. plicata has a guerilla-like growth pattern(Harper 1985) with less apical dominance than other coniferspecies of the Pinaceae. The guerilla growth pattern, whereapical meristems can have localized responses, enables grassspecies to exploit patchy environments more efficiently(Schmid 1985, Sutherland and Stillman 1988). As Sprugel etal. (1991) suggested, there is a need to explore foraging in thethree-dimensional space in which trees vie for light. Branchesof conifer species show different types and degrees of plastic-ity in response to competition (Cannell et al. 1984) and neigh-bors (Franco 1986), and studies of asymmetrical canopystructure consider those facts (Umeki 1997, Brission 2001).
Acknowledgments
The authors thank David Braun, Mark Creighton, Margaret Harris,Maureen Kennedy, Lindsey Horton and Art Breitsprecher for their as-sistance, and David Shaw and Annie Hamilton for facilitating ourstudy. Drs. C.A. Pfister, T.J. Wootton and M.D.E. Ruddat providedvaluable scientific input and comments on the manuscript. This studywas funded by the Andrew W. Mellon Foundation and performed atthe Wind River Canopy Crane Research Facility, a cooperative scien-tific venture between the University of Washington, the USFS PNWResearch Station and USFS Gifford Pinchot National Forest.
References
Barclay, H.J. 2001. Distribution of leaf orientations in six species.Can. J. Bot. 79:389–397.
Briand, C.H., U. Posluszny and D.W. Larson. 1992. Differential axisarchitecture in Thuja occidentalis (eastern white cedar). Can. J.Bot. 70:340–348.
Brission, J. 2001. Neighborhood competition and crown asymmetryin Acer saccharum. Can. J. For. Res. 31:2151–2159.
Brooks, J.R., T.M. Hinckley and D.G. Sprugel. 1994. Acclimation re-sponses of mature Abies amabilis sun foliage to shading. Oecologia100:316–324.
Cannell, M.G.R., P. Rothery and E.D. Ford. 1984. Competition withinstands of Picea sitchensis and Pinus contorta. Ann. Bot. 53:349–362.
Carter, R.E. and K. Klinka. 1992. Variation in shade tolerance ofDouglas-fir, western hemlock, and western red cedar in coastalBritish Columbia. For. Ecol. Manage. 55:87–105.
Carter, G.A. and W.K. Smith. 1985. Influence of shoot structure onlight interception and photosynthesis in conifers. Plant Physiol. 79:1038–1043.
DeBell, J.D. and B.L. Gartner. 1997. Stem characteristics on thelower log of 35-year-old Western red cedar grown at several spac-ings. West. J. Appl. For. 12:9–14.
Feller, M.C. and K. Klinka. 1998. Seedfall, seed germination, and ini-tial survival and growth of seedlings of Thuja plicata in southwest-ern British Columbia. Northwest Sci. 72:157–169.
Ford, E.D. 1982. High productivity in a pole stage Sitka spruce standand its relation to canopy structure. Forestry 55:1–17.
Franco, M. 1986. The influence of neighbors on growth of modularorganisms with an example from trees. Phil. Trans. R. Soc. Lond. B313:209–225.
Franklin, J.F. and D.S. DeBell. 1988. Thirty-six years of tree popula-tion change in an old-growth Pseudotsuga–Tsuga forest. Can. J.For. Res. 18:633–639.
Gilbert, I.R., P.G. Jarvis and H. Smith. 2001. Proximity signal andshade avoidance differences between early and late sucessionaltrees. Nature 411:792–795.
Hallé, F., R.A.A. Oldeman and P.B. Tomlinson. 1978. Tropical treesand forests: an architectural analysis. Springer-Verlag, Berlin,441 p.
Harper, J.L. 1985. Modules, branches, and the capture of resources. InPopulation Biology and Evolution of Clonal Organisms. Eds.J.B.C. Jackson, L.W. Buss and R.E. Cook. Yale University Press,New Haven, CT, pp 1–33.
Hutchings, M.J. and H. de Kroon. 1994. Foraging plants: the role ofmorphological plasticity in resource acquisition. Adv. Ecol. Res.25:160–238.
Ishii, H. and E.D. Ford. 2001. The role of epicormic shoot productionin maintaining foliage in old Pseudotsuga menziesii (Douglas-fir)trees. Can J. Bot. 79:251–264.
Ishii, H. and E.D. Ford. 2002. Persistence of Pseudotsuga menziesii(Douglas-fir) in temperate coniferous forests of the Pacific North-west Coast, USA. Folia Geobot. 37:63–69.
Ishii, H., E.D. Ford, M.E. Boscolo, A.C. Manriquez, M.E. Wilson andT.M. Hinckley. 2002. Variation in specific needle area of old-growth Douglas-fir in relation to needle age, within-crown positionand epicormic shoot production. Tree Physiol. 22:31–40.
Khan, S.R., R. Rose, D.L. Haase and T.E. Sabin. 2000. Effects ofshade on morphology, chlorophyll concentration, and chlorophyllfluorescence of four Pacific Northwest conifer species. New For.19:171–186.
Kozlowski, T.T. 1971. Growth and development of trees. AcademicPress, New York, 489 p.
Krasowski, M.J. and J.N. Owens. 1991. Growth and morphology forwestern red cedar seedlings as affected by photoperiod and mois-ture stress. Can. J. For. Res. 21:340–352.
Laubenfels, D.J. 1953. The external morphology of coniferous leaves.Phytomorphology 3:1–20.
Leverenz, J.W. 1996. Shade-shoot structure, photosynthetic perfor-mance in the field, and photosynthetic capacity of evergreen coni-fers. Tree Physiol. 16:109–114.
Leverenz, J.W. and P.G. Jarvis. 1979. Photosynthesis in Sitka spruce.VIII. The effects of light flux density and direction on the rate of netphotosynthesis and the stomatal conductance of needles. J. Appl.Ecol. 16:919–932.
Leverenz, J.W. and T.M. Hinckley. 1990. Shoot structure, leaf area in-dex and productivity of evergreen conifer stands. Tree Physiol. 6:135–149.
Minore, D. 1990. Thuja plicata Donn ex D. Don—western red cedar.In Silvics of North America. Vol. 1. Conifers. Eds. R.M. Burns andB.H. Honkala. Agriculture Handbook 654, USDA Forest Service,Washington, DC, pp 590–600.
Parker, G.G. 1997. Canopy structure and light environment of anold-growth Douglas-fir/western hemlock forest. Northwest Sci.71:261–270.
Parker, T. and F.D. Johnson. 1987. Branching and terminal growth ofwestern red cedar. Northwest Sci. 61:7–12.
Schmid, B. 1985. Clonal growth in grassland perennials. II. Growthform and fine-scale colonizing ability. J. Ecol. 73:809–818.
Smith, W.K. and C.A. Brewer. 1994. The adaptive importance ofshoot and crown architecture in conifer trees. Am. Nat. 143:528–532.
Sprugel, D.G. 1989. The relationship of evergreenness, crown archi-tecture, and leaf size. Am. Nat. 133:465–479.
TREE PHYSIOLOGY ONLINE at http://heronpublishing.com
MORPHOLOGICAL PLASTICITY IN THUJA PLICATA 661
at Oxford Journals on Septem
ber 6, 2013http://treephys.oxfordjournals.org/
Dow
nloaded from

Sprugel, D.G., J.R. Brooks and T.M. Hinckley. 1996. Effects of lighton shoot geometry and needle morphology in Abies amabilis. TreePhysiol. 16:91–98.
Sprugel, D.G., T.M. Hinckley and W. Schaap. 1991. The theory andpractice of branch autonomy. Annu. Rev. Ecol. Syst. 22:309–334.
Stenberg, P., T. Kangas, H. Smolander and S. Linder. 1999. Shootstructure, canopy openness and light interception in Norwayspruce. Plant Cell Environ. 22:1133–1142.
Stenberg, P., S. Palmroth, B.J. Bond, D.G. Sprugel and H. Smolander.2001. Shoot structure and photosynthetic efficiency along the lightgradient in a Scots pine canopy. Tree Physiol. 21:805–814.
Stenberg, P., H. Smolander, D. Sprugel and S. Smolander. 1998.Shoot structure, light interception, and distribution of nitrogen inan Abies amabilis canopy. Tree Physiol. 18:759–767.
Sterns, S.C. 1989. The evolutionary significance of phenotypic plas-ticity. BioScience 39:436–445.
Sutherland, W.J. and R.A. Stillman. 1988. The foraging tactics ofplants. Oikos 52:239–244.
Trevor, M. and P.J. Burton. 1999. Locating the terminal bud of west-ern red cedar, Thuja plicata. Can. Field-Nat. 113:396–400.
Umeki, K. 1997. Effect of crown asymmetry on size-structure dynam-ics of plant populations. Ann. Bot. 79:631–641.
Wang, G.G., H. Quian and K. Klinka. 1994. Growth of Thuja plicataseedlings along a light gradient. Can. J. Bot. 72:1749–1757.
662 EDELSTEIN AND FORD
TREE PHYSIOLOGY VOLUME 23, 2003
at Oxford Journals on Septem
ber 6, 2013http://treephys.oxfordjournals.org/
Dow
nloaded from