Embed Size (px)
Citation preview
www.aging-us.com 8433 AGING
INTRODUCTION Late-onset Alzheimer disease (AD) is a chronic and progressive neurodegenerative disorder clinically characterized by memory loss and cognitive decline. Representative histopathological findings in AD brain include extracellular amyloid-β (Aβ) plaques, intracellular
neurofibrillary tangles composed of hyperphosphorylated tau, and a continuous loss of neurons. According to the ‘amyloid cascade hypothesis’, Aβ deposition is the cause of AD [1]. However, in the ‘mitochondrial cascade hypothesis’, the origin of AD is a defect in the oxidative phosphorylation (OXPHOS) system [2]. Interestingly, bioenergetics and Aβ appear to be closely related. Thus,
www.aging-us.com AGING 2019, Vol. 11, No. 19
Research Paper
Brain pyrimidine nucleotide synthesis and Alzheimer disease Alba Pesini1,2, Eldris Iglesias1,2, M. Pilar Bayona-Bafaluy1,2,3, Nuria Garrido-Pérez1,2,3, Patricia Meade1,2, Paula Gaudó1,2, Irene Jiménez-Salvador1, Pol Andrés-Benito4,5,6, Julio Montoya1,2,3, Isidro Ferrer4,5,6,7,8, Pedro Pesini9, Eduardo Ruiz-Pesini1,2,3,10
1Departamento de Bioquímica, Biología Molecular y Celular, Universidad de Zaragoza, Zaragoza, Spain 2Instituto de Investigación Sanitaria de Aragón (IIS Aragón), Zaragoza, Spain 3Centro de Investigaciones Biomédicas en Red de Enfermedades Raras (CIBERER), Madrid, Spain 4Departamento de Patología y Terapéutica Experimental, Universidad de Barcelona, Hospitalet de Llobregat, Barcelona, Spain 5Centro de Investigaciones Biomédicas en Red de Enfermedades Neurodegenerativas (CIBERNED), Madrid, Spain 6Instituto de Investigación Biomédica de Bellvitge (IDIBELL), Hospitalet de Llobregat, Barcelona, Spain 7Servicio de Anatomía Patológica, Hospital Universitario de Bellvitge, Hospitalet de Llobregat, Barcelona, Spain 8Instituto de Neurociencias, Universidad de Barcelona, Barcelona, Spain 9Araclon Biotech, Zaragoza, Spain 10Fundación ARAID, Zaragoza, Spain Correspondence to: Eduardo Ruiz-Pesini; email: [email protected] Keywords: Alzheimer disease, brain, de novo pyrimidine biosynthesis, pyrimidine salvage pathway, oxidative phosphorylation Received: June 25, 2019 Accepted: September 22, 2019 Published: September 27, 2019 Copyright: Pesini et al. This is an open-access article distributed under the terms of the Creative Commons Attribution License (CC BY 3.0), which permits unrestricted use, distribution, and reproduction in any medium, provided the original author and source are credited. ABSTRACT Many patients suffering late-onset Alzheimer disease show a deficit in respiratory complex IV activity. The de novo pyrimidine biosynthesis pathway connects with the mitochondrial respiratory chain upstream from respiratory complex IV. We hypothesized that these patients would have decreased pyrimidine nucleotide levels. Then, different cell processes for which these compounds are essential, such as neuronal membrane generation and maintenance and synapses production, would be compromised. Using a cell model, we show that inhibiting oxidative phosphorylation function reduces neuronal differentiation. Linking these processes to pyrimidine nucleotides, uridine treatment recovers neuronal differentiation. To unmask the importance of these pathways in Alzheimer disease, we firstly confirm the existence of the de novo pyrimidine biosynthesis pathway in adult human brain. Then, we report altered mRNA levels for genes from both de novo pyrimidine biosynthesis and pyrimidine salvage pathways in brain from patients with Alzheimer disease. Thus, uridine supplementation might be used as a therapy for those Alzheimer disease patients with low respiratory complex IV activity.
www.aging-us.com 8434 AGING
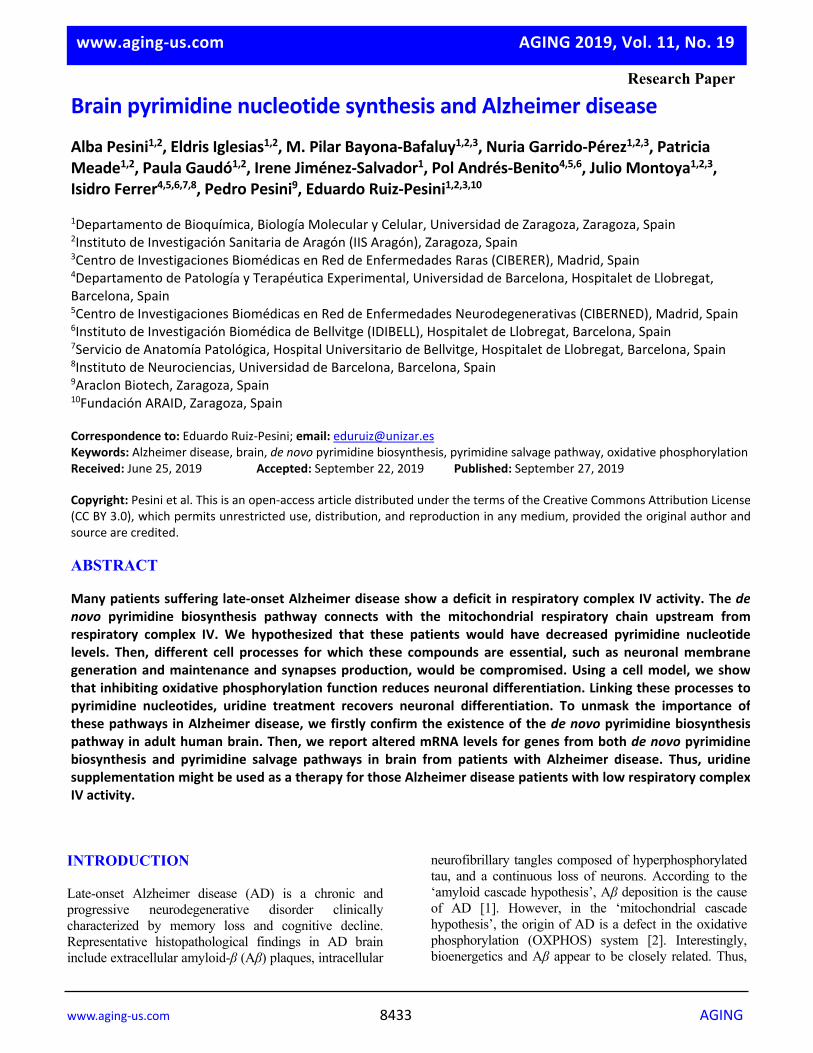
Aβ can reduce OXPHOS function and OXPHOS deficiency can increase Aβ production [3]. OXPHOS is much more than an energy-generating cellular pathway [4]. OXPHOS dysfunction can affect many biochemical routes, among them the de novo pyrimidine biosynthesis. This process requires three proteins: CAD, named after its three enzyme activities, carbamoyl-phosphate synthetase, aspartate transcarbamylase and dihydroorotase; DHODH, dihydroorotate dehydrogenase; and UMPS, which enzyme activities are orotate phosphoribosyltransferase and orotidine-5′-phosphate decarboxylase (Figure 1). DHODH is located in the mitochondrial inner membrane and directly transfers electrons to the OXPHOS electron transport chain (ETC) via coenzyme Q10 [5]. A reduction of electron transport downstream coenzyme Q10 would slow down DHODH activity and the de novo pyrimidine biosynthesis. Pyrimidine nucleotides are required for the synthesis of nucleic acids, carbohydrates, and many membrane
Figure 1. Oxidative phosphorylation system (OXPHOS) and biochemical pathways for pyrimidine nucleotide synthesis. OM, IMS, IM, and M code for mitochondrial outer membrane, intermembrane space, mitochondrial inner membrane, and mitochondrial matrix, respectively; ETC, electron transport chain; CI, CIII, CIV, CV and Cyt c code for respiratory complexes I, III, IV, ATP synthase and cytochrome c, respectively; Q, coenzyme Q10; NADH and NAD+, reduced and oxidized forms of nicotinamide adenine dinucleotide; H+, protons; e-, electrons; ADP, ATP and Pi, adenosine diphosphate, adenosine triphosphate, and inorganic phosphate; H2O, water; O2, oxygen; CAD, carbamoyl phosphate synthetase, aspartate transcarbamylase, dihydroorotase; DHODH, dihydroorotate dehydrogenase; UMPS, uridine monophosphate synthase; HCO3
-, bicarbonate; Gln, glutamine; Asp, aspartate; DHO, dihydroorotate; O, orotate; PRPP, phosphoribosyl 5’-pyrophosphate; UMP, uridine monophosphate; CMP, cytidine monophosphate; CTP, cytidine triphosphate; UCK2, uridine cytidine kinase 2.
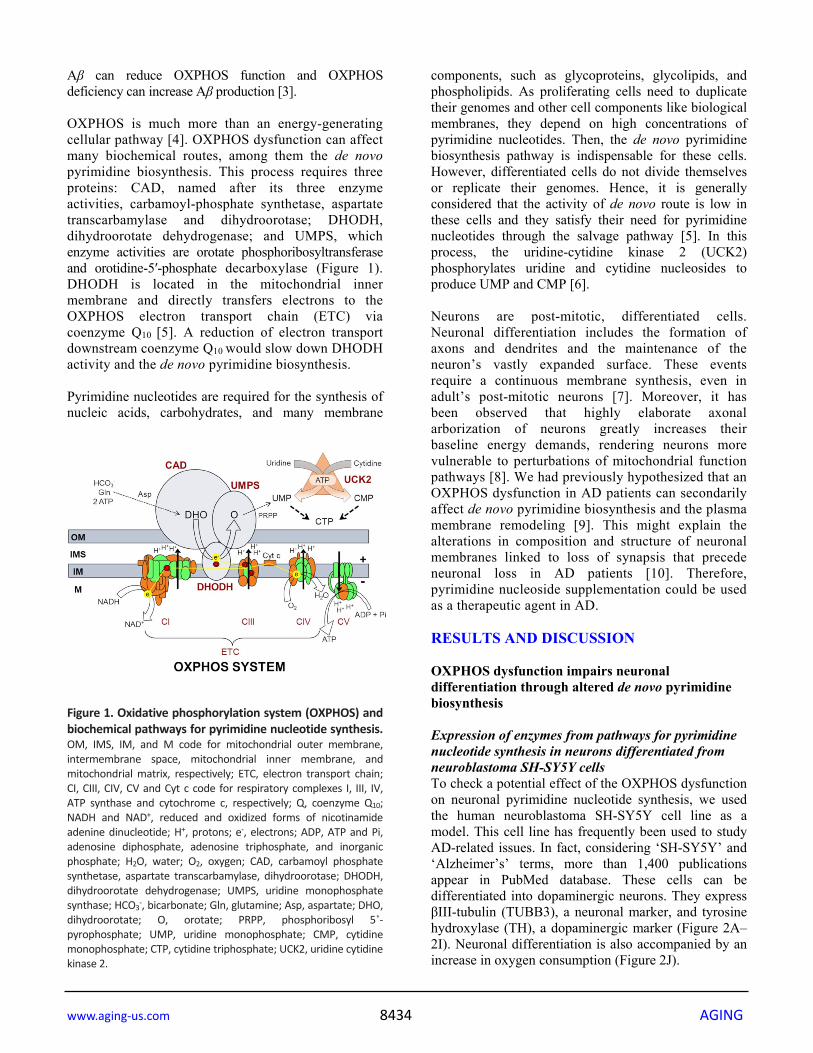
components, such as glycoproteins, glycolipids, and phospholipids. As proliferating cells need to duplicate their genomes and other cell components like biological membranes, they depend on high concentrations of pyrimidine nucleotides. Then, the de novo pyrimidine biosynthesis pathway is indispensable for these cells. However, differentiated cells do not divide themselves or replicate their genomes. Hence, it is generally considered that the activity of de novo route is low in these cells and they satisfy their need for pyrimidine nucleotides through the salvage pathway [5]. In this process, the uridine-cytidine kinase 2 (UCK2) phosphorylates uridine and cytidine nucleosides to produce UMP and CMP [6]. Neurons are post-mitotic, differentiated cells. Neuronal differentiation includes the formation of axons and dendrites and the maintenance of the neuron’s vastly expanded surface. These events require a continuous membrane synthesis, even in adult’s post-mitotic neurons [7]. Moreover, it has been observed that highly elaborate axonal arborization of neurons greatly increases their baseline energy demands, rendering neurons more vulnerable to perturbations of mitochondrial function pathways [8]. We had previously hypothesized that an OXPHOS dysfunction in AD patients can secondarily affect de novo pyrimidine biosynthesis and the plasma membrane remodeling [9]. This might explain the alterations in composition and structure of neuronal membranes linked to loss of synapsis that precede neuronal loss in AD patients [10]. Therefore, pyrimidine nucleoside supplementation could be used as a therapeutic agent in AD. RESULTS AND DISCUSSION OXPHOS dysfunction impairs neuronal differentiation through altered de novo pyrimidine biosynthesis Expression of enzymes from pathways for pyrimidine nucleotide synthesis in neurons differentiated from neuroblastoma SH-SY5Y cells To check a potential effect of the OXPHOS dysfunction on neuronal pyrimidine nucleotide synthesis, we used the human neuroblastoma SH-SY5Y cell line as a model. This cell line has frequently been used to study AD-related issues. In fact, considering ‘SH-SY5Y’ and ‘Alzheimer’s’ terms, more than 1,400 publications appear in PubMed database. These cells can be differentiated into dopaminergic neurons. They express βIII-tubulin (TUBB3), a neuronal marker, and tyrosine hydroxylase (TH), a dopaminergic marker (Figure 2A–2I). Neuronal differentiation is also accompanied by an increase in oxygen consumption (Figure 2J).

www.aging-us.com 8435 AGING
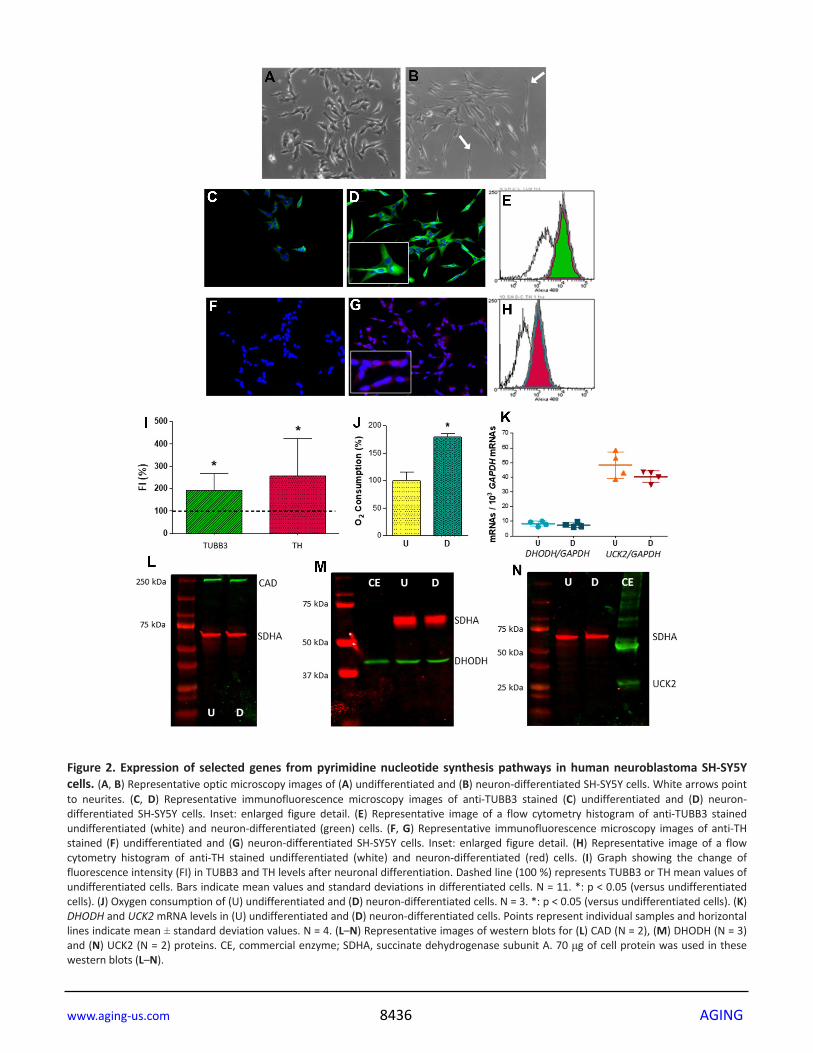
Proliferating cells express both DHODH and UCK2 mRNAs (Figure 2K). Levels are very similar to those reported in the human protein atlas webpage (https://www.proteinatlas.org/). DHODH mRNA levels were approximately five times lower than those for UCK2 mRNA. Neuronal differentiation did not modify mRNA values. The UCK2 protein was not detected in proliferating cells, although CAD and DHODH proteins were found (Figure 2L–2N). As UCK2 was previously reported in proliferating SH-SY5Y cells [11], we ruled out a general lack of pyrimidine salvage pathway in these cells. Perhaps the anti-UCK2 antibody was not sensitive enough. In fact, we needed 10 μg of a commercial enzyme to obtain a faint band in the Western blot. Additionally, we confirmed the presence of CAD and DHODH, but no UCK2, in these post-mitotic cells, i.e. neuron-differentiated SH-SY5Y cells (Figure 2L–2N). Neuronal differentiation after DHODH inhibition As previously commented upon, de novo pyrimidine biosynthesis is relevant for proliferating cells. Orally administered leflunomide is almost completely converted into its active metabolite teriflunomide and, inhibiting DHODH, it decreases pyrimidine nucleotide availability and cell proliferation. Because of this, it has been used for treatment of rheumatoid arthritis and it is also a potent anticancer drug [12]. During patient treatment, teriflunomide steady-state plasma concentrations of 200 μM can be reached [13]. We observed that leflunomide 100 μM largely reduces cell proliferation of human neuroblastoma SH-SY5Y cells (Figure 3A). According to our hypothesis, de novo pyrimidine biosynthesis pathway is also important for neurons. To revel its role in these cells, we studied the leflunomide effect on neuronal differentiation. Leflunomide 100 μM prevents an increase in TUBB3 and TH levels (Figure 3B). It has been shown that uridine can completely overcome growth inhibition by leflunomide [14]. However, uridine 200 or 800 μM were not able to prevent the effect of leflunomide on neuronal differentiation (Figure 3B). The additional inhibition of other cell functions by leflunomide, besides its effect on the de novo pyrimidine biosynthesis pathway, might be the reason why uridine has no effect in the maintaining neuronal differentiation [12]. In human cells, leflunomide reduces the mitochondrial inner membrane potential [15]. Mitochondrial inner membrane potential is generated by the electron flow through the respiratory chain, and this electron flow is associated with oxygen consumption. To determine the leflunomide effect on oxygen consumption of neuroblastoma SH-SY5Y cells,
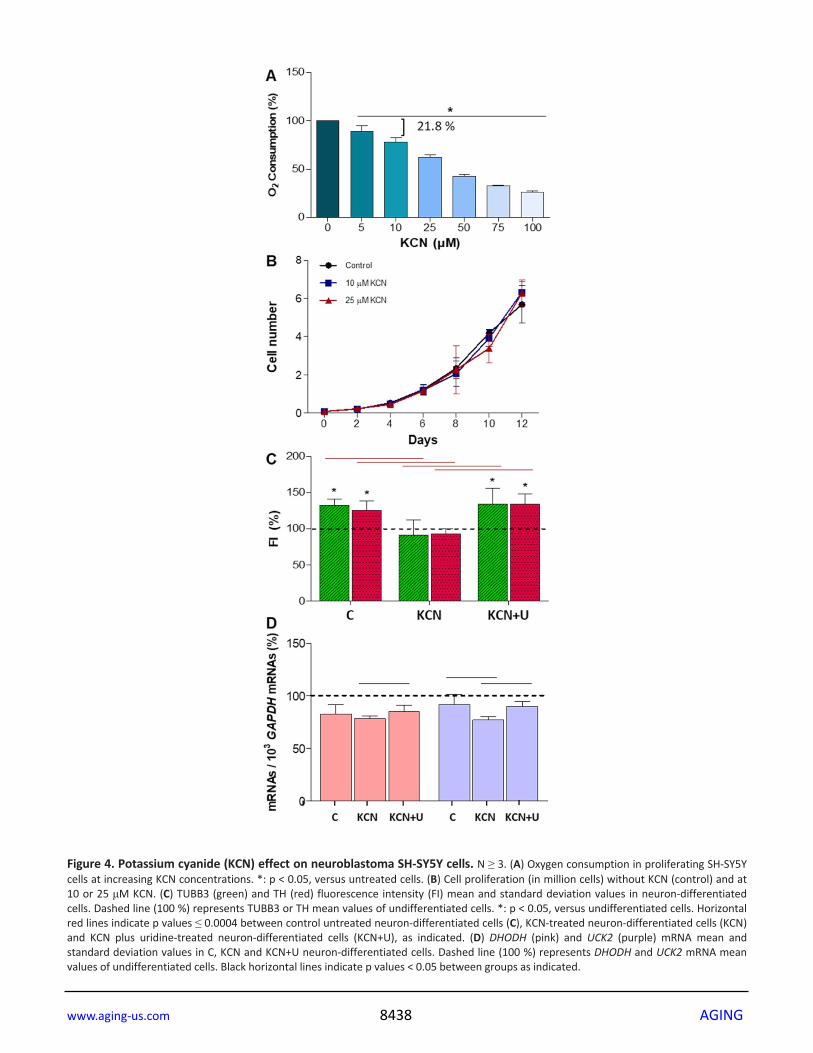
we tested different leflunomide concentrations. Leflunomide 100 μM reduces oxygen consumption to a residual 33.5 % (Figure 3C). Supporting our results, it has been reported that leflunomide, or its metabolite teriflunomide, decreased oxygen consumption in mouse and human cells [13, 16–20]. These results suggest that an important part of oxygen consumption and energy production in proliferating cells is due to pyrimidine biosynthesis. DHODH knockdown diminished mitochondrial ATP production and inner membrane potential in mouse and human cells [21, 22]. Leflunomide causes mitochondrial proliferation in human cells [15], suggesting a compensatory response. Moreover, externally added uridine to the culture media did not improve the mitochondrial inner membrane potential and did not prevent mitochondrial proliferation, despite that uridine normalizes the cell cycle progression [15]. Uridine 200 μM do not recover oxygen consumption of leflunomide-treated cells (Supplementary Figure 1). Similarly, it was reported that uridine had no protective effect against tamoxifen-induced impairment to mitochondrial respiration [23]. Neuronal differentiation after OXPHOS inhibition The OXPHOS dysfunction due to leflunomide might be responsible for the reduced neuronal differentiation of neuroblastoma SH-SY5Y cells. Because leflunomide also acts on other cell targets [12], we selected the CIV inhibitor potassium cyanide (KCN) that presumably does not act on these other leflunomide targets. KCN 10 μM or 25 μM decrease oxygen consumption in neuroblastoma SH-SY5Y cells to a residual 78 and 62 %, respectively (Figure 4A). It had been previously shown that KCN abolished DHO-induced oxygen consumption in mouse cells and mitochondria from different rat tissues [16, 24], confirming that OXPHOS CIV inhibition affected the de novo pyrimidine biosynthesis pathway. Moreover, in the human neuroblastoma SH-SY5Y cell line, KCN 10 μM and 25 μM do not affect cell proliferation (Figure 4B). Neuroblastoma SH-SY5Y cells were cultured with KCN 10 μM to analyze the effect of OXPHOS dysfunction on neuronal differentiation. These cells do not show increased TUBB3 and TH levels (Figure 4C). Supporting our results, it was previously reported that KCN significantly inhibited the dopaminergic neuronal differentiation of neural progenitor cells, derived from human induced pluripotent stem cells [22]. Hence, this compound, by reducing respiratory chain activity, prevents dopaminergic neuronal differentiation. In MDA231 human breast cancer cells, it has been shown that de novo pyrimidine synthesis pathway is depressed under low energy conditions, supposedly to reduce ATP-consumption [25]. To determine if that
www.aging-us.com 8436 AGING
Figure 2. Expression of selected genes from pyrimidine nucleotide synthesis pathways in human neuroblastoma SH-SY5Y cells. (A, B) Representative optic microscopy images of (A) undifferentiated and (B) neuron-differentiated SH-SY5Y cells. White arrows point to neurites. (C, D) Representative immunofluorescence microscopy images of anti-TUBB3 stained (C) undifferentiated and (D) neuron-differentiated SH-SY5Y cells. Inset: enlarged figure detail. (E) Representative image of a flow cytometry histogram of anti-TUBB3 stained undifferentiated (white) and neuron-differentiated (green) cells. (F, G) Representative immunofluorescence microscopy images of anti-TH stained (F) undifferentiated and (G) neuron-differentiated SH-SY5Y cells. Inset: enlarged figure detail. (H) Representative image of a flow cytometry histogram of anti-TH stained undifferentiated (white) and neuron-differentiated (red) cells. (I) Graph showing the change of fluorescence intensity (FI) in TUBB3 and TH levels after neuronal differentiation. Dashed line (100 %) represents TUBB3 or TH mean values of undifferentiated cells. Bars indicate mean values and standard deviations in differentiated cells. N = 11. *: p < 0.05 (versus undifferentiated cells). (J) Oxygen consumption of (U) undifferentiated and (D) neuron-differentiated cells. N = 3. *: p < 0.05 (versus undifferentiated cells). (K) DHODH and UCK2 mRNA levels in (U) undifferentiated and (D) neuron-differentiated cells. Points represent individual samples and horizontal lines indicate mean ± standard deviation values. N = 4. (L–N) Representative images of western blots for (L) CAD (N = 2), (M) DHODH (N = 3) and (N) UCK2 (N = 2) proteins. CE, commercial enzyme; SDHA, succinate dehydrogenase subunit A. 70 μg of cell protein was used in these western blots (L–N).
www.aging-us.com 8437 AGING
occurs in differentiated cells, we measured DHODH and UCK2 mRNA levels in KCN-treated SH-SY5Y cells after their differentiation to neurons. Although the de novo pathway requires more ATP than the salvage one, DHODH mRNA expression level did not change, but UCK2 mRNA levels significantly decreased (Figure 4D). It is worth noting that a high percentage of OXPHOS oxygen consumption is due to electrons supplied to the ETC through the DHODH enzyme. Then, de novo pyrimidine biosynthesis is
required not only for pyrimidine synthesis and energy production but also for other OXPHOS-related cell functions, such as the adjustment of the levels of signaling molecules (ATP, calcium, NAD+ and reactive oxygen species) to modulate different cell pathways [4]. This fact might explain why the de novo pathway is not down-regulated in neuron-differentiated cells under low energy conditions, whereas the salvage pathway only involved in pyrimidine synthesis, is reduced.
Figure 3. Leflunomide effect on neuroblastoma SH-SY5Y cells. N ≥ 3. (A) Cell proliferation (in million cells). *: p < 0.05 versus untreated cells (control). (B) TUBB3 (green) and TH (red) fluorescence intensity (FI) mean and standard deviation values in neuron-differentiated cells. Dashed line (100 %) represents TUBB3 or TH mean values of undifferentiated cells. C: untreated cells; LEF: leflunomide-treated cells; LEF+U, leflunomide plus uridine (200 μM)-treated cells; *: p ≤ 0.0021, versus undifferentiated cells; #: p ≤ 0.0055, versus untreated neuron-differentiated cells. (C) Oxygen consumption in proliferating SH-SY5Y cells. *: p < 0.05, versus untreated cells.
www.aging-us.com 8438 AGING
Figure 4. Potassium cyanide (KCN) effect on neuroblastoma SH-SY5Y cells. N ≥ 3. (A) Oxygen consumption in proliferating SH-SY5Y cells at increasing KCN concentrations. *: p < 0.05, versus untreated cells. (B) Cell proliferation (in million cells) without KCN (control) and at 10 or 25 μM KCN. (C) TUBB3 (green) and TH (red) fluorescence intensity (FI) mean and standard deviation values in neuron-differentiated cells. Dashed line (100 %) represents TUBB3 or TH mean values of undifferentiated cells. *: p < 0.05, versus undifferentiated cells. Horizontal red lines indicate p values ≤ 0.0004 between control untreated neuron-differentiated cells (C), KCN-treated neuron-differentiated cells (KCN) and KCN plus uridine-treated neuron-differentiated cells (KCN+U), as indicated. (D) DHODH (pink) and UCK2 (purple) mRNA mean and standard deviation values in C, KCN and KCN+U neuron-differentiated cells. Dashed line (100 %) represents DHODH and UCK2 mRNA mean values of undifferentiated cells. Black horizontal lines indicate p values < 0.05 between groups as indicated.
www.aging-us.com 8439 AGING
Uridine recovers neuronal differentiation of OXPHOS dysfunctional cells It was previously reported that uridine protected AD fibroblasts and normal human neuronal progenitor cells against azide toxicity [26, 27], another CIV inhibitor. Supplementation of uridine to aged rats increased brain neurofilament levels [28]. Besides, a uridine effect on neuronal differentiation was reported. Thus, in rat PC12 pheochromocytoma cells and mouse N2a and human LAN-5 and SH-SY5Y neuroblastoma cells, exogenous uridine enhanced cell differentiation as evidenced by increased number of neurite-bearing cells, neurites per cell, neurite branching, neurite length, and neurite neurofilament levels [27, 29–31]. We observed that uridine 200 μM was able to restore UCK2 mRNA levels in KCN-treated neuroblastoma SH-SY5Y cells (Figure 4D). Perhaps an excess of the UCK2 substrate uridine acts as a positive regulator for the expression of UCK2 mRNA. Uridine completely recovered TUBB3 and TH protein levels in these cells (Figure 4C). Uridine increases the synthesis of UDP-N-Acetylglucosamine (UDP-GlcNAc) [32]. This compound transfers GlcNAc to different proteins, such as transcription factors or histones, which implicates this modification in transcriptional regulation [33, 34]. Maybe, this is the way uridine recovers TUBB3 and TH expression. All these results indicate that OXPHOS dysfunction affects de novo pyrimidine nucleotide biosynthesis pathway and has negative consequences on neurons generated from neuroblastoma SH-SY5Y cells. As previously commented upon, it is considered that the activity of the de novo pathway is low in fully differentiated cells, such as mature brain neurons [5], but the cell’s capacity to salvage uridine is limited, and no cell can tolerate complete DHODH inhibition [35]. Moreover, some observations suggest that de novo pyrimidine biosynthesis pathway is also important in mature neurons from adult human brain [36]. The de novo pyrimidine biosynthesis pathway is present in adult human brain DHODH mRNA According to RNA-Seq studies reported in the Expression Atlas webpage (https://www.ebi.ac.uk/gxa/ home; accessed April 23, 2018), CAD, DHODH, and UMPS mRNAs are found in brain of primates, rodents, other placental and marsupial mammals, birds, and amphibians (Supplementary Table 1). There are no large differences in the number of transcripts per million for genes from the de novo pyrimidine biosynthesis pathway among species. By comparison, UCK2 mRNA levels, from the pyrimidine salvage pathway, are also very much
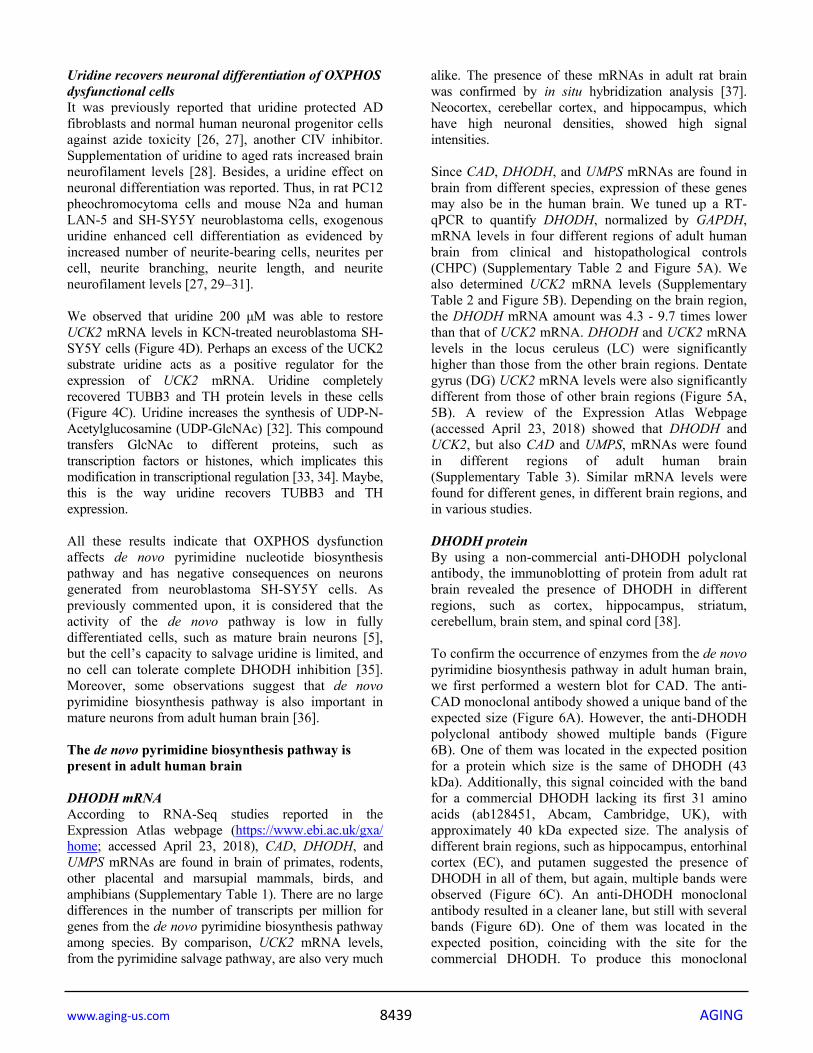
alike. The presence of these mRNAs in adult rat brain was confirmed by in situ hybridization analysis [37]. Neocortex, cerebellar cortex, and hippocampus, which have high neuronal densities, showed high signal intensities. Since CAD, DHODH, and UMPS mRNAs are found in brain from different species, expression of these genes may also be in the human brain. We tuned up a RT-qPCR to quantify DHODH, normalized by GAPDH, mRNA levels in four different regions of adult human brain from clinical and histopathological controls (CHPC) (Supplementary Table 2 and Figure 5A). We also determined UCK2 mRNA levels (Supplementary Table 2 and Figure 5B). Depending on the brain region, the DHODH mRNA amount was 4.3 - 9.7 times lower than that of UCK2 mRNA. DHODH and UCK2 mRNA levels in the locus ceruleus (LC) were significantly higher than those from the other brain regions. Dentate gyrus (DG) UCK2 mRNA levels were also significantly different from those of other brain regions (Figure 5A, 5B). A review of the Expression Atlas Webpage (accessed April 23, 2018) showed that DHODH and UCK2, but also CAD and UMPS, mRNAs were found in different regions of adult human brain (Supplementary Table 3). Similar mRNA levels were found for different genes, in different brain regions, and in various studies. DHODH protein By using a non-commercial anti-DHODH polyclonal antibody, the immunoblotting of protein from adult rat brain revealed the presence of DHODH in different regions, such as cortex, hippocampus, striatum, cerebellum, brain stem, and spinal cord [38]. To confirm the occurrence of enzymes from the de novo pyrimidine biosynthesis pathway in adult human brain, we first performed a western blot for CAD. The anti-CAD monoclonal antibody showed a unique band of the expected size (Figure 6A). However, the anti-DHODH polyclonal antibody showed multiple bands (Figure 6B). One of them was located in the expected position for a protein which size is the same of DHODH (43 kDa). Additionally, this signal coincided with the band for a commercial DHODH lacking its first 31 amino acids (ab128451, Abcam, Cambridge, UK), with approximately 40 kDa expected size. The analysis of different brain regions, such as hippocampus, entorhinal cortex (EC), and putamen suggested the presence of DHODH in all of them, but again, multiple bands were observed (Figure 6C). An anti-DHODH monoclonal antibody resulted in a cleaner lane, but still with several bands (Figure 6D). One of them was located in the expected position, coinciding with the site for the commercial DHODH. To produce this monoclonal
www.aging-us.com 8440 AGING
antibody, a DHODH fragment (amino acid positions 32 -141) was used (ab54621, Abcam, Cambridge, UK). This antibody also recognized the same DHODH fragment generated by us (Figure 6E). In an attempt to further confirm the presence of this protein in adult human brain, we carried out proteomic analyses of the western blot candidate band. In parallel to the brain sample, we also loaded a sample from neuroblastoma SH-SY5Y cell line, because proliferating cells require a large amount of pyrimidine and are dependent on DHODH, as we have previously shown (Figure 6F). Peptide mass fingerprinting did not show the protein in these samples. However, a parallel reaction monitoring (PRM) proteomics analysis showed 3 DHODH peptides in the western blot band corresponding to neuroblastoma SH-SY5Y cell homogenate (Supplementary Figures 2A and 3), but
DHODH could not be confirmed in the band corresponding to brain homogenate, probably due to a high background. Peptide mass fingerprinting and PRM proteomics analyses suggested, but did not confirm, the presence of DHODH in one of 6 spots from a two-dimensional electrophoresis gel (Supplementary Figures 2B and 4). It may be that the brain DHODH quantity was too low. However, a western blot of a brain sample using two different concentrations of a commercial DHODH allowed us to estimate its brain concentration as close to 2.2 ng DHODH/mg brain (Figure 6G). By ELISA, a mean concentration of 128.3 pg DHODH/mg brain was estimated in hippocampus from five control individuals. Surprisingly, the UCK2 mean concentration was much lower, 0.6 pg UCK2/mg brain. These results are in line with those SH-SY5Y cells, in which higher UCK2 mRNA levels but much lower UCK2 protein concentrations than those for DHODH were observed.
Figure 5. Expression of genes encoding (A) DHODH and (B) UCK2 proteins from both pyrimidine nucleotide synthesis pathways. GAPDH mRNA levels have been used to normalize. CA1: hippocampal cornus ammon 1; EC: entorhinal cortex; DG: dentate gyrus; LC: locus ceruleus. Points represent individual samples and horizontal lines indicate mean ± standard deviation values. P values for Kruskal-Wallis tests are indicated under the graphs. Horizontal red lines indicate between-regions p values (p < 0.0083) fulfilling the post-hoc Bonferroni/Dunn criteria.

www.aging-us.com 8441 AGING
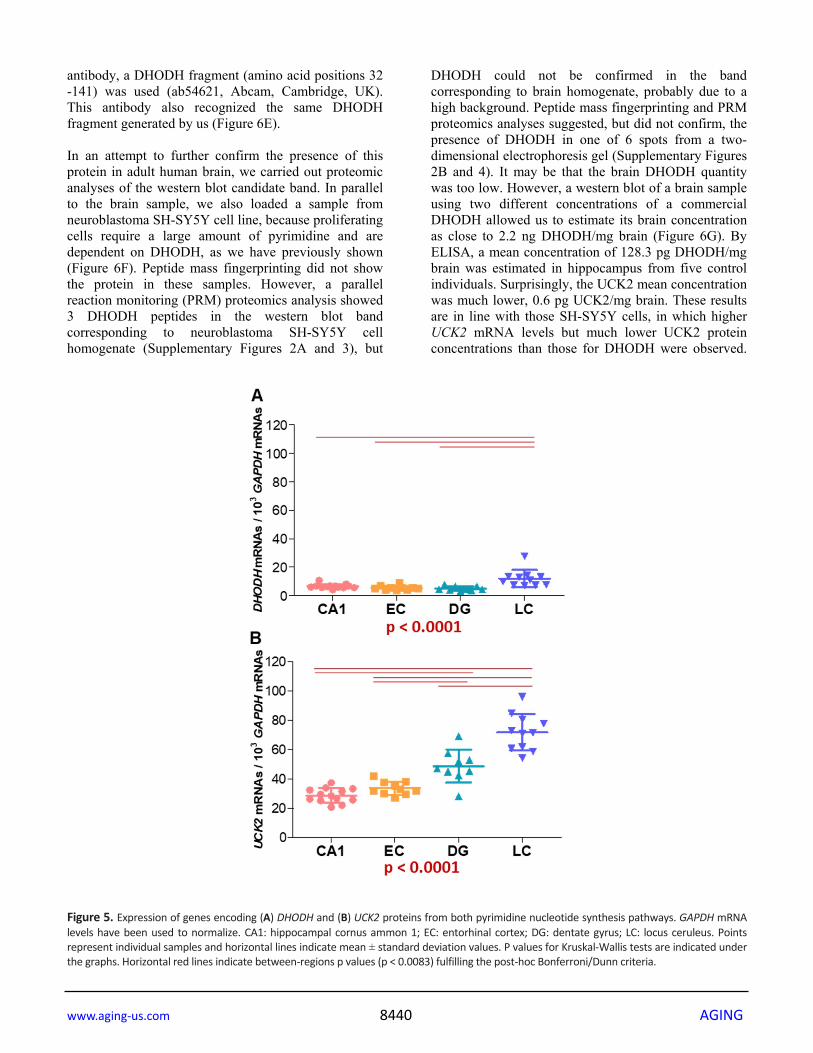
DHODH activity DHODH histochemistry analysis in adult rat brain showed high staining in different regions, with the hippocampus presenting a characteristic pattern [38]. We could not get optimally-cryopreserved adult human brain samples appropriate for histochemical studies. However, we detected high DHODH activity in adult mouse brain homogenate and Brequinar, a DHODH inhibitor, largely reduced the staining (Figure 7A–7C). Moreover, fresh samples from adult mouse brain consume significantly more oxygen when dihydroorotate was used as electron donor (Figure 7D). Leflunomide reduces oxygen consumption (Figure 7E). Similar to proliferating SH-SY5Y cells, in the absence of dihydroorotate, leflunomide was able to reduce oxygen consumption to a residual 60 %. This result highlights the importance of de novo pyrimidine biosynthesis pathway in adult brain, not only for pyrimidine production, but also for OXPHOS function. Supporting our results on adult brain DHODH activity, in the 1960s and 1970s, different publications showed the presence of the de novo pyrimidine biosynthesis
pathway in adult mouse, rat, and cat brain. Thus, the intracranial injection of radioactive intermediates for this pathway resulted in an early appearance of radioactive pyrimidine nucleotides in the brain [39–41]. Moreover, administration of these radioactive compounds to adult rat brain sections or homogenates also produced radioactive pyrimidine nucleotides [40, 42–48]. Finally, high DHODH activity was found in adult rat brain homogenate [49]. DHODH immunohistochemistry Previous results strongly suggested the presence of the de novo pyrimidine biosynthesis pathway in adult human brain. However, these results did not indicate in which cell type this route was expressed. Immunocytochemical staining with anti-DHODH antibody confirmed DHODH in frontal cortex, hippocampus, striatum, and substantia nigra pars reticulate in the adult rat brain. Immunoreactivity was found in neuronal bodies and absent in neuroglia [38]. Moreover, neuronal incorporation of radioactive orotic acid intraventricularly injected into adult rat brain was higher than into glial cells [50].
Figure 6. Western blot detection of selected proteins from the de novo pyrimidine biosynthesis pathway in adult human brain. (A) CAD protein in 40 and 80 μg of brain sample, B1 and B2, respectively. (B) DHODH protein in 180 μg of brain (B) protein using polyclonal antibody. Lane E: commercial DHODH enzyme lacking its 31 first amino acids (250 ng of protein). (C) DHODH protein in hippocampus (H, 100 μg of protein), entorhinal cortex (EC, 180 μg of protein) and putamen (P, 180 μg of protein) using polyclonal antibody. White arrows indicate the corresponding band for DHODH. (D) DHODH protein using monoclonal antibody for detection of commercial enzyme lacking its first 31 amino acids (E, 250 ng of protein) and in 40 and 80 μg of brain sample, B1 and B2, respectively. (E) Fragment of DHODH protein used as immunogen to produce the monoclonal antibody. NT and T homogenates of untransformed bacteria and bacteria transformed with the DHODH fragment sequence, respectively. S and P: supernatant and pellet, respectively. (F) DHODH protein in neuroblastoma SH-SY5Y cell line (70 μg of protein) and brain tissue (B, 250 μg of protein) using polyclonal antibody. (G) Quantification of brain DHODH protein with the polyclonal antibody in brain (B, 180 μg of protein) by comparison with the commercial enzyme lacking its first 31 amino acids at 0.4 and 4.0 ng (E1 and E2), respectively. M: molecular weight marker.
www.aging-us.com 8442 AGING
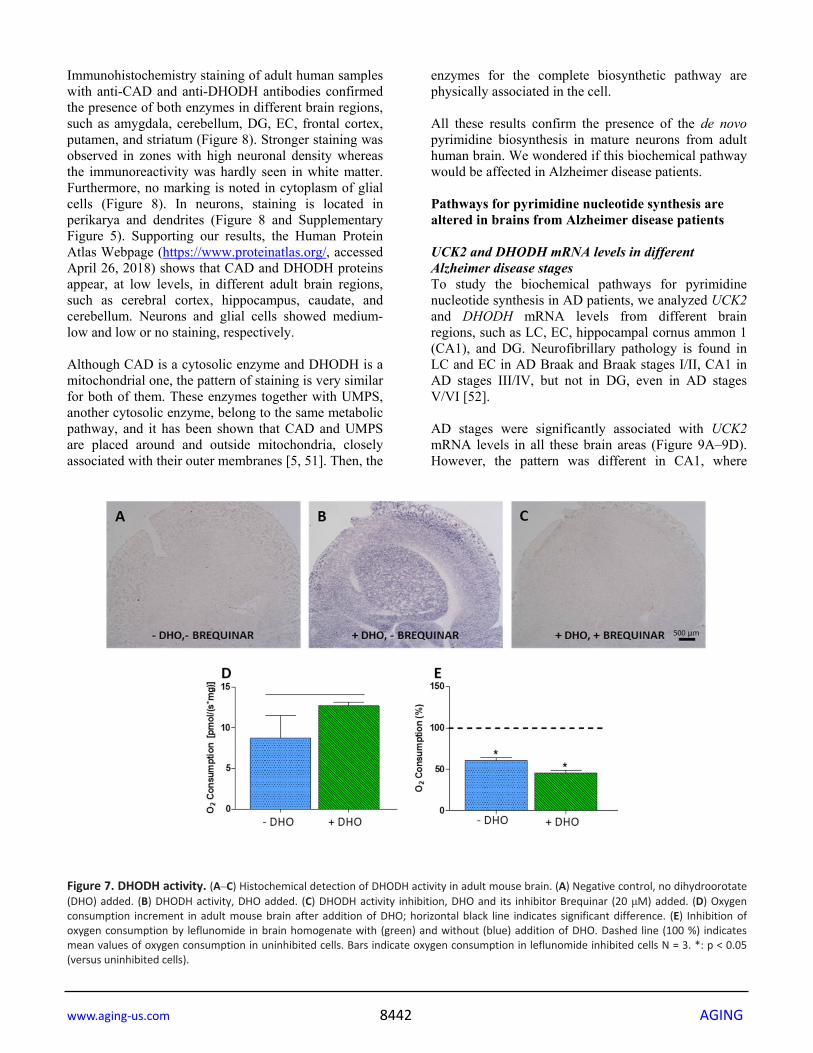
Immunohistochemistry staining of adult human samples with anti-CAD and anti-DHODH antibodies confirmed the presence of both enzymes in different brain regions, such as amygdala, cerebellum, DG, EC, frontal cortex, putamen, and striatum (Figure 8). Stronger staining was observed in zones with high neuronal density whereas the immunoreactivity was hardly seen in white matter. Furthermore, no marking is noted in cytoplasm of glial cells (Figure 8). In neurons, staining is located in perikarya and dendrites (Figure 8 and Supplementary Figure 5). Supporting our results, the Human Protein Atlas Webpage (https://www.proteinatlas.org/, accessed April 26, 2018) shows that CAD and DHODH proteins appear, at low levels, in different adult brain regions, such as cerebral cortex, hippocampus, caudate, and cerebellum. Neurons and glial cells showed medium-low and low or no staining, respectively. Although CAD is a cytosolic enzyme and DHODH is a mitochondrial one, the pattern of staining is very similar for both of them. These enzymes together with UMPS, another cytosolic enzyme, belong to the same metabolic pathway, and it has been shown that CAD and UMPS are placed around and outside mitochondria, closely associated with their outer membranes [5, 51]. Then, the
enzymes for the complete biosynthetic pathway are physically associated in the cell. All these results confirm the presence of the de novo pyrimidine biosynthesis in mature neurons from adult human brain. We wondered if this biochemical pathway would be affected in Alzheimer disease patients. Pathways for pyrimidine nucleotide synthesis are altered in brains from Alzheimer disease patients UCK2 and DHODH mRNA levels in different Alzheimer disease stages To study the biochemical pathways for pyrimidine nucleotide synthesis in AD patients, we analyzed UCK2 and DHODH mRNA levels from different brain regions, such as LC, EC, hippocampal cornus ammon 1 (CA1), and DG. Neurofibrillary pathology is found in LC and EC in AD Braak and Braak stages I/II, CA1 in AD stages III/IV, but not in DG, even in AD stages V/VI [52]. AD stages were significantly associated with UCK2 mRNA levels in all these brain areas (Figure 9A–9D). However, the pattern was different in CA1, where
Figure 7. DHODH activity. (A–C) Histochemical detection of DHODH activity in adult mouse brain. (A) Negative control, no dihydroorotate (DHO) added. (B) DHODH activity, DHO added. (C) DHODH activity inhibition, DHO and its inhibitor Brequinar (20 μM) added. (D) Oxygen consumption increment in adult mouse brain after addition of DHO; horizontal black line indicates significant difference. (E) Inhibition of oxygen consumption by leflunomide in brain homogenate with (green) and without (blue) addition of DHO. Dashed line (100 %) indicates mean values of oxygen consumption in uninhibited cells. Bars indicate oxygen consumption in leflunomide inhibited cells N = 3. *: p < 0.05 (versus uninhibited cells).

www.aging-us.com 8443 AGING
higher levels were found in more severe AD stages, than in the other regions, where UCK2 mRNAs tended to decrease as neuropathology progressed. A potential explanation, already pointed out to justify lower CA1 mitochondrial DNA (mtDNA) deletion levels [53], would be that a selective and progressive apoptosis of CA1 neurons with decreasing UCK2 mRNA levels may shift the pattern towards an apparent increase of ‘healthy’ cells. In contrast, DHODH mRNA levels were not associated with AD stages (Figure 9E–9H). These results resemble those previously found in KCN-treated SH-SY5Y cells, in which energy stress provoked a decrease in UCK2 mRNA levels but did not modify DHODH mRNA levels (Figure 4D), and the same explanation might be advanced. Despite this, and except for LC, positive correlations between DHODH and UCK2 mRNA levels were observed in these regions (Figure 9I–9L), thus suggesting that both pathways are essential.
Associations between these mRNA levels and AD stages are not due to unbalanced sex or postmortem delay distributions. No association was found between AD stages and RNA integrity number (RIN) values. AD stages and age are significantly associated [54]. Although there were no significant correlations between age and DHODH mRNA levels, age and UCK2 mRNA levels were significantly correlated (Supplementary Figure 6A–6H). These correlations were negative in LC, EC, and DG, and positive for CA1. To evaluate the relevance of AD stages versus age on UCK2 mRNA levels, we divided individuals according to their UCK2 mRNA levels (higher and lower half) for each brain region and AD stage, and compared their ages (Supplementary Figure 6I–6L). Except for DG AD I/II stages, there were no significant differences. This result suggests that variation in UCK2 mRNA levels is more dependent on AD stage than on age.
Figure 8. Immunohistochemical detection of neuronal CAD (A–F) and DHODH (G–L) in adult non-AD human brain. (A, G) Negative control. No primary antibody. (B, H) Positive control. (C, I) Dentate gyrus. (D, J) Granular layer of dentate gyrus. (E, K) Frontal cortex. (F, L) Entorhinal cortex. Scale bar in L represents 1000 μm in C and I; 100 μm in A, B, D, E, G, H, J and K; and 20 μm in F and L.

www.aging-us.com 8444 AGING
If lower UCK2 mRNA levels in different brain regions correspond with a decrease in pyrimidine synthesis pathway, and, as it has been recently reported, AD subjects show lower uridine concentrations in plasma and cerebrospinal fluid [55–59], then AD patients probably have a cerebral deficiency in many cellular functions related to the metabolism of uridine. Therefore, it can be
suggested that uridine therapeutic administration would improve biochemical pathways related to brain function. In this line, uridine treatment attenuates the impairments in learning and memory observed in gerbil, stressed rat, and AD mouse models [27, 60–63]. Nutrient combinations including uridine supplementation have shown promising results in AD therapy [64–69].
Figure 9. mRNA levels of selected genes encoding proteins from both pyrimidine nucleotide synthesis pathways. Graphs represent mean ± standard deviation values of UCK2 (A–D), DHODH (E–H), and DHODH - UCK2 correlations (I–L); respectively. GAPDH mRNA levels have been used to normalize. CA1: hippocampal cornus ammon 1; EC: entorhinal cortex; DG: dentate gyrus; LC: locus ceruleus. Each point represents an individual sample. The p values for Kruskal-Wallis or ANOVA tests are indicated under the graphs. Red and black horizontal lines indicate significant p values, fulfilling (p < 0.0083, p < 0.0167 in LC) or no (p ≤ 0.05) the post-hoc Bonferroni/Dunn criteria.
www.aging-us.com 8445 AGING
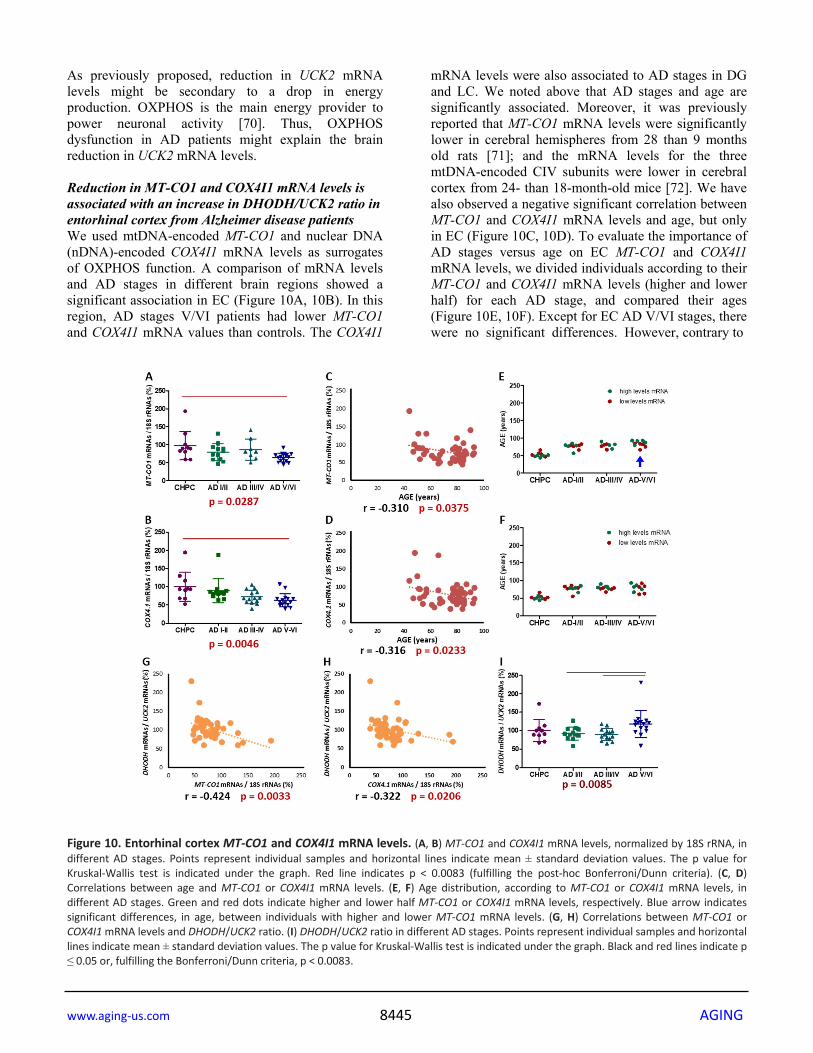
As previously proposed, reduction in UCK2 mRNA levels might be secondary to a drop in energy production. OXPHOS is the main energy provider to power neuronal activity [70]. Thus, OXPHOS dysfunction in AD patients might explain the brain reduction in UCK2 mRNA levels. Reduction in MT-CO1 and COX4I1 mRNA levels is associated with an increase in DHODH/UCK2 ratio in entorhinal cortex from Alzheimer disease patients We used mtDNA-encoded MT-CO1 and nuclear DNA (nDNA)-encoded COX4I1 mRNA levels as surrogates of OXPHOS function. A comparison of mRNA levels and AD stages in different brain regions showed a significant association in EC (Figure 10A, 10B). In this region, AD stages V/VI patients had lower MT-CO1 and COX4I1 mRNA values than controls. The COX4I1
mRNA levels were also associated to AD stages in DG and LC. We noted above that AD stages and age are significantly associated. Moreover, it was previously reported that MT-CO1 mRNA levels were significantly lower in cerebral hemispheres from 28 than 9 months old rats [71]; and the mRNA levels for the three mtDNA-encoded CIV subunits were lower in cerebral cortex from 24- than 18-month-old mice [72]. We have also observed a negative significant correlation between MT-CO1 and COX4I1 mRNA levels and age, but only in EC (Figure 10C, 10D). To evaluate the importance of AD stages versus age on EC MT-CO1 and COX4I1 mRNA levels, we divided individuals according to their MT-CO1 and COX4I1 mRNA levels (higher and lower half) for each AD stage, and compared their ages (Figure 10E, 10F). Except for EC AD V/VI stages, there were no significant differences. However, contrary to
Figure 10. Entorhinal cortex MT-CO1 and COX4I1 mRNA levels. (A, B) MT-CO1 and COX4I1 mRNA levels, normalized by 18S rRNA, in different AD stages. Points represent individual samples and horizontal lines indicate mean ± standard deviation values. The p value for Kruskal-Wallis test is indicated under the graph. Red line indicates p < 0.0083 (fulfilling the post-hoc Bonferroni/Dunn criteria). (C, D) Correlations between age and MT-CO1 or COX4I1 mRNA levels. (E, F) Age distribution, according to MT-CO1 or COX4I1 mRNA levels, in different AD stages. Green and red dots indicate higher and lower half MT-CO1 or COX4I1 mRNA levels, respectively. Blue arrow indicates significant differences, in age, between individuals with higher and lower MT-CO1 mRNA levels. (G, H) Correlations between MT-CO1 or COX4I1 mRNA levels and DHODH/UCK2 ratio. (I) DHODH/UCK2 ratio in different AD stages. Points represent individual samples and horizontal lines indicate mean ± standard deviation values. The p value for Kruskal-Wallis test is indicated under the graph. Black and red lines indicate p ≤ 0.05 or, fulfilling the Bonferroni/Dunn criteria, p < 0.0083.
www.aging-us.com 8446 AGING
what would be expected, and what is observed in the correlation, the youngest individuals had lower MT-CO1 mRNA levels. This result suggests that variation in MT-CO1 and COX4I1 mRNA levels is more dependent on AD stage than on age. A decrease in mRNA levels for mtDNA-encoded CIV subunits has also previously been described in some brain regions of AD patients [73–82]. Furthermore, low mRNA levels from nDNA-encoded CIV genes were informed in AD patients [82–86]. This reduction in mRNA levels for CIV subunits is probably responsible for the widely reported brain CIV deficit in many AD patients [75, 87–108]. Interestingly, in EC, MT-CO1 and COX4I1 mRNA levels negatively correlate with DHODH/UCK2 ratio (Figure 10G, 10H). In EC, this ratio was associated with AD stages (Figure 10I), and was significantly higher in AD stages V/VI than that in I/II and III/IV. The ratio did not correlate with age. The higher DHODH/UCK2 ratio in EC of AD stages V/VI is perhaps an attempt to compensate for a reduction in energy production by a CIV defect. As down-regulation of the de novo pathway might affect many vital reactions, because of its importance for OXPHOS function, a reduction in the salvage pathway, to avoid dispensable ATP consumption, would cause a higher DHODH/UCK2 ratio. As a conclusion, our results confirm that an OXPHOS dysfunction, throughout an altered de novo pyrimidine biosynthesis pathway, can affect variables of post-mitotic cells, such as neuronal differentiation; that the de novo pyrimidine biosynthesis pathway is present in adult human brain; and that both de novo and salvage pyrimidine nucleotide synthesis pathways appear to be unbalanced in AD brain. However, more work is required to link these pathways for pyrimidine nucleotide synthesis to an OXPHOS defect in AD brain. In particular, the determination of pyrimidine nucleotide levels and DHODH and UCK2 activities in large numbers of AD brains could confirm our RNA results. METHODS Cells, culture conditions, and differentiation The human neuroblastoma SH-SY5Y cell line was obtained from Sigma-Aldrich (catalogue number 94030304, lot 13C014, P 17; St. Louis, MO, USA). These cells were cultured in Dulbecco’s modified Eagle’s medium (DMEM) containing 25 mM glucose, 4 mM L-glutamine, and 1 mM sodium pyruvate, supplemented with 10 % fetal bovine serum (FBS).
Differentiation was induced following optimized protocols [109], but instead of 25 mM glucose, we used 5 mM galactose media to enhance OXPHOS function. Cells were maintained at 37 °C in a humidified atmosphere of 5 % CO2. Three growth curves were performed for each condition, and each time point (from day 0 to day 12) was counted in triplicate. Human and mouse brains Brain samples from three healthy adult individuals were obtained from the Institute of Neuropathology HUB-ICO-IDIBELL Biobank following the guidelines of Spanish legislation on this matter and the approval of the local ethics committee. Mouse brain was obtained from C57BL/6J adult individuals (2 to 8 months) after the approval of the local ethics committee. Animals were killed by decapitation and the brain was immediately removed. For histochemistry analysis, brains were covered with optimal cutting temperature (OCT) compound and frozen at - 80 °C. For oxygen consumption studies, brains were used immediately after dissection. RNA analysis Brain RNA samples were obtained from the Institute of Neuropathology HUB-ICO-IDIBELL Biobank. The post-mortem interval between death and tissue processing was between 2 and 22 h 15 min. Processing of brain tissue has been detailed elsewhere [110]. Neuropathological diagnosis and staging of AD were based on the classification of Braak [52]. CHPC were middle-aged individuals (n = 20, 11 men, 9 women; age, 50.7 ± 7.2 years) with no neurological or mental disorders and without lesions on the neuropathological study. Four brain regions were examined: CA1, DG, EC, and LC. A summary of all analyzed individuals is provided (Supplementary Table 2). Not all regions were assessed in every case because of the limited availability of tissues. RNA purification RNA from frozen cells and tissue was extracted following the instructions of the supplier (NucleoSpin RNAII, Macherey-Nagelsupplier, Düren, Germany and RNeasy Mini Kit, Qiagen, Hilden, Germany). RIN and 28S/18S ratios were determined with the Agilent Bioanalyzer (Agilent Technologies, Inc., Santa Clara, CA). Samples were digested with DNase, and RNA concentration was evaluated using NanoDrop Spectrophotometer (Thermo Fisher Scientific, Waltham, MA).
www.aging-us.com 8447 AGING
qPCR The mRNA levels were measured with the RT-qPCR method using an Applied Biosystems StepOneTM Real-Time PCR System Thermal Cycling Block and a ViiA 7 Real-Time PCR system. DHODH, UCK2 and MT-CO1 mRNA levels were determined in triplicate with RT-qPCR using TaqPathTM 1-Step Multiplex Master Mix (DHODH and UCK2) and TaqMan® RNA-to-CT
TM 1-Step Kit (MT-CO1). The expression levels were normalized using GAPDH mRNA or 18S rRNA. Serial dilutions of recombinant plasmid DNA were included in each experiment to generate a standard curve for DHODH, UCK2, and GAPDH. Western blot and ELISA For immunoblot analysis, protein levels were analyzed in whole-cell lysates obtained using cell lysis buffer (RIPA) or in tissue homogenates obtained using glass potters at 500 rpm, with 10 strokes, and Tris-buffered saline (TBS). Samples were resolved on SDS-PAGE minigels (Miniprotean, Bio-Rad, Hercules, CA, USA) and were transferred to PVDF membranes (Trans-Blot®
Turbo™ Mini PVDF Transfer Pack, Bio-Rad) using a Trans-Blot® TurboTM Blotting System (Bio-Rad). Membranes were analyzed by immunoblotting with the following antibodies: rabbit polyclonal anti-DHODH (1:500) from biorbyt (orb247660, Cambridge, UK), rabbit mono and polyclonal anti-CAD (1:500), mouse monoclonal anti-DHODH (1:1,000), mouse polyclonal anti-UCK2 (1:250) from Abcam (ab40800, ab99312, ab54621, ab167683, Cambridge, UK), mouse anti-actin (1:1,000) from Sigma (A5441, St. Louis, MO, USA), and rabbit anti-CII (1:1,000) from Thermo Fisher Scientific (459200, Waltham, MA, USA). After washing, the membrane was incubated with peroxidase-conjugated secondary antibodies (1:5,000 or 1:10,000) from Thermo Fisher Scientific for 1 h at room temperature or it was incubated with appropriate secondary antibodies DyLight™ (SA535521, SA535571, 35568, 35518, Thermo Fisher Scientific). Bands were visualized with Super Signal West Pico Chemiluminescence Substrate from PIERCE® (Thermo Fisher Scientific) or using Odyssey® CLx Imaging System (LI-COR Biosciences, San Jose, CA, USA). The DHODH peptide corresponding to amino acids 32–141 was heterologously expressed in Escherichia coli strain C41 (DE3) as a recombinant peptide using pET28a expression vector. The quantitative determination of DHODH and UCK2 proteins was performed using commercially available Human Dihydroorotate Dehydrogenase (DHODH) ELISA kit and Human Uridine-Cytidine Kinase 2 (UCK2) ELISA kit (Abbexa, Cambridge, UK). Protein
extracts concentrations were measured by Bradford assay. Samples were collected and DHODH and UCK2 levels were immediately measured, following the manufacturer’s instructions. Histochemistry and immunohistochemistry Immunocytochemistry Cells were fixed with 4 % paraformaldehyde for 15 min at room temperature and permeabilized using 0.1 % Triton X-100 (Sigma-Aldrich) diluted in PBS for 10 min. To block unspecific epitopes, cells were incubated with 0.1 % bovine serum albumin. Primary antibodies (rabbit anti-TUBB3, 1:1,000, from Abcam and rabbit anti-TH, 1:200, from Sigma-Aldrich) were incubated overnight at 4 °C followed by incubation with appropriate fluorescently labeled secondary antibodies, Alexa Fluor® 488 and 594 (Molecular Probes, Eugene, Oregon, USA) for 1 h at room temperature. Finally, cell nuclei were counterstained with 4',6-diamidino-2-phenylindole (DAPI) (Sigma-Aldrich). Histochemistry DHODH histochemistry was performed using the nitroblue tetrazolium/formazan technique on 20 µm cryostat sections of adult mouse brain. The oxidation of its substrate dihydroorotate (DHO) (10 mM) can be determined by trapping the electrons with tetrazolium (1 mM) in the presence of cyanide (10 mM), to prevent their further flow along the chain to oxygen, in phosphate buffer pH 8, 37 °C, 60 min. The insoluble blue product formazan can be revealed by light microscopy [38]. Immunohistochemistry This protocol was performed at the Anatomic Pathology Core Unit of the Health Sciences Institute of Aragon (Zaragoza, Spain). Once paraffin blocks were made, 2.5 µm sections were cut with a rotation microtome (Leica RM2255) and paraffin sections were taken on superfrost glass slides. Slides were air dried at 37 °C overnight and, for immunohistochemistry stain, they were deparaffinized in xylene for 10 min, rehydrated in a grades series of ethanol (100, 100, 96, 70, 5 min each) and distilled water for 5 min. After rehydration, antigen retrieval was performed by means of the PT Link (Dako) at 95 °C for 20 min in a low/high pH buffer (Dako antigen retrieval, low/high pH). After retrieval, automated immunostaining was performed with a previously optimized protocol. For this process endogenous peroxidase was first blocked (EnVision FLEX Peroxidase-Blocking) followed by 5 min 2 washing steps (Dako wash buffer); mouse monoclonal anti-DHODH 1/50 and rabbit polyclonal anti-CAD 1/200 (ab54621, ab99312, Abcam, Cambridge, UK) primary antibodies were used with 40 min incubation

www.aging-us.com 8448 AGING
time. After 2 wash steps a dual rabbit/mouse HRP conjugated visualization system for signal amplification was used (Envision Flex HRP, Dako). After 3 wash steps (Dako wash buffer, 5 min each), 3,3'-Diaminobenzidine (DAB) was used for signal development after precipitation at primary antibody binding sites. The double staining of CAD, DHODH and UCK2 with NeuN and GFAP, was performed using commercially available PolyStain TS kit (NB-23-00131, Neo-Biotech, Nanterre, France). Anti-CAD, anti-DHODH and anti-UCK2 antibodies (ab99312, ab232767, ab60222, from Abcam) were incubated overnight at 4 °C at 1/50. Anti-NeuN (ab104224, Abcam) and anti-GFAP (G3893, Sigma) antibodies were incubated 2 h at 1/100. Flow cytometry Cell suspensions were first fixed with 4 % paraformaldehyde for 15 min at 4 °C and permeabilized using a commercial buffer (Thermo Fisher Scientific). Samples were incubated overnight with the primary antibodies rabbit anti-TUBB3 (1:1,000) from Abcam and rabbit anti-TH (1:200) from Sigma, and then washed with PBS (Thermo Fisher Scientific). Cells were incubated for 1 h with appropriate secondary antibodies Alexa 488 (Thermo Fisher Scientific), washed, and then analyzed on a BD FACScan System (Becton-Dickinson, San Jose, CA, USA). 10,000 cells were studied. The results were analyzed using Weasel software. Oxygen consumption Neuroblastoma SH-SY5Y cell line: Cells were cultured in 5 mM galactose media. The cells were then collected by trypsinization, washed, counted, and resuspended at 1.5 x 10⁶ cells/ml. Endogenous and inhibited respiration (with leflunomide or cyanide) analyses were performed. Each condition was analyzed three times. Mouse brain Brain was immediately obtained after animal death, dissected on ice, and weighed on an analytical balance. The dissected brain was directly transferred into ice-cold mitochondrial respiration medium (MIR05: 110 mM sucrose, 60 mM K+-lactobionate, 0,5 mM EGTA, 3 mM MgCl2, 20 mM taurine, 10 mM KH2PO4, 20 mM HEPES and 1 g/l BSA, pH 7.1). Tissues were homogenized in the same medium with a pre-cooled glass potter at 1,000 rpm, 16 strokes. Resulting homogenates containing 10 mg tissue wet weight were suspended in 1 ml of ice-cold MIR05. To measure the oxygen consumption in the presence of the substrate, MIR05 medium contained 6 mM of DHO. Endogenous and inhibited respiration (with
leflunomide) analyses were performed. Each condition was analyzed three times. Oxygen consumption of cells and mouse brain was analyzed using the high-resolution oxygraph OROBOROS®. Mass spectrometry analysis of protein spots Protein identification by peptide mass fingerprint Spots were excised from gels, reduced, alkylated and digested with trypsin sequencing grade (Roche Molecular Biochemicals) [111]. Produced peptides were analyzed in a 4800 Plus Proteomics Analyzer MALDI-TOF/TOF mass spectrometer (Applied Biosystems, MDS Sciex, Toronto, Canada) at the Proteomics Unit of Complutense University of Madrid. The MS data was searched against SwissProt Data Base with taxonomy restriction to human (553,231 sequences) using MASCOT 2.3 (http://www.matrixscience.com) search engine through Global Protein Server v 3.6 software (ABSciex). The search parameters were carbamidomethyl cysteine as fixed modification and oxidized methionine as variable modification. Peptide mass tolerance was 50 ppm and up to 1 missed trypsin cleavage site allowed. All identified protein outperformed the probability scores fixed by mascot as significant with a p-value minor than 0.05. Protein identification by PRM Desalted peptides from digested protein were analyzed by targeted proteomics to identify only the protein of interest in this study (PYRD or DHODH). The software Skyline 4.1 was used to build and optimize the PRM method for detection of unique peptides from DHODH [112]. An inclusion list consisted of m/z of resultant target candidates for each peptide was exported to Xcalibur 4.0 (Thermo Scientific) acquisition software of Q-Exactive HF mass spectrometer. The final PRM methods included one protein, 49 peptides and 112 precursors. The peptides for PRM were analyzed by nanoflow liquid chromatography-tandem mass spectrometry in an EASY-nLC 1000 System coupled to the Q-Exactive HF mass spectrometer through the Nano-Easy spray source (all from Thermo Scientific, Bremen, Germany). MS Data acquisition was performed in Q-Exactive HF using PRM method. Then Data were analyzed in Skyline software and identified with Mascot search engine thorough Proteome discoverer 2.2 software (Thermo Scientific). Peptides identifications based on MSMS data were used by skyline to generate a spectral library. To confirm DHODH detection, data were processed against the PRM-library on Skyline and manually inspected to ensure consistency between the transitions detected and the sequences of peptide searched.
www.aging-us.com 8449 AGING
Statistical analysis The statistical package StatView 6.0 and GraphPad Prism 5.0 were used to perform all the statistical analyses. The normality of distribution was analyzed with Kolmogorov-Smirnov test. Mann-Whitney or Kruskal-Wallis non-parametric tests were used when values did not follow a normal distribution, while the ANOVA test was used for normal variables. To compare more than two groups post-hoc tests were also performed. All data were expressed as mean ± standard deviation and significance levels were set at p < 0.05 and the levels indicated by the post-hoc tests. Statistical values in cell lines were obtained after three or more independent experiments. In each independent experiment, several technical replicates were performed. ACKNOWLEDGMENTS We wish to thank Dr. Javier Godino (Servicio de Separación Celular y Citometría, Instituto de Aragonés de Ciencias de la Salud, Zaragoza, Spain) for his assistance with flow cytometry analysis, Santiago Morales (Universidad de Zaragoza, Zaragoza, Spain) for his help with the figures, the Servicio General de Apoyo a la Investigación-SAI (Universidad de Zaragoza, Zaragoza, Spain) and T. Yohannan for editorial help. CONFLICTS OF INTEREST The authors declare no conflicts of interest. FUNDING This work was supported by the Instituto de Salud Carlos III (grant numbers PI17/00021 and PI17/00166); the Gobierno de Aragón (grant number LMP135_18 and Grupos de Referencia B33_17R) and FEDER 2014-2020 “Construyendo Europa desde Aragón”. We also thank CIBERER and CIBERNED, Institute of Health Carlos III (ISCIII) for cooperation support. REFERENCES 1. Hardy JA, Higgins GA. Alzheimer’s disease: the amyloid
cascade hypothesis. Science. 1992; 256:184–85. https://doi.org/10.1126/science.1566067
PMID:1566067
2. Swerdlow RH, Khan SM. A “mitochondrial cascade hypothesis” for sporadic Alzheimer’s disease. Med Hypotheses. 2004; 63:8–20.
https://doi.org/10.1016/j.mehy.2003.12.045 PMID:15193340
3. Wilkins HM, Swerdlow RH. Amyloid precursor protein processing and bioenergetics. Brain Res Bull. 2017;
133:71–79. https://doi.org/10.1016/j.brainresbull.2016.08.009
PMID:27545490
4. Martínez-Romero I, Emperador S, Llobet L, Montoya J, Ruiz-Pesini E. Mitogenomics: recognizing the significance of mitochondrial genomic variation for personalized medicine. Curr Pharmacogenomics Person Med. 2011; 9:84–93.
https://doi.org/10.2174/187569211795508457
5. Evans DR, Guy HI. Mammalian pyrimidine biosynthesis: fresh insights into an ancient pathway. J Biol Chem. 2004; 279:33035–38.
https://doi.org/10.1074/jbc.R400007200 PMID:15096496
6. Okesli A, Khosla C, Bassik MC. Human pyrimidine nucleotide biosynthesis as a target for antiviral chemotherapy. Curr Opin Biotechnol. 2017; 48:127–34.
https://doi.org/10.1016/j.copbio.2017.03.010 PMID:28458037
7. Pfenninger KH. Plasma membrane expansion: a neuron’s Herculean task. Nat Rev Neurosci. 2009; 10:251–61.
https://doi.org/10.1038/nrn2593 PMID:19259102
8. Pacelli C, Giguère N, Bourque MJ, Lévesque M, Slack RS, Trudeau LE. Elevated mitochondrial bioenergetics and axonal arborization size are key contributors to the vulnerability of dopamine neurons. Curr Biol. 2015; 25:2349–60.
https://doi.org/10.1016/j.cub.2015.07.050 PMID:26320949
9. Pesini A, Iglesias E, Garrido N, Bayona-Bafaluy MP, Montoya J, Ruiz-Pesini E. OXPHOS, pyrimidine nucleotides, and Alzheimer’s disease: a pharmacogenomics approach. J Alzheimers Dis. 2014; 42:87–96.
https://doi.org/10.3233/JAD-140384 PMID:25024340
10. Selkoe DJ. Alzheimer’s disease is a synaptic failure. Science. 2002; 298:789–91.
https://doi.org/10.1126/science.1074069 PMID:12399581
11. Meinsma R, van Kuilenburg AB. Purification, activity, and expression levels of two uridine-cytidine kinase isoforms in neuroblastoma cell lines. Nucleosides Nucleotides Nucleic Acids. 2016; 35:613–18.
https://doi.org/10.1080/15257770.2015.1124998 PMID:27906629
12. Zhang C, Chu M. Leflunomide: A promising drug with good antitumor potential. Biochem Biophys Res Commun. 2018; 496:726–30.
https://doi.org/10.1016/j.bbrc.2018.01.107 PMID:29357281
www.aging-us.com 8450 AGING
13. Hail N Jr, Chen P, Bushman LR. Teriflunomide (leflunomide) promotes cytostatic, antioxidant, and apoptotic effects in transformed prostate epithelial cells: evidence supporting a role for teriflunomide in prostate cancer chemoprevention. Neoplasia. 2010; 12:464–75.
https://doi.org/10.1593/neo.10168 PMID:20563249
14. Greene S, Watanabe K, Braatz-Trulson J, Lou L. Inhibition of dihydroorotate dehydrogenase by the immunosuppressive agent leflunomide. Biochem Pharmacol. 1995; 50:861–67.
https://doi.org/10.1016/0006-2952(95)00255-X PMID:7575649
15. Spodnik JH, Wozniak M, Budzko D, Teranishi MA, Karbowski M, Nishizawa Y, Usukura J, Wakabayashi T. Mechanism of leflunomide-induced proliferation of mitochondria in mammalian cells. Mitochondrion. 2002; 2:163–79.
https://doi.org/10.1016/S1567-7249(02)00045-4 PMID:16120318
16. Beuneu C, Auger R, Löffler M, Guissani A, Lemaire G, Lepoivre M. Indirect inhibition of mitochondrial dihydroorotate dehydrogenase activity by nitric oxide. Free Radic Biol Med. 2000; 28:1206–13.
https://doi.org/10.1016/S0891-5849(00)00239-2 PMID:10889450
17. Hail N Jr, Chen P, Kepa JJ, Bushman LR, Shearn C. Dihydroorotate dehydrogenase is required for N-(4-hydroxyphenyl)retinamide-induced reactive oxygen species production and apoptosis. Free Radic Biol Med. 2010; 49:109–16.
https://doi.org/10.1016/j.freeradbiomed.2010.04.006 PMID:20399851
18. Ashton TM, Fokas E, Kunz-Schughart LA, Folkes LK, Anbalagan S, Huether M, Kelly CJ, Pirovano G, Buffa FM, Hammond EM, Stratford M, Muschel RJ, Higgins GS, McKenna WG. The anti-malarial atovaquone increases radiosensitivity by alleviating tumour hypoxia. Nat Commun. 2016; 7:12308.
https://doi.org/10.1038/ncomms12308 PMID:27453292
19. Goda K, Takahashi T, Kobayashi A, Shoda T, Kuno H, Sugai S. Usefulness of in vitro combination assays of mitochondrial dysfunction and apoptosis for the estimation of potential risk of idiosyncratic drug induced liver injury. J Toxicol Sci. 2016; 41:605–15.
https://doi.org/10.2131/jts.41.605 PMID:27665770
20. Klotz L, Eschborn M, Lindner M, Liebmann M, Herold M, Janoschka C, Torres Garrido B, Schulte-Mecklenbeck A, Gross CC, Breuer J, Hundehege P, Posevitz V, Pignolet B, et al. Teriflunomide treatment for multiple sclerosis modulates T cell mitochondrial respiration with affinity-dependent effects. Sci Transl
Med. 2019; 11:eaao5563. https://doi.org/10.1126/scitranslmed.aao5563
PMID:31043571
21. Fang J, Uchiumi T, Yagi M, Matsumoto S, Amamoto R, Takazaki S, Yamaza H, Nonaka K, Kang D. Dihydro-orotate dehydrogenase is physically associated with the respiratory complex and its loss leads to mitochondrial dysfunction. Biosci Rep. 2013; 33:e00021.
https://doi.org/10.1042/BSR20120097 PMID:23216091
22. Fang J, Yamaza H, Uchiumi T, Hoshino Y, Masuda K, Hirofuji Y, Wagener FA, Kang D, Nonaka K. Dihydroorotate dehydrogenase depletion hampers mitochondrial function and osteogenic differentiation in osteoblasts. Eur J Oral Sci. 2016; 124:241–45.
https://doi.org/10.1111/eos.12270 PMID:27086500
23. Le TT, Urasaki Y, Pizzorno G. Uridine prevents tamoxifen-induced liver lipid droplet accumulation. BMC Pharmacol Toxicol. 2014; 15:27.
https://doi.org/10.1186/2050-6511-15-27 PMID:24887406
24. Löffler M, Jöckel J, Schuster G, Becker C. Dihydroorotat-ubiquinone oxidoreductase links mitochondria in the biosynthesis of pyrimidine nucleotides. Mol Cell Biochem. 1997; 174:125–29.
https://doi.org/10.1023/A:1006859115450 PMID:9309676
25. Bezawork-Geleta A, Wen H, Dong L, Yan B, Vider J, Boukalova S, Krobova L, Vanova K, Zobalova R, Sobol M, Hozak P, Novais SM, Caisova V, et al. Alternative assembly of respiratory complex II connects energy stress to metabolic checkpoints. Nat Commun. 2018; 9:2221.
https://doi.org/10.1038/s41467-018-04603-z PMID:29880867
26. Garcia RA, Liu L, Hu Z, Gonzalez A, von Borstel RW, Saydoff JA. Severe cytochrome c oxidase inhibition in vivo does not induce a pyrimidine deficiency; neuroprotective action of oral uridine prodrug PN401 requires supraphysiological levels of uridine. Brain Res. 2005; 1066:164–71.
https://doi.org/10.1016/j.brainres.2005.10.056 PMID:16330000
27. Saydoff JA, Olariu A, Sheng J, Hu Z, Li Q, Garcia R, Pei J, Sun GY, von Borstel R. Uridine prodrug improves memory in Tg2576 and TAPP mice and reduces pathological factors associated with Alzheimer’s disease in related models. J Alzheimers Dis. 2013; 36:637–57.
https://doi.org/10.3233/JAD-130059 PMID:23648515
28. Wang L, Pooler AM, Albrecht MA, Wurtman RJ. Dietary uridine-5′-monophosphate supplementation increases potassium-evoked dopamine release and promotes
www.aging-us.com 8451 AGING
neurite outgrowth in aged rats. J Mol Neurosci. 2005; 27:137–45.
https://doi.org/10.1385/JMN:27:1:137 PMID:16055952
29. Silei V, Politi V, Lauro GM. Uridine induces differentiation in human neuroblastoma cells via protein kinase C epsilon. J Neurosci Res. 2000; 61:206–11.
https://doi.org/10.1002/1097-4547(20000715)61:2<206::AID-JNR11>3.0.CO;2-B PMID:10878593
30. Pooler AM, Guez DH, Benedictus R, Wurtman RJ. Uridine enhances neurite outgrowth in nerve growth factor-differentiated PC12 [corrected]. Neuroscience. 2005; 134:207–14.
https://doi.org/10.1016/j.neuroscience.2005.03.050 PMID:15939540
31. Phan CW, David P, Wong KH, Naidu M, Sabaratnam V. Uridine from Pleurotus giganteus and its neurite outgrowth stimulatory effects with underlying mechanism. PLoS One. 2015; 10:e0143004.
https://doi.org/10.1371/journal.pone.0143004 PMID:26565787
32. Yuzwa SA, Vocadlo DJ. O-GlcNAc and neurodegeneration: biochemical mechanisms and potential roles in Alzheimer’s disease and beyond. Chem Soc Rev. 2014; 43:6839–58.
https://doi.org/10.1039/C4CS00038B PMID:24759912
33. Hardivillé S, Hart GW. Nutrient regulation of gene expression by O-GlcNAcylation of chromatin. Curr Opin Chem Biol. 2016; 33:88–94.
https://doi.org/10.1016/j.cbpa.2016.06.005 PMID:27322399
34. Yang X, Qian K. Protein O-GlcNAcylation: emerging mechanisms and functions. Nat Rev Mol Cell Biol. 2017; 18:452–65.
https://doi.org/10.1038/nrm.2017.22 PMID:28488703
35. Sykes DB. The emergence of dihydroorotate dehydrogenase (DHODH) as a therapeutic target in acute myeloid leukemia. Expert Opin Ther Targets. 2018; 22:893–98.
https://doi.org/10.1080/14728222.2018.1536748 PMID:30318938
36. Löffler M, Carrey EA, Zameitat E. New perspectives on the roles of pyrimidines in the central nervous system. Nucleosides Nucleotides Nucleic Acids. 2018; 37:290–306.
https://doi.org/10.1080/15257770.2018.1453076 PMID:29693489
37. Gerlach J, Löffler M, Schäfer MK. Gene expression of enzymes required for the de novo synthesis and degradation of pyrimidines in rat peripheral tissues and brain. Nucleosides Nucleotides Nucleic Acids.
2011; 30:1147–54. https://doi.org/10.1080/15257770.2011.603712
PMID:22132969
38. Schaefer CM, Schäfer MK, Löfflerr M. Region-specific distribution of dihydroorotate dehydrogenase in the rat central nervous system points to pyrimidine de novo synthesis in neurons. Nucleosides Nucleotides Nucleic Acids. 2010; 29:476–81.
https://doi.org/10.1080/15257771003730128 PMID:20544541
39. Murakami WT, Visser DW, Pearson HE. Incorporation of L-carbamyl-C14-aspartate into acid-soluble pyrimidine nucleotides of mouse brain. Proc Soc Exp Biol Med. 1959; 100:463–67.
https://doi.org/10.3181/00379727-100-24663 PMID:13634174
40. Wells W, Gaines D, Koenig H. Studies of pyrimidine nucleotide metabolism in the central nervous system-I. Metabolic effects and metabolism of 6-Azauridine. J Neurochem. 1963; 10:709–23.
https://doi.org/10.1111/j.1471-4159.1963.tb08927.x PMID:14087684
41. Adams DH. Some observations on the incorporation of precursors into ribonucleic acid of rat brain. J Neurochem. 1965; 12:783–90.
https://doi.org/10.1111/j.1471-4159.1965.tb10262.x PMID:5843548
42. Hogans AF, Guroff G, Udenfriend S. Studies on the origin of pyrimidines for biosynthesis of neural RNA in the rat. J Neurochem. 1971; 18:1699–710.
https://doi.org/10.1111/j.1471-4159.1971.tb03744.x PMID:5571109
43. Bourget PA, Tremblay GC. Pyrimidine biosynthesis in rat brain. J Neurochem. 1972; 19:1617–24.
https://doi.org/10.1111/j.1471-4159.1972.tb06207.x PMID:5042467
44. Pausch J, Keppler D, Decker K. [Significance of enzyme activity in pyrimidine biosynthesis for the development of galactosamine liver lesions]. Verh Dtsch Ges Inn Med. 1972; 78:1375–77.
https://doi.org/10.1007/978-3-642-85448-4_337 PMID:4665550
45. Tremblay GC, Jimenez U, Crandall DE. Pyrimidine biosynthesis and its regulation in the developing rat brain. J Neurochem. 1976; 26:57–64.
PMID:1255184
46. Potvin BW, Stern HJ, May SR, Lam GF, Krooth RS. Inhibition by barbituric acid and its derivatives of the enzymes in rat brain which participate in the synthesis of pyrimidine ribotides. Biochem Pharmacol. 1978; 27:655–65.
www.aging-us.com 8452 AGING
https://doi.org/10.1016/0006-2952(78)90501-4 PMID:26347
47. Skaper SD, O’Brien WE, Schafer IA. The influence of ammonia on purine and pyrimidine nucleotide biosynthesis in rat liver and brain in vitro. Biochem J. 1978; 172:457–64.
https://doi.org/10.1042/bj1720457 PMID:687355
48. Peters GJ, Veerkamp JH. Pyrimidine metabolism in rat brain cortex and liver. Adv Exp Med Biol. 1984; 165 Pt A:531–534.
https://doi.org/10.1007/978-1-4684-4553-4_102 PMID:6720417
49. Kennedy J. Distribution, subcellular localization, and product inhibition of dihydroorotate oxidation in the rat. Arch Biochem Biophys. 1973; 157:369–73.
https://doi.org/10.1016/0003-9861(73)90651-6 PMID:4730799
50. Pohle W, Kammerer E, Schulzeck S, Popov N, Matthies H. [Modification of kidney function by orotic acid in acute and chronic administration]. Acta Biol Med Ger. 1974; 33:211–22.
PMID:4463637
51. Carrey EA, Dietz C, Glubb DM, Löffler M, Lucocq JM, Watson PF. Detection and location of the enzymes of de novo pyrimidine biosynthesis in mammalian spermatozoa. Reproduction. 2002; 123:757–68.
https://doi.org/10.1530/rep.0.1230757 PMID:12052230
52. Braak H, Braak E. Neuropathological stageing of Alzheimer-related changes. Acta Neuropathol. 1991; 82:239–59.
https://doi.org/10.1007/BF00308809 PMID:1759558
53. Gerschütz A, Heinsen H, Grünblatt E, Wagner AK, Bartl J, Meissner C, Fallgatter AJ, Al-Sarraj S, Troakes C, Ferrer I, Arzberger T, Deckert J, Riederer P, et al. Neuron-specific mitochondrial DNA deletion levels in sporadic Alzheimer’s disease. Curr Alzheimer Res. 2013; 10:1041–46.
https://doi.org/10.2174/15672050113106660166 PMID:24156256
54. Braak H, Thal DR, Ghebremedhin E, Del Tredici K. Stages of the pathologic process in Alzheimer disease: age categories from 1 to 100 years. J Neuropathol Exp Neurol. 2011; 70:960–69.
https://doi.org/10.1097/NEN.0b013e318232a379 PMID:22002422
55. Czech C, Berndt P, Busch K, Schmitz O, Wiemer J, Most V, Hampel H, Kastler J, Senn H. Metabolite profiling of Alzheimer’s disease cerebrospinal fluid. PLoS One. 2012; 7:e31501.
https://doi.org/10.1371/journal.pone.0031501 PMID:22359596
56. Olde Rikkert MG, Verhey FR, Sijben JW, Bouwman FH, Dautzenberg PL, Lansink M, Sipers WM, van Asselt DZ, van Hees AM, Stevens M, Vellas B, Scheltens P. Differences in nutritional status between very mild Alzheimer’s disease patients and healthy controls. J Alzheimers Dis. 2014; 41:261–71.
https://doi.org/10.3233/JAD-131892 PMID:24614903
57. Wang G, Zhou Y, Huang FJ, Tang HD, Xu XH, Liu JJ, Wang Y, Deng YL, Ren RJ, Xu W, Ma JF, Zhang YN, Zhao AH, et al. Plasma metabolite profiles of Alzheimer’s disease and mild cognitive impairment. J Proteome Res. 2014; 13:2649–58.
https://doi.org/10.1021/pr5000895 PMID:24694177
58. van Wijk N, Slot RE, Duits FH, Strik M, Biesheuvel E, Sijben JW, Blankenstein MA, Bierau J, van der Flier WM, Scheltens P, Teunissen CE. Nutrients required for phospholipid synthesis are lower in blood and cerebrospinal fluid in mild cognitive impairment and Alzheimer’s disease dementia. Alzheimers Dement (Amst). 2017; 8:139–46.
https://doi.org/10.1016/j.dadm.2017.04.005 PMID:28653034
59. Gross TJ, Doran E, Cheema AK, Head E, Lott IT, Mapstone M. Plasma metabolites related to cellular energy metabolism are altered in adults with Down syndrome and Alzheimer’s disease. Dev Neurobiol. 2019; 79:622–38.
https://doi.org/10.1002/dneu.22716 PMID:31419370
60. Drago F, D’Agata V, Valerio C, Spadaro F, Raffaele R, Nardo L, Grassi M, Freni V. Memory deficits of aged male rats can be improved by pyrimidine nucleosides and n-acetyl-glutamine. Clin Neuropharmacol. 1990; 13:290–96.
https://doi.org/10.1097/00002826-199008000-00002 PMID:2208180
61. Teather LA, Wurtman RJ. Chronic administration of UMP ameliorates the impairment of hippocampal-dependent memory in impoverished rats. J Nutr. 2006; 136:2834–37.
https://doi.org/10.1093/jn/136.11.2834 PMID:17056809
62. Holguin S, Martinez J, Chow C, Wurtman R. Dietary uridine enhances the improvement in learning and memory produced by administering DHA to gerbils. FASEB J. 2008; 22:3938–46.
https://doi.org/10.1096/fj.08-112425 PMID:18606862
63. Goren B, Cakir A, Ocalan B, Serter Kocoglu S, Alkan T, Cansev M, Kahveci N. Long-term cognitive effects of uridine treatment in a neonatal rat model of hypoxic-ischemic encephalopathy. Brain Res. 2017; 1659:81–87.
https://doi.org/10.1016/j.brainres.2017.01.026 PMID:28126402
www.aging-us.com 8453 AGING
64. de Waal H, Stam CJ, Lansbergen MM, Wieggers RL, Kamphuis PJ, Scheltens P, Maestú F, van Straaten EC. The effect of souvenaid on functional brain network organisation in patients with mild Alzheimer’s disease: a randomised controlled study. PLoS One. 2014; 9:e86558.
https://doi.org/10.1371/journal.pone.0086558 PMID:24475144
65. Engelborghs S, Gilles C, Ivanoiu A, Vandewoude M. Rationale and clinical data supporting nutritional intervention in Alzheimer’s disease. Acta Clin Belg. 2014; 69:17–24.
https://doi.org/10.1179/0001551213Z.0000000006 PMID:24635394
66. Ritchie CW, Bajwa J, Coleman G, Hope K, Jones RW, Lawton M, Marven M, Passmore P. Souvenaid®: a new approach to management of early Alzheimer’s disease. J Nutr Health Aging. 2014; 18:291–99.
https://doi.org/10.1007/s12603-013-0411-2 PMID:24626757
67. Pardini M, Serrati C, Guida S, Mattei C, Abate L, Massucco D, Sassos D, Amore M, Krueger F, Cocito L, Emberti Gialloreti L. Souvenaid reduces behavioral deficits and improves social cognition skills in frontotemporal dementia: a proof-of-concept study. Neurodegener Dis. 2015; 15:58–62.
https://doi.org/10.1159/000369811 PMID:25592742
68. Rijpma A, Meulenbroek O, van Hees AM, Sijben JW, Vellas B, Shah RC, Bennett DA, Scheltens P, Olde Rikkert MG. Effects of Souvenaid on plasma micronutrient levels and fatty acid profiles in mild and mild-to-moderate Alzheimer’s disease. Alzheimers Res Ther. 2015; 7:51.
https://doi.org/10.1186/s13195-015-0134-1 PMID:26213579
69. Cummings J, Scheltens P, McKeith I, Blesa R, Harrison JE, Bertolucci PH, Rockwood K, Wilkinson D, Wijker W, Bennett DA, Shah RC. Effect size analyses of Souvenaid in patients with Alzheimer’s disease. J Alzheimers Dis. 2017; 55:1131–39.
https://doi.org/10.3233/JAD-160745 PMID:27767993
70. Hall CN, Klein-Flügge MC, Howarth C, Attwell D. Oxidative phosphorylation, not glycolysis, powers presynaptic and postsynaptic mechanisms underlying brain information processing. J Neurosci. 2012; 32:8940–51.
https://doi.org/10.1523/JNEUROSCI.0026-12.2012 PMID:22745494
71. Gadaleta MN, Petruzzella V, Renis M, Fracasso F, Cantatore P. Reduced transcription of mitochondrial DNA in the senescent rat. Tissue dependence and effect of L-carnitine. Eur J Biochem. 1990; 187:501–06.
https://doi.org/10.1111/j.1432-1033.1990.tb15331.x PMID:2154375
72. Manczak M, Jung Y, Park BS, Partovi D, Reddy PH. Time-course of mitochondrial gene expressions in mice brains: implications for mitochondrial dysfunction, oxidative damage, and cytochrome c in aging. J Neurochem. 2005; 92:494–504.
https://doi.org/10.1111/j.1471-4159.2004.02884.x PMID:15659220
73. Chandrasekaran K, Giordano T, Brady DR, Stoll J, Martin LJ, Rapoport SI. Impairment in mitochondrial cytochrome oxidase gene expression in Alzheimer disease. Brain Res Mol Brain Res. 1994; 24:336–40.
https://doi.org/10.1016/0169-328X(94)90147-3 PMID:7968373
74. Simonian NA, Hyman BT. Functional alterations in Alzheimer’s disease: selective loss of mitochondrial-encoded cytochrome oxidase mRNA in the hippocampal formation. J Neuropathol Exp Neurol. 1994; 53:508–12.
https://doi.org/10.1097/00005072-199409000-00010 PMID:8083692
75. Simonian NA, Hyman BT. Functional alterations in neural circuits in Alzheimer’s disease. Neurobiol Aging. 1995; 16:305–09.
https://doi.org/10.1016/0197-4580(95)00034-C PMID:7566339
76. Hatanpää K, Brady DR, Stoll J, Rapoport SI, Chandrasekaran K. Neuronal activity and early neurofibrillary tangles in Alzheimer’s disease. Ann Neurol. 1996; 40:411–20.
https://doi.org/10.1002/ana.410400310 PMID:8797530
77. Chandrasekaran K, Hatanpää K, Rapoport SI, Brady DR. Decreased expression of nuclear and mitochondrial DNA-encoded genes of oxidative phosphorylation in association neocortex in Alzheimer disease. Brain Res Mol Brain Res. 1997; 44:99–104.
https://doi.org/10.1016/S0169-328X(96)00191-X PMID:9030703
78. Chandrasekaran K, Hatanpää K, Brady DR, Stoll J, Rapoport SI. Downregulation of oxidative phosphorylation in Alzheimer disease: loss of cytochrome oxidase subunit mRNA in the hippocampus and entorhinal cortex. Brain Res. 1998; 796:13–19.
https://doi.org/10.1016/S0006-8993(98)00248-0 PMID:9689449
79. Hatanpää K, Chandrasekaran K, Brady DR, Rapoport SI. No association between Alzheimer plaques and decreased levels of cytochrome oxidase subunit mRNA, a marker of neuronal energy metabolism. Brain Res Mol Brain Res. 1998; 59:13–21.

www.aging-us.com 8454 AGING
https://doi.org/10.1016/S0169-328X(98)00117-X PMID:9729244
80. Aksenov MY, Tucker HM, Nair P, Aksenova MV, Butterfield DA, Estus S, Markesbery WR. The expression of several mitochondrial and nuclear genes encoding the subunits of electron transport chain enzyme complexes, cytochrome c oxidase, and NADH dehydrogenase, in different brain regions in Alzheimer’s disease. Neurochem Res. 1999; 24:767–74.
https://doi.org/10.1023/A:1020783614031 PMID:10447460
81. Rice AC, Ladd AC, Bennett JP Jr. Postmortem Alzheimer’s disease hippocampi show oxidative phosphorylation gene expression opposite that of isolated pyramidal neurons. J Alzheimers Dis. 2015; 45:1051–59.
https://doi.org/10.3233/JAD-142937 PMID:25720395
82. Mastroeni D, Khdour OM, Delvaux E, Nolz J, Olsen G, Berchtold N, Cotman C, Hecht SM, Coleman PD. Nuclear but not mitochondrial-encoded oxidative phosphorylation genes are altered in aging, mild cognitive impairment, and Alzheimer’s disease. Alzheimers Dement. 2017; 13:510–19.
https://doi.org/10.1016/j.jalz.2016.09.003 PMID:27793643
83. Liang WS, Reiman EM, Valla J, Dunckley T, Beach TG, Grover A, Niedzielko TL, Schneider LE, Mastroeni D, Caselli R, Kukull W, Morris JC, Hulette CM, et al. Alzheimer’s disease is associated with reduced expression of energy metabolism genes in posterior cingulate neurons. Proc Natl Acad Sci USA. 2008; 105:4441–46.
https://doi.org/10.1073/pnas.0709259105 PMID:18332434
84. Berchtold NC, Sabbagh MN, Beach TG, Kim RC, Cribbs DH, Cotman CW. Brain gene expression patterns differentiate mild cognitive impairment from normal aged and Alzheimer’s disease. Neurobiol Aging. 2014; 35:1961–72.
https://doi.org/10.1016/j.neurobiolaging.2014.03.031 PMID:24786631
85. Armand-Ugon M, Ansoleaga B, Berjaoui S, Ferrer I. Reduced mitochondrial activity is early and steady in the entorhinal cortex but it is mainly unmodified in the frontal cortex in Alzheimer’s disease. Curr Alzheimer Res. 2017; 14:1327–34.
https://doi.org/10.2174/1567205014666170505095921 PMID:28474567
86. Bi R, Zhang W, Zhang DF, Xu M, Fan Y, Hu QX, Jiang HY, Tan L, Li T, Fang Y, Zhang C, Yao YG. Genetic association of the cytochrome c oxidase-related genes with Alzheimer’s disease in Han Chinese. Neuropsychopharmacology. 2018; 43:2264–76.
https://doi.org/10.1038/s41386-018-0144-3 PMID:30054583
87. Kish SJ, Bergeron C, Rajput A, Dozic S, Mastrogiacomo F, Chang LJ, Wilson JM, DiStefano LM, Nobrega JN. Brain cytochrome oxidase in Alzheimer’s disease. J Neurochem. 1992; 59:776–79.
https://doi.org/10.1111/j.1471-4159.1992.tb09439.x PMID:1321237
88. Reichmann H, Flörke S, Hebenstreit G, Schrubar H, Riederer P. Analyses of energy metabolism and mitochondrial genome in post-mortem brain from patients with Alzheimer’s disease. J Neurol. 1993; 240:377–80.
https://doi.org/10.1007/BF00839971 PMID:8393094
89. Simonian NA, Hyman BT. Functional alterations in Alzheimer’s disease: diminution of cytochrome oxidase in the hippocampal formation. J Neuropathol Exp Neurol. 1993; 52:580–85.
https://doi.org/10.1097/00005072-199311000-00004 PMID:8229076
90. Mutisya EM, Bowling AC, Beal MF. Cortical cytochrome oxidase activity is reduced in Alzheimer’s disease. J Neurochem. 1994; 63:2179–84.
https://doi.org/10.1046/j.1471-4159.1994.63062179.x PMID:7964738
91. Parker WD Jr, Parks J, Filley CM, Kleinschmidt-DeMasters BK. Electron transport chain defects in Alzheimer’s disease brain. Neurology. 1994; 44:1090–96.
https://doi.org/10.1212/WNL.44.6.1090 PMID:8208407
92. Chagnon P, Bétard C, Robitaille Y, Cholette A, Gauvreau D. Distribution of brain cytochrome oxidase activity in various neurodegenerative diseases. Neuroreport. 1995; 6:711–15.
https://doi.org/10.1097/00001756-199503270-00002 PMID:7605932
93. Maurer I, Zierz S, Möller HJ, Jerusalem F. Cytochrome c oxidase in Alzheimer’s disease. Neurology. 1995; 45:1423.
https://doi.org/10.1212/WNL.45.7.1423 PMID:7617212
94. Gonzalez-Lima F, Valla J, Matos-Collazo S. Quantitative cytochemistry of cytochrome oxidase and cellular morphometry of the human inferior colliculus in control and Alzheimer’s patients. Brain Res. 1997; 752:117–26.
https://doi.org/10.1016/S0006-8993(96)01464-3 PMID:9106447
95. Wong-Riley MT, Mullen MA, Huang Z, Guyer C. Brain cytochrome oxidase subunit complementary DNAs:
www.aging-us.com 8455 AGING
isolation, subcloning, sequencing, light and electron microscopic in situ hybridization of transcripts, and regulation by neuronal activity. Neuroscience. 1997; 76:1035–55.
https://doi.org/10.1016/S0306-4522(96)00410-1 PMID:9027865
96. Kish SJ, Mastrogiacomo F, Guttman M, Furukawa Y, Taanman JW, Dozić S, Pandolfo M, Lamarche J, DiStefano L, Chang LJ. Decreased brain protein levels of cytochrome oxidase subunits in Alzheimer’s disease and in hereditary spinocerebellar ataxia disorders: a nonspecific change? J Neurochem. 1999; 72:700–07.
https://doi.org/10.1046/j.1471-4159.1999.0720700.x PMID:9930743
97. Nagy Z, Esiri MM, LeGris M, Matthews PM. Mitochondrial enzyme expression in the hippocampus in relation to Alzheimer-type pathology. Acta Neuropathol. 1999; 97:346–54.
https://doi.org/10.1007/s004010050997 PMID:10208273
98. Ojaimi J, Masters CL, Opeskin K, McKelvie P, Byrne E. Mitochondrial respiratory chain activity in the human brain as a function of age. Mech Ageing Dev. 1999; 111:39–47.
https://doi.org/10.1016/S0047-6374(99)00071-8 PMID:10576606
99. Maurer I, Zierz S, Möller HJ. A selective defect of cytochrome c oxidase is present in brain of Alzheimer disease patients. Neurobiol Aging. 2000; 21:455–62.
https://doi.org/10.1016/S0197-4580(00)00112-3 PMID:10858595
100. Verwer RW, Jansen KA, Sluiter AA, Pool CW, Kamphorst W, Swaab DF. Decreased hippocampal metabolic activity in Alzheimer patients is not reflected in the immunoreactivity of cytochrome oxidase subunits. Exp Neurol. 2000; 163:440–51.
https://doi.org/10.1006/exnr.2000.7385 PMID:10833319
101. Cottrell DA, Blakely EL, Johnson MA, Ince PG, Borthwick GM, Turnbull DM. Cytochrome c oxidase deficient cells accumulate in the hippocampus and choroid plexus with age. Neurobiol Aging. 2001; 22:265–72.
https://doi.org/10.1016/S0197-4580(00)00234-7 PMID:11182476
102. Valla J, Berndt JD, Gonzalez-Lima F. Energy hypometabolism in posterior cingulate cortex of Alzheimer’s patients: superficial laminar cytochrome oxidase associated with disease duration. J Neurosci. 2001; 21:4923–30.
https://doi.org/10.1523/JNEUROSCI.21-13-04923.2001 PMID:11425920
103. Bosetti F, Brizzi F, Barogi S, Mancuso M, Siciliano G, Tendi EA, Murri L, Rapoport SI, Solaini G. Cytochrome c oxidase and mitochondrial F1F0-ATPase (ATP synthase) activities in platelets and brain from patients with Alzheimer’s disease. Neurobiol Aging. 2002; 23:371–76.
https://doi.org/10.1016/S0197-4580(01)00314-1 PMID:11959398
104. Devi L, Prabhu BM, Galati DF, Avadhani NG, Anandatheerthavarada HK. Accumulation of amyloid precursor protein in the mitochondrial import channels of human Alzheimer’s disease brain is associated with mitochondrial dysfunction. J Neurosci. 2006; 26:9057–68.
https://doi.org/10.1523/JNEUROSCI.1469-06.2006 PMID:16943564
105. Pérez-Gracia E, Torrejón-Escribano B, Ferrer I. Dystrophic neurites of senile plaques in Alzheimer’s disease are deficient in cytochrome c oxidase. Acta Neuropathol. 2008; 116:261–68.
https://doi.org/10.1007/s00401-008-0370-6 PMID:18629521
106. Alikhani N, Guo L, Yan S, Du H, Pinho CM, Chen JX, Glaser E, Yan SS. Decreased proteolytic activity of the mitochondrial amyloid-β degrading enzyme, PreP peptidasome, in Alzheimer’s disease brain mitochondria. J Alzheimers Dis. 2011; 27:75–87.
https://doi.org/10.3233/JAD-2011-101716 PMID:21750375
107. Long J, He P, Shen Y, Li R. New evidence of mitochondria dysfunction in the female Alzheimer’s disease brain: deficiency of estrogen receptor-β. J Alzheimers Dis. 2012; 30:545–58.
https://doi.org/10.3233/JAD-2012-120283 PMID:22451324
108. Holper L, Ben-Shachar D, Mann JJ. Multivariate meta-analyses of mitochondrial complex I and IV in major depressive disorder, bipolar disorder, schizophrenia, Alzheimer disease, and Parkinson disease. Neuropsychopharmacology. 2019; 44:837–849.
https://doi.org/10.1038/s41386-018-0090-0 PMID:29855563
109. Presgraves SP, Ahmed T, Borwege S, Joyce JN. Terminally differentiated SH-SY5Y cells provide a model system for studying neuroprotective effects of dopamine agonists. Neurotox Res. 2004; 5:579–98.
https://doi.org/10.1007/BF03033178 PMID:15111235
110. Garcia-Esparcia P, Koneti A, Rodríguez-Oroz MC, Gago B, Del Rio JA, Ferrer I. Mitochondrial activity in the frontal cortex area 8 and angular gyrus in Parkinson’s disease and Parkinson’s disease with dementia. Brain Pathol. 2018; 28:43–57.
https://doi.org/10.1111/bpa.12474 PMID:27984680

www.aging-us.com 8456 AGING
111. Sechi S, Chait BT. Modification of cysteine residues by alkylation. A tool in peptide mapping and protein identification. Anal Chem. 1998; 70:5150–8.
https://doi.org/10.1021/ac9806005 PMID:9868912
112. MacLean B, Tomazela DM, Shulman N, Chambers M, Finney GL, Frewen B, Kern R, Tabb DL, Liebler DC, MacCoss MJ. Skyline: an open source document editor for creating and analyzing targeted proteomics experiments. Bioinformatics. 2010; 26:966–968.
https://doi.org/10.1093/bioinformatics/btq054 PMID:20147306
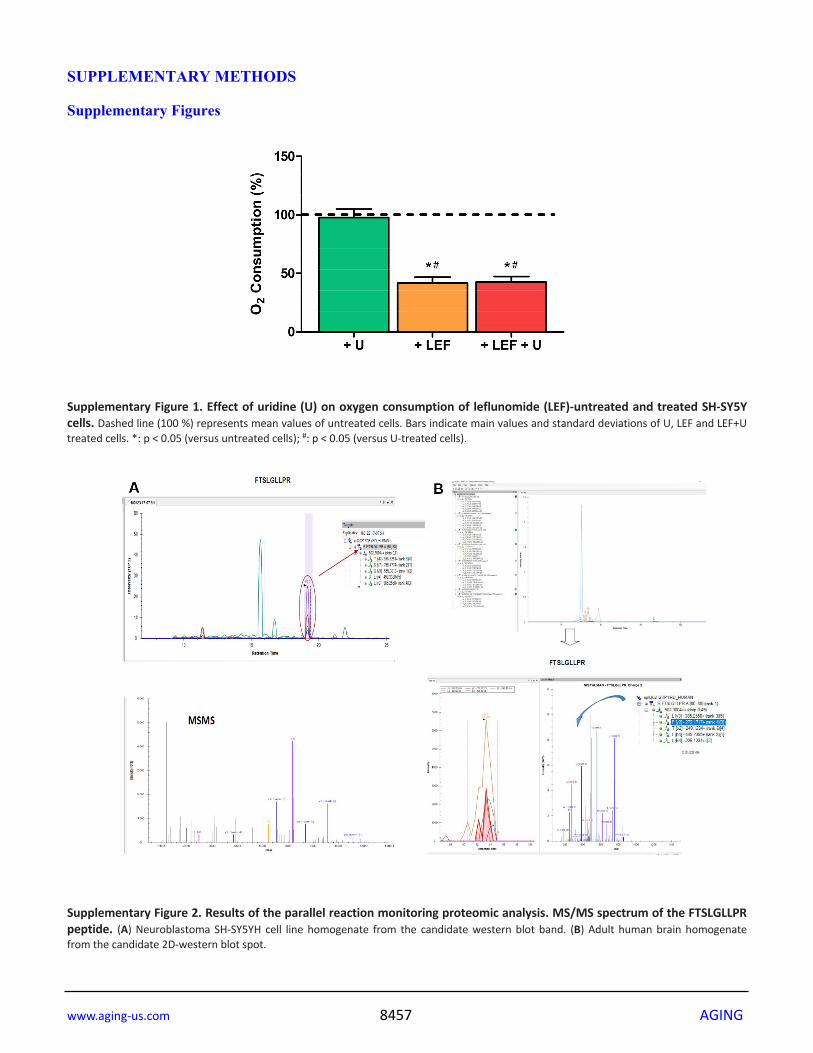
www.aging-us.com 8457 AGING
SUPPLEMENTARY METHODS Supplementary Figures
Supplementary Figure 1. Effect of uridine (U) on oxygen consumption of leflunomide (LEF)-untreated and treated SH-SY5Y cells. Dashed line (100 %) represents mean values of untreated cells. Bars indicate main values and standard deviations of U, LEF and LEF+U treated cells. *: p < 0.05 (versus untreated cells); #: p < 0.05 (versus U-treated cells).
Supplementary Figure 2. Results of the parallel reaction monitoring proteomic analysis. MS/MS spectrum of the FTSLGLLPR peptide. (A) Neuroblastoma SH-SY5YH cell line homogenate from the candidate western blot band. (B) Adult human brain homogenate from the candidate 2D-western blot spot.

www.aging-us.com 8458 AGING
Supplementary Figure 3. Results of the parallel reaction monitoring proteomic analysis for the candidate western blot band from the neuroblastoma SH-SY5YH cell line homogenate. MS/MS spectra of the TSVDAAEDYAEGVR (A, B) and VPIIGVGGVSSGQDALEK (C, D) peptides.
Supplemental Figure 4. 2D-western blot analysis of the adult human brain. (A) SDS-PAGE 10 % results. (B) PVDF membrane showing the selected spots for peptide mass fingerprinting (blue and red arrows) and parallel reaction monitoring (PRM) (red arrow) proteomics analyses.
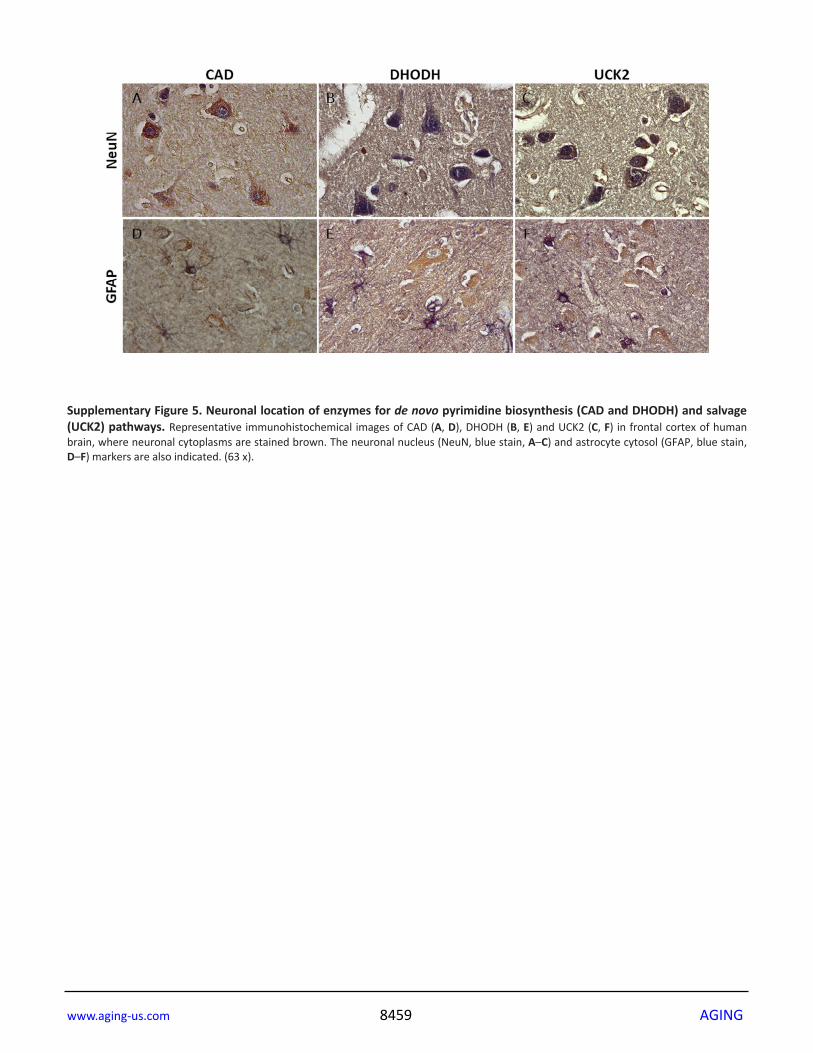
www.aging-us.com 8459 AGING
Supplementary Figure 5. Neuronal location of enzymes for de novo pyrimidine biosynthesis (CAD and DHODH) and salvage (UCK2) pathways. Representative immunohistochemical images of CAD (A, D), DHODH (B, E) and UCK2 (C, F) in frontal cortex of human brain, where neuronal cytoplasms are stained brown. The neuronal nucleus (NeuN, blue stain, A–C) and astrocyte cytosol (GFAP, blue stain, D–F) markers are also indicated. (63 x).
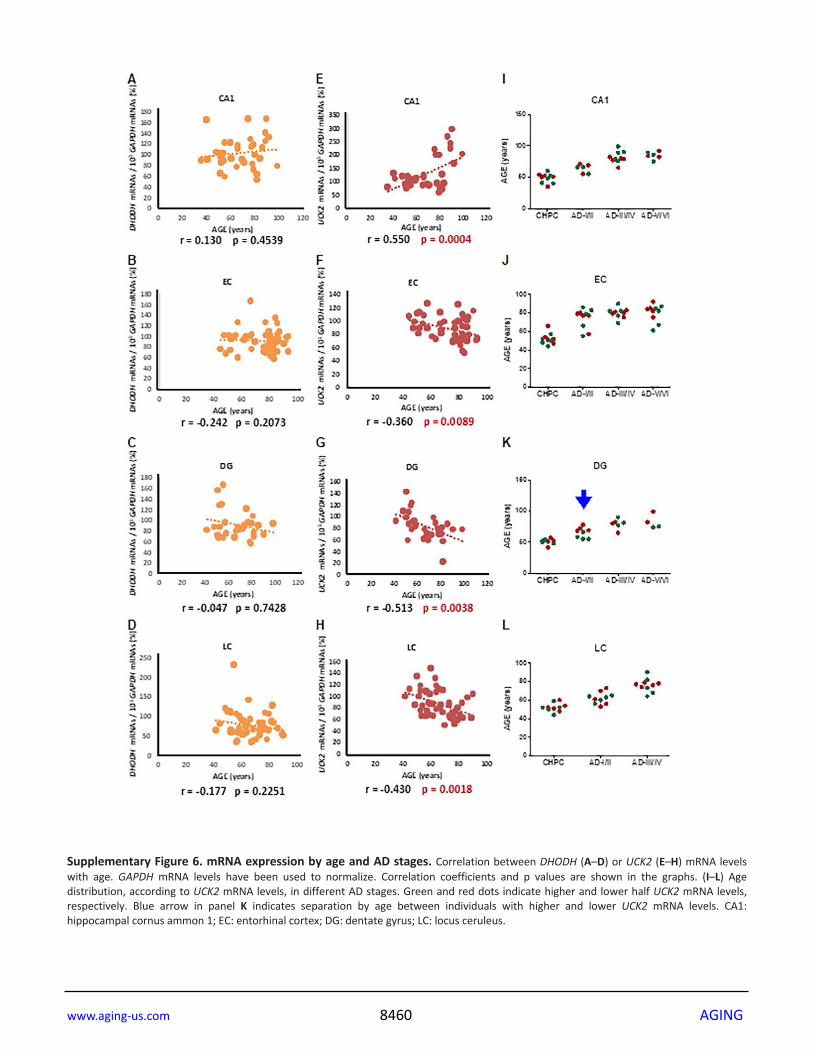
www.aging-us.com 8460 AGING
Supplementary Figure 6. mRNA expression by age and AD stages. Correlation between DHODH (A–D) or UCK2 (E–H) mRNA levels with age. GAPDH mRNA levels have been used to normalize. Correlation coefficients and p values are shown in the graphs. (I–L) Age distribution, according to UCK2 mRNA levels, in different AD stages. Green and red dots indicate higher and lower half UCK2 mRNA levels, respectively. Blue arrow in panel K indicates separation by age between individuals with higher and lower UCK2 mRNA levels. CA1: hippocampal cornus ammon 1; EC: entorhinal cortex; DG: dentate gyrus; LC: locus ceruleus.

www.aging-us.com 8461 AGING
Supplementary Tables Supplementary Table 1. Brain expression of genes for the de novo pyrimidine biosynthesis pathway, and UCK2, from different animal species.
Animals CAD DHODH UMPS UCK2 Chlorocebus sabaeusa,b,c 4-32 1-10 6-24 5-18 Macaca mulattaa,b,c 14-15 14-18 6 16-29 Papio anubisa,b,c 8-13 5-9 9-14 13-32 Mus musculusa,b 6-27 6-10 11-30 13-71 Rattus norvegicusa,b 4-11 4-6 22-34 11-26 Bos taurusa,b 8-9 - 6 42 Equus caballusa,b 6 7 53 26 Ovis ariesa,b 1 4 4 7 Monodelphis domesticaa,d 23 32 39 22 Gallus galluse 8-9 6-10 8-12 62-79 Xenopus tropicalisf 33 25 18 12
Expression is reported as number of transcripts of a particular gene per million molecules in the RNA-seq sample. a, mammal; b, placental; c, primate; d, marsupial; e, bird; f, amphibian. Please browse Full Text version to see the data of Supplementary Table 2. Supplementary Table 2. Summary of cases used for mRNA expression studies. CA1: hippocampal cornus ammon 1; DG: dentate gyrus; EC: entorhinal cortex; LC: locus ceruleus. CHPC: Clinical and HistoPathological Controls. RIN: RNA integrity number. F: female; M: male. PMD: post-mortem delay. DHODH and UCK2 mRNA levels have been normalized to 103 GAPDH mRNAs. The CHPC MT-CO1 / 18S ratio mean values have been considered 100 %.
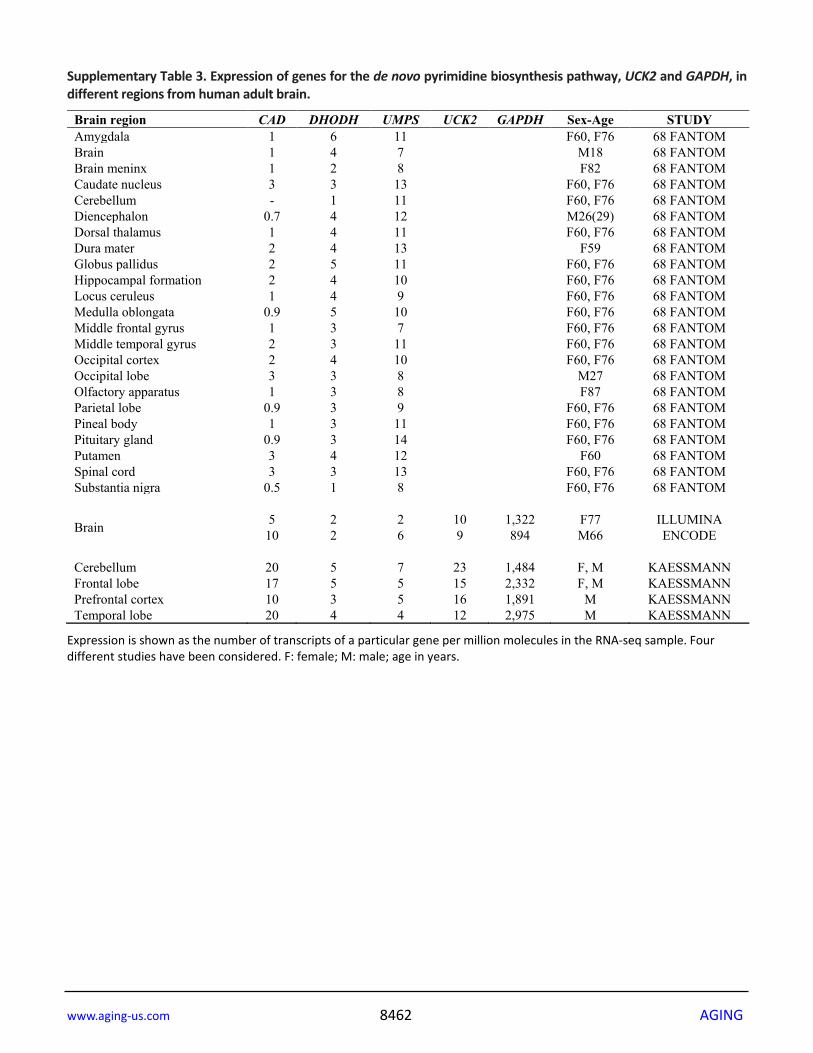
www.aging-us.com 8462 AGING
Supplementary Table 3. Expression of genes for the de novo pyrimidine biosynthesis pathway, UCK2 and GAPDH, in different regions from human adult brain.
Brain region CAD DHODH UMPS UCK2 GAPDH Sex-Age STUDY Amygdala 1 6 11 F60, F76 68 FANTOM Brain 1 4 7 M18 68 FANTOM Brain meninx 1 2 8 F82 68 FANTOM Caudate nucleus 3 3 13 F60, F76 68 FANTOM Cerebellum - 1 11 F60, F76 68 FANTOM Diencephalon 0.7 4 12 M26(29) 68 FANTOM Dorsal thalamus 1 4 11 F60, F76 68 FANTOM Dura mater 2 4 13 F59 68 FANTOM Globus pallidus 2 5 11 F60, F76 68 FANTOM Hippocampal formation 2 4 10 F60, F76 68 FANTOM Locus ceruleus 1 4 9 F60, F76 68 FANTOM Medulla oblongata 0.9 5 10 F60, F76 68 FANTOM Middle frontal gyrus 1 3 7 F60, F76 68 FANTOM Middle temporal gyrus 2 3 11 F60, F76 68 FANTOM Occipital cortex 2 4 10 F60, F76 68 FANTOM Occipital lobe 3 3 8 M27 68 FANTOM Olfactory apparatus 1 3 8 F87 68 FANTOM Parietal lobe 0.9 3 9 F60, F76 68 FANTOM Pineal body 1 3 11 F60, F76 68 FANTOM Pituitary gland 0.9 3 14 F60, F76 68 FANTOM Putamen 3 4 12 F60 68 FANTOM Spinal cord 3 3 13 F60, F76 68 FANTOM Substantia nigra 0.5 1 8 F60, F76 68 FANTOM
Brain 5 10
2 2
2 6
10 9
1,322 894
F77 M66
ILLUMINA ENCODE
Cerebellum 20 5 7 23 1,484 F, M KAESSMANN Frontal lobe 17 5 5 15 2,332 F, M KAESSMANN Prefrontal cortex 10 3 5 16 1,891 M KAESSMANN Temporal lobe 20 4 4 12 2,975 M KAESSMANN
Expression is shown as the number of transcripts of a particular gene per million molecules in the RNA-seq sample. Four different studies have been considered. F: female; M: male; age in years.


![Synthesis of dihydropyrido[2,3-d]pyrimidine derivatives in ...scientiairanica.sharif.edu/article_3782_85542b3197... · synthesis of dihydropyrido[2,3-d]pyrimidine derivatives via](https://img.dokumen.tips/doc/110x75/5e80fbff3436e461506f40cf/synthesis-of-dihydropyrido23-dpyrimidine-derivatives-in-synthesis-of-dihydropyrido23-dpyrimidine.jpg)