Embed Size (px)
Citation preview

© California ISO 2019 – CAISO Public© California ISO 2019 – CAISO Public
Irina Green, Senior Advisor, Regional Transmission,California ISO
NERC SPIDER WG, Chicago October 8-9 2019
BPS Impacts from Behind the Meter DER Reactive Power Support and Frequency
Support in Different Operating Modes

© California ISO 2019 – CAISO Public
Page 2
NERC SPIDER (System Planning Impact from DER) WG – DER_A Modeling Guideline
New DER_A dynamic model now released in all major positive sequence simulation software platforms.
NERC SPIDERWG developed guideline for how to use the DER_A model, and how to develop its parameter values
The Guideline is approved by NERC Provides detailed understanding of the
model Provides recommendations for
developing parameters for the model and values of DER_A parameters to use
© California ISO 2019 – CAISO Public
Page 3
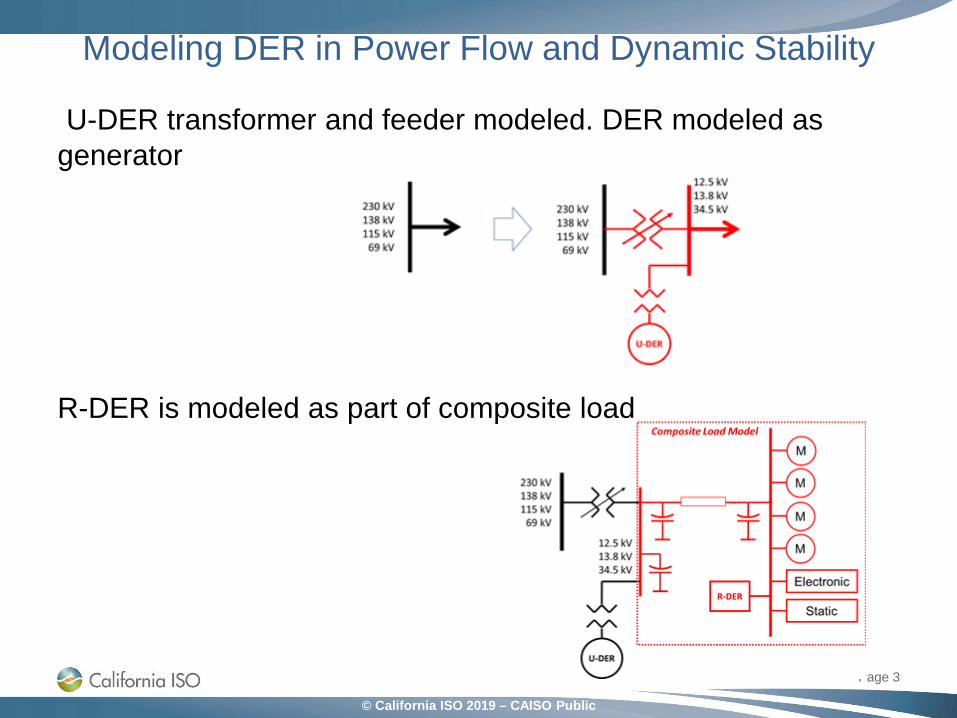
Modeling DER in Power Flow and Dynamic Stability
U-DER transformer and feeder modeled. DER modeled as generator
R-DER is modeled as part of composite load

© California ISO 2019 – CAISO Public
Page 4
DER_A Model in Dynamic Stability
Simplified version of the second generation generic renewable energy system models (i.e., regc_a, reec_b, repc_a, lhvrt, lhfrt)
More detailed and flexible than PVD1 model used previously Currently, may represent only aggregated solar PV Standalone or part of composite load model These two models are identical Available in all widely-used software platforms The following studies are of the behind-the-meter DER,
which is a part of composite load model

© California ISO 2019 – CAISO Public
Page 5
DER_A Model Features
Constant power factor and constant reactive power control modes. Allows voltage control to be active along with PF/Q control
Active power-frequency control with droop and asymmetric dead-band - was studied
Voltage control with proportional control and asymmetric dead-band - was studied
Fraction of resources tripping or entering momentary cessation at low and high voltage, includes a timer feature
Fraction of resources restoring output following a low or high voltage or frequency condition
Active power ramp rate limits during return to service after trip or enter service following a fault or during frequency response
Active-reactive current priority options Capability to represent generating or energy storage resources.

© California ISO 2019 – CAISO Public
Page 6
DER_A Block Diagram – Active Power-Frequency Control
Freq flag = 1, control enabled
Frequency error
Frequency signal dead-band
Droop gains
Power order time constant
Also, frequency tripping logic control
© California ISO 2019 – CAISO Public
Page 7
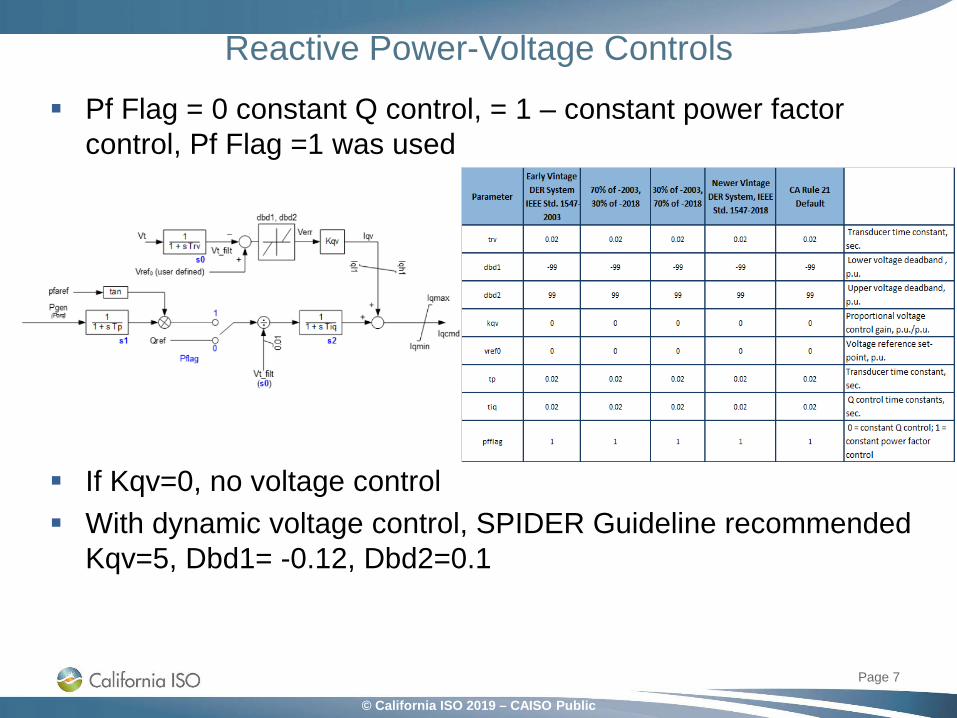
Reactive Power-Voltage Controls Pf Flag = 0 constant Q control, = 1 – constant power factor
control, Pf Flag =1 was used
If Kqv=0, no voltage control With dynamic voltage control, SPIDER Guideline recommended
Kqv=5, Dbd1= -0.12, Dbd2=0.1

© California ISO 2019 – CAISO Public
Page 8
Active –Reactive Priority Logic
Type flag = 1 – generator (Ipmin = 0), =0 – storage (Ipmin=-Ipmax) Pqflag = 0 – Q priority, =1- P priority Inverters prior to IEEE 1547-2018 Standard not required to have
voltage control – P priorrity After the approval of IEEE 1547-2018 - voltage control, Q priority

© California ISO 2019 – CAISO Public
Page 9
CAISO Studies of DER_A Model as Part of Composite Load. Voltage and Frequency Regulation by DER
CAISO models behind the meter DER as a part of load for the last two years. Software used was GE PSLF Version 21.07
2029 Summer Peak case for voltage studies, 2029 Spring off-peak for frequency studies
The peak case has high load, thus stalling of single-phase air-conditioners with faults
The off-peak case has high dispatch from behind-the-meter DER
DER_A parameters as recommended by SPIDER Modeling Guideline, 70% new, 30% old inverters
© California ISO 2019 – CAISO Public
Page 10
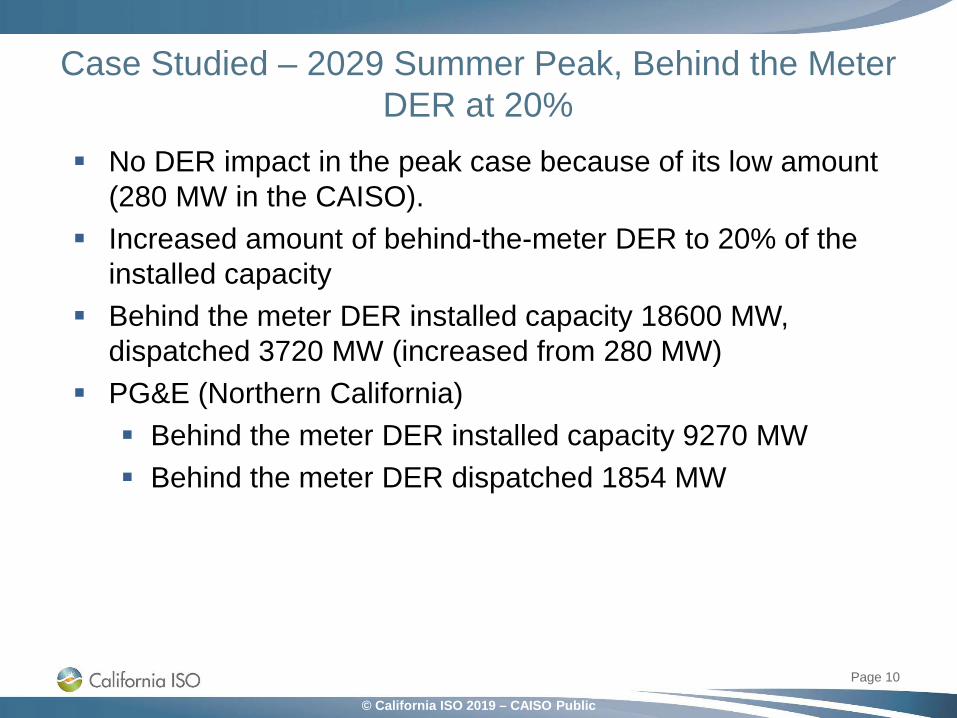
Case Studied – 2029 Summer Peak, Behind the Meter DER at 20%
No DER impact in the peak case because of its low amount (280 MW in the CAISO).
Increased amount of behind-the-meter DER to 20% of the installed capacity
Behind the meter DER installed capacity 18600 MW, dispatched 3720 MW (increased from 280 MW)
PG&E (Northern California) Behind the meter DER installed capacity 9270 MW Behind the meter DER dispatched 1854 MW

© California ISO 2019 – CAISO Public
Page 11
Contingency Studied, power flow case with 20% Behind-the-Meter DER dispatched
Heavily loaded 500 kV line, Tesla –Metcalf in San Francisco Bay Area, highest loss of load in PG&E
3-phase fault on the sending end with normal clearance (4 cycles)
DER cases studied: No voltage control, P priority No voltage control, Q priority Voltage control, P priority Voltage control, Q priority Voltage control, Q priority, DER
MVAR at 0.95 lagging Cases with voltage control, kqv=5,
dead-band +0.1/-0.12

© California ISO 2019 – CAISO Public
Page 12
Loss of Composite Load and DER with Contingency
No criteria violations with this contingency 181 MW reduction in lost load if behind the meter DER
have voltage control and Q priority

© California ISO 2019 – CAISO Public
Comparison of the five cases, Two 230 kV buses close to the fault (Westley and Peabody). Voltage
Page 13
Higher recovery voltage with voltage control and Q priority Power factor of the DER in power flow doesn’t make a difference Without voltage control, P and Q priority have same voltage

© California ISO 2019 – CAISO Public
Comparison of the five cases, Westley and Peabody 230 kV buses. Net load
Page 14
Less load loss with voltage control and Q priority Power factor in power flow doesn’t make a difference Without voltage control, P and Q priority have same load loss
© California ISO 2019 – CAISO Public
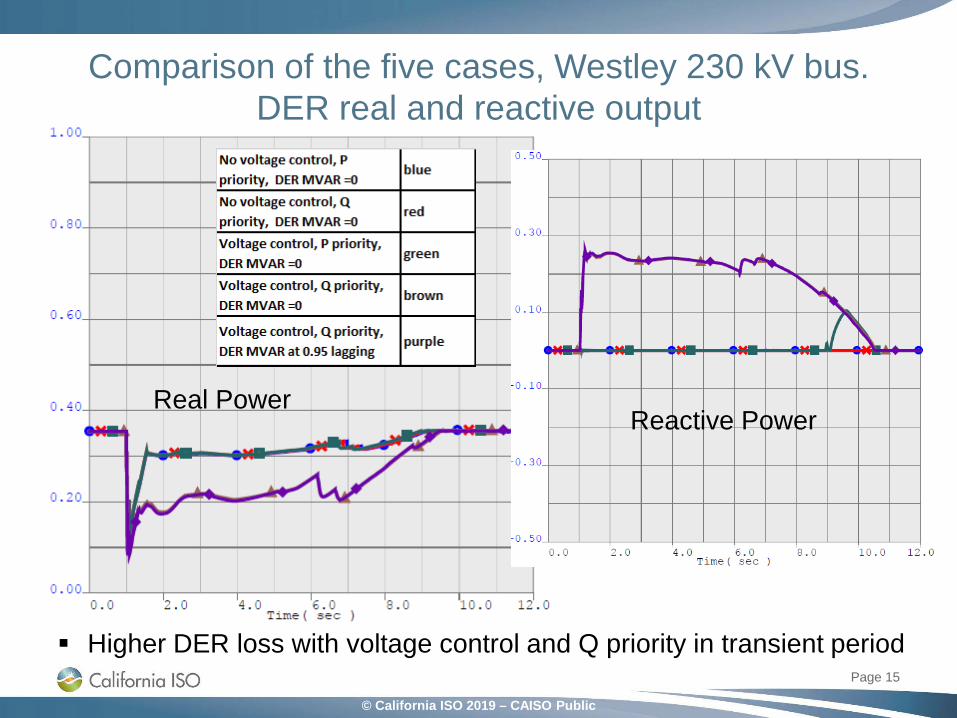
Comparison of the five cases, Westley 230 kV bus. DER real and reactive output
Page 15
Higher DER loss with voltage control and Q priority in transient period
Real PowerReactive Power

© California ISO 2019 – CAISO Public
Comparison of the five cases, Peabody 230 kV bus. DER real and reactive output
Page 16
Higher DER loss with lagging power factor in transient period
Real PowerReactive Power

© California ISO 2019 – CAISO Public
Conclusions from Voltage Studies
If Behind the Meter DER control voltage, it is not during steady state conditions, but with faults, during transient voltage recovery period.
Voltage regulation on the Behind the Meter DER can help with faults ride through and may allow the induction motors not to stall.
There is a difference in the load and DER loss with different voltage control settings of the DER, but it is mainly during transient recovery period (less than 6 seconds after the fault)
There is less load reduction if DER have voltage control
Page 17
© California ISO 2019 – CAISO Public
Study of Frequency Response from Behind the Meter DER
2029 Summer off-peak case, with reduced headroom WECC generation in the case, not including pumps 133,146
MW, headroom 12,800 MW Behind the meter DER installed capacity in the CAISO –
18,600 MW, dispatch 15,048 MW Frequency droop assumed at 7.14% (1/14) as recommended
by the Reliability Guideline on DER Parameterization Studied outage of two Palo Verde nuclear units, 2750 MW Run dynamic simulation for 60 seconds
Page 18
© California ISO 2019 – CAISO Public
Frequency Response from Behind the Meter DER Settling frequency Without DER frequency response 59.906 Hz With DER frequency response 59.912 Hz Difference is insignificant
Frequency nadir Without DER frequency response 59.810 Hz With DER frequency response 59.830 Hz
With frequency control from DER DER response after 60 sec 234 MW, 1.5% of dispatch Governor response 1838 MW, 2.7% of dispatch Total 2072 MW
Without frequency control from DER Governor response 2004 MW, 3% of dispatch Net Load reduction 841 MW
Page 19

© California ISO 2019 – CAISO Public
Outage of Two Palo Verde Units 2029 off-PeakFrequency on Midway 500 kV bus
Page 20
Red – no frequency control from DER
Blue – with frequency control

© California ISO 2019 – CAISO Public
DER Output with Frequency Control. Outage of two Palo Verde Units
Page 21
Normalized DER output for SCE and SDG&E DER
Response of other DER is similar
3.25% response at nadir and 1.5% at settling frequency
Net Load reduction 1007 MW
© California ISO 2019 – CAISO Public
Impact of DER MVA Base For Type 2 DG model, the Pdgen and Qdgen values from the
load table are used in the cmpldwg model. If DGmbase is negative, the actual MVA base calculated as Pdgen / abs(DGmbase)
In the base case: "DGtype" 2 "dgdatno" -100 "dgmbase" -0.9, thus DER are loaded 90%
DER MVA base = -1.0, with frequency control Settling frequency 59.909 Hz, nadir 59.816 Hz No frequency response from DER, because DER don’t have
headroom Governor response 2004 MW, same as without frequency
control from DER
Page 22
© California ISO 2019 – CAISO Public
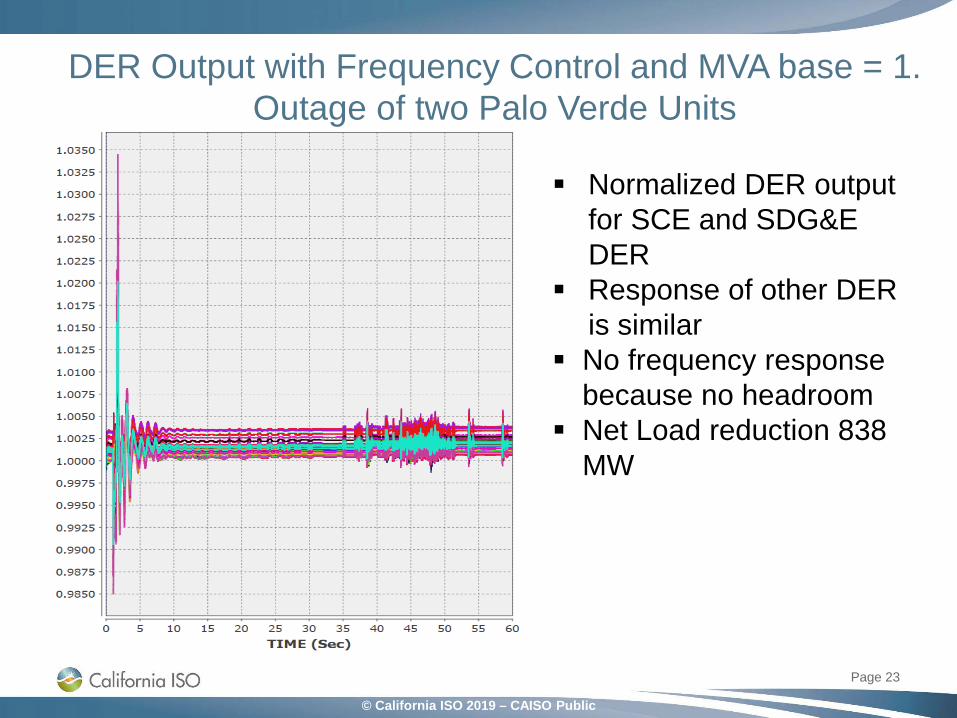
DER Output with Frequency Control and MVA base = 1. Outage of two Palo Verde Units
Page 23
Normalized DER output for SCE and SDG&E DER
Response of other DER is similar
No frequency response because no headroom
Net Load reduction 838 MW
© California ISO 2019 – CAISO Public
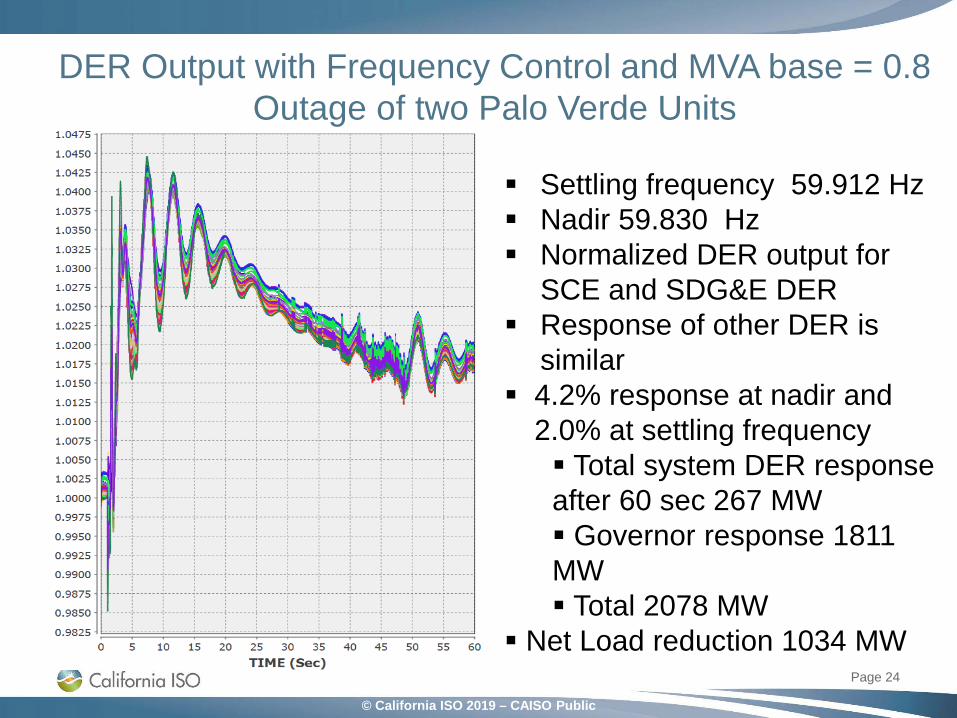
DER Output with Frequency Control and MVA base = 0.8 Outage of two Palo Verde Units
Page 24
Settling frequency 59.912 Hz Nadir 59.830 Hz Normalized DER output for
SCE and SDG&E DER Response of other DER is
similar 4.2% response at nadir and
2.0% at settling frequency Total system DER response after 60 sec 267 MW Governor response 1811 MW Total 2078 MW
Net Load reduction 1034 MW

© California ISO 2019 – CAISO Public
Outage of two Palo Verde Units. 2029 Spring off-Peak. Comparison of DER Frequency Response
Page 25

© California ISO 2019 – CAISO Public
Page 26
Conclusions from Frequency Studies
If DER have frequency control, their response to drop in frequency depends not only on the droop and dead-band, but also on their headroom, which is modeled through the MVA base
With 10%-20% headroom, DER response makes rather insignificant difference, if there is sufficient response from units with responsive governors
DER response replaces response from other frequency-responsive units
DER frequency response has impact mainly on the frequency nadir, but not on the settling frequency

© California ISO 2019 – CAISO Public
QUESTIONS?COMMENTS?
Please send your comments to Irina [email protected]
Page 27