Embed Size (px)
Citation preview
Bone histology and growth of the prosauropod dinosaur
Plateosaurus engelhardti MEYER, 1837
from the Norian bonebeds of Trossingen (Germany) and Frick
(Switzerland)
Dissertation zur Erlangung des Doktorgrades
der
Mathematisch-Naturwissenschaftlichen Fakultät
der
Rheinischen Friedrich-Wilhelms-Universität Bonn
vorgelegt von
Dipl.-Geol. Nicole Klein
aus Glees
Bonn 2004

Angefertigt mit Genehmigung der Mathematisch-Naturwissenschaftlichen Fakultät der
Rheinischen Friedrich-Wilhelms-Universität Bonn
1 Referent: PD Dr. Martin P. Sander 2 Referent: Prof. Dr. Jes Rust
Tag der Promotion: 9.12.2004


Contents
Abstract 1
1. Introduction 1
1.1 General aspects 1
1.2 Introduction to the terminology of bone histology 2
1.3 Previous work: Results on and problems of tetrapod bone histology 6
1.3.1 General aspects 6
1.3.2 Skeletochronology 7
1.3.3 Bone histology and growth in recent tetrapods 8
1.3.4 Growth in dinosaurs 10
1.4 Aims of research 12
1.5 Museum abbreviations 13
2. Previous work on prosauropod bone histology 13
3. Plateosaurus from Central Europe 18
3.1 General systematics and occurrence 18
3.2 Anatomical features of Plateosaurus 18
3.3 Size, body mass, and biology of Plateosaurus 19 3.4 Plateosaurus bonebeds of Central Europe 22
3.5 Taxonomy of Plateosaurus from Central European bonebeds 25
4. Material 26
4.1 Specimens studied 26
4.1.1 Plateosaurus engelhardti from Trossingen 27
4.1.2 Plateosaurus engelhardti from Frick 31
4.1.3 Body size in Plateosaurus from Frick and Trossingen 34
4.2 Preservation and diagenesis 37
4.2.1 Trossingen 37

4.2.2 Frick 38
5. Methods 39
5.1 Osteology, measurements, and mass estimates 39
5.2 Sampling 41
5.2.1 Whole bone cross sections 41
5.2.2 Coring 42
5.2.3 Existing fracture surfaces 42
5.3 Problems encountered during sampling and thin sectioning 43
5.4 Methods of histological an skeletochronological study 44
5.4.1 General aspects 44
5.4.2 LAG counts 45
5.4.3 Extrapolation method 45
6. Histological description by bone 48
6.1 Long Bones 48
6.1.1 Sampling location 48
6.1.2 Femur 49
6.1.3 Tibia 50
6.1.4 Fibula 51
6.1.5 Humerus 51
6.1.3 Bone types in long bones of Plateosaurus engelhardti 52
6.1.3.1 Primary bone tissues and vascular density 52
6.1.3.2 Remodeling in long bones 56
6.1.3.3 Endosteal bone 57
6.1.4 Growth marks in long bones of Plateosaurus 57
6.2 Flat Bones 58
6.2.1 Sampling location 59
6.2.2 Scapula 60
6.2.3 Pubis 60
6.2.4 Bone tissues, vascular density and remodelling in scapula and pubis 61
6.2.5 Growth marks in scapula and pubis of Plateosaurus engelhardti 62

6.3 Other bones: vertebrae, ribs, ischia, and foot phalange 63
6.3.1 Sampling location in other bones 63
6.3.2 Bone tissue, vascular density, and remodeling 64
6.3.2.1 Vertebrae 64
6.3.2.2 Ribs 64
6.3.2.3 Ischia 65
6.3.2.4 Foot phalange 65
6.4 Summary of the histological record 65
6.5 Differences between the Frick and Trossingen localities 66
7. Results: Bone histology and growth record 66
7.1 Evaluation of various aspects of microstructure 66
7.1.1 Evaluation of the sampled bones for skeletochronology 66
7.1.2 Secondary osteons and remodeling 66
7.1.3 Endosteal bone 67
7.2 Qualitative growth record 67
7.2.1 Bone tissues 67
7.2.1.1 Laminar fibro-lamellar complex with LAGs 67
7.2.1.1.1 Growth of juvenile Plateosaurus engelhardti 68
7.2.1.2 Lamellar-zonal bone and determinate growth in Plateosaurus 68
7.2.1.3 Bone tissue change 69
7.2.3 Discussion of other fibro-lamellar bone types 71
7.2.3.1 Radial fibro-lamellar bone (RFB) 71
7.2.3.2 Highly vascularized laminar fibro-lamellar bone 72
7.2.4 Possible onset of sexual maturity recorded in pubis specimens 73
7.3 Quantitative growth record (skeletochronology) 73
7.3.1 Single bone types 73
7.3.1.1 Femur 75
7.3.1.2 Tibia 78
7.3.1.3 Fibula 81
7.3.1.4 Humerus 83
7.3.1.5 Scapula 87
7.3.1.6 Pubis 89

7.3.1.7 Other bones 92
7.3.1.7.1 Vertebrae 93
7.3.1.7.2 Ribs 93
7.3.1.7.3 Ischia 93
7.3.1.7.4 Foot phalange 93
7.3.2 Single individuals sampled by several bones 96
7.3.2.1 SMNS F 14 96
7.3.2.2 SMNS F 48 98
7.3.2.3 SMNS F 29 98
7.3.3 Results from LAG counts 102
8. Discussion 103
8.1 Quantitative growth record 103
8.1.1 Varying growth in different bone types during ontogeny 103
8.1.2 Differences between Frick and Trossingen localities 103
8.1.3 General patterns and metabolism 104
8.1.4 Sexual dimorphism 105
8.1.5 Sexual maturity 106
8.2 Quantitative growth record: Skeletochronology 107
9. Comparison of growth of Plateosaurus engelhardti with that of some other
extinct and extant tetrapods 108
9.1 Other prosauropods 109
9.2 Sauropods 110
9.3 Other dinosaurs 115
9.4 Reptiles 115
9.5 Birds and mammals 117
10. Summary and conclusions 117
11. Acknowledgements 119
12. References 120

1
Bone histology and growth of the prosauropod dinosaur
Plateosaurus engelhardti MEYER, 1837
from the Norian bonebeds of Trossingen (Germany) and Frick
(Switzerland) 18 figures and 15 tables
Abstract
Predominately long- and flat bones of the prosauropod Plateosaurus engelhardti from
the Norian localities of Trossingen and Frick were sampled for paleohistological study. Both
localities yield rich material of adult individuals with a body size of 4.70 m to 10 m.
Altogether 50 bones from approximately 27 individuals were sampled by different
methods (coring, cross sectioning, analysis of existing fracture surfaces). Most bones consist
of the laminar fibro-lamellar complex, always cyclically interrupted by lines of arrested
growth (LAGs). In some bones, the laminar fibro-lamellar complex changed in the exterior
cortex to lamellar-zonal bone, later grading into avascular lamellar bone. Thus, growth was
clearly determinated in P. engelhardti.
Like most other dinosaurs Plateosaurus engelhardti shows high growth rates,
indicating an advanced (“dinosaurian”) physiology. On the other hand, Plateosaurus
engelhardti shows a strong dependency on environmental conditions. Additionally, its final
size is represented by a very broad range (between 6.5 m to 10 m). Both reflect a more
reptilian growth pattern as is known from other dinosaurs. It marks the basal status of
Plateosaurus engelhardti. Thus, in Plateosaurus the foundation is seen for the evolution of
gigantism in sauropods.
1. Introduction
1.1 General aspects
Dinosaurs are one of the most fascinating groups of vertebrates that everlived. Despite
various studies of their extensive fossil record concerning e.g. anatomy, morphology, and
phylogeny, and due to their extinction (except birds), and lack of any good modern analogues,
there still a lot of open questions, mainly concerning biological features and life history
aspects about dinosaurs.
Until now, the only direct way to obtain information about past events in an
individual’s life is the use of the record preserved in hard tissues (CASTANET et al. 1993,
CASTANET 1994, CURRY 1999, SANDER 1999, 2000). Particularly bone histology

2
(skeletochronology) provides information about aspects of paleobiology like individual age,
age at sexual maturity, growth rates and growth patterns, sexual dimorphism, and cycles of
activity and reproduction. From these data, information can be deduced about physiology and
metabolic rate, ontogeny, evolution, and phylogeny (CASTANET et al. 1993, CHINSAMY 1993a,
b, 1994, ERICKSON & TUMANOVA 2000, HORNER et al. 2000, SANDER et al. in press).
Skeletochronology today is a standard method of aging extant fishes and ectothermic
vertebrates (RICQLÉS et al. 1991, CASTANET et al. 1993, CHINSAMY 1994) and nearly the only
way for doing so in extinct vertebrates (CASTANET 1994). The method is based on the count
of cyclically deposited growth marks preserved in the microstructure of bones.
Examination of bone microstructure in dinosaurs began with the first fossil finds of
dinosaurs as summarized in ERICKSON & TUMANOVA (2000), and HORNER et al. (2000). But
all the early works have only a descriptive character, and further analyses of the histological
data and resulting implications were not done. Primarily RICQLÈS (1968, 1980, 1983) started
comparative histological studies in the middle 1960’s, mainly of dinosaur bones, and he
extracted paleobiological information from these data. Others followed, and since the 1990’s
more and more authors (REID 1990, CHINSAMY 1993, VARRICCHO 1993, FARLOW et al. 1995,
CURRY 1999, SANDER 1999, 2000) have become interested in bone histology research and its
possibilities for collecting e.g. paleobiological data. Thus, today a lot of bone histological
research is done and published, dealing with various fossil vertebrate groups.
A summary about the current state of bone histological research in extinct tetrapods,
predominately in dinosaurs, are given by FARLOW & BRETT-SURMAN (1997). Important
studies about bone histology and using growth marks for aging of recent tetrapods
(skeletochronology) are ZUG et. al. (1986), CASTANET & SMIRINA (1990), CASTANET et. al.
(1993), CASTANET (1994), and KLEVEZAL (1996).
1.2 Introduction to the terminology of bone histology
Paleohistology is a large field which deals with numerous structures, like bones, teeth,
scales, scutes, shells, and other “hard” material of vertebrates and invertebrates preserved
during fossilization (PADIAN 1997). The current study deals only with fossil tetrapod bone
histology. Therefore, only a short introduction to bone histology and the terminology used is
given here. For a more detailed discussion of bone histology see FRANCILLON-VIEILLOT et al.
(1990), RICQLÈS (1991), CHINSAMY (1994), and REID (1997).
Tetrapod bones can be divided into different categories based on their general shape
and ontogenetic origin. In the current study, mainly long bones such as the femur, tibia,

3
fibula, and humerus, and two flat bones, scapula and pubis, were sampled. Additionally, a few
short bones were sampled rather randomly. Long bones can be divided into the diaphysis or
shaft region, the epiphyses, which are the two extremities, and the transitional region between
epiphyses and diaphysis, called metaphyses. The diaphysis of long bones consist of the
cortical compacta (cortex), the inner cancellous bone area, and the medullary cavity, located
approximately in the center of the bone. Epiphyses and metaphyses consist mainly only of
cancellous bone.
A three-layered or diploe structure characterizes flat bones. They lack a free medullary
cavity but have a central zone of cancellous bone sandwiched between two thin layers of
cortical compacta (FRANCILLON-VIEILLOT 1990). Flat bones lack typical epiphyses; instead
they are termed the proximal and distal bone end. The term “shaft” is used in connection with
flat bones for the elongated middle area of bone.
The cortex generally consists of primary bone tissue, which can be built up of various
bone types. Under the microscope, primary bone always contains clearly visible osteocyte
lacunae connected by a dense network of canaliculi. Visible with the naked eye are the spaces
for the blood vessels, called vascular canals. Their number depends on bone tissue as well as
on species, and they can appear in various orientations. Thus, a specific bone type is not only
characterized by its bone tissue, the vascular system is also very important for classification
and interpretation. When a vascular canal is enclosed by primary bony tissue, it is called a
primary osteon. Nevertheless, bone tissue can also be avascular.
Secondary bone tissue is the result of substitution of primary bone tissue by secondary
bone in a process called remodeling. Initially, remodeling starts with erosion of bone by
osteoclasts along vascular canals (resorption). Later, after resorption has decreased, the whole
cavity, even the original vascular canal, is refilled by centripetally deposited bone and is now
called a secondary osteons or a haversian canal. Usually the wider the cavity, the younger the
secondary osteon is. Secondary osteons can clearly be distinguished from primary osteons by
a resorption line or cementing line surrounding them. Haversian bone appears when several
generations of secondary osteons are deposited and the bone between the latest generation of
secondary osteons is also secondary (CHINSAMY 1994). The functional meaning of
reconstruction and remodeling is not really clear yet. It seems to be linked with the
mechanical and physiological stresses which a bone or a part of bone has to endure during its
life. It also seems to be a gradual process related to the age of the tissue at a specific site.
Remodeling is not a species- or bone-specific feature as very young individuals can also show
remodeling.

4
For skeletochronology the primary bone tissue is the most interesting part of bone
microstructure because it contains the main information about growth rates, which means the
rate of bone deposition and degree of vascularization, as well as growth marks.
Primary bone tissues are classified according to the thickness and arrangement of the
collagen fiber bundles that build the bone tissue. FRANCILLON-VIEILLOT et al. (1990)
distinguish three main types of bone tissue in vertebrate bones, but additionally there occur
many intermediate bone tissues (FRANCILLON-VIEILLOT et al. 1990, REID 1997b).
Lamellar bone corresponds with a high level of spatial organization. The crystals are
oriented only in one direction. Lamellar bone stands for slow growth, due to the rule that the
higher the level of organization is, the slower is growth. Lamellar bone consists of successive
thin layers called lamellae and has a plywood-like structure. The collagen fibrils in one
lamellae are virtually parallel but their direction changes from one lamella to the next. Thus,
lamellar bone will appear alternately dark and bright in polarized light.
In parallel-fibered bone, the closely packed collagen fibril all have the same general
orientation. Parallel-fibered bone appears homogeneously dark or light under polarized light,
depending on the orientation of the collagen fibrils (FRANCILLON-VIEILLOT et al. 1990). This
bone tissue appears to be intermediate between woven bone, to be discussed next, and
lamellar bone.
Woven-fibered bone consists of coarse and loosely packed collagen fibers of varying
sizes. There is no spatial order, and this bone tissue corresponds therefore to fast growth and a
high vascular density. Under polarized light, the woven bone shows no extinction.
If a bone tissue largely consists of one of these three bone types, it is called woven-fibered
bone tissue, parallel-fibered bone tissue, or lamellar bone tissue.
In many tetrapod bones, woven bone is associated with lamellar bone. The resulting
structure is called fibro-lamellar bone tissue or fibro-lamellar complex. This bone tissue
grows by first laying down a three dimensional network of vascular canals. Between the
vascular canals, the bone tissue is deposited, mostly in form of primary osteons. A primary
osteon built in the fibro-lamellar bone tissue contains the lamellar bone in the central part of
the primary osteon and is surrounded by the woven or fibrous bone. Fibro-lamellar bone
tissue is always densely vascularized with various arrangements of vascular canals. It is a
very common bone tissue in dinosaurs, birds, and mammals, and is indicative for rapid
growth (RICQLÉS 1980, REID 1987, FRANCILLON-VIEILLOT 1990, RICQLÉS et al. 1991,
CHINSAMY 1993b, 1994). According to RICQLÉS et al. (1991), the fibro-lamellar bone (FBL)
is a prerequisite for large tetrapods to reach adulthood within reasonable longevities.

5
Three main types of vascularization can be found in the fibro-lamellar bone tissue.
Vascularization can be distinguished by the orientation, by the shape of single vascular
canals, and by the network of the vascular canals. Laminar bone tissue describes a kind of
vascular system with mainly longitudinal and circular primary osteons which are oriented in
more than one direction. In plexiform bone tissue, vascularization is one step higher in the
vascular density and beside the laminar vascularization plexiform bone tissue contains radial
vascular canals, even in more than one direction. The highest vascular density is represented
by reticular bone tissue. Here, vascular canals have an oblique orientation in more than one
direction and are rather irregular.
A second common bone type is the lamellar-zonal bone that is characterized by an
alternate deposition of lamellar and parallel-fibered bone with mostly longitudinal vascular
canals and significant growth marks (FRANCILLON-VIEILLOT et al. 1990). Lamellar-zonal
bone is associated with slow and cyclically interrupted growth, such as is known from many
extant ectothermic tetrapods.
Growth rates are not only determinated by bone tissue, but also the thickness of the
single bone layers give information about the speed of deposition. Wide layers of bone grow
more rapidly than fine layers of bone (RICQLÉS et al. 1991).
As a new study of STARCK & CHINSAMY (2002) had shown that rates of bone
deposition and bone microstructure vary strongly in response to environmental conditions.
Thus, quantitative comparison of bone tissue and growth rates from extinct and extant
vertebrates remains difficult (STARCK & CHINSAMY 2002). Others, like ERICKSON &
TUMANOVA (2000) had given attention to this point before and mentioned uncertainties
regarding environmental influences on dinosaurian growth. ERICKSON et al. (2001) pointed
out that the same bone tissue can be produced at different rates. The best example is that some
reptiles under certain environmental conditions can attain maximal growth rates within the
lower bounds of mammalian rates (ERICKSON & TUMANOVA 2000).
Growth in general is continuous or periodically interrupted. Periodic growth
occurs independently of bone tissue or type, and primary bone tissues can be subdivided by
growth lines or other growth marks (RICQLES 1983, REID 1990, CHINSAMY 1994, PADIAN
1997). Growth marks are successive layers that are characterized by differences in bone
tissue, orientation of vascular canals, and vascular density (REID 1990). Such growth marks
are heterogeneous in form and causation (PADIAN 1997), but all indicate a cyclical manner of
growth. In many tetrapod long bones, growth cycles are built up of the fast-growing and
highly vascularized zone and the slower growing and less vascularized annulus. Often growth

6
cycles end in a line of arrested growth (LAG). A LAG can be accompanied by a ring of
avascular bone (PADIAN 1997). Lines of arrested growth indicate a temporary but complete
growth stop during ontogeny (CHINSAMY 1994, PADIAN 1997). Beside major LAGs
subordinated LAGs or second order LAGs can be distinguished (REID 1990). Because there is
no other cycle known to produce such a pattern, a zone and an annulus/LAG form one annual
growth cycle (CHINSAMY 1994). Zones, annuli, and LAGs do not inevitably occur or go
together, but LAGs are most of the time present when growth is cyclical. Skeletochronology
and aging of individuals in extant and extinct tetrapods usually is based on the count of
annually deposited growth cycles (CASTANET & SMIRINA 1990; FRANCILLON-VIEILLOT et al.
1990). However, a bone tissue can also be azonal which indicates continuous growth.
In contrast to earlier views (RICQLES 1974, 1976, 1978, BAKKER 1986), today it is
generally accepted and documented among various studies that growth marks and LAGs are
very common in dinosaur bones (REID 1990).
1.3 Previous work: Results on and problems of tetrapod bone histology
1.3.1 General aspects
The most important premise of paleohistological studies is the actualistic principle
(CHINSAMY & DODSON 1995, REID 1997). This means that types of bone tissues and growth
rates were principally similar and comparable in extant and extinct organism (HORNER et
al.1999). Thus, growth rates of extinct tetrapods, as deduced from bone tissues and in
comparison with growth rates of living tetrapods, can give an indication of their physiology
and other biological aspects.
The qualitative analyses of life history is based on Amprino’s rule (RICQLÉS et al
1991), which states that a particular bone tissue is deposited always at the same general rate
(AMPRINO 1947). This rule has been tested in many different recent taxa and seems to be
generally valid, although the database is still limited (RICQLÈS et al. 1991, REID 1997). Based
on these premises, histological studies on recent animals can provide a detailed and solid
database for paleohistological studies.
General assumptions, deduced from recent tetrapod bone histology, are that a bone
with increasing thickness of the cortex shows decreasing vascularization accompanied by an
increasing organization of the tissue and an increasing number of growth rings.
Simultaneously, growth cycle distance decreases. Thus, a general decrease of growth rate with
increasing age (= thickness of cortex) is implied (CHINSAMY 1993b, 1994).
7
More specific results are that avascular tissue or nearly avascular tissue occurs only
when growth had stopped or the growth rate is generally very low. In contrast, highly
vascularized bone tissue generally goes together with rapid growth. The higher the vascular
density, the faster growth is, regardless of which bone tissue is deposited (RICQLÉS et al.
1991).
1.3.2 Skeletochronology
Interpretation of growth marks involves various problems (REID 1997). Thus, a great
point of discussion but also a basic premise in most works dealing with skeletochronology is
the annual deposition of the lines of arrested growth or of any other cyclical growth marks.
Following several authors (ZUG et al. 1986, CASTANET & SMIRINA 1990, FRANCILLON-
VIEILLOT et al. 1990, REID 1990, RICQLÉS et al. 1991, CASTANET et al. 1993, CHINSAMY
1994, REID 1997, HORNER et al. 1999, ERICKSON & TUMANOVA 2000), growth marks and
LAGs are interpreted as having been annual in the current study. This premise is supported by
studies of recent reptiles of known age (REID 1990, CASTANET et al. 1993). HORNER et al.
(2000) pointed out that LAGs in fibro-lamellar tissue may not entirely comparable to the
LAGs known from living ectotherms, which are deposited in lamellar-zonal tissue. On the
other hand, they illustrate annual LAGs in the elk (Cervus) and the polar bear, the bones of
which consist of fibro-lamellar bone, and they use the annual nature of LAGs in their own
studies (HORNER et al. 2000).
HORNER et al. (1999) suggested that some growth lines can indicate, for example,
illness, starvation, or temporary stress, due to the fact that such diseases of an individual often
go together with a growth cessation. Such “diseases-LAGs” appear also in bones of mammals
and birds and were surely not deposited annually. CHINSAMY and DODSON (1995) mentioned
that trauma can produce a temporary pause in growing mammals and birds.
Another problem in using bone histology for age estimates is that each skeleton
undergoes substantial histological changes during ontogeny because of longitudinal growth,
changes in shape, reproductive activity and fatigue repair (ERICKSON & TUMANOVA 2000).
Additionally, every bone of a skeleton has its own ontogenetic history (RICQLÉS personal
communication). Growth rate and bone tissue can vary within a single bone during ontogeny
as well as in different bones of a single individual (RICQLÉS et al. 1991, CHINSAMY 1993b).
Thus, growth stops at somewhat different stages in the varying bone types (CHINSAMY 1994)
due to morphological growth allometries. Some bones, for example, grow asymmetrically,
and growth cycles may be restricted to the parts where growth was slowest (REID 1997b).

8
This means that the same bone sampled at different regions as well as different kinds of bones
of a single individual may present a different microstructure of bone and therefore a different
growth history, mainly expressed by a varying number of LAGs (RICQLÈS 1983, CHINSAMY
1993a, HORNER et al 2000) or by the deposition of different bone types. On the one hand, this
makes standardized sampling locations for each bone type necessary (RICQLÈS 1983, REID
1990, CHINSAMY 1993a, b). On the other hand, it is necessary to sample different kinds of
bone from an individual to get the most complete growth record. If this is not possible, long
bones like femora and tibiae should be preferred. In most taxa long bones have the greatest
number of LAGs and are generally well suited for bone histological research as has been
documented in several studies (e. g. CHINSAMY 1990, 1993a, b, HORNER et al. 2000, SANDER
1999, 2000, ERICKSON & TUMANOVA 2000). According to RICQLÈS (1983), some pelvic
girdle bones are also well suited for recording growth cycles.
Due to resorption from the medullary cavity outward and reconstruction of bone, only
the last part of growth is completely recorded in the cortex of adult individuals. Resorption
and remodeling starts early in ontogeny, and both vary in extent from bone to bone and group
to group. Thus, the growth record in most bones of sub-adult and adult individuals is quite
incomplete and makes estimates of the number of resorbed cycles by extrapolation necessary
(CHINSAMY 1993a, REID 1997).
Additionally, many tetrapods grow in the different ontogenetic stages (embryonic to
adult) with different growth rates (VARRICCHO 1993, CHINSAMY 1994, CURRY 1999, HORNER
et al. 2000, SANDER 2000, ERICKSON & TUMANOVA 2000). It thus is necessary to sample
different ontogenetic stages of one taxon to get the most complete growth record with a
minimum of error. Unfortunately, this is seldom possible due to the rareness of the available
fossil material.
1.3.3 Bone histology and growth in recent tetrapods
Highly vascularized azonal fibro-lamellar bone tissue is typical for birds and mammals
(CHINSAMY 1994). Both groups grow continuously fast from the juvenile to the adult
individual (FRANCILLON-VIEILLOT et. al. 1990, CHINSAMY 1994). Growth lines are generally
rare in birds and mammals and occur largely only in the outermost cortex in mature and adult
individuals in form of closely deposited LAGs, usually within low to avascular lamellar-zonal
bone (CHINSAMY 1994, CHINSAMY & DODSON 1995, REID 1997, HORNER et al. 2001,
ANDRASSY 2004). This indicates determinate growth in these groups. Adult size is reached in
birds and mammals approximately at the same time or only a short time after sexual maturity

9
is reached. The onset of sexual maturity corresponds generally with a drop in growth rate
(CHINSAMY & DODSON 1995).
Low to intermediate vascularized lamellar-zonal bone is characteristic for recent
ectothermic tetrapods. Throughout their whole ontogeny, the usually slow growth is
seasonally/cyclically interrupted by LAGs. This indicates clearly that their growth depends
strongly on exogeneous factors (winter/summer period; rainy/dry season in more tropical
areas). Reptiles grow in their first few years with relative high growth rates, but nevertheless
with cyclical interruptions. After reaching sexual maturity, in contrast to mammals and birds
they continue growth for sometimes several years, but with clearly lower growth rates than in
their first years of life. Thus, sexual maturity is often reached long before maximum size.
Recent studies show that reptiles generally grow faster in the favorable season than in the
unfavorable season (CASTANET & CHEYLAN 1979; CHINSAMY 1994). Thus, the favorable
season is represented by the broad zones, whereas the unfavorable season is represented by
the more narrow annuli (CHINSAMY & DODSON 1995). In temperate environments, the
favorable season corresponds usually with spring and summer whereas the unfavorable
season corresponds with autumn and winter. It is of quite some interest that reptiles living in
a-seasonal environments as well as reptiles that were housed under permanent optimal
conditions in captivity also show annual growth rings (RICQLÈS 1976, CHINSAMY 1994). As a
laboratory experiment has shown, endogeneous determination of seasonal rests, independent
of weather conditions, is documented for alligators (NEILL 1971), among others. NEILL (1971)
found that the loss of appetite and the lowering of glycogen levels, which generally
accompany the inactive season in winter, occur in captive alligators independently of
illumination and temperature. The same endogeneous determination can be assumed for
cyclical growth in alligators. Thus, cyclical growth depends not only on exogeneous factors,
but the production of these lines may merely be a function of endogeneous rhythms. A further
important observation in recent reptiles is that at least the juveniles of crocodiles and some
turtle species are able to grow under optimal exogeneous conditions (climate, food
availability/quality) fast enough to form fibro-lamellar bone (RICQLÈS 1983, REID 1997) and
can attain growth rates similar to mammalian rates (ERICKSON & TUMANOVA 2000).
On the other hand, bad environmental conditions over long periods can also affect the
growth history of an individual. An extreme case was recently described for the marine
iguana Amblyrhynchus christatus of the Galapagos that can shrink up to 20% of its original
body length in only two years as a result of low availability of food, resulting from “El Nino”
10
events. After environmental conditions have stabilized (subsequent “La Nina”), body length
increases again (WIKELSKI & THOM 2000).
Oviparity is also documented in the skeleton for nesting Iguana iguana in the
development of lines of arrested growth (ZUG & RAND 1987). CHINSAMY (1990) found in the
robust morph of Syntarsus rhodensiensis extensive osteoporotic resorption cavities which
probably were formed during egg laying. Among others, CHINSAMY (1997) describes for
recent female birds the deposition of endochondral bone in the medullary cavity which acts as
mineral store during ovulation. Histological changes during the reproduction period are also
documented for alligators (WINK et al. 1987).
1.3.4 Growth in dinosaurs
Comparison of histological data shows that the very diverse group of the dinosaurs
shows a relatively uniform bone microstructure, presumably inherited from a common
ancestor.
Some dinosaurs grew continuously and rapidly with high vascularized fibro-lamellar
bone, and their growth rates are comparable to that of large fast growing mammals (REID
1997, ERICKSON et al. 2001) and precocial birds (ERICKSON et al. 2001). Others show lower
vascularized fibro-lamellar bone or a bone type indicating slower growth within a periodic
growth pattern as seen in modern reptiles. Some other dinosaurs show both growth patterns in
different parts of their skeletons (REID 1997, ERICKSON et al. 2001). Deposition of dense
lamellar bone with closely spaced LAGs is rare in dinosaurs but is documented for some. Its
assumed that such closely spaced LAGs indicate a determinate growth in dinosaurs, too.
Further, it is documented that these dinosaurs had lived for several years after active growth
ceased (REID 1997, SANDER 2000). A similar tissue in the outermost cortex of some tetrapods
is described as external fundamental system (HORNER et al. 2000).
CHINSAMY & DODSON (1995) raised the question why dinosaurs were able to form
fibro-lamellar bone: Was it because they have had an innately high metabolic rate or was the
deposition of fibro-lamellar bone driven by favorable environmental conditions, like it is
possible in some captive reptiles? Compared with bone tissues known from recent groups
dinosaur bone tissue seems to be “intermediate” between the tissue of ectotherms and
endotherms (equally if LAGs were present or absent). This had lead to much debate and
controversy discussion about the physiological status of dinosaurs. According to REID (1990)
dinosaurian physiology should not be pictured as reptilian or avian/mammalian, but simply
dinosaurian, and as having no true modern counterpart. However, bone histology is not

11
directly correlated with thermoregulation, but it gives insights into bone depositional rate,
growth rate, and growth strategy (REID 1990, CHINSAMY 1994). ERICKSON & TUMANOVA
(2000) mentioned that growth rates are a strong indicator of metabolic and physiological
status in vertebrates, but environmental influences on dinosaurian growth were not be
considered.
Some authors had assumed that the presence of growth cycles, like LAGs, represents a
clear indication that dinosaurs grew more in the reptilian way, while others argued that the
fibro-lamellar bone tissue and the appearance of Haversian bone in dinosaurs were a criterion
for a mammal-like endothermic physiology, as reviewed in CHINSAMY (1993b, 1994). But
REID (1997b) mentioned that fibro-lamellar bone and Haversian bone are not documented in
many small birds and mammals, although they have the highest metabolic rates. Today it is
generally recognized that fibro-lamellar bone tissue is not restricted to endotherms
(CHINSAMY 1993), as it was assumed sometimes by earlier workers (BAKKER 1986). ENLOW
(1969), RICQLÈS (1974, 1983), and REID (1987, 1990) had described the appearance of fibro-
lamellar bone tissue among a wide range of ectotherms and therapsids. Even some crocodiles
and turtles show it (REID 1997), too. On the other hand, zonal growth is not inevitably
restricted to ectothermic tetrapods (CHINSAMY & DODSON 1995). HORNER et al. (1999)
pointed out that LAGs, and therefore cyclical growth, is a plesiomorphic feature for
vertebrates and suggested that LAGs had no particular physiological meaning because they
appear in several orders of mammals. This was also documented by KLEVEZAL (1996) and
ANDRASSY (2004). HORNER et al. (2000) suggested that the occurrence or absence of LAGs
has nothing to do with the ontogenetic stage, the metabolic rate or environmental tolerance.
As result of the various histological studies about dinosaur bone histology, today it
seems to be clear that most dinosaurs grew with bone tissues and growth rates which in this
combination are not present in any extant tetrapods and which is therefore not really easily
compared. Most dinosaurs grew with higher rates than extant reptiles, but not all grew as fast
as mammals and birds do. Thus, the bone microstructure in dinosaurs shows that they differed
physiological from modern tetrapods (REID 1990, 1997). Nevertheless, dinosaurs must have
had a stable and efficient circulatory system, comparable and maybe similar but not
necessarily equal to that of large recent mammals. CHINSAMY (1994) argues that the cyclical
growth in some dinosaurs shows that at least these dinosaurs were not able to maintain a high
growth rate throughout each year or their whole life.
That fibro-lamellar bone in dinosaurs is not only a product of mass effects, as HOTTON
(1980) had suggested, is shown by its occurrence in hatchlings and in smaller dinosaurs (REID

12
1997). ERICKSON et al. (2001) show that dinosaurs had growth curves, similar to those of
other tetrapods, but with unique growth rates in respect to their body mass. They concluded
that growth rates in vertebrates generally increase with respect to body mass (ERICKSON et al.
2001).
1.4 Aims of research
The prosauropod Plateosaurus engelhardti from the Norian Knollenmergel beds
(Keuper) of Central Europe is of great interest for bone histological research. One reason is its
relatively early (Triassic) occurrence. Only a few studies deal with Triassic dinosaurs, like
Syntarsus rhodensiensis (CHINSAMY 1990) and Massospondylus carinatus (CHINSAMY 1993).
Up to now, most bone histological studies had concentrated on Jurassic and Cretaceous
dinosaurs like sauropods (CURRY 1999, SANDER 1999, 2000, SANDER & TÜCKMANTEL 2003,
SANDER ET AL. in press), hadrosaurs (HORNER et al. 1999, HORNER et al. 2000), and
ceratopsians (ERICKSON & TUMANOVA 2000). These “late” dinosaurs all show very high
growth rates, which indicate rapid growth, similar to that of recent mammals. Thus, the
physiology of those dinosaurs must be quite highly developed to make such fast growth
possible. A basic question thus is when this high growth rates evolved or if the dinosaurs had
it quite from their origin.
Another reason which makes the prosauropod Plateosaurus engelhardti attractive for
histological study is that the prosauropods are related to the sauropods, and possibly the bone
histology of Plateosaurus engelhardti can answer the question of or at least give hints on how
the sauropods beginning in the Late Triassic were able to grow to such gigantic body sizes.
Additionally, Plateosaurus engelhardti is well suited for bone histological study
because there are several dozens of complete and incomplete individuals of the same or
closely related species from at least three Plateosaurus bonebeds. Thus, a selection of useful
and well-preserved sample material, mainly long bones, is available and provides a very good
database for bone histology.
Thus, a bone histological study of an ontogenetic series of Plateosaurus engelhardti from
hatchling to juvenile to sub-adult and adult is not possible, due to the lack in the fossil record
of individuals smaller than 4.80 m total body length.
The specific aims of the present work are to describe and document the bone histology
of Plateosaurus engelhardti. The main focus is on the bone tissues and the kinds of
vascularization of different bones and at different sampling locations in single bones.
Histological differences within samples of single individuals and between the different bones

13
as well as histological differences between samples from the different localities (Frick and
Trossingen) are to be documented and discussed. Growth rates, counts of growth marks, and
extrapolation methods are used for aging the adult individuals.
On the basis of these data, life history aspects such as longevity (age at death time),
possible age at sexual maturity, growth determination, age at growth cessation, and sexual
dimorphism are deduced for Plateosaurus engelhardti. Bone histology can also answer the
question if there is a correlation between age and body size. Additionally, the growth strategy
and life history data of Plateosaurus engelhardti will be compared briefly with that of other
prosauropods, sauropods, and some recent tetrapods.
1.5 Museum abbrevations
AMNH American Museum of Natural History, New York, USA
HMT Heimatmuseum Trossingen, Trossingen, Germany
IFG Institut für Geowissenschaften, Universität Tübingen, Germany (früher: GPIT,
Institut für Paläontologie und Geologie der Universität Tübingen)
IPB Institut für Paläontologie, Universität Bonn, Germany
MSF Sauriermuseum Frick, Frick, Kanton Aargau, Switzerland
NAA Naturama, Aarau, Kanton Aargau, Switzerland
PIMUZ Paläontologisches Institut und Museum der Universität Zürich, Zürich,
Switzerland
SMA Sauriermuseum Aathal, Aathal, Kanton Zürich, Switzerland
SMNS Staatliches Museum für Naturkunde, Stuttgart, Germany
2. Previous work on prosauropod bone histology
Several of the early works on bone histology make mention of prosauropods,
especially Plateosaurus. But most of them have only a descriptive character (SEITZ 1907,
GROSS 1934). CURREY (1962) already used bone histology to imply that prosauropods had a
physiology similar to that of large advanced herbivorous mammalians and not similar to that
of primitive reptiles, and also not similar to that of small and carnivorous mammals. Counting
growth cycles and computing growth rates to obtain information about life history was only
done by RICQLÈS (1968) and later by CHINSAMY (1993). In fact, RICQLÈS (1968) was the first
to recognize the importance of prosauropods for sauropod evolution. Nevertheless, all
previous authors agree that the main primary bone tissue in prosauropod long bones consist of
laminar fibro-lamellar bone.

14
One of the first to comparatively study on bone histology in fossil tetrapods was SEITZ
(1907). Among other taxa, he described the histology of a tibia of Plateosaurus. SEITZ (1907)
observed laminar bone tissue with predominating longitudinally and only partially radial
vascular canals although he did not use this terminology. Predominately in the inner compacta
along the longitudinal canals, the tibia shows erosion and Haversian reconstruction in form of
secondary osteons. A longitudinal section of the same bone shows a longitudinal orientation
of the primary vascular canals. In addition, a number of circular canals are scattered
throughout the section.
In his study about the microstructure of bones in different fossil “stegocephalians” and
reptiles, GROSS (1934) described a cross section and a radial section through a tibia of
Plateosaurus from the locality of Halberstadt. The cross section shows laminar bone with
dominating circular and fewer radial vascular canals. GROSS (1934) first mentioned numerous
secondary osteons in this sample but only gave a short description of the histology of the
sample without any biological interpretation. Beside this, GROSS (1934) illustrated growth
rings but at that time he did not recognize their meaning (CHINSAMY & DODSON 1995).
ENLOW & BROWN (1957) mentioned the histology of Plateosaurus only in a short
paragraph in connection with that of Brachiosaurus. They described the bone structure of
“certain compact areas” (ENLOW & BROWN 1957) of both taxa as typical plexiform tissue in
which Haversian bone dominated locally. ENLOW & BROWN (1957) only referred to the figure
of Plateosaurus in GROSS (1934: 754, figure 13) but did not study Plateosaurus first-hand.
They recognized the convergent evolution of this bone tissue with that of several mammalian
groups, predominately the artiodactyls.
CURREY (1962) gave a detailed description of the cortical compact bone of a
vertebral center of a prosauropod dinosaur from the middle Upper Triassic of Zimbabwe and
of an unidentified long bone from another prosauropod species. Right in the beginning, he
drew attention to the fact that different bones show a different histology, even in the same
individual. CURREY (1962) described for both specimens a laminar vascular system with
alternating lamellar and woven bone tissue. Indeed, he recognized that the amount of woven
bone in the long bone sample is significantly higher than in the vertebral bone sample. There
also were differences in laminae thickness, and the long bone shows Haversian systems
scattered throughout the cortex. He described that the laminae in the prosauropod sample
were spaced more closely than the laminae in mammal bone samples he studied for
comparison. As did ENLOW & BROWN (1957), CURREY (1962) pointed out that this kind of

15
laminar vascularization is very untypical for modern reptiles but common in recent
artiodactyls. After the comparison with the bone histology of recent tetrapods CURREY (1962)
concluded that laminar bone is associated with a herbivorous way of life. He pointed out that
the dinosaurs seem to agree more with some herbivorous mammals in physiological
specialization than with living reptiles.
RICQLÈS (1968) summarized the work on Plateosaurus bone histology published up to
that time, and on the basis of the published illustrations added the conclusion that the primary
bone tissue in Plateosaurus consists of normal laminar tissue with predominately longitudinal
vascular canals. Circular vascular canals are less frequent but well developed, whereas radial
vascular canals are very rare in the Plateosaurus bone tissue. Secondary osteons were
described as very common in the samples. RICQLÈS (1968) identified this bone tissue in the
Plateosaurus long bones as plexiform. Afterwards he added his own histological observations
from a quadrupedal prosauropod, the melanosaurid Euskelosaurus browni of the Upper
Triassic Maphutseng Formation of Lesotho. He found the primary bone tissue of
Euskelosaurus browni to be very similar to that of Plateosaurus. It shows scattered bundles of
longitudinal vascular canals with regular layers of circular vascular canals and only a few
radial vascular canals. RICQLÈS (1968) compared the bone tissue of the prosauropods with
that of the sauropod “Bothriospondylus” (now assigned to Lapparentosaurus). He came to the
conclusion that both groups show a plexiform bone type but differ in some details. He
believed it possible that the sauropod tissue evolved from the prosauropod tissue.
On the basis of a shaft segment of a femur and three rib fragments, REID (1990)
described the bone histology of the prosauropod Massospondylus. The compact bone of the
femur is non-zonal with a laminar vascular system. The cortex of the rib fragments show
finely lamellated zonal tissue in which zones are separated by rest lines or annuli between
paired rest lines. The vascular canals run longitudinally, and the vascular density is generally
sparse to moderate, locally even avascular. Secondary osteons in the deeper parts of the cortex
are present. There is a core of secondary cancellous and compact bone. Seven zones could be
counted between the secondary bone area and the external surface of the rib (REID 1990).
REID (1990) studied a second genus of prosauropods (Euskelosaurus), sampling a
segment from the middle part of a rib. This rib also shows clearly zonal bone in the outer
parts of the sample. Resting lines, to which annuli are locally added, separate the zones here
as well. Altogether, 12 zones could be counted in this rib. Vascular density is high in most
parts of the bone. The rib shows longitudinal vascular canals at the center of small cylindrical
primary osteons, which are set within a “non-lamellated matrix” (REID 1990: 26). Secondary
16
osteons are scattered irregularly throughout the cortex. REID (1990) agrees with RICQLÉS
(1968) that Euskelosaurus generally forms zonal and non-zonal bone, and that limb bones
consist of laminar fibro-lamellar bone.
CHINSAMY (1993) did the first comprehensive work on prosauropod bone histology,
studying transverse sections in a growth series of femora of the South African prosauropod
Massospondylus carinatus. The sections were all taken from below the fourth trochanter.
CHINSAMY (1993) described the subdivision of the cortex of the femora sampled into growth
rings (annuli and zones) and observed a connection between increasing age and decreasing
spacing of annuli and zones. Generally, deep in the cortex, wider growth rings are deposited
than in its periphery. In contrast to the theropod Syntarsus rhodensiensis, also studied by her
(CHINSAMY 1990), the sampled femora of M. carinatus contain no closely spaced resting lines
in the periphery of the cortex. Therefore, M. carinatus shows no “slowing of growth in its last
stages” (CHINSAMY 1993). Between the annuli, the primary bone tissue of M. carinatus
consists of fibro-lamellar bone with a high vascular density. The annuli themselves consist of
nearly avascular lamellar bone. Primary osteons are predominately longitudinally. Secondary
osteons are scattered through the whole cortex with a predominance in the mid-cortical to
peri-medullary region. Also, cancellous bone tissue is widespread around the medullary
cavity, and the transition from compact to cancellous bone is described by CHINSAMY (1993)
as abrupt. The histological samples of M. carinatus of different individuals vary in number
and width of the growth rings. Resting lines seems to occur more frequent in the later stages
of bone deposition.
CHINSAMY (1993) interpreted the deposition of fast and slow growing bone areas
observed in M. carinatus as similar to the growth pattern of crocodilians and other
ectothermic tetrapods. Thus, she concluded that the bone deposition of Massospondylus
carinatus was seasonally cyclical (CHINSAMY 1993). CHINSAMY (1993) found difference
between M. carinatus and crocodilians in the distribution of secondary osteons. In M.
carinatus they were scattered throughout the whole cortex as a result of bone resorption and
subsequent redeposition, while in crocodilians secondary osteons appear only in the peri-
medullary region as a result of cancellous bone formation (CHINSAMY 1993). Therefore, M.
carinatus shows bone resorption and subsequent re-deposition, which is in this form untypical
for reptiles (RICQLÈS 1976, CHINSAMY & DODSON 1995).
Based on the assumption that one annulus and one zone represent one annual growth
cycle, CHINSAMY (1993) counted the observed growth rings in the different femur samples of
M. carinatus. To give a complete age estimate as possible of the sampled individuals, she

17
added her estimate of resorbed growth rings to the counted visible growth rings. She
estimated the total LAG number by using the width of the initial zones of the smallest
specimen. This method results in a total age for the sampled M. carinatus individuals between
2 and 15 years, at a total femur length between about 12.0 cm and 44.0 cm. A regression
analysis of the plot of the number of growth rings versus femur length brought out that the
best correlation is reached with a power curve. The implication is that growth rate changes
during ontogeny (CHINSAMY 1993). Growth in Massospondylus carinatus initially was rapid
and slowed down subsequently. On the basis of this growth curve, CHINSAMY (1993) had
used a mathematic equation to determine the length increase of the femur in five-year steps. A
significant decrease in growth with time could be shown with this method. Based on these
mathematical data and bone histology of the femora, CHINSAMY (1993) came to the
conclusion that growth clearly decreased in Massospondylus carinatus with increasing age
but did not really stop. Thus, growth continued “indefinitely”, although at a decreasing rate
(CHINSAMY 1993). Such an indeterminate growth strategy is typically reptilian, and according
to CHINSAMY (1993), the implication is that M. carinatus has had a physiology similar to
ectotherms. On the other hand, she recognized that the highly vascularized fibro-lamellar
bone tissue of Massospondylus carinatus indicates very rapid growth during the favorable
season. This feature associated M. carinatus more closely with endotherms. CHINSAMY
(1993) concluded from this that Massospondylus carinatus occupied an intermediate
physiological level between ectotherms and endotherms.
FOELIX (1999a: figure 4, 5; 1999b: figure 10) illustrated thin sections of Plateosaurus
ribs from the locality of Frick. He documented growth rings in the outer parts of the rib
samples and suggested periodic growth for Plateosaurus.
Of quite some interest are the results of the histological examination of
Thecodontosaurus antiquus (CHERRY 2002). CHERRY studied 17 thin sections made from
femora, tibiae, humeri, phalanx, and ribs. All sections showed fibro-lamellar bone, but LAGs
occur only in the rib. However, she noted that it cannot be excluded that sampled bones
derived only from juvenile individuals, and therefore LAGs in the limb bones were not
deposited yet. From the fibro-lamellar bone tissue, CHERRY concluded a relatively rapid
growth rate and a physiology intermediate between ectothermy and endothermy for T.
antiquus. Furthermore, she suggests that similarities in growth rate and pattern between the
basal dinosaur T. antiquus and more derived dinosaurs may have been inherited from a
common ancestor.

18
3. Plateosaurus from Central Europe
3.1 General systematics and occurrence
The genus Plateosaurus belongs to the Prosauropoda, which together with the
Sauropoda forms the Sauropodomorpha (HUENE 1932). The main features of the
Sauropodomorpha are a small head on an elongated, thin neck, a massive trunk and a long
tail. The kind of locomotion (bipedally or quadrupedally) varies, depending on body size and
body mass. Thus, a quadrupedally walk on columnar legs is assumed for some large
prosauropods and all sauropods. Some authors support the view that the prosauropods are a
monophyletic sister clade to the sauropods (SERENO 1989, GALTON 1990), while others
believe a prosauropod, like the name suggest, was the ancestor of the sauropods (HUENE
1932, COLBERT 1964, BENTON et al. 2000, YATES 2001) and forms the stem-group of the
sauropods. In the latter case, the prosauropods would be a paraphyletic group with some taxa
more closely related to the sauropods than others. The phylogenetic relationship between the
two groups has not really been resolved yet, however (BENTON et al. 2000, WILSON 2002).
Prosauropods are medium to large-sized dinosaurs, with a length from around 2.5 m to
a maximum of 10 m. The postcranial skeleton of prosauropods is very uniform in contrast to the complex skull. Prosauropods have been found virtually worldwide. Stratigraphically, they
appear in the middle Carnian and disappear at the end of the Toarcian, with a predominance in
the fossil record beginning in the Norian (GALTON 1990). Plateosaurus itself appears in the
upper middle Keuper (Norian) and disappears in the Rhaetian. In Central Europe, the remains
of Plateosaurus were mainly found in the Stubensandstein and the Knollenmergel Beds of
late Norian or early Rhaetian age or in stratigraphically equivalent marls and mudstones
(GALTON 2001).
3.2 Anatomical features of Plateosaurus
A precise osteological description of the studied bones is unnecessary here, because
details can be found in the literature (HUENE 1926; GALTON 1985; 1986, 1990; VAN HEERDEN
1997). Thus, only a brief anatomical description is given here, including bone features
observed on the Plateosaurus engelhardti material from Trossingen investigated for this
study.
Plateosaurus is characterized by a small skull, a long neck, a moderately barrel-shaped
trunk, and a long tail. The body mass seems to be concentrated in the pelvic region (VAN
HEERDEN 1997). The axial skeleton consists of a proatlas, ten cervical vertebrae, fifteen trunk
or dorsal vertebrae, three fused sacrals with the pelvis, and around fifty tail vertebrae. Ribs are

19
found on the dorsal vertebrae, and thin, pointing backward cervical ribs are found along the
neck. A well-developed gastral basket is present. The dorsal vertebrae increase in size
gradually towards the pelvis, and the tail vertebrae decrease toward the tip of the tail. The
appendicular skeleton consists of a typical dinosaur Bauplan. Only the manus possess a
conspicuous feature, a trenchant and raptorial-like ungual on digit I. The femur of P.
engelhardti is sigmoidal in form, meaning it is curved distally in anteroposterior view
(GALTON 2001). This is according to GALTON (2001) one of the main features to distinguish
P. engelhardti from other Plateosaurus species. According to MOSER (2003), the sigmoidal
form of some femora as well as other morphological differences in the huge Plateosaurus
material from Trossingen was caused by paleopedogenetic effects: clay precipitation and
swelling processes. Thus, the distally straight or sigmoidal form of femora is the result of
their varying position in the sediment during fossilization, respectively paleopedogenesis
(MOSER 2003). MOSER (2003) noted that these features are not significant and are not suited
to distinguish different taxa.
3.3 Size, body mass, and biology of Plateosaurus Plateosaurus is a medium- to large-sized dinosaur, with a maximum length from snout
to tip of tail of around ten meters (WEISHAMPEL 1984). On the other hand, MOSER (2003)
thinks that the assumed maximum size of ten meter is too high for Plateosaurus, because this
size estimates are based on bones which were enlarged by clay swelling. For example, the left
femur with a measurable length of 99 cm (98 cm by MOSER 2003: 70) kept in the IFG
supposedly increased in length 25-30 % (MOSER 2003). Thus, according to this hypothesis,
the maximum body length of Plateosaurus must be reduced from ten meters back to around
7.5 meters. However, as the current study will show (section 6, 7), the histological record of
Plateosaurus bones is quite intact and provides no evidence for any diagenetic changes in
bone size, particularly bone length.
SEEBACHER (2001) determined the body mass for an individual of 6.5 m length of
Plateosaurus of around 1072 kg. SANDER (1992) estimated body mass of Plateosaurus by
using a scale model and calculated that an individual of 8 m length had a weight of 2179 kg
(table 6).
Plateosaurus has small, mostly homodont spatulated teeth, with a coarse marginal
serration. On the basis of the teeth, most authors assume a herbivorous diet for Plateosaurus
(GALTON 1990, VAN HEERDEN 1997). Plateosaurus was considered to be at least facultative
bipedal (GALTON 1990, UPCHURCH 1997). VAN HEERDEN (1997) discussed the fourth

20
trochanter of the femur as a rough indication for the usual kind of locomotion in dinosaurs.
The position of the fourth trochanter is in bipedal dinosaurs always proximal to the middle of
the length of the femur while it is lower down in the heavy, surely quadrupedally walking
sauropods. Due to the intermediate position of the fourth trochanter in Plateosaurus femora, it
was assumed by VAN HEERDEN (1997) that Plateosaurus was not as typical a biped as, for
instance, the theropods. For a predominately bipedal locomotion also argues the very well
developed thumb with its large, trenchant claw. The claw was possibly used in defence when
the animal stood on its hindlimbs or as a grasping organ for branches during high browsing. A
hand with such a construction appears ill suited as a walking organ (HUENE 1926). GALTON
(1990) suggested that the first ungual was held clear above the ground during quadrupedal
locomotion. A fully quadrupedal locomotion is excluded by most authors.
In contrast to these previous theories, MOSER (2003), after a detailed study of the
skeleton, mainly concerning the pelvis region and the tail vertebrae, came to the result that
Plateosaurus moves quadrupedally and carries the tail horizontally. MOSER (2003) does not
exclude a bipedal carriage, but only when Plateosaurus ran fast.
Plateosaurus is usually the most common terrestrial vertebrate in the beds in which it
occurs. Many fragmentary to complete articulated skeletons are known. Plateosaurus is also
found in mass accumulations. However, those do not necessarily represent the mass death of
e.g. a herd. Mass accumulations also can be the result of a normal background turnover of a
very common animal (WEISHAMPEL 1984, SANDER 1992; UPCHURCH 1997).
At its time, Plateosaurus together with other large prosauropods, was the largest
animal on land and apparently occurred in high individual numbers. According to GALTON
(1990), Plateosaurus represents at least 75% of the tetrapod finds from the Knollenmergel of
Germany. Therefore it is likely that Plateosaurus formed the majority of the vertebrate
biomass in its ecosystem. It presumable lived in a variety of environments. Herd life is not
documented for Plateosaurus until now, and an indication against it may be that Plateosaurus
lacks crests, frills, or other common display structures which are known from many theropods
and ornithischians for which herd life has been suggested (UPCHURCH 1997). Also SANDER
(1992) could not find any evidence in the Plateosaurus bonebeds of Central Europe which
would support or disprove the theory of herd life for Plateosaurus. It thus may have lived in
loose family assemblages or as single individuals.
WEISHAMPEL & CHAPMAN (1990) had done a multivariate morphometric analyses on
femora of Plateosaurus. They came to the conclusion that on the basis of the femora, two
morphs can be distinguished which may be sexual in nature and may represent a different

21
locomotory regime in males and females. The main features which led to their results are the
relative dimension of the proximal and distal articulations and the varying shape and size of
the fourth trochanter (WEISHAMPEL & CHAPMAN 1990). GALTON (1997) discussed more
marked differences, probably also indicating a sexual dimorphism, in the appendicular
skeleton of two other Upper Triassic prosauropods (Thecodontosaurus antiquus and
Melanorosaurus readi). GOW et al. (1990) suggested sexual differences in the skull of
Plateosaurus, but GALTON (2000) contradicted this, because the skull differences do not fit
with femoral differences. GALTON (1997, 2000) explains these differences as “probably
individual variations”. BENTON et al. (2000: 97) noted that HUENE (1908) already had
distinguished a robust and a gracile morph in the prosauropod Thecodontosaurus from
England, explaining this variation as due to two different species. According to BENTON et al.
(2000), variation in the postcranial skeleton of Thecodontosaurus could also be the result of
sexual dimorphism, like GALTON (1997) had suggested before, or of allometry and individual
variation.
Differences in morphology were seen by WELLNHOFER (1993) in the Plateosaurus
finds from Ellingen compared to those from Trossingen. He found the Ellingen specimens to
be more robust and massively built in contrast to the more lightly built and slender specimen
from Trossingen (WELLNHOFER 1993). GALTON (2000) suggested that these differences are
due to a sexual dimorphism, with the larger and more robust form from Ellingen representing
the female. According to MOSER (2000, 2003), the massiveness of Ellingen bones is the result
of pedogenetic swelling.
Plateosaurus engelhardti bones investigated for the present study show that among the
Trossingen material bones of a similar length show some slight morphological variations in
size and shape, mainly of the proximal epiphyses and in thickness/wide of the shaft diameter
which can be described as a more robust and a more gracile type. These differences cannot be
found throughout complete or nearly complete skeletons, only single bones were conspicuous.
Due to a similar size range of the studied bones, allometry effects can be ruled out as an
explanation. This leaves the possibility of two different species occurring in Trossingen which
seems unlikely because there no really significant and clear differences in morphology. Thus,
the observation best fit sexual dimorphism or individual variation as explanation.
MOSER (2003) believes that the high morphological variability of Plateosaurus bones
is the result of diagenetic effects (paleopedogenesis) and not of a biological nature.
Egg clusters are known from prosauropods from South Africa (GRINE & KITCHING
1987). MORATALLA & POWELL (1994) suggest altricial behaviour, at least for the prosauropod

22
Mussaurus, because of the association in a fossil nest of eggshell fragments and remains of
hatchlings. The hypothesis is that hatchlings may have remained in the nest for a certain time,
and one or both of the parents may have looked after them (UPCHURCH 1997).
3.4 Plateosaurus bonebeds of Central Europe
Plateosaurus was first described from the Feuerletten (Trossingen Formation) from
Heroldsberg near Nürnberg (Germany) on the basis of only a few vertebrae and hindlimb
bones as Plateosaurus engelhardti (MEYER 1837). Today Plateosaurus is known from many
skeletons, and from several dozens localities in the Norian beds of Germany, Switzerland, and
France (WEISHAMPEL & WESTPHAL 1986: Abb. 4). Several of these skeletons are complete,
making this animal one of the best-known Late Triassic dinosaurs. The most important of
these numerous localities are Halberstadt in central Germany, Trossingen in southwest
Germany, and Frick in northern Switzerland. These three localities were called “Plateosaurus
bonebeds” by SANDER (1992) due to the same taphonomic processes involved in their origin.
Each of these accumulations yielded a large number of fragmentary and complete skeletons.
In Halberstadt, the fossils were found in vary-coloured mudstones, which due to their
similarities in lithology, fossil content and stratigraphical position are correlated with the
Knollenmergel Beds (Trossingen Formation) in Southern Germany (SANDER 1992). The main
collecting phase for Halberstadt was between 1909 and 1913; during this time the remains of
35 individuals were found (JAEKEL 1914). The fossils were exposed during normal quarrying
activities and not by systematic excavation. In the time after 1923, several fossils were
recovered again. Since the 1940’s, the site is no longer accessible. From Halberstadt came,
except for Plateosaurus, the early turtle Proganochelys, and remains of a few other tetrapods,
for example theropod teeth.
The locality of Trossingen consists of two bone-bearing layers, the lower and the
upper bone layer. According to SEEMANN (1933) both bone layers belong to the
Knollenmergel Beds. GALTON (2001) assumed that the lower bone bed belongs to the highest
level of the Upper Stubensandstein (Löwenstein Formation) and the upper bone bed to the
Knollenmergel (Trossingen Formation). The majority of fossils came out of the lower bone
layer. The remaining Plateosaurus finds of southern Germany all belong to the
Knollenmergel (Trossingen Formation) (GALTON 2001). The stratigraphic position of the
Trossingen Formation and the uppermost Löwenstein Formation is still discussed. It is not
clear yet if they belong to the upper Norian or to the lower Rhaetian (GALTON 2001).

23
The locality of Trossingen was excavated in three phases. The first excavation
campaign was started by E. FRAAS from the Staatliche Museum für Naturkunde in Stuttgart in
1911 and 1912 (FRAAS 1913). Remains of 12 individuals were discovered during this time. F.
V. HUENE of the University of Tübingen continued the excavations from 1921 to 1923 with
financial support from the American Museum of Natural History; therefore half of the
discovered material was later shipped to the USA (HUENE 1928, 1929, 1944). During this
second excavation campaign in Trossingen, remains of 12 to 14 individuals were recovered.
The third and most productive excavation in Trossingen was in 1932, again initiated by the
SMNS, this time under the leadership of R. SEEMANN (SEEMANN 1932, 1933).
In these years, most of the Plateosaurus material available today was found, altogether
the remains of around 65 individuals, including seven nearly complete and articulated
skeletons and around 20 partially preserved skeletons (SANDER 1992). The majority of fossils
were isolated bones or small assemblages of disarticulated bones, and represents remains of
another 40 individuals. Thus, in total the remains of around 100 individuals were excavated in
Trossingen. In addition to Plateosaurus, only Proganochelys and theropod teeth were
discovered.
The fossils of the locality of Frick were embedded in the Upper Variegated Marls, a
greenish-grey mudstone, which is stratigraphically and lithologically similar to the
Knollenmergel of southern Germany (RIEBER 1985, SANDER 1992). Plateosaurus remains
from Frick were first discovered in 1961, but detailed investigation and excavation did not
start before 1976, by a then preparator of the Paläontologisches Institut und Museum der
Universität Zürich, U. OBERLI, in his spare time. From 1977 to 1979, a larger part of the
quarry was explored and several incomplete and disarticulated skeletons were found (SANDER
1992). The firm of IMHOF brothers led a second excavation campaign from 1983-1985, again
under the coordination of the PIMUZ (RIEBER 1985a, b ). Their most important find was a
nearly complete skeleton, but more disarticulated and incomplete skeletons were also found.
A large-scale excavation with a taphonomic aim in 1988 brought out some incomplete and
disarticulated skeletons as well (SANDER & GEE 1989a, b).
Altogether, the excavations at Frick produced five nearly complete and articulated
skeletons, around seven articulated posterior halves, and two articulated anterior halves. In
Frick, also one bone field of four disarticulated individuals of Plateosaurus was excavated.
Today the quarry in Frick (Tonwerke Keller AG) is still accessible, but since 1988
only one excavation was done in 1995, again under the leadership of the IMHOF brothers and
with the help of R. FOELIX (NAA) and H. MOOR (Neue Kantonschule Aarau) (FOELIX 1999a).

24
This excavation resulted in the remains of around 2-3 disarticulated and incomplete
individuals. In addition, several isolated bones were found which may partially belong to
these excavated individuals. Thus, the fossil remains of Plateosaurus in Frick belonged all
together to no fewer than 25 individuals.
Beside the Plateosaurus remains, some theropod teeth were discovered in Frick, too.
Two pleuralia provide evidence for the occurrence of turtles in Frick (KLEIN in prep.). In
addition to the rich material and the high number of individuals, which were found at all three
localities, there are further similarities according to SANDER (1992). First the large size of the
bonebeds is conspicuous. The finds were spread over thousands of square meters, and, with
one individual found per 100 m2, the sites show a loose spacing. The sites are largely
monospecific, the only other regular components are Proganochelys, and some shed teeth of
small theropods. The carcass position is similar in all three localities. Nearly all skeletons lie
on their belly, often with the posterior half deeper in the sediment than with the anterior half.
The anterior halves are often incomplete or disarticulated.
A further conspicuous point is that in none of these localities were any juveniles found
(SANDER 1992, MOSER 2003). The size of individuals of Plateosaurus specimens found in the
bonebeds ranges between 4.8 and 10 meters total length (figure 1).
The origin of the Plateosaurus bonebeds has been interpreted in the literature in
different ways. Early authors suggested that Plateosaurus got trapped and sank in seasonally
wet mud, respectively in a muddy swamp in a deltaic area (FRAAS 1913), or that the carcasses
were washed together by fluviatile transport (JAEKEL 1914).
HUENE (1928) thought that the Knollenmergel beds are the result of aeolian deposition
and that the mass accumulation of Plateosaurus originated by regular seasonal migrations of
Plateosaurus herds to distant feeding grounds through a desert. On their way, the weakest
individuals of the herd died (HUENE 1928).
During his excavation in Trossingen, SEEMANN (1933) analysed the sediment in detail
and came to the conclusion that the Plateosaurus specimens congregated in an arid area
around the last few water holes. Because of incautious behaviour or by other individuals,
pushing from behind they got into deeper areas of the waterholes and sank into the mud.
Finally they died of thirst. Later WEISHAMPEL (1984) and WEISHAMPEL & WESTPHAL (1986)
proposed a mudflow scenario. However, none of these theories have given a fully satisfying
answer to all open questions and special features of these localities.
With the relatively recent excavations in Frick, a new interest in the taphonomic
background started. SANDER (1992) was the first to recognize that the three localities

25
Halberstadt, Trossingen, and Frick, have the same origin. He reviewed the old theories and
available excavation notes from Halberstadt and Trossingen and added the results of the
excavations in Frick. He proposed the hypothesis that the taphonomic origin of the
Plateosaurus bonebeds is miring in floodplain mud, followed by mummification or carcass
disarticulation by theropod scavengers and weathering (SANDER 1992). SANDER (1992)
developed his theory about the origin of the Plateosaurus bonebeds mainly on the basis of the
fact that all complete or nearly complete skeletons were found in a uniform carcass position:
They are lying bellies down, with a typical hindlimb position with angled knees. In addition,
the hindlimbs were often buried deeper in the sediment than the rest of the individual. Due to
this uniform position, a post mortem transport must be excluded and an in situ death has to be
assumed (SANDER 1992). Additionally, no preferred orientation of isolated long bones can be
observed.
Although, some questions still left open, SANDER’S theory (1992) of miring fits best
with the observed facts known today.
3.5 Taxonomy of Plateosaurus from Central European bonebeds
Plateosaurus remains are relatively uniform in the postcranial skeleton and obviously
distinct features are often missing. Thus, it is difficult to distinguish them without a detailed
analysis of the complete skeleton. This led right from the beginning of studying Plateosaurus
to numerous descriptions of genera and species, often on the basis of incomplete skeletons.
JAEKEL (1913-14), for example, thought that the prosauropod fossils in Halberstadt
belonged to several species. HUENE (1932) believed that numerous species and genera occur
in Halberstadt and Trossingen. Thus, in this monograph about the order Saurischia, HUENE
(1932) described ten species in two genera (Plateosaurus and Pachysaurus) from Trossingen
and also two genera (Plateosaurus and Gressylosaurus) with nine species from Halberstadt
(HUENE 1932).
All more recent workers held the view that the middle Keuper Knollenmergel Beds
and sediments of equivalent stratigraphical position, like those occurring at Halberstadt and
Frick, contain only one species of prosauropods. This species is Plateosaurus engelhardti
(GALTON 1985, 1986, 1990, WEISHAMPEL & WESTPHAL 1986; WEISHAMPEL & CHAPMAN
1990, SANDER 1992). Differences in osteology within one locality and between the different
localities are small and can be explained by intraspecific variations or possibly by sex
differences (see above).

26
Currently, the discussion is being reopened with several authors working on the
taxonomy of Plateosaurus from Central Europe (GALTON 2000, 2001, Moser 2003). GALTON
(2001), in a detailed analysis of all Plateosaurus species ever described found that the
holotype of P. engelhardti is different in a few features from the material from Trossingen.
Thus, he concluded that P. engelhardti is only found in the Feuerletten (Trossingen
Formation) of Heroldsberg and Ellingen (GALTON 2001). On the basis of his analysis, he
referred all “non engelhardti”-specimens from the Knollenmergel and equivalent beds of
Germany, France, Switzerland, and Greenland to Plateosaurus longiceps. This species was
first described by JAEKEL (1913-14) from the Steinmergelkeuper (equivalent to the
Knollenmergel) of Halberstadt.
On the other hand, MOSER (2003) argues that all morphological differences occurring
in the Plateosaurus material of southern Germany are the result of diagenetic effects like
carbonate and clay precipitation during paleopedogenesis. According to MOSER (2003), only
Plateosaurus engelhardti is present in the higher Middle Keuper of southern Germany.
According to YATES (personal communication 2002) all finds of Plateosaurus from
Trossingen belong to a single species. YATES also believes that the species from Trossingen
and the material from Halberstadt are very close relatives. Plateosaurus remains from the
locality of Frick consist also only of one species, but they do not belong to the same species
as the Trossingen specimens, due to a few small but consistent differences. They are more
similar to the species from Halberstadt than to that from Trossingen.
For the current study the correct specific name is not important, only that the material
from Trossingen and Frick belongs each to a single species and that these species are close
relatives, if not the same species. All authors agree in this point. Due to Plateosaurus
engelhardti being the first described species, we use this name for all the species studied.
4. Material
4.1 Specimens studied
Due to their relatively simple appositional growth, predominately long bones like
femur, tibia, fibula, and humerus were used for studying growth in general and for
skeletochronology. Nevertheless, in the present study, also flat bones like pubis and scapula
are included. Other bone types such as vertebrae, ribs, foot phalanges and ischia were
sampled in rather limited numbers for comparative purposes.
Plateosaurus material from the localities of Trossingen (southern Germany) and Frick
(northern Switzerland) and material kept in the SMNS from other Knollenmergel Beds

27
localities was considered for the present histological study. Bones from Trossingen and Frick
localities were all measured and partially sampled. Bones from other localities were only
measured. Their data were used for comparison and to get an overview about the general size
range of bones and bone relations. Most of the studied material from Trossingen is kept in the
SMNS. Some bones were also sampled and measured in the IFG, where finds from the second
excavation period at Trossingen (1921-1923) are stored. The material from the excavations in
Frick is mainly kept in the MSF and NAA, some measurements were taken from specimens in
the SMA.
4.1.1 Plateosaurus engelhardti from Trossingen
The fossils from the first excavation of Trossingen and Plateosaurus engelhardti
remains from geographically associated localities were fully accessioned in the collections of
the SMNS. The material from the third excavation conducted by Seemann in 1932 is only
partially accessioned in the collection. Nearly half of the finds from this period are stored in
the magazine by their original field numbers (table 1, 2b). The material was prepared
mechanically soon after excavation periods. Thus, it mostly prepared out from the
surrounding sediment, and if necessary or possible, the bones were glued and partially
reconstructed with plaster. But the material was not soaked with any stabilizing liquor or
resin.
Field numbers given by SEEMANN during the 1932 excavation range from 1 to 65 and
represent the order in which the specimen were discovered (SEEMANN 1933) (table 1). One
find number may represent a large bone assemblages of several individuals, a complete or
nearly complete individual, or only a few bones (table 1, 2b). During preparation, it became
clear that some of the finds of only few bones can be assigned to individuals represented by
other find numbers. Find 3, 6, and 54 represent turtle remains. Find 1 and maybe some more
are today missing and were lost during World War II (1944) (personal communication R.
WILD, ZIEGLER 1986).
Before selection of material for histological examination, all the material surviving in
the SMNS and IFG was inventoried. The results are listed in table 2. On the basis of this
inventory, the minimum number of individuals (MNI) were determined for each find by
counting long and flat bones with a similar size and assigning them to right and left body
sides. Thus, finds 8 (only a right tibia does not belong to this individual), 14, 15, 33, 48, and
61 of 1932 probably represent relatively complete individuals. Finds 5, 20, 21, 28, 36, 37, 45,
50, and 53 of 1932 represent presumably single individuals, but always only a few bones were

28
Table 1: Compilation of specimens excavated by SEEMANN in 1932 based on his
field notes (unpublished documents; stored in the SMNS). The commentary describes the
material as interpreted by SEEMANN after a first examination of the unprepared finds in the
field. 0 = cannot be found in the SMNS; C = the find is stored in crates in the magazine, M =
the find is accessioned to the collections in the magazine. find-number
current original comments of SEEMANN
1 0 complete individual; destroyed in WWII 2 0 tibia, rib, vertebrae 3 M bone-plate (turtle?) 4 0 tail vertebrae 5 M nearly complete individual 6 M bone plates 7 0 single vertebraes 8 C 1-2 incomplete individuals 9 0 claw with phalanges and crushed bones 10 M 1 - ? incomplete individuals 11 0 phalanges 12 0 unreadable... complete individual with skull, strongly scattered 13 0 ribs (maybe belonging to find 10?) 14 C partially preserved individual, presumably posterior part 15 C parts of a well preserved individual with skull, predominately posterior half 16 0 claw and vertebrae 17 0 large long bone 18 0 pelvis (illium, ischium) 19 0 ribs, vertebrae, tarsale 20 M foot bones, tail and skull 21 C humerus 22 0 ? 23 0 foot bones 24 0 vertebrae 25 0 femur, single ..unreadable 26 0 poorly preserved vertebrae; scapula, put in plaster 27 C 2 femora 28 C scapula, pubis, femur, tibia 29 C scapula, ribs, large vertebrae, pelvis 29 C complete: vertebrae, femur, fibula ?, maybe to find 29 30 0 belonging to 28 ? 31 0 vertebrae 32 0 femur 33 M femur, tibia, ..unreadable… foot, pelvis with tail vertebrae 34 0 ribs, different foot bones, tibia 35 0 scapula, foot bones 36 M neck, fore- and hindlimb, nearly complete individual 37 M foot bones, nearly complete individual 38 0 foot bones, vertebrae, and more. (bad preserved femur) 39 0 foot bones, ischium, tibia ?, vertebrae, femur, scapula 40 0 2 scapulae, coracoid, humerus, femur 41 0 radius,/ulna 42 0 ischium 43 0 foot-bones, vertebrae 44 0 femur, pelvis, tail vertebrae 45 M illium, vertebrae, foot-bone, and more 46 0 4 vertebrae 47 0 tail vertebrae, single …unreadable

29
48 C incomplete skull, vertebrae, shoulder girdle 49 0 vertebrae 50 M both forelimbs, scapula 51 0 compressed vertebrae 52 0 vertebrae 53 M foot bones, fibula 54 M turtle shell 55 0 tail vertebrae, single 56 0 plant remains 57 0 vertebrae and foot-bones 58 0 vertebrae and foot-bones 59 0 undefined bones 60 0 tail vertebrae, pelvis, and hindlimb 61 C nearly complete individual 62 0 tibia and tail vertebrae 63 0 humerus 64 0 vertebrae and ribs 65 M large assemblage of bones, surely several individuals
preserved. Find 10 is a bone assemblage of at least two relatively complete individuals, but a
third one is documented by a femur. Find 27 is composed mainly of hindlimb and pelvic
girdle bones and represents at least four individuals. Find 29 seems to be made up of no less
than three left body halves. Find 65 is composed of at least five individuals, of which three
were relatively complete with regard to the main long- and flat bones (table 2b).
Finds 5, 10, 20, 36, 37, 45, 50, 53, and 65 of 1932 were fully accessioned to the SMNS
collection, find 33 was prepared in its original position as found and is on exhibit. Finds 8, 14,
15, 21, 27, 28, 29, 48, and 61 are stored in large crates in the magazine. The original
SEEMANN field-numbers together with the total length of the bones are used to uniquely
identify the sampled bones in this study. The material in the crates provided the main database
for the present histological research, while the fully accessioned material in the magazine was
only accessible for measurements.
From the available material in the IFG, also a few bones were sampled. This material
excavated by HUENE, was mechanically prepared, like the bones in the SMNS, but in addition
it was treated with shellack (WEISHAMPEL & WESTPHAL 1986). To identify the sampled bones
in the IFG, the total bone length is combined with the inventory number of the bone, when
available.
In contrast to the number quoted in the literature (reviewed in SANDER 1992), the
actual minimum number of individuals of Plateosaurus engelhardti excavated in Trossingen
and still preserved in the IFG and SMNS collections amounts to around 54 individuals (table
2).
Although the count of 54 individuals is only a rough estimate, around the half of the
presumed individuals seem to be missing. One cause of the discrepancy between the literature

30
and actually available material is the shipment of Plateosaurus engelhardti remains from the
excavation of 1921/23 to the USA. In addition, misinterpretation of the finds, still partially
buried in the sediment during and after the 1932 excavation would also have played a role.
Further specimens, like find number 1, were lost or destroyed, but their exact number is
unknown.
Table. 2: List of Plateosaurus engelhardti material available in the SMNS and IFG
today: Table 2a: Remains from excavations in Trossingen before 1932 and from other
localities in the Knollenmergel Beds from southern Germany. Collection and compactus
means the find is inventoried into the magazine of the mentioned museum and possesses an
field- or inventory number. field or inventory number
repository/collection number of individuals
notice/remark
SMNS 13200 a-z (Trossingen)
collection SMNS 5 several bones from at least five individuals, excavated in 1911/12; the most complete individual was the base for the osteological description of Plateosaurus by HUENE (1926)
SMNS 12949/12950/12951 (Trossingen)
collection SMNS 2 a few bones from at least two individuals, excavated in 1911/12
SMNS 80664 (Stuttgart-Degerloch)
collection SMNS 1 only a few bones
SMNS 4011 (Stuttgart-Degerloch)
collection SMNS 1 left humerus
SMNS 53537 (Stuttgart-Degerloch)
collection SMNS 2 one relative complete skeleton, and maybe one ? humerus
SMNS 6014-6020/ 6047-6050/ 6058-6060/6061 (Trossingen)
collection SMNS 2 skull, a few other bones
IFG 192.1/ 163 (Trossingen)
compactus IFG 1 left femur, left tibia
IFG, uncat. (Trossingen)
compactus IFG 1 scapula
IFG mounted skeleton (Trossingen)
IFG, on exhibit 2002 >2 composite of several individuals
IFG mounted skeleton (Trossingen)
IFG, on exhibit 2002 >2 composite of several individuals
IFG, in situ preparation (Trossingen)
IFG, on exhibit 2002 1 mainly a posterior half
IFG, in situ preparation (Trossingen)
IFG, on exhibit 2002 1 only a few bones
IFG, in situ preparation (Trossingen)
IFG, on exhibit 2002 1 one hindlimb

31
Table 2b: List of currently available Plateosaurus remains from the 1932
excavation in Trossingen (“nearly complete skeleton” means that only few bones are
missing). Collection means the find is inventoried into the magazine of the mentioned museum
and possesses an inventory number. Magazine means the find is stored in the mentioned
museum, but not inventoried yet (e. g. stored in large crates). field or find number
repository/collection number of individuals
notice/remark
5 collection SMNS 1 only a few bones 8 magazine SMNS 2 one nearly complete skeleton, and one single
tibia 10 collection SMNS 3 remains of one smaller and one larger individual;
remains of at least one or more other individuals 14 magazine SMNS 1 one nearly complete skeleton 15 magazine SMNS 1 mainly a posterior half 20 collection SMNS 1 manus and pes, a few bones; most remains are on
loan to the Heimatmuseum Trossingen 21 magazine SMNS 1 right humerus 27 magazine SMNS 4 mainly hindlimb and pelvic girdle bones 28 magazine SMNS 1 only a few bones 29 magazine SMNS 3 no less than three left incomplete body halves 33 SMNS exhibition 1 in situ preparation of a posterior half 36 collection SMNS 1 right pes and a few other bones 37 collection SMNS 1 only a few bones 45 collection SMNS 1 one manus 48 magazine SMNS 1 one nearly complete skeleton 50 collection SMNS 2 only a few bones, but of two different sizes 53 collection SMNS 1 one Radius 61 magazine SMNS 1 one nearly complete skeleton 65 collection SMNS 5 four relative complete individuals, and remains
of one more
Altogether 39 bones were sampled from the locality of Trossingen (table 4),
representing a minimum number of individuals of around 16. For some individuals, several
bones were sampled, making a comparison of the growth record in different bones of the
same individual possible (SMNS F 14, SMNS F 29, SMNS F 48). To check the consistency
of the growth record in a single bone, different samples on varying locations were taken.
4.1.2 Plateosaurus engelhardti from Frick
The Plateosaurus material from the locality of Frick was also prepared out from the
surrounding sediment, and if necessary and possible the bones were glued and reconstructed
with plaster. The material from the excavations before 1995 is inventoried in the collection of
the MSF. The remains of Plateosaurus exhibited in the SMA are on loan from the MSF.
The material from the 1995 excavation is not fully prepared yet and is stored in the
NAA. None of the material from the locality of Frick was soaked in any stabilizing resin,
except for cyanoacrylate glue in the field.

32
If a collections number is present, mostly consisting of the original field number, it is
used in the present study. If the bones lack any number, the total length, body side, and the
museum where the fossil is kept is listed to make an unequivocal identification of the
specimen possible.
Again, before sampling the available material, mainly concerning long and flat bones
was inventoried, and the results are listed in table 3.
Table 3: Plateosaurus engelhardti finds from Frick kept in the Naturama (NAA),
the Sauriermuseum Frick (MSF) and the Sauriermuseum Aathal (SMA). field or find number
Repository/collection number of individuals
notice/remark
GEO 92 NAA >2 two anterior halves GEO 93 NAA to GEO 92 ? left manus, radius, ulna, and vertebrae GEO 162 NAA to GEO 92 ? vertebrae, gastralia GEO 94 NAA to GEO 92 ? pubes, ribs, and gastralia GEO ? NAA to GEO 92 ? cranium, ribs, and gastralia F 88 NAA 1? caudal vertebrae; femur, humerus, tibia, fibula Imhof 1986 NAA 1 left hindlimb with pes, cranium, right ischium,
femur, fibula, tibia no number NAA 1 pes no number NAA 1 right humerus A9 NAA 1 tibia, right scapula-coracoid A8 NAA to A9 fibula B50/B45 NAA 1 ischia no number NAA 1 pubis material from the 1988 bone field (SANDER 1992)
MSF (magazine) 4? scapula, fibula, tibia, fibula, tibia, fibula, pubis, tibia
MSF 23 MSF, on exhibit 1 completes skeleton MSF 4 MSF, on exhibit 1 whole posterior half MSF17 MSF, on exhibit 1 anterior half and fibula MSF 13 MSF, on exhibit 1 a few bones MSF 19 MSF, on exhibit 1 partly preserved skeleton MSF 10 MSF, on exhibit 1 pubis material from the 1988 bone field (SANDER 1992)
MSF, on exhibit >1 composite of several individuals, mounted above the door
MSF 5 SMA, on exhibit 2 two anterior halfes exhibited in situ MSF on exhibition SMA, on exhibit 1 right pes MSF on exhibition SMA, on exhibit 1 left pes
Most of the material from Frick is on exhibit and not accessible for sampling. Thus,
only five to six individuals that are represented by seven femora were studied. Figure 1 shows
clearly that the Frick bones fit well into the lower range of the medium-sized Plateosaurus
engelhardti individuals from Trossingen.
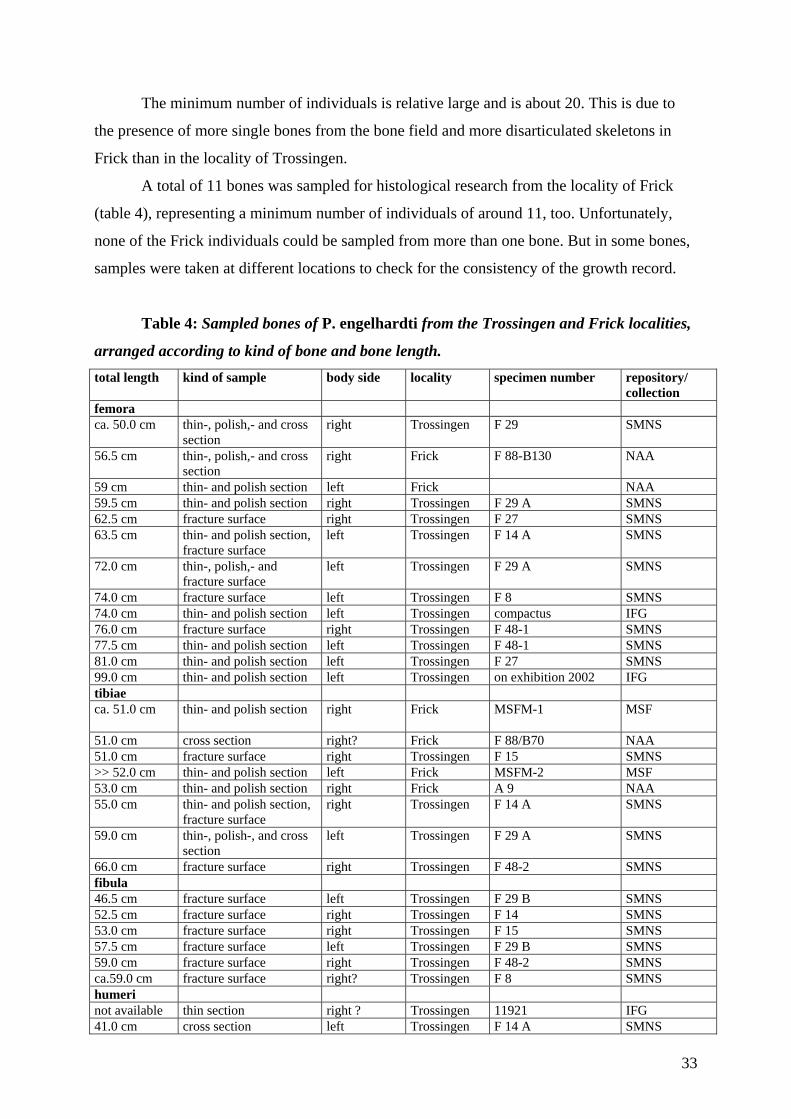
33
The minimum number of individuals is relative large and is about 20. This is due to
the presence of more single bones from the bone field and more disarticulated skeletons in
Frick than in the locality of Trossingen.
A total of 11 bones was sampled for histological research from the locality of Frick
(table 4), representing a minimum number of individuals of around 11, too. Unfortunately,
none of the Frick individuals could be sampled from more than one bone. But in some bones,
samples were taken at different locations to check for the consistency of the growth record.
Table 4: Sampled bones of P. engelhardti from the Trossingen and Frick localities,
arranged according to kind of bone and bone length. total length kind of sample body side locality specimen number repository/
collection femora ca. 50.0 cm thin-, polish,- and cross
section right Trossingen F 29 SMNS
56.5 cm thin-, polish,- and cross section
right Frick F 88-B130 NAA
59 cm thin- and polish section left Frick NAA 59.5 cm thin- and polish section right Trossingen F 29 A SMNS 62.5 cm fracture surface right Trossingen F 27 SMNS 63.5 cm thin- and polish section,
fracture surface left Trossingen F 14 A SMNS
72.0 cm thin-, polish,- and fracture surface
left Trossingen F 29 A SMNS
74.0 cm fracture surface left Trossingen F 8 SMNS 74.0 cm thin- and polish section left Trossingen compactus IFG 76.0 cm fracture surface right Trossingen F 48-1 SMNS 77.5 cm thin- and polish section left Trossingen F 48-1 SMNS 81.0 cm thin- and polish section left Trossingen F 27 SMNS 99.0 cm thin- and polish section left Trossingen on exhibition 2002 IFG tibiae ca. 51.0 cm
thin- and polish section right Frick MSFM-1 MSF
51.0 cm cross section right? Frick F 88/B70 NAA 51.0 cm fracture surface right Trossingen F 15 SMNS >> 52.0 cm thin- and polish section left Frick MSFM-2 MSF 53.0 cm thin- and polish section right Frick A 9 NAA 55.0 cm thin- and polish section,
fracture surface right Trossingen F 14 A SMNS
59.0 cm thin-, polish-, and cross section
left Trossingen F 29 A SMNS
66.0 cm fracture surface right Trossingen F 48-2 SMNS fibula 46.5 cm fracture surface left Trossingen F 29 B SMNS 52.5 cm fracture surface right Trossingen F 14 SMNS 53.0 cm fracture surface right Trossingen F 15 SMNS 57.5 cm fracture surface left Trossingen F 29 B SMNS 59.0 cm fracture surface right Trossingen F 48-2 SMNS ca.59.0 cm fracture surface right? Trossingen F 8 SMNS humeri not available thin section right ? Trossingen 11921 IFG 41.0 cm cross section left Trossingen F 14 A SMNS

34
43.5 cm thin- and cross section left Trossingen F 29 A SMNS ca. 43.5 cm cross section right Trossingen F 61 B SMNS 44.5 cm thin- and cross section right Frick F 88/B640 NAA 53.0 cm thin section right Trossingen exhibition 2002 IFG scapulae 36.5 cm thin- and polish section left Frick unnumbered MSFM >> 39.0 cm cross section right ? Frick unnumbered NAA >> 42.0 cm cross section left Trossingen F 29 SMNS 47.0 cm thin-and polish section,
fracture surface right Trossingen F 14 B SMNS
48.0 cm thin- and polish section, fracture surface
left Trossingen F 29 B SMNS
49.5 cm thin- and polish section left Trossingen F 29 A SMNS pubes not measurable
thin- and polish section not identified Frick unnumbered NAA
48.0 cm cross section left Trossingen F 29 SMNS 50.0 cm thin- and polish section,
fracture surface left Trossingen F 14 B SMNS
52.5 cm thin- and polish section right Trossingen F 29 B SMNS 53.5 cm thin- and polish section,
fracture surface left Trossingen F 29 B SMNS
other bones dorsal vertebra (10.8 cm)
thin-, and polish section Trossingen RW 12 IFG
dorsal vertebra (10.7 cm)
thin-, and polish section Trossingen RW 14 IFG
rib (size not available)
cross section Trossingen F 29 SMNS
rib (size not available)
thin-, and polish section Frick F88/738 MSF
foot phalange (size not available)
thin-, and polish section Trossingen 8159 IFG
ischium (43.0 cm)
thin section and fracture surface
Trossingen F 27 SMNS
4.1.3 Body size in Plateosaurus from Frick and Trossingen
Based on skeletal reconstructions (in WEISHAMPEL & WESTPHAL 1986) femur length is
approximately one-tenth of overall body length in Plateosaurus engelhardti (SANDER 1992).
On the basis of this ratio, the Plateosaurus engelhardti material from Trossingen consists of
individuals with a total body length from around 4.70 meters (left pubis SMNS F 65, 38.0 cm
total length, calculated femur length 47.0 cm, see methods section) up to ten meters (left
femur IFG: 99.0 cm).
In figure 1a, a size class histogram based on the femora from Trossingen and Frick is
given. Two peaks are observable in the large Trossingen sample, one between 57.5 cm and
67.5 cm and a second between 72.5 cm and 80.0 cm femur length. The first peak includes 23
femora from Trossingen (52 %). Additionally six femora from Frick (86 %) fit into this first

35
0
1
2
3
4
5
6
7
8
50 55 60 65 70 75 80 85 90 95 100size classess based on femur length in cm
num
ber o
f fem
orTrossingenFrick
A
02468
1012141618202224262830
45 50 55 60 65 70 75 80 85 90 95 100 105
size classess based on femora length in cm
num
ber o
f bon
es
Trossingen
Frick
B
Figure 1: Size class histograms based on femur length for Trossingen and Frick.
1A: Size class histogram of femora from Trossingen and Frick. 44 femora from Trossingen
that correspond with an estimated minimum number of individuals of 37, and 7 femora from
Frick that correspond with an estimated minimum number of 5 individuals are included in
this histogram. 1B: Size distribution of all bones of Trossingen and Frick, scaled to femur

36
size. All long- and flat bones, altogether 214 bones from the locality of Trossingen and 39
from the locality of Frick are included. The minimum number of individuals in Trossingen is
around 54 and in Frick around 20. Scaling to femur length based on bone ratios in table 5
(see method section, section 5.1).
peak. The second peak contains 11 femora from Trossingen (25 %) and one from Frick (14
%). Apart from the higher sample number, the peaks in the present histogram (figure 1a) fit
well with the histograms published by WEISHAMPEL & WESTPHAL (1986: figure 11) and
SANDER (1992: figure 16). Figure 1a shows that most individuals from Trossingen and all
from Frick belonged to medium-sized individuals. Really large individuals of Plateosaurus
engelhardti are very rare; only four femora (9%) are known from Trossingen which had
attained over 80 cm in length, and none is known from Frick.
A second histogram (figure 1b) considers all long- and flat bones scaled to their
corresponding femur size. Femora are represented by their actual length. Here 174 bones
(81%) from the Trossingen sample and 26 bones (67 %) from the Frick sample fit into the
size classes between 57.5 cm and 77.5 cm. The remaining 21 bones (10%) from Trossingen
and 13 bones (33%) from Frick are smaller. Only 19 bones (9 %) from Trossingen and none
known from Frick are from individuals larger than 80.0 cm femur size.
Nevertheless, the result deduced from both histograms is clear: Medium-sized
individuals make up the majority (about 75%) of the Plateosaurus engelhardti individuals
found in Trossingen. All individuals from Frick represent small- to medium-sized individuals,
in relation to the Trossingen individuals. No bone from either locality indicates an individual
smaller than 4.70 m. The lack of smaller individuals is surely due to a taphonomic filter
(SANDER 1992), and possibly also the lack of the large ones. A second possibility for the large
individuals being so rare in Trossingen is a generally more rare occurrence in the living
population.
Unfortunately, no juveniles or small individuals of Plateosaurus engelhardti are
available for sampling because none are known in the fossil record from the bonebeds or any
other locality from Central Europe so far. Nevertheless, prosauropod juveniles would be very
important for checking the early ontogenetic histology, like the first primary bone tissue
deposited and the early growth record in general. The growth record of juveniles is necessary
for an exact calibration of the extrapolated part of the growth record of larger individuals.
Remains of juvenile Plateosaurus specimen with a femur length of 24 cm from the

37
Feuerletten of Ellingen/Bavaria cited by WELLNHOFER (1993), are now referred to the
theropod group (MOSER 2003).
Because of the diagenetic flattening of the Plateosaurus bones from Frick, they appear
to be thinner and generally smaller than Plateosaurus bones from Trossingen. A comparison
of the measurements of the specimens from both localities shows that this is not really the
case, and the comparison of the total lengths of different bones shows that the individuals
from Frick fit into the medium size classes of the Trossingen individuals.
Thus, the remains from Frick belonged all to small to medium-sized individuals. The
smallest measured femur from Frick is 56.5 cm in length (MSF 23, left), and the largest
measured femur is 69.0 cm in length (MSF 13: right). Juveniles are missing in Frick as well
as in Trossingen.
4.2 Preservation and diagenesis
Bone is built up of inorganic (hydroyapatite crystallites) and organic material (e.g.
collagen, protein). Usually the organic components decay after an animals death. The
remaining spaces, for example bone cells, vascular canals, and medullary cavities are re-filled
with magnesium or iron oxides (CHINSAMY & DODSON 1995) or simply with sediment.
During fossilization, inorganic material is replaced by other crystallites (fluoroapatite) but the
original histological structure is often preserved (CHINSAMY 1994).
4.2.1 Trossingen
The fossils from the Trossingen locality are generally well preserved, except for some
compaction producing cracks. However, the bones from Trossingen are generally brittle and
fragile because of their diagenesis. Main problem here is the missing cementation of the pore-
rooms. Additionally, the bones are embedded in clayey sediment. On the one hand clay
causes swelling when the bones come in contact with water. On the other hand, the fossils
break when the bones get to dry. Due to its brittleness, much damage to the fossil bones
happened during or after excavation. This led to many places on the bones having been
partially restored in plaster. Today, cracks and fractures are still numerous in the Trossingen
material and, in spite of careful handling, often some new ones were added during handling
(own experience, MOSER 2003). To preserve and stabilize the fossil bones over time, it is
advisable to impregnate them with synthetic varnishes (Zaponlack) or natural varnishes
(shelllack). Unfortunately, only some specimens could be treated this way in the past.

38
Microcracks and fractures are the result of fossilization processes and run through the
bones. They do not follow any pattern, running roughly radially, but also parallel to bone
surface. They often prefer to follow the LAGs. Enlargement and splitting of LAGs by
microcracks is also possible.
Cross-sections show that natural cavities in the bones, like the medullary cavity and
cancellous bone regions as well as post mortem cracks, were filled with red mud and clay and
occasionally with diagenetic minerals like calcite. Even the very small vascular spaces and
microcracks were infilled with fine sediment, which frequently contains iron or manganese
oxides. Thus, such infilled spaces appear dark in color. Cementation and precipitation of
minerals in pore spaces and cavities is generally rare.
For the bones from the Trossingen locality MOSER (2003) describes a structural
change by precipitation of clay. He argues that the bone surface is split in many small pieces,
building a mosaic, and clear indicating a regularly welling of bone. He explained that clay
precipitation depends on the position of bone in the sediment during paleopedogenesis
(MOSER 2003). Thus, sometimes only part of bones were affected which could explain
untypically large epiphyses or shaft diameters. Generally, clay precipitation causes a very
regular kind of swelling (in contrast to carbonate precipitation) and on the basis of the cracks
between the mosaics the original size could be calculated back (Moser 2003).
In spite of this theory of clay precipitation, little diagenetic swelling is observable at
the histological level of Trossingen bones. Predominately microcracks, originated from the
stresses caused by compaction are observable. Another diagenetic effect is that the primary
apatite is sometimes substituted by calcite as can be seen in polarized light. In some regions,
the original bone microstructure is destroyed by the growth of crystallites, mostly along
microcracks. However, these diagenetic effects do not affect interpretation of bone histology.
4.2.2 Frick
Except for the greater crushing, the material from Frick is generally better preserved
than the material from Trossingen because it is not as brittle and fragile. Infiltration of
sediment into the bone is as common in Frick as in Trossingen, but the bones from Frick are
nevertheless not as sensitive to fracturing. Careful sampling does not cause further damage to
the bones, making further preservation and stabilizing with resin or varnish not as necessary
as for the Trossingen material.
Natural bone cavities, like the medullary cavity and cancellous bone regions as well as
post mortem cracks are filled with sediment, consisting of fine green to grayish clay, and

39
sometimes also with diagenetic minerals like calcite. Even the very small vascular spaces and
the microcracks were filled in with the fine clay. However, in the Frick material microcracks
are very rare.
In some specimens the medullary cavity is crushed and/or parts of the cortex were
pressed into the medullary cavity. In others, parts of cortex were displaced by crushing. The
effects of paleopedogenesis as described by MOSER (2003) are not documented in Frick, too.
Bone surfaces are seldom and when only slightly fractured into mosaics.
In Frick bones, little diagenetic effects are observable at the histological level as well.
The primary apatite is sometimes substituted by calcite. In some regions, the bone
microstructure is destroyed by crushing. However, these diagenetic effects do not affect
interpretation of histology and growth record. The Frick samples are very light-colored in thin
section.
The Frick material took up a polish much better than the Trossingen material. Thus,
lines of arrested growth in the Frick specimen often show up as clear polish lines. On the
other hand, without polishing features of the bone tissue and lines of arrested growth are often
not as clearly visible as in the Trossingen samples.
5. Methods
5.1 Osteology, measurements, and mass estimates
A detailed osteological study by the author has accompanied this histological research
to confirm that in Trossingen as well as in Frick only one species of Plateosaurus occurs, and
that this species, is very similar in both localities, if not the same. Furthermore, it was
searched for hints of a possible sexual dimorphism in bones from both localities. Osteology
and measurements from the Frick bones were difficult to judge because of the strong
crushing.
Standard measurements like complete bone length, wide and length of the epiphyses,
and shaft circumferences were taken from all bones in the SMNS, IFG, MSF, NAA, and SMA
to get the largest database possible. Measurements of total bone length provide important
information because they also serve to correlate the size of the bones with femur length and
therefore with the total body length of the individual. Body length, in turn is important e. g.,
to construct growth curves and mass estimates. On the basis of these data, possible differences
in size and/or shape should be documented. Furthermore, the different measurements from
complete bones help in estimating dimensions of incomplete bones.
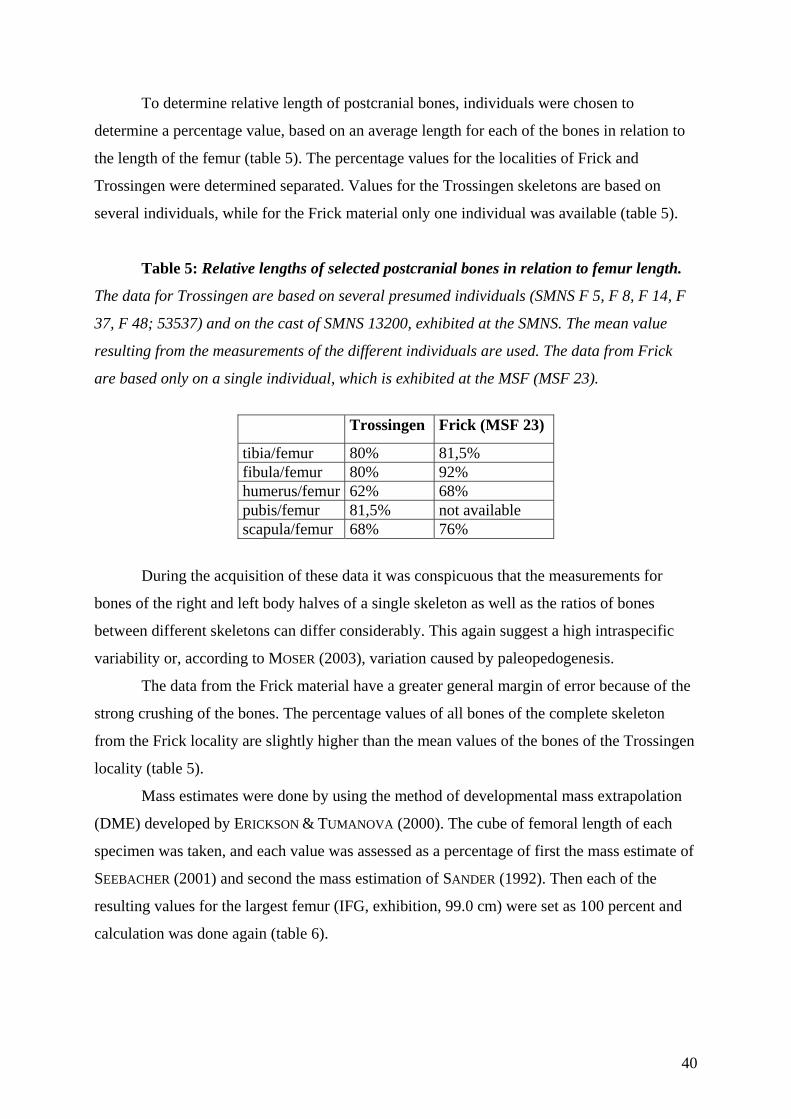
40
To determine relative length of postcranial bones, individuals were chosen to
determine a percentage value, based on an average length for each of the bones in relation to
the length of the femur (table 5). The percentage values for the localities of Frick and
Trossingen were determined separated. Values for the Trossingen skeletons are based on
several individuals, while for the Frick material only one individual was available (table 5).
Table 5: Relative lengths of selected postcranial bones in relation to femur length.
The data for Trossingen are based on several presumed individuals (SMNS F 5, F 8, F 14, F
37, F 48; 53537) and on the cast of SMNS 13200, exhibited at the SMNS. The mean value
resulting from the measurements of the different individuals are used. The data from Frick
are based only on a single individual, which is exhibited at the MSF (MSF 23).
Trossingen Frick (MSF 23)
tibia/femur 80% 81,5% fibula/femur 80% 92% humerus/femur 62% 68% pubis/femur 81,5% not available scapula/femur 68% 76%
During the acquisition of these data it was conspicuous that the measurements for
bones of the right and left body halves of a single skeleton as well as the ratios of bones
between different skeletons can differ considerably. This again suggest a high intraspecific
variability or, according to MOSER (2003), variation caused by paleopedogenesis.
The data from the Frick material have a greater general margin of error because of the
strong crushing of the bones. The percentage values of all bones of the complete skeleton
from the Frick locality are slightly higher than the mean values of the bones of the Trossingen
locality (table 5).
Mass estimates were done by using the method of developmental mass extrapolation
(DME) developed by ERICKSON & TUMANOVA (2000). The cube of femoral length of each
specimen was taken, and each value was assessed as a percentage of first the mass estimate of
SEEBACHER (2001) and second the mass estimation of SANDER (1992). Then each of the
resulting values for the largest femur (IFG, exhibition, 99.0 cm) were set as 100 percent and
calculation was done again (table 6).

41
Table 6: DME on the basis of the mass estimates available in literature (SANDER
1992, SEEBACHER 2001). Mass in the first column bases on data given by SEEBACHER (2001)
who calculated that a Plateosaurus individual of 6.5 m body length had a body mass of 1072
kg. Mass in the second column bases on data given by SANDER (1992) who found in a scale
experiment that a individual of around 8 m body length had a mass of 2179 kg. Mass in the
third column bases on the mean value for the largest femur (IFG 99 cm,left, 3962 kg) of both,
SEEBACHER (2001) and SANDER (1992).
femur length estimated body mass (kg) based on SEEBACHER (2001)
estimated body mass (kg) based on SANDER (1992)
estimated body mass (kg) on the basis of the mean value for the largest femur
50.0 cm 482,4 522,96 515 56.5 cm 707,5 762,65 753 59.0 cm 804 871,6 832 59.5 cm 825,4 893,39 872 62.5 cm 954,08 1045,92 991 63.5 cm 996,96 1089,5 1030 65.0 cm 1072 1176,66 1109 72.0 cm 1457,92 1590,67 1545 74.0 cm 1586,56 1721,41 1664 76.0 cm 1715,2 1873,94 1783 77.5 cm 1811,68 1982,89 1902 80.0 cm 1993,92 2179 2100 81.0 cm 2079,68 2266,16 2179 99.0 cm 3784,16 4140 3962
5.2 Sampling
5.2.1 Whole bone cross sections
Based on earlier studies on dinosaur long bone histology, the middle of the shaft is the
best place to obtain the most complete growth record (RICQLÈS 1983, CHINSAMY 1993,
SANDER 2000, ERICKSON & TUMANOVA 2000, HORNER et al. 2000). This is due to the
predominately appositional growth of the shaft and the location of the neutral zone in this
region (SANDER 2000). To determine the best coring site around the circumference of the
mid-shaft region, whole bone cross sections were cut from a femur, a pubis, a scapula, and a
rib from Trossingen (SMNS F 29) as well as from a femur, a tibia, a scapula, and a humerus
from Frick (single bones from the NAA). All of these bones do not belong to single
individuals but represent several specimens. The best coring site is defined by a combination
of the thickest available cortex with clear and numerous growth cycles and minimum
remodeling, i.e. minimum erosion moving outward from the medullary cavity and minimum

42
secondary bone tissue. These conditions are largely met around the whole cross sections of
the mid-shaft region. Nevertheless, the optimal coring site of each bone type is defined in the
histological descriptions by bone in section 6.
Before cutting, the mid-shaft region was stabilized by a girdle of synthetic resin. The
sample was obtained by placing two parallel cuts across the shaft, resulting in a slice a few
centimeters in thickness. The slice has a proximal and a distal side. After sawing, both sides
of the slice were impregnated with a synthetic, low viscosity resin (Araldite 2020) finely
ground, and polished to a high gloss.
5.2.2 Coring
A new, rather simple sampling method was developed by SANDER (1999, 2000) and
also used for this research. Minimizing damage to the sampled bone, a core of ca. 10 to 15
mm diameter is drilled with a diamond-studded coring bit into the cortex of the mid-shaft
area. The drill is generally lubricated with water, but sometimes, depending on the fossil bone
material, oil lubriation is used or no lubriation at all (dry drilling). The coring bit is attached
to a normal electric drill with adjustable speed. For the brittle Plateosaurus material, low
speed and very low torque settings were necessary. The method of SANDER (1999, 2000) was
improved with regard to lubrication by using a small plasticine dam which was built around
the drilling hole and into which the lubricant was poured. This has the effect to protect the
Plateosaurus bones from excessive moisture, respectively other lubricants, but also
guarantees constant lubriation during drilling. The drill was mounted in a simple drill press.
The foot of the press is weighted down with a dish of sand in which the bone is supported
securely.
The cores so obtained were embedded in synthetic resin (Araldite 2020) and then cut
longitudinally, perpendicular to the long axis of the whole bone. One half of the core was
processed into a thin section and the other half into a polished section. Thin sectioning
followed standard procedures for petrographic thin sections, but specific problems were
encountered (see section 5.3).
5.2.3 Existing fracture surfaces
Due to the mode of preservation of the Plateosaurus material from Trossingen and
Frick, the long bones show many fractures. Most of these fractures run across the narrow mid-
shaft region, which is most interesting for histological research, too. The surfaces which, due
to the lack of cementation of the fractures are not covered by vein minerals, are similar to the

43
whole bone cross sections produced by sawing and provide a full overview of the growth
record in this bone region. Histological structures can be observed very well in these surfaces,
even with the naked eye. Cores sampling problems due to the clayey pore fill of the bones
were an added reason for using existing fracture surfaces in this research.
Bones with good fracture surfaces were borrowed from the museums and studied
tracing under a binocular microscope with a camera lucida. In addition, the whole fracture
surface as well as details were photographed with a digital camera (Nikon D1). Later, the
growth record was traced by hand on the digital images by using a computer graphic program.
The advantage of these images is that they show the whole cross section, providing an
overview about the growth record, without any new damage to the bone. On the down side,
due to the limited resolution of these images, histological details, like the bone tissue types
cannot be distinguished, and lines of arrested growth cannot be identified with the same
certainty as in thin sections. This is predominately a problem in the exterior cortex where
growth cycles usually become very close in some adult individuals. Therefore the existing
fracture surfaces are best used for complementing the data from thin and polished sections.
The number of LAGs counted on only such a fracture surface is commonly too low, and a
greater error must be assumed than for physical sections.
5.3 Problems encountered during sampling and thin sectioning
The core sampling method was used before on sauropod bones without any problems
(SANDER 1999, 2000, 2003). However, the Plateosaurus bones turned out to be more difficult
to sample. Due to the predominately fragile condition of the Plateosaurus bones, mainly
concerning the material from the Trossingen locality, the bones must be generally handled
very carefully. In addition, the material in the SMNS, representing the majority of the bones
available for sectioning, lacked any impregnation, leading to several problems during
sampling.
Problems started while drilling, when many cores fractured or sheared off before the
medullary cavity was reached. The fragments of such a core commonly could not be glued
back together, and the growth record is quite incomplete in these samples. Several changes in
the drilling method gave no fundamentally improved results for the Plateosaurus engelhardti
material in the SMNS.
It was conspicuous that these problems did not appear during the sampling of material
in the IFG collections. As indicated by preparation methods in literature (WEISHAMPEL &
WESTPHAL 1986), the IFG specimens from Trossingen were impregnated soon after

44
preparation with a natural varnish, shelllack. The bones in the IFG today are in a much better
condition than the un-impregnated bones in the SMNS. With this background information, the
preparators at the SMNS were asked to impregnate two SMNS femora for the present study
with zapon varnish. A complete core was drilled from one of these two bones without any
problems. Unfortunately, impregnation with zapon varnish is an expensive and time-
consuming procedure and could not be done for all the bones to be sampled.
Processing the drilled cores into thin sections also led to some unexpected problems,
like some pieces braking out of the cores during grinding of the halves. The thin sections also
sometimes show differential impregnation (e. g. figure 5A, C) effects, and later some of the
thin sections separated partially from the slides. This was again due to the fragile nature and
clayey pore fill of the bones. Problems such as separation of section and slide probably arise
as a result of the limited permeability of bones. It could be observed on the basis of the thin-
and cross sections that the resin ran into the polished sections only along the microcracks.
Although the material seems to absorb the resin completely, the thin sections show that only
some areas were really impregnated by the resin. Possibly, these effects originate from
different preservation close to the cracks. However, the differential impregnation effects are
not clearly understood yet.
5.4 Methods of histological and skeletochronological study
5.4.1 General aspects
The histological data base consists of 50 specimens (33 long bones, 11 flat bones, 6
other bones) from both localities, including fracture surfaces. All sections were examined by
standard light microscopic techniques. The thin sections were viewed in a compound
microscope in transmitted light, both normal and polarized. At high magnifications, bone cell
lacunae, bone type, as well as primary and secondary osteons were visible. To obtain a good
overview of the growth marks the distances between LAGs, increase or decrease of
vascularization, and type and distribution of remodeling, the cross sections and polished
sections were studied under a binocular microscope. A sketch of all sections was made with a
camera lucida, and the LAGs were drawn in and counted.
In the Frick material, LAGs were often not as clear as in the Trossingen material but
were expressed as polish lines, which can be recorded instead. Polish lines are visible in
polished sections to the naked eye or with a binocular microscope by tilting the polished
surface to create a reflection but also in the compound microscope using bright field

45
illumination (SANDER 2000). In the Plateosaurus samples, the polish lines correspond
generally to the lines of arrested growth and were observed with the binocular microscope.
The current study shows that a combination of various photographic, microscopic, and
sectioning techniques are important to get the most complete understanding of the growth
record: Due to the mode of preservation and colour of the material, the polished sections often
gave better observation results for growth mark than thin sections. Only after close inspection,
all LAGs seen in the polish section were also found in the thin sections. The thin sections, on
the other hand, are better suited for studying histological features at higher magnifications like
bone tissue types or remodeling processes.
5.4.2 LAG counts
Due to the necessity of extrapolation, the current study deals with three LAG counts.
The visible LAG count corresponds with the actually LAG count observed in the samples.
The extrapolated LAG count is a calculation of the number of LAGs lost by resorption due to
expansion of the medullary cavity. The total LAG count is the sum of both, the visible and
extrapolated LAG count (for the extrapolation method of estimating resorbed LAG number,
see 5.4.3). LAG count corresponds with growth cycles and the latter can be directly
transferred into years. For example a count of seven LAGs corresponds with eight growth
cycles or years of life.
5.4.3 Extrapolation method
All Plateosaurus long bones contain a large medullary cavity which started its
activities early in ontogeny. Thus, inner growth cycles were resorbed during the ontogenetic
growth of the bone. Additionally, remodeling in most cases affected the edge of the medullary
cavity and destroyed the growth cycles, too. LAG counts thus led in sub-adult and adult
individuals always to an incomplete number of growth marks. The lack of small, respectively
young Plateosaurus individuals makes extrapolation of the resorbed growth cycles necessary.
However, extrapolation increases the margin of error in the skeletochronological analsis.
RICQLÈS (1983) and CHINSAMY (1993) mentioned that it is necessary to consider the
diameter of the inner remodelled region to obtain a rough estimate of the number of resorbed
cycles. Both refer to the method of CASTANET & CHEYLAN (1979). REID (1997) referred to
FERGUSON et al. (1982) who estimated how many cycles are lost by extrapolation from the
thickness of the remaining cycles.

46
CHINSAMY (1993) estimates the original number of LAGs/growth cycles by using the
width of the initial zones of the smallest and therefore presumably youngest specimens.
RICQLÈS (1983) also used the diameter of the inner cancellous bone region in relation to the
spacing trend between each cycle “to draw a rough estimation of the number of previous
cycles first deposited in the younger cortex” (RICQLÈS 1983: 229). ZUG et al. (1986)
developed a formula to reconstruct the lost marks of skeleton growth: The total number of
marks of skeleton growth is the result of the cross sectional diameter of the sampled bone
multiplied with 0.5 because only one side of the bone is considered, and subtracted from the
average cross sectional diameter of the hatchling bone. This value is then divided through the
average width of preserved marks of skeleton growth.
The extrapolation method used in the current study attempted to incorporate different
extrapolation methods discussed above, but they had to be adapted to the specific
circumstances of the available Plateosaurus material.
On the basis of the assumption that the cycle distances in juvenile individuals were
wider than in older individuals, the greatest available cycle distance were here used for
extrapolation. Generally, the distance between the centre of the medullary cavity and the first
visible LAG (LAG 1) was set in relation to the greatest distance between two LAGs
observable in the specimen, i.e. the widest cycle. The result is a calculation of how many
LAGs were maximally lost by remodeling and resorption. Generally, the distance between
LAG 1 and LAG 2 is the greatest distance in the whole sample. Nevertheless, sometimes
some of the outer LAGs show a greater distance than the inner LAGs, due to the relatively
irregular growth of Plateosaurus.
This method works only for the whole cross section or if the diameter of the medullary
cavity is known. Extrapolation in thin- or polished sections faces the problem that the missing
part of the medullary cavity needs to be reconstructed. This is done on the basis of the average
percentage value of the medullary cavities of the different bone types. The relative size of the
medullary cavity is determined by a simple method: The thickness of the cortex of whole
bone cross sections was set in relation to the diameter of the medullary cavity at a determinate
bone side. Then the mean was calculated from all samples of a single bone type.
From many bones, different histological samples are available and also the fracture
surfaces. Polished cross sections supply for each at least four resorbed LAG numbers, due to
the four bone sides and their asymmetrical growth of bones during ontogeny. In such a case,
the listed data represent an average number of LAGs.

47
Predominately in the pubis, the ratio of cortex thickness to medullary region diameter
varies strongly, depending on which location in the cross section the measurements were
taken. Thus, in the pubis it makes sense to measure only at the lateral-proximal edge of the
bone because of the great extant of the medullary region in the medial-distal direction.
Thus, except in pubis samples, cross sections and fracture surfaces were measured at
four sides of the bone (caudal-median-cranial-lateral), whereas in pubis cross sections, only
the dorsal and ventral bone side was measured. Unfortunately, measuring all bone sides is not
always possible due to the varying quality of the growth record at the different bone sides.
The growth record can be generally unclear, disturbed by resorption and remodeling, or
incomplete due to the preservation of the bone. Additionally, the resolution of the fracture
surfaces is not of the same quality on all sides of a bone. Thus, the visible and resorbed LAG
number differs usually along the circumference of a single bone.
Further source of error is introduced by measuring from the centre of the medullary
cavity because the diameter of the hatchling bone has to be subtracted. Due to the lack of
Plateosaurus hatchlings, an estimate of hatchling femur diameter was done. Estimation based
on data of Mussaurus (CARPENTER 1999: 206: table 11.3) shows that the femur diameter of a
Plateosaurus hatchling was very small, only a few millimetres. Thus, the medullary cavity of
hatchlings is not considered here because it will have no influence on the extrapolation
results.
To summarize there are several problems using extrapolation in Plateosaurus
histology: Shaft diameters of hatchling and juvenile bones as well as growth rates and cycle
distances in juveniles are unknown. Asymmetrical growth of bone (drift) cannot be detected
in the cores. Extrapolation from cross sections results in a mean value because it has
considered four bone sides. Extrapolation cannot take into account irregular growth spurts or
interruptions, growth/enlargement of the medullary cavity, and main direction of resorption.
Already REID (1997) mentioned that extrapolation cannot consider growth rates and length of
growth periods (continuous or periodic interrupted). Thus, extrapolation is not a very exact
method for reconstructing LAGs in Plateosaurus bones. The results are only average values
of the probable number of resorbed LAGs for each bone sample and should be seen as
approximations, and not as exact values. In the current study the extrapolated number of
resorbed LAGs in long bones is generally too high due to the very large and active medullary
cavities in long bones and the lack of juveniles for calibration.

48
6. Histological description by bone
Our study began with the determination of the best sampling location by cross
sectioning and the analysis of existing fracture surfaces of the mid-shaft areas of each bone
type (figure 2, 4). These cross sections were also used for a detailed study of the inner
structure (cortex, medullary cavity, remodeling zone). Then the different available bone
tissues and types are described, such as kind of growth marks, their appearance and
distribution through the cortex. For the sampled material see table 4.
6.1 Long Bones
6.1.1 Sampling location
Based on the study of fractures of broken diaphyses of long bones in the SMNS, cross
sections, cores from femora and humeri were usually taken around the most narrow mid-shaft
region. The samples from the tibia were taken somewhat distal from the mid-shaft region, and
the best sampling location for the fibula is somewhat proximal because the most narrow place
in both is not exactly in the middle of the diaphysis (Fig. 2).
Due to damage to the bone surface or a varying shaft morphology, it was not possible
to drill the cores always at accurately the same location, respectively bone part. Instead,
samples were taken all around the mid-shaft area, wherever the best sampling conditions were
available. This is not much of a problem since the sampling of cross sections of the mid-shaft
region had shown that the growth record around the circumference differs not as much as at
sampling locations more proximal or more distal. A varying growth record in different
locations of a bone section results mainly from an asymmetrical growth of the bone during
ontogeny. Thus, the most important thing is to sample around the most narrow mid-shaft area
of a diaphysis.
To ensure the capture of a maximum growth record the cores in long bones were
always drilled through the cortex into the medullary region.
The long bones sampled here show in general a more oval shaft outline in proximal
cross sections, whereas the middle diaphysis is more round, and towards the distal end the
bone shaft becomes more and more triangular. This is documented, among other bones, by a
complete fibula, which is broken into five pieces (right fibula SMNS F 14, 52.5 cm).
The outline of the medullary cavities depends strongly on the outline of the shaft and
varies between round, triangular, or oval, mainly depending on sampling location along the
diaphysis.

49
The cortex distribution is always moderately regular around the medullary cavity, but
generally with one preferred bone side showing a thicker cortex. The growth record is well
preserved at all long bone sides around the mid-shaft region, and in the best specimens lines
of arrested growth can often be followed completely around the entire cross sections. In
others, LAGs are interrupted by microcracks and micro-faults.
Figure 2: The preferred sampling location in long bones is around the most narrow
mid-shaft region here marked by a line. Right femur and right humerus in posterior view,
right tibia and right fibula in medial view. Bone drawings from HUENE (1926). Not to scale.
6.1.2 Femur
Like in most dinosaurs, the femur is the largest bone in the skeleton of Plateosaurus.
The cortex is generally thick in the femur, around two to nearly three centimetres at one bone
side. The diaphysis diameter, measured from the cranial to the caudal surface, amounts to
between 5.8 and 8.9 cm. Most cross sections of femora show the thickest cortex at the caudal
side. Thus, at least for the available femur samples, the very best sampling location is at the
caudal femur side.
Generally, a small zone of remodeling surrounds the well-defined boundary of the
medullary cavity. Only the cross section of left femur SMNS F 14 (63.5 cm) shows a real
cancellous bone area around the medullary cavity, followed by an untypically wide

50
remodeling zone. The medullary cavity is always conspicuously large in the femur and is
often partially filled in by cancellous bone. Its average size amounts to around 58% of the
shaft diameter. The measurements were taken from the cranial to the caudal side. In the cross
section of the femur from Frick, the medullary cavity is only 35% of shaft diameter, surely
due to crushing.
The outlines of the cross section of the right femur SMNS F 48 (76 cm) and of the
right femur NAA F88/B130 (56.5 cm) are nearly rectangular. In addition the latter contains a
protrusion at the medio-cranial edge, and the medullary cavity is pressed together in the
middle like a waist. The untypical outline of the shaft cross section of the right femur SMNS
F 48 (76 cm) remains unexplained, but also the tibia and the fibula of the same find
(individual SMNS F 48) show a similar rectangular shaft outline.
It is noteworthy that neither the cores from the posterior bone side nor the entire cross
sections of the femur show any remodeling trace of the fourth trochanter, although the
samples were often taken only a few centimetres distal to it.
6.1.3 Tibia
The cortex of the tibia is not as thick as in the femur but nevertheless may reach up to
2.5 centimetres at one bone side. The whole diameter, measured from the medial to the lateral
bone surface, amounts to between 3.7 and 5.8 centimetres. Most cross sections show the
thickest cortex at the medio-cranial bone side.
Like in the femora, the medullary cavity is relative large in the tibiae. The average
percentage of the medullary cavity amounts to around 49% of the shaft diameter. The
measurements were taken from the medial to the lateral surface. In the cross section of the
tibiae from Frick, the medullary cavity represent only 28% (crushing!).
Generally, the well-defined boundary of the medullary cavity is surrounded by a clear
remodeling zone, which in some regions reaches up to the middle of the cortex. However, this
remodeling is light and does not completely overprint the primary bone tissue. Extensive
regions of cancellous bone were not observed in any tibia cross section.
The main outline of the cross sections of the sampled tibiae is oval, only one showing
a more triangular outline (right SMNS F 14A, 55 cm). The outlines of the medullary cavities
vary between oval and sometimes more circular. Like the cross section of the right femur
SMNS F 48 (76 cm), the outline of the cross section of the right tibia SMNS F 48-2 (66 cm) is
more rectangular than oval. The outlines of the cross sections of the tibiae from Frick are
51
almost rectangular with a protrusion at one bone side. All tibiae from Frick were compressed
during the fossilization processes.
6.1.4 Fibula
Cortex thickness in the fibula varies between 0.5 cm and 1.4 cm at one bone side. In
most samples, the cranial part of the bone contains the thickest cortex. The whole diameter,
measured from the medial to the lateral surface, amounts to between 2.3 cm and 3.5 cm.
The average percentage of the medullary cavity in the fibulae amounts to 52% of shaft
diameter and is therefore also large. The measurements were taken from the caudal to the
cranial bone surface. The outline of the cross sections of the sampled fibulae varies between
oval, triangular, and round. The outline changes clearly along the diaphysis. The outline of
medullary cavity varies between oval and round. Like the cross sections of the femur and tibia
of SMNS F 48, the outline of the cross section of the right fibula of SMNS F 48-2 (59 cm) is
rectangular.
The right fibula SMNS F 14 (52.5 cm), which is fractured along the shaft into five
pieces, yields information about the change of bone tissues along the diaphysis. The sections
document clearly that the distribution of primary and secondary bone tissue depends strongly
on the location on the shaft. The middle shaft region shows the least remodeling, and only the
medio-caudal part of fibula shows cancellous bone. A clear boundary of the medullary cavity
is developed here. To the proximal and distal extremities, the boundaries become blurred.
Remodeling and cancellous bone increases and finally surrounds the medullary cavity
completely. Only a thin layer of primary tissue remains in the cortex of the very proximal and
very distal shaft region.
6.1.5 Humerus
In comparison to the other long bones, the cortex is relatively thin and amounts to
between 0.5 cm to 1.2 cm at one bone side. The whole bone diameter, measured from the
cranial to the caudal surface amounts to between 4.0 cm and 5.0 cm. In all humerus samples,
the medial part of bone contains the thickest cortex.
As in the other long bones, in the humerus, the medullary cavity is large, and its
average size amounts to 55% of the shaft diameter. The measurements were taken from the
cranial to the caudal surface. In the cross section of the humerus of Frick, the medullary
cavity is only 42%, due to stronger compaction of the bones from Frick.

52
The outline of the cross sections of the humeri as well as the outline of medullary
cavities is triangular with rounded corners. The outline of the cross section and the medullary
cavity form of the humerus from Frick is more oval and elongated in the medio-lateral
direction.
In most sampled humeri, a relatively large cancellous bone area surrounds the
medullary cavity. But in two samples (right humerus SMNS F 61B, 43.5 cm and left humerus
SMNS F 29A, 43.5 cm), no cancellous bone is present at the medial bone side.
6.1.3 Bone types in long bones of Plateosaurus engelhardti
6.1.3.1 Primary bone tissues and vascular density
The most widespread primary bone tissue in all Plateosaurus long bones is the laminar
fibro-lamellar complex combined with lines of arrested growth (figure 3A, E). It makes up
around 75 % (estimated) of the primary bone tissue in all Plateosaurus long bones.
In spite of its cyclical growth, the laminar fibro-lamellar complex with lines of
arrested growth shows a relative high vascular density and therefore represents a fast growing
bone tissue. The vascular canals build a three-dimensional network. The primary
vascularization pattern in Plateosaurus long bones is laminar and consists mainly of circular,
and longitudinal vascular canals. In some samples, also a few radial and reticular vascular
canals occur in the fibro-lamellar complex, mainly in the inner cortex areas. The amount of
longitudinal vascular canals increases from the inner to the outer cortex. In general the
vascular density decreases gradually within a growth cycle and from the inner to the outer
cortex. The osteocytes lacunae in the fibro-lamellar tissue are thick and mainly rounded.
The second regularly appearing bone tissue is the lamellar-zonal bone which occurs in
some Plateosaurus long bones (figure 3B, F), but except in one sample (right humerus, IFG,
53 cm restricted to the exterior cortex. It consists of lamellar bone with mainly longitudinal
vascular canals grading into avascular bone. The osteocytes lacunae in this bone tissue are
flattened.
In one femur sample (left, compactus, 74.0 cm), the inner cortex consists of a very
highly vascularized bone tissue in a broad cycle and very thick laminae with large vascular
canals (figure 3C, G). The individual vascular canals and laminae are much thicker than in the
“normal” fibro-lamellar complex of Plateosaurus engelhardti. The tissue appears in the
second visible cycle. The earlier and later cycles consist of the normal laminar fibro-lamellar
complex. Initially, it was assumed that this tissue might represent some kind of juvenile bone,
but this could not be verified, because among others, the total size of the femur is 74.0 cm

53
which excluded a young individual. Thus, this bone type at this location must have another
explanation.
A few samples, a femur from Frick (NAA F 88-B130, right, 56.5 cm), a tibia from
Frick (NAA F88/B70, right?, 51 cm), a tibia from Trossingen (SMNS F 29A, left, 59 cm), a
fibula from Trossingen (SMNS F 14, right, 52.5 cm), and a vertebra from Trossingen (IFG
RW 12) show an additional bone type (figure 3D, H). The bone tissue is still the fibro-
lamellar complex, but the kind of vascularization is different. It consists of parallel radial
vascular canals with a very high density. Although this bone type shows such a high
vascularization, which indicates a very rapid growth rate, the tissue is deposited cyclically and
delimited by normal lines of arrested growth. It occurs always in the outer cortex areas. Due
to the predominance of radial vascular canals in this tissue, it is called in the following radial
fibro-lamellar bone tissue (RFB). It is similar to, but much more highly vascularized than, the
“radiating” fibro-lamellar bone tissue described by FRANCILLON-VIEILLOT et al. (1990: Fig.
14G).
The cross sections show that RFB is locally restricted. But it appears on different bone
sides in the different samples and within the “normal” laminar fibro-lamellar complex as well
as in the lamellar-zonal bone. In one femur (NAA F88/B130, right, 56.5 cm), the RFB was
deposited at the caudal bone side with three cycles following after a clear cycle of lamellar-
zonal bone in an avascular tissue. As in the femur sample, the RFB in both tibia samples
(NAA F88/B70, right?, 51 cm; SMNS F 29A, left 59 cm) is restricted to the caudal bone side,
and always a few cycles were deposited. It is very untypical for such a highly vascularized
bone tissue to occur always in the outer or outermost cortex areas. As documented by the four
fracture surfaces along the right fibula SMNS F 14 (52.5 cm), the RFB seems to be restricted
to the mid-shaft region and disappears in the proximal and distal diaphysis. It is therefore not
evenly distributed along the whole shaft. In the right fibula sample SMNS F 14 (52.5 cm), the
RFB is restricted to the lateral bone side. Two cycles are documented here. In the sample of
the tibia of Frick (NAA F 88/B70, right?, 51 cm), the RFB is not as high vascularized as in
the sample of the Trossingen tibia (SMNS F 29, left, 59 cm). But in this bone it is deposited
after a clear layer of avascular lamellar-zonal bone, similar to the femur sample.

54
A B
C D
E F
G H
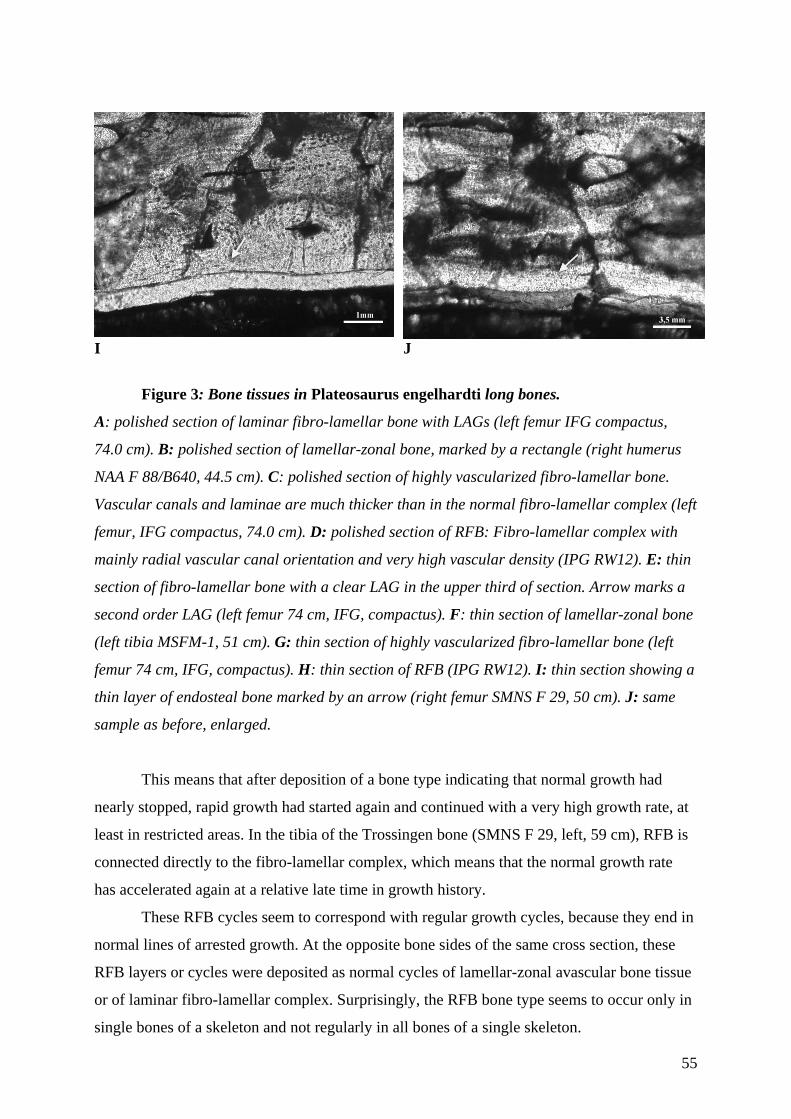
55
I J
Figure 3: Bone tissues in Plateosaurus engelhardti long bones.
A: polished section of laminar fibro-lamellar bone with LAGs (left femur IFG compactus,
74.0 cm). B: polished section of lamellar-zonal bone, marked by a rectangle (right humerus
NAA F 88/B640, 44.5 cm). C: polished section of highly vascularized fibro-lamellar bone.
Vascular canals and laminae are much thicker than in the normal fibro-lamellar complex (left
femur, IFG compactus, 74.0 cm). D: polished section of RFB: Fibro-lamellar complex with
mainly radial vascular canal orientation and very high vascular density (IPG RW12). E: thin
section of fibro-lamellar bone with a clear LAG in the upper third of section. Arrow marks a
second order LAG (left femur 74 cm, IFG, compactus). F: thin section of lamellar-zonal bone
(left tibia MSFM-1, 51 cm). G: thin section of highly vascularized fibro-lamellar bone (left
femur 74 cm, IFG, compactus). H: thin section of RFB (IPG RW12). I: thin section showing a
thin layer of endosteal bone marked by an arrow (right femur SMNS F 29, 50 cm). J: same
sample as before, enlarged.
This means that after deposition of a bone type indicating that normal growth had
nearly stopped, rapid growth had started again and continued with a very high growth rate, at
least in restricted areas. In the tibia of the Trossingen bone (SMNS F 29, left, 59 cm), RFB is
connected directly to the fibro-lamellar complex, which means that the normal growth rate
has accelerated again at a relative late time in growth history.
These RFB cycles seem to correspond with regular growth cycles, because they end in
normal lines of arrested growth. At the opposite bone sides of the same cross section, these
RFB layers or cycles were deposited as normal cycles of lamellar-zonal avascular bone tissue
or of laminar fibro-lamellar complex. Surprisingly, the RFB bone type seems to occur only in
single bones of a skeleton and not regularly in all bones of a single skeleton.

56
6.1.3.2 Remodeling in long bones
All long bone samples of Plateosaurus share a generally low rate of remodeling. Real
remodeling zones, as seen in pubes or scapulae, that surround the medullary cavity are
missing in most long bones. Mainly erosional rooms of varying diameters occur. They were
connected to the medullary cavity and were usually concentrated at one bone side. Many
erosional rooms show some secondary bone deposition but were also partially filled with
surrounding sediment. The transition from cancellous bone, which means the margin of the
medullary cavity and the place were most erosional rooms opened up, to the primary cortex is
always gradual and irregular in long bones.
Beside erosional rooms, secondary osteons occur in all long bones. If secondary
osteons are present in a sample, they are most often sparsely distributed throughout the whole
cortex. In some samples, an accumulation of secondary osteons near the medullary cavity
could be observed. Nevertheless, in none of the samples does the occurrence of secondary
osteons significantly disturb the primary bone tissue or the growth record. The primary
arrangement of vascular canals never was fully destroyed during remodeling, and so the
secondary vascularization shows mainly longitudinal Haversian canals.
In femora, isolated secondary osteons are generally very rare and completely lacking
in many specimen. Only the femur from Frick (NAA F88/B130) shows numerous secondary
osteons up to the exterior cortex. Erosional rooms again occur close to the medullary cavities.
The samples of the tibiae show more remodeling than those of the femora but also not
as much as in flat bones. Secondary osteons occur close to the medullary cavity as well as
scattered throughout the cortex. Erosional rooms are available sometimes up to the middle of
cortex, predominately in the region with the thickest cortex. Altogether, the distribution of
remodeling is relatively irregular around the tibia cross sections.
As expected, the fibula SMNS F 14 (right, 52.5 cm) broken into five pieces clearly
shows along the fracture planes how remodeling increases towards the proximal and distal
end of the shaft. Only the mid-shaft region is not significantly disturbed by remodeling
processes. Erosional rooms and secondary osteons were observed with a magnifying glass in
the fractures but secondary osteons are not visible at this magnification. At the medio-caudal
part of the shaft, remodeling extends into the middle of the cortex. In the other parts of the
cross sections, remodeling occurs adjacent to the medullary cavity only.
In humerus samples, secondary osteons and erosional rooms are adjacent to the
medullary cavity and occur in a moderately wide band around them. Only a few secondary
osteons are scattered throughout the cortex and extend to the outer cortex or bone surface.

57
Although remodeling is relative strong in the humerus, only in the inner cortex the primary
bone tissue is sufficiently overprinted to partially destroy the growth record.
6.1.3.3 Endosteal bone
Endosteal bone is documented in one specimen of Plateosaurus (right femur SMNS F
29, 50 cm, figure 3I, J). It appears as a thin layer of lamellar bone along the boundary of
medullary cavity. Endosteal bone consists of typical lamellar bone structure and is separated
from the cortex by a cementing line.
6.1.4 Growth marks in long bones
In the fibro-lamellar complex of Plateosaurus long bones, growth cycles can be
divided into zones and annuli. The growth cycles in lamellar-zonal bone tissue, on the other
hand, mainly consist only of a slow growing part. Nevertheless, a clear line of arrested growth
marks the end of each growth cycle. In Plateosaurus bones, LAGs occur throughout all
documented bone tissues and were not restricted to the slow growing bone types. LAGs run
always parallel to bone surface.
A band of dense avascular tissue sometimes accompanies the LAG, appearing as a
bright band in some specimen. This bright band is not the same as FRANCILLON-VIEILLOT et
al. (1990: 510) described, because a fine line of arrested growth within this bright band can be
identified in Plateosaurus samples under higher magnifications. LAGs may also appear as
polish lines (SANDER 2000), predominately in the material from Frick. Under higher
magnification a LAG is always visible in these polish lines.
The density of LAGs is relatively low in the inner cortex but becomes higher in the
middle and increases clearly towards the outer cortex regions. This is due to a slower growth
rate with increasing age and therefore a closer deposition of growth cycles. However, cycle
distance is generally relative irregular in Plateosaurus specimen. Irregularities in cycle
distances in long bones of Plateosaurus are not as frequent as in flat bones, but does occur,
too. For example, narrow and poorly vascularized cycles can appear in the inner cortex and
wide and highly vascularized cycles can appear in the outer cortex. Such irregularities are
independent of bone tissue.
In Plateosaurus long bones, bone type and tissue can change from the fibro-lamellar
complex into the lamellar-zonal bone type, mainly in the outermost cortex. Once this had
happened, LAGs were then deposited extremely close together within the lamellar bone
tissue. Then growth cycles are difficult to distinguish from each other and therefore also very

58
difficult to count. Similar problems were discussed by ZUG et al. (1986: 10) and CASTANET &
SMIRINA (1990).
Some wide growth cycle of Plateosaurus long bones are subdivided by second-order
cycles (fig. 3E). These are mainly indicated by second-order lines of arrested growth. They
appear predominately in large growth cycles of the inner cortex where also a slight decrease
of vascular density towards the second-order LAG can be observed. A single major growth
cycle can be divided in one or two, seldom three second-order cycles. Second-order cycles are
the result of short growth decreases during the normal annual growth period. They were
probably caused either by seasonal changes of weather or food availability or by individual
diseases. Such second-order lines are mentioned relative frequently in literature (ZUG et al
1986, CASTANET et al. 1993).
Sometimes, LAGs are accompanied by small assemblages of second-order lines, most
of the time two or three above and below the major LAG. This occurs more often in the outer
cortex areas, where cycle distances had become closer than in the inner cortex areas. Such
assemblages look similar to closely spaced LAGs in the outermost cortex in lamellar-zonal
bone. But in most cases, second-order LAGs could be distinguished from major LAGs by
being thinner and less clear in appearance. Usually they can not be followed completely
around the entire cross section. Probably these second-order LAGs document remains of
zones and annuli which were not fully deposited due to decreased appositional rates in older
individuals and low space in the exterior cortex.
6.2 Flat Bones
Although pubis and scapula both bones belong to the category “flat bone”, they differ
in their histology and in the quality of their growth record.
In contrast to long bones, the diploe structure makes only two main coring sites
possible. Thus, the lateral and medial side in the scapula, and in the pubis the dorsal and
ventral side are available for sampling. However, remodeling in form of erosional rooms,
respectively cancellous tissue, and secondary osteons often disturbs the primary bone tissue at
these locations.
In Plateosaurus flat bones, the medullary cavity if at all present, is often not clearly
separated from the surrounding cancellous bone and remodeling area, so the areas in the
center of the bones will be summarized here under the term medullary region. Also, the
transition from secondary bone tissue to primary bone tissue is at most times irregular and not
clearly delimited. The cortex of the scapula preserves at certain places a relatively good

59
growth record and that of the pubis provides a very good growth record. However, the scapula
is difficult to evaluate due to its bone tissue intermediate between fibro-lamellar complex and
lamellar-zonal bone. At least in Plateosaurus, it is a bone not very well suited for growth
history research.
Like in long bones, flat bones represent only sub-adult and adult individuals, and the
growth record of the juvenile phase seems to be lacking as well. This is not due to the
enlargement of the medullary cavity but due to strong remodeling. On the other hand, flat
bones of Plateosaurus engelhardti grew in another way than long bones, as is documented in
their histology. Thus, their growth record is possibly more complete, but a correlation with
the growth record of long bones remains impossible until histological research on juvenile
Plateosaurus specimen becomes possible.
6.2.1 Sampling location
The cores and cross sections of the scapulae were taken in the middle of the most
narrow mid-shaft region, which contains the least disturbed primary bone tissue (figure 4), as
the examination of fractures and cross sections of flat bones had shown. The most complete
and undisturbed growth record was found in the cortex of the lateral side of the scapula. The
medial cortex also preserves a useful growth record, but shows generally more remodeling.
Although the dorsal and ventral edges of the scapula provide the thickest cortex, these areas
are usually affected by strong remodeling.
The cores and cross sections from the pubes were usually taken in the proximal to
mid-shaft region, as near as possible to the lateral edge of the bone (figure 4). This bone site
contains the thickest available cortex and also the thickest primary bone tissue in the pubes
cross sections. The most complete and undisturbed growth record was found at the lateral-
dorsal part of the pubis. The lateral-ventral part of pubis also preserves a good growth record,
but predominately the inner cortex shows much more remodeling than the dorsal side, making
the growth record most of the time incomplete there.
Because the scapula as well as the pubis are flat bones, the cores can be drilled
through the entire bone to obtain a double growth record. A combination and interpretation of
both sides thus resulted in the most complete growth record.

60
Figure 4: Preferred sampling location in pubis and scapula, marked by a rectangle.
Right pubis in dorsal view, left scapula in lateral view. Bone drawing from HUENE (1926).
Not to scale.
6.2.2 Scapula
Due to the bone morphology, cortex and medullary region in Plateosaurus scapulae
are strongly flattened between medial and lateral bone side. The bone cross-section and also
the outline of the medullary region are similar to a flattened ellipse, tapering towards the
dorsal and ventral edges. The medullary region consists mostly of cancellous bone, but is
completely surrounded by a relatively thin layer of cortex.
The greatest thickness of the cortex is found in the middle of the shaft. Shaft thickness
amounts to two to three centimetres measured from the lateral to the medial bone side. The
average size of the medullary region in the scapula amounts to 37 % of the shaft diameter,
also measured in the middle of the shaft from the lateral to the medial surface.
6.2.3 Pubis
Due to bone morphology, cortex and medullary region of the pubis are strongly
flattened between the dorsal and the ventral side. Thus, the shape of the cross section and
medullary region is generally long and thin whereas the proximal edge is thicker than the

61
distal end of bone. The form can be described as roughly rectangular, with straight dorsal and
ventral surfaces in some specimen and in others more curved dorsal and ventral bone
surfaces.
The medullary region starts at the lateral bone edge and extends to the medial edge.
From the mid-shaft region to the distal end, the medullary region increases significantly in
relative size. Also, the bone becomes thinner in medial direction, and the primary bone tissue
disappears and is finally replaced at the medial edge of the bone by purely secondary tissue
and cancellous bone.
The greatest thickness of the bone as measured from dorsal to ventral is found near the
lateral edge and amounts to two to three centimeters. Thus, the average size of the medullary
region is 19 % of the shaft diameter at the lateral edge and nearly 90-100 % at the medial
edge.
6.2.4 Bone tissues, vascular density and remodeling in scapula and pubis
The primary bone type in the scapula seems to be a mixture of the typical laminar
fibro-lamellar complex known from the long bones and purely lamellar-zonal bone (figure
5A, C). It shows areas with relatively highly-vascularized fibro-lamellar bone which
gradually pass into less vascularized lamellar and parallel-fibered bone. Longitudinal vascular
canals dominate the vascular system, but their density is considerably higher than in the pubis
samples. Additionally a few reticular canals can occur. Thus, the scapula seems to have an
intermediate histologic status between fast-growing long bones and the slow-growing pubis.
The primary bone in the pubis is of the pure lamellar-zonal type (figure 5B, D). It
consists mainly of lamellar or parallel-fibered bone and is dominated by longitudinal vascular
canals. The osteocytes are usually flattened.
Remodeling is generally stronger in scapula and pubis than in long bones. Depending
on the location in the cross sections, the primary bone tissue is largely replaced by secondary
compact or cancellous bone (figure 12, 13). In the pubis, the lateral part of the proximal bone
and in scapula the middle of the mid-shaft region contains only a relative small cancellous
bone area, which is surrounded by a moderately broad remodeling zone. The remodeling zone
contains a few erosional rooms of predominately rounded shape and secondary osteons, often
in several generations. The vascular canals of these follow the primary vascular system and
are thus arranged longitudinally. Secondary osteons are in both bones scattered in all regions
throughout the primary bone tissue up to the bone surface. The other parts of the section of
scapula and pubis show mainly cancellous bone and strong remodeling which resulted in a

62
relatively high proportion of erosional rooms with varying diameters. In between, often none
or only very small parts of primary bone tissue are preserved.
A B
C D
Figure 5: Bone tissues in Plateosaurus engelhardti flat bones. A. polished section of
a scapula (SMNS F 29, left, 42 cm), lateral bone side. B: polished section of a pubis (SMNS F
14B, left, 50 cm), dorsal bone side. C: : thin section of the primary bone of a scapula sample
(SMNS F 14B, right, 47 cm, thin section I) D: thin section of the primary bone of a pubis
sample (NAA.).
6.2.5 Growth marks in scapula and pubis
Growth cycles in flat bones were often not clearly divided into zones and annuli, they
consist mainly of zones and LAGs. Nevertheless, each cycle ends in one or more lines of
arrested growth. The LAGs are clear where the cortex is thick enough, but following them
continuously around the entire cross section is not possible due to the large medullary region
in flat bones. Division of growth cycles into second-order cycles are more rare than in long
bones, probably again due to the thinness of the cortex and maybe due to a generally slower

63
growth in the scapula and mainly in the pubis. But close to the main LAGs, before and after,
there often occur a few less clear and therefore subordinate LAGs.
In addition to the general decrease in vascular density from the inner to the outer
cortex, vascular density decreases within the single growth cycles. Zones of the scapula are
generally more highly vascularized than in pubes. Most of the time the LAGs were deposited
in small bands of avascular or nearly avascular tissue. Such avascular bands sometimes
appear as bright wide bands or as polish lines.
Growth cycle thickness is fairly irregular, but there is a general tendency for cycle
thickness to decrease from the inner to the outer cortex. Generally, cycles are quite thinner
than in long bones due to the thinner cortex. Finally, the growth cycles disappear in the outer
cortex, and only closely spaced LAGs set in a very poorly vascularized or avascular lamellar
bone tissue remain. The growth cycle thickness in the scapulae, respectively LAG spacing,
decreases in the exterior cortex as in the long bones, but not as sudden as in the pubes.
In contrast to the long bones, medullary regions are small in flat bones. Thus, the
resorbed LAG number is low in flat bones. Predominately the pubis shows high visible LAG
numbers and very low extrapolated LAG numbers. Thus, it is concluded that the pubis shows
the most realistic growth record, whereas the growth record (total LAG count) in the long
bones is always an over-estimate due to their large medullary cavities.
6.3 Other bones: vertebrae, ribs, ischia, and foot phalange
6.3.1 Sampling location in other bones
One aim of the current study was to test the suitability of varying bones of the
Plateosaurus skeleton for bone histology research. Thus, beside typical long bones, scapula,
and pubis, some other bones were sampled. Sampling locations were chosen based on general
bone morphology and the general principles of bone growth.
Thus, the cores from the dorsal vertebrae (IFG RW 12 and 14) were drilled at the
ventral side of the vertebral centra.
The cross section of the rib from Trossingen was obtained from the middle of a long
rib of the thorax. The rib from Frick was sampled at two places, one near the proximal middle
of the rib and the second sample more distal.
The ischia were rather complete and still articulated but a fracture surface at the most
narrow mid-shaft region was available.
The core from the foot phalange was drilled through its shaft from dorsal to ventral,
covering its entire thickness.

64
6.3.2 Bone tissue, vascular density, and remodeling
6.3.2.1 Vertebrae
No cross sections are available for the vertebrae. The thin- and polished sections of the
cores show a thick (1 and 1.5 cm length) cortex which consists mainly of primary bone tissue.
The primary bone tissue is built up of the fibro-lamellar bone, typical for Plateosaurus, with
clear lines of arrested growth. However, in these sections only longitudinal vascular canals
are visible. Vertebra IFG RW 12 consists in the upper one third of its cortex of RFB. In both
vertebrae, only a few secondary osteons are scattered throughout the cortex. The cortex
continues inward into cancellous bone with preserved interstitial primary bone tissue. This
coarse cancellous bone grades inwards into the medullary region.
6.3.2.2 Ribs
The cross section of the rib from Trossingen shows an outline similar to that of the
long bones. The form is generally oval, but in the middle, the rib cross section is slightly
waisted. The medullary cavity makes up 39%, the cancellous bone area 36%, and the cortex
only 25 % of the dorso-ventral diameter of the rib. The cortex percentage is slightly greater in
cranio-caudal diameter (32%). Thus, it is obvious that the medullary region dominates the rib.
Only one side of the rib preserves a growth record. The other side shows a relatively high
degree of remodeling in form of erosional rooms and secondary osteons. At the dorsal and
ventral parts of bone, the cortex is generally thin. As primary bone tissue, the rib contains the
fibro-lamellar bone with clear lines of arrested growth in the inner cortex and lamellar-zonal
bone in the exterior cortex. Only longitudinal vascular canals are present. Vascular density is
intermediate and decreases slightly from the inner to the outer cortex.
The two samples of the rib from Frick show similar features. The cancellous bone area
is larger, but more diffuse than in the Trossingen rib, so that measurements make no sense.
Remodeling in form of erosional rooms and secondary osteons is very strong, and a true
medullary region cannot be marked off. The primary and undisturbed cortex in form of fibro-
lamellar bone with clear lines of arrested growth is only preserved in the exterior areas of the
more proximal cross section. This section has an elliptical outline and tapers to one side. At
the other side of the section, a relative thick cortex is preserved, but it is strongly remodelled.
The LAGs are closely spaced and expressed in a nearly avascular lamellar-zonal tissue. The
more distal rib sample has a regular elliptical cross section, but no primary cortex is
preserved. The sample is totally remodelled, and the tissue can be called secondary compact
and cancellous bone.

65
6.3.2.3 Ischia
The ischia fracture surface has a nearly triangular to oval outline. A real medullary
cavity with a clear boundary is missing. The sections contain a large area of cancellous bone,
respectively erosional rooms of varying diameters with a diffuse boundary to the cortex. A
few secondary osteons are scattered throughout the cortex. The primary bone tissue is of the
fibro-lamellar type with clear lines of arrested growth and predominating longitudinal
vascular canals. The ischium from Trossingen contains RFB in its exterior cortex.
6.3.2.4 Foot phalange
The centre of the foot phalange shows a large medullary cavity. The rest of the core is
built up of cancellous bone, respectively big erosional rooms of varying diameter. Secondary
osteons are rare in this sample. Primary bone tissue is present only in the exterior cortex and
in small areas between the erosional rooms. It consists in the inner cortex areas of fibro-
lamellar bone with a very low, predominately longitudinal vascularization. The exterior
cortex is built up of avascular lamellar-zonal bone.
6.4 Summary of the histological record
Long and flat bones can be distinguished well in histological samples due to the
development of different bone tissues combined with different vascular systems. Long bones
are generally dominated by the laminar fibro-lamellar complex. Lamellar-zonal bone appears
only in the exterior cortex of some specimen. A highly vascularized radial fibro-lamellar bone
tissue is documented in the outer cortex of six bones. In pubis samples, only lamellar-zonal
bone occurs which is dominated by longitudinal vascular canals. Vascular density is almost as
low in the pubis. No fibrous bone tissue can be identified in the available pubis samples. The
histological structure of the scapula is intermediate between the typical laminar fibro-lamellar
complex of long bones and the purely lamellar-zonal bone of the pubis. In the zones the
scapula shows predominately fibro-lamellar complex, but in the annuli lamellar and parallel-
fibered bone. Like in the pubis, longitudinal vascular canals dominate the vascular system of
the scapula, but their density is quite higher than in the pubis samples. In addition, a few
reticular vascular canals occur.
Similar to the long bones, the vertebra, the rib, the phalange, and the ischia samples
show the fibro-lamellar complex but with mainly longitudinal primary osteons. Some show
lamellar-zonal bone, too. But these bones were generally highly remodeled.

66
6.5 Differences between the Frick and Trossingen localities
Although the histological samples from the two localities can easily be distinguished
on the basis of the different color and preservation of the bones, not many histological
differences can be observed. The only ones are the more frequent appearance of polish lines
and a generally larger amount of secondary osteons in the samples from Frick. These
histological differences are not detailed and significant enough to distinguish clearly different
taxa of Plateosaurus from the localities Frick and Trossingen on the basis of the histology.
7. Results: Bone histology and growth record
7.1. Evaluation of various aspects of bone microstructure
7.1.1 Evaluation of the sampled bones for skeletochronology
As the present study shows, most Plateosaurus engelhardti bones contain a well
preserved growth record. Mainly long bones and the pubis are bones well-suited for obtaining
a good and relative complete growth record, similar to many other dinosaurs (RICQLÈS 1983,
VARRICCHO 1993, CHINSAMY 1993, CURRY 1999, SANDER 1999, 2000, ERICKSON &
TUMANOVA 2000, HORNER et al. 2000, SANDER & TÜCKMANTEL 2003). Other bones, like
ischia, vertebrae, phalanges, and ribs are not as well suited for bone histological studies due to
high remodeling which leads to an incomplete growth record. The scapula is difficult to judge
because of its intermediate type of bone tissue and growth rate, and a relatively strong degree
of remodeling in comparison to long bones. Nevertheless, the scapula also consists of areas
where the growth record is well preserved. Somewhat unexpectedly, the pubis contained a
good and relatively complete growth history.
A difficulty in using Plateosaurus engelhardti long bones for life history research is
the large medullary cavities, which accounts for around 50% of the entire cross-section. Flat
bones, in contrast, do not have such large medullary cavities but contain instead highly
remodeled and cancellous bone areas, which can resorb or disturb the inner growth cycles.
These and the lack of smaller, i.e. younger individuals make extrapolation of the resorbed
growth cycles necessary. (see section 5.4.2).
7.1.2 Secondary osteons and remodeling
The size of the remodeling zone and cancellous bone area, respectively the expanding
medullary cavity, can possibly give some information about the age of an individual. Strong
remodeling, indicated by much substitution of primary bone tissue by secondary bone tissue
and unclear boundaries between the cancellous bone region and the remodeling zone,

67
indicates a greater age than a bone with clearly delimited and small medullary region and little
remodeling.
7.1.3 Endosteal bone
The meaning of endosteal bone is not really clear yet. CASTANET et al. (1988) describe
it from young individuals from the tuatara. REID (1997b) mentioned that endosteal bone is
formed in marrow-filled limb bones after active growth has ceased or is formed and resorbed
during pauses in medullary expansion. This bone type can also appear when bone drift occurs
to one bone side (REID 1997b). It is clear that the endosteal layer in the Plateosaurus
specimen (fig. 3I, J) is locally restricted to the cranial bone side. It is not documented in the
core from the caudal bone side and also not in the caudal bone side in the more distally
located cross section of the same specimen (right femur SMNS F 29, 50 cm). According to
skeletochronology, the bone belonged to a relatively young individual in which growth had
not ceased yet.
7.2 Qualitative growth record
7.2.1 Bone tissues
Like in other dinosaurs, the main bone tissue in Plateosaurus engelhardti bones is the
fibro-lamellar bone. Three types of it were observed (fibro-lamellar bone with clear LAGs,
fig. 3A, E; highly vascularized fibro-lamellar bone with clear LAGs, fig. 3C, G; RFB, fig. 3D,
H). These three types differ mainly in vascular density and in the arrangement and kind of
vascular canals. All three types have in common a subdivision in growth cycles, indicated by
regularly appearing lines of arrested growth. Unfortunately, they do not represent an
ontogenetic series as in some other dinosaurs (VARRICCHO 1993, CURRY 1999, SANDER 2000;
ERICKSON et al. 2000, HORNER et al. 2000).
The two additionally appearing bone types, the radiating fibro-lamellar bone and the
very high vascularized bone type represent surely special features/circumstances, due to their
rare occurrence. They are neither important for the interpretation of the growth record nor the
typical bone types in adult Plateosaurus bones.
7.2.1.1 Laminar fibro-lamellar complex with LAGs
In the long bones of Plateosaurus engelhardti, the laminar fibro-lamellar complex
with clear LAGs represents the usual bone tissue of young, still growing but matured adults.
The term adult is used here with reference to the body size, because all bones sampled in this
68
study belonged to individuals that had reached at least half of the known possible maximum
body size (5m). Most individuals are larger (figure 1).
The laminar fibro-lamellar complex with LAGs documents that long bones of
Plateosaurus engelhardti individuals still grew, as adults at a relative high growth rate,
despite cyclical interruption. Nevertheless, a general decrease in vascular density and growth
cycle distance from the inner to the outer cortex can be observed in all long bones sampled.
The increase in the number of deposited LAGs is accompanied by a change in the spatial
organization of bone tissue. This indicates that growth rate decreased gradually with time and
size.
Although, the laminar fibro-lamellar complex with LAGs in Plateosaurus engelhardti
consists of a similar construction than the laminar fibro-lamellar complex described in
sauropods (SANDER 2000) and mammals, in Plateosaurus engelhardti bones it has a
conspicuously smaller distance between the single laminae, and the vascular canals are also
distinctly smaller and more rare. This suggests that Plateosaurus engelhardti long bones, in
spite of a similar bone tissue to mammals and sauropods, still had lower growth rates. The
difference in distances between the single laminae in mammals and prosauropods was already
documented, but not discussed, by CURREY (1962). See for bone lamina thickness also
SANDER & TÜCKMANTEL (2003).
7.2.1.1.1 Growth of juvenile Plateosaurus engelhardti
Presumably bones of juveniles grew at least with the same rate, producing a similar
tissue as the bones of the adults. On the other hand, it seems to be very likely, based on the
results of bone histological studies in other dinosaurs (VARRICCHO 1993, CURRY 1999,
HORNER et al. 2000, SANDER 2000, ERICKSON et al. 2000, SANDER & TÜCKMANTEL 2003) that
the bones of juveniles grew with higher rates than the bones of the adults. The ability of
Plateosaurus of growing with higher growth rates than those of the typical laminar fibro-
lamellar complex with LAGs is suggested by the two additional types of fibro-lamellar bone
tissue described in section 6.1.3.1 and discussed in 7.2.3.
7.2.1.2 Lamellar-zonal bone and determinate growth in Plateosaurus engelhardti
The second type of regularly appearing bone tissue in Plateosaurus engelhardti is the
lamellar-zonal bone. In the pubis it represents the main primary bone tissue. The growth rate
in the pubis decreases from the inner to the outer cortex, as in long bones and scapula. This is
expressed by a generally decreasing vascular density and cycle distance, accompanied by an

69
increasingly closely spaced LAGs and a generally increasing spatial organization. Deposition
of lamellar-zonal bone makes it clear that Plateosaurus engelhardti pubes have lower growth
rates apposition than long bones and scapulae.
Lamellar-zonal bone also occurs in the outermost cortex of some long bones and
scapulae. Decreasing vascular density the laminar fibro-lamellar complex first initiates the
transition from fibro-lamellar bone to lamellar-zonal bone. The lamellar-zonal bone is here
deposited in a poorly vascularized or nearly avascular tissue and is characterized by closely
spaced lines of arrested growth. The appearance of this tissue in long bones and scapulae is
very important because it indicates, in comparison to the fibro-lamellar bone deposited before,
a strong decrease of growth, respectively a full growth stop in some samples. In some pubis
samples, there is also a dramatic slow down of growth in the outermost cortex, indicated by a
clearly decreasing vascular density.
Closely spaced LAGs deposited in a very poorly vascularized to avascular lamellar
bone tissue in long bones as well as in flat bones record the time the individual lived after
bone growth in thickness and largely in length had decreased or finally stopped. Growth thus
was surely determinate in Plateosaurus engelhardti.
7.2.1.3 Bone tissue change
The transition from laminar fibro-lamellar bone to lamellar-zonal bone in long bones
can be interpreted in at least two ways. One is that sexual maturity occurred at this time
(VARRICCHIO 1993, CHINSAMY 1994, REID 1997, HORNER et al. 2001, ANDRASSY 2004). This
would mean that sexual maturity was reached late in Plateosaurus engelhardti ontogeny and
not before nearly maximum body size was attained. A similar situation is known in recent
birds and mammals, where in most species sexual maturity is reached at nearly maximum
body size. Applied to Plateosaurus, this would sugges, that many of the individuals,
especially those from Trossingen, had not reached sexual maturity at time of death, although
some of them had already reached very large body sizes. In this interpretation, laminar fibro-
lamellar bone would be the characteristic tissue of immature individuals and the lamellar-
zonal bone that of sexually mature individuals. In the pubis, the lamellar-zonal bone would be
typical of immature as well as of mature individuals, and only decreasing vascular density
would indicate transition to maturity.
A second possibility is that sexual maturity was reached well before laminar fibro-
lamellar bone by lamellar-zonal bone in long bones and scapulae, and before the dramatic
decrease in vascular density in the pubis. This would mean that this moment, which is so

70
time
two possible moments of sexual maturity
size
incr
ease
fibro-lamellar bone lamellar-zonal boneunknownjuvenile bone
Figure 6: Alternative qualitative growth curves based on changes in bone tissue and vascular density.
The first interpretation is represented by the black curve which is divided in three stages of ontogeny
The second interpretation is represented by the gray curve.
It depicts the two alternative interpretations of the growth strategy of .
. The first section represents the unknown juvenile stage which is not preserved in the sampled bones but it is assumed that juveniles of
grew with higher growth rates than bone tissue of adult individuals suggest. The juvenile stage ends with the change from the unknown juvenile bone tissue to the laminar fibro-lamellar bone with clear LAGs. This change possibly reflects sexual maturity, too. The adult stage is documented by the laminar fibro-lamellar bone in long bones, by relatively highly vascularized lamellar-zonal bone in the pubis, and by the combination of fibro- lamellar bone in the zones and lamellar bone in the annuli of the scapula. The last stage is documented in the histological record by poorly or non-vascularized lamellar-zonal bone in both, long and flat bones. It indicates additionally determination of growth.
Here grew with laminar fibro-lamellar bone with clear LAGs from the juvenile stage (the growth rate of juveniles is again assumed as higher than in adults) to adulthood and final body size. When maximum body size is reached, bone tissue changes to lamellar-zonal bone, sexual maturity is reached and growth largely stops.
Plateosaurus engelhardti
Plateosaurus engelhardti
P. engelhardti

71
important in the life history, is not recorded in the available histologic record of the sampled
Plateosaurus engelhardti individuals. Either sexual maturity was generally not recorded in the
histology of P. engelhardti, or it simply was resorbed by expansion of the medullary cavity.
Only in the pubis samples a relatively sudden decrease in vascular density and cycle distance
can be observed which possibly records the onset of sexual maturity (see section 7.2.4).
According to this second interpretation the laminar fibro-lamellar complex with LAGs
in long bones and scapulae would be the typical bone tissue of still growing adults which
were sexually mature but continued fast growth for several years after. Lamellar-zonal bone
in long bones would only indicate the attainment of final size. In the pubis, the lamellar-zonal
bone would represent also, still growing bones of adult individuals. Not before the bone tissue
became avascular, maximum size was reached. This interpretation represents a more
“reptilian” life history. In living reptiles, sexual maturity is reached long before maximum
body size and, in contrast to mammals and birds, growth continues after the first reproduction
for several years, however with a clearly decreased growth rate. In many reptiles, size and age
at first reproduction vary in relatively wide limits, depending on climate and food availability
and quality. Thus, it would also not be easy to determine average age and size at sexual
maturity for an extinct taxon that has a similar life history to reptiles.
On the basis of the available data, the second interpretation including an early onset of
sexual maturity seems to be more likely.
7.2.3 Discussion of other fibro-lamellar bone types
7.2.3.1 Radial fibro-lamellar bone (RFB)
In some samples, fibro-lamellar bone with dense radial primary osteons (RFB) occurs.
It represents very rapid growth with high rates of bone deposition. There are six samples with
RFB from both localities. Bones include long and flat bones as well as a vertebra and an
ischium. The RFB is bounded by “normal” LAGs and was always deposited for one or a few
growth cycles, at most three, of the middle or exterior cortex (figure 3D, H, 14G).
ERICKSON & TUMANOVA (2000) described a similar tissue as “highly porous radially
vascularized bone” in three large long bones of Psittacosaurus mongoliensis. Like in P.
engelhardti this tissue is locally restricted and is deposited in the exterior cortex of older
individuals (ERICKSON & TUMANOVA 2000). They describe this special tissue as unusual for
dinosaurs. In extant vertebrates, highly vascularized radial bone is only formed in bony calli
or is associated with substantial shape changes. It is deposited very fast with 1mm/day
(ERICKSON & TUMANOVA 2000). These authors discussed if this radial bone tissue in P.

72
mongoliensis bones could have a pathologic cause, but no calli were observed. Another
possibility is rapid ontogenetic migration of muscle insertions, but this could also not
documented. A third hypothesis is that it reflects a loading change perhaps associated with a
shift from facultative bipedally to quadrupedally locomotion (ERICKSON & TUMANOVA 2000).
Several hypothesis about the meaning and origin of RFB in P. engelhardti are
discussed, but a satisfactory explanation is still lacking. The hypothesis that RFB is
pathologic is disproven by the normal and intact bone surface underlain by RFB. The bones
with RFB also show no other conspicuous differences in morphology.
Another hypothesis is that the RFB is an expression of sexual dimorphism. It is very
likely that one of the sexes, as it is common in recent tetrapods, had had a faster growth rate
up to sexual maturity than the other. Thus, this faster growing sex would have had to grow
with a correspondingly higher bone growth rate, expressed by higher vascularity. However,
RFB is only seen in selected and different bones and not in the complete skeleton of a single
individual, as this hypothesis would predict. On the other hand, its occurrence in the middle
and outermost cortex of apparently nearly full grown individuals indicates a strongly localized
growth spurt in a late stage of ontogeny, when slower growth is usually initiated. Thus, a
correlation with sexual maturity or sexual dimorphism seems unlikely, unless sexual maturity
is reached late in ontogeny (see above).
The fact that the RFB is known from Trossingen as well as from Frick shows that it is
indeed a rare but consistently appearing feature in Plateosaurus histology and not a feature
which is restricted to a single population. RFB can also be observed in other prosauropods,
e.g. in a Sellosaurus pubis (SMNS 5715, locality of Stuttgart–Herlach, Southern Germany)
and in a Thecodontosaurus bone of England (IPB R 555).
In a few samples, an intermediate stage between laminar fibro-lamellar bone and
radially fibro-lamellar bone can be observed, marked by a clear increase of radial vascular
canals within the laminar fibro-lamellar complex. This suggest that most (if not all) bones
have the possibility of growing with RFB, but the trigger for growing with RFB is until yet
unknown.
7.2.3.2 Highly vascularized laminar fibro-lamellar bone
The highly vascularized fibro-lamellar bone is only known from one femur from
Trossingen (IFG compactus, left, 74 cm, figure 3C, G). Although the area where it occurs in
the sample is influenced by diagenetic processes, this does not seen to be the sole explanation.
Vascular density is considerably higher than in the normal fibro-lamellar bone of

73
Plateosaurus engelhardti, and the single vascular canals and laminae are thicker, reminiscent
of sauropod tissue (SANDER & TÜCKMANTEL 2003). Therefore this tissue suggests a very high
growth rate. In contrast to the radial vascular canals in the RFB, this bone tissue shows
“normal” laminar vascularization.
The isolated occurrence of this tissue cannot be explained satisfactorily. Due to the
total length of the femur of 74.0 cm, and due to the fact that the cycle in which this tissue
appears represents the 5th total growth cycle, juvenile tissue must be excluded. Nevertheless,
it is possible that the original juvenile bone tissue of Plateosaurus had had a similar
appearance to the tissue observed in this femur.
A possible explanation could be that this tissue only represents very fast growth during
a restricted period, maybe due to optimal environmental conditions.
7.2.4 Possible onset of sexual maturity recorded in pubis specimens
In comparison to other bones, the pubis has a relatively high number of visible LAGs,
and in contrast the resorbed LAG number is very low. Due to this and its exclusively
lamellar-zonal bone, the pubis seems to be a bone with a slow ontogenetic growth, possibly
indicating negative allometry. This may be the reason why sexual maturity is possibly
preserved in the pubis and not in the growth record of any other sampled bone. All other
sampled bones had a higher growth rate and faster medullary resorption resulting in earlier
cycles having been destroyed.
Sexual maturity can be possibly documented in the pubis by the decrease of vascular
density in the lamellar-zonal bone and the general decrease in cycle distance. Growth
cessation, a decrease in vascular density, and a decrease in cycle distance appears in all
sampled pubes after LAG 5 or 6 (figure 7). In the other bones, sometimes also a similar
growth decrease can be observed, but not as clearly regularly as in the pubis samples.
The growth decrease in the pubis in conjunction with the relatively low total LAG
number would fit well with the onset of sexual maturity, at least better than the largely
complete growth stop occurring later in ontogeny marked by the bone tissue change.
7.3 Quantitative growth record (skeletochronology)
7.3.1 Single bone types
The quantitative analysis of growth is based on the count of growth marks combined
with observed differences in vascular density. Two forms of growth marks were used: Lines
of arrested growth and, primarily in the Frick samples, polish lines. Although the annual

74
nature of LAG deposition has not been tested in extinct vertebrates, it is a general assumption
in growth history research, and annual deposition of LAGs is the rule in recent vertebrates
(CASTANET et al. 1993).
0123456789
10111213141516
0 1 2 3 4 5 6 7 8 9 10 11 12 13
visible LAG number
corte
x th
ickn
ess i
n m
m
SMNS F 29 SMNS F 29 BSMNS F 14 BNAA
Figure 7: Cortex thickness plotted against visible LAG count in pubis samples. A
decrease in cycle distance occurs in all samples at around visible LAG 5 or 6.
In the Plateosaurus engelhardti samples, LAGs are spaced regularly throughout the
whole cortex. They are not restricted to a special bone type and appear in all kinds of fibro-
lamellar bone as well as in lamellar-zonal bone. Sometimes LAGs are even partially
preserved in secondary bone tissue. LAGs usually indicate the end of a growth cycle and are
always accompanied by decreasing vascular density. LAG counts always give a minimum age
due to resorption of primary bone during ontogeny. This and the lack of juvenile specimen
makes extrapolation of the resorbed LAGs necessary (see methods section, which discusses
various kinds of error). Thus, the following age estimate based on LAG counts should
generally be seen as approximations and not as exact data.
Due to the large number of single bones sampled for the current study, quantitative
analysis starts with their growth record.

75
7.3.1.1 Femur
The total count of visible LAGs in the femur samples from both localities varies
between 5 and 14 LAGs, averaging 8, with a total femur length ranging from 50 cm to 99 cm
(table 7). This LAG count corresponds to 6 to 15 growth cycles. The resorbed LAG number is
between 3 and 14 LAGs and also averages 8. The total LAG number varies between 12 and
24 LAGs, with an average value of 16 to 17 LAGs.
Table 7: Femur growth records based on different LAG counts. FBLC = fibro-
lamellar complex with LAGs; LZB = lamellar-zonal bone. Ts = thin section, ps = polished
section, cs = cross section, fs = fracture surface. sample
visible LAGs
exterior cortex resorbed LAGs
total LAGs
femur size kind of sample
SMNS F 29 6 FBLC, high vascular density
6-7 12-13 ca. 50.0 cm ts, ps, cs
NAA F 88-B130
14 LZB in an avascular tissue, at caudal side RFB
9 23 56.5 cm ts, ps, cs
NAA unnumbered 6 deposition of closely spaced LAGs in an avascular LBZ has started
6 12 59.0 cm ts, ps
SMNS F 29A (right; incomplete sample)
5 growth continued with FBLC
- - 59.5 cm ts, ps
SMNS F 27 7 not visible in the fracture surface
7 14
62.5 cm fs
SMNS F 14 A 7 deposition of closely spaced LAGs in a nearly avascular LBZ has started
7-8 14-15 63.5 cm ts, ps, fs
SMNS F 29 A (left) 8 deposition of closely spaced LAGs in a nearly avascular LBZ has started
10 18 ca. 72.0 cm ts, ps, fs
SMNS F 8 11 not visible in the fracture surface
5 16 74.0 cm fs
IFG compactus 12 relative closely spaced LAGs, but still in a FBLC
15 15 74.0 cm t, p
SMNS F 48-1 5 growth continued with FBLC
9 14 76.0 cm & 77.5 cm
ts, ps, fs
SMNS F 27 11 cycle distance becomes closer, but still FBLC
8-9 19-20 81.0 cm ts, ps
IFG, exhibition 10 LZB in a nearly avascular tissue
14 24 99.0 cm ts, ps
As table 7 shows, the femur samples represent a wide size range from small to large
individuals. However, no individuals with a femur length of less than 50.0 cm were sampled.
Only two specimen are from Frick, and both belong to individuals with a femur length smaller
than 60 cm but both show a clear growth stop in the outer cortex.
76
Individuals with a femur length of 50.0 cm (right, SMNS F 29, figure 8), 59.5 cm
(right, SMNS F 29), 74.0 cm (left, IFG compactus, figure 14A), 77.5 cm (left, SMNS F 48),
and 81.0 cm (left, SMNS F 27, figure 14B) were still rapidly growing as indicated by
“normally” vascularized fibro-lamellar bone. Nevertheless, in some other samples already a
decrease in vascular density can be observed, which indicates that a growth decrease was
initiated. Some individuals had clearly stopped growth, indicated by deposition of nearly or
completely avascular lamellar-zonal bone. This growth stop is preserved in individuals with a
femur length of 56.5 cm (right, NAA F 88/B-130, figure 14D), 59.0 cm (left,
unnumbered/Frick), 63.5 cm (left, SMNS F 14), 72.0 cm (left, SMNS F 29), and 99.0 cm
(left, IFG, figure 14C).
Some femora (right, 50 cm, SMNS F 29; left, 74.0 cm, IFG; left, 77.5 cm, SMNS F
48) show fast growth with fibro-lamellar bone at least up to total LAG 14. After that, growth
often starts to decrease and stops completely in some femur samples (right, 56.5 cm, F 88-
B130; right, 59.5 cm, SMNS F 29A; left, 99 cm, IFG) at around total LAG 18/19. One femur
sample (left, 81 cm, SMNS F 27) continued growth with fibro-lamellar bone to about total
LAG 19/20, and another two samples (left, 59 cm, unnumbered Frick; left, 63.5 cm, SMNS F
14) had already stopped growth around total LAG 12 and 14/15.
To summarize, Plateosaurus engelhardti femora grew with high rates up to around the
15th total growth cycle. They show at this point a broad size range. Afterwards, growth rate
decreases and growth stops finally in most individuals after total growth cycle 19/20. After
growth had stopped, Plateosaurus engelhardti individuals continued to live for several years,
like femur IFG 99.0 cm shows. This individual reached its full body size of around ten meters
after visible LAG 5 which corresponds with the total LAG 19. Five closely spaced LAGs
deposited in lamellar-zonal bone mark the life span after rapid growth had stopped. An
important point is that the femur samples indicate clearly that growth stopped or slowed down
at variable body sizes.

77
Figure 8: 8A: Fracture surface and drawing of right femur SMNS F 29 (~50 cm).
Arrows mark the visible LAGs (Note: some LAGs are not visible at the present
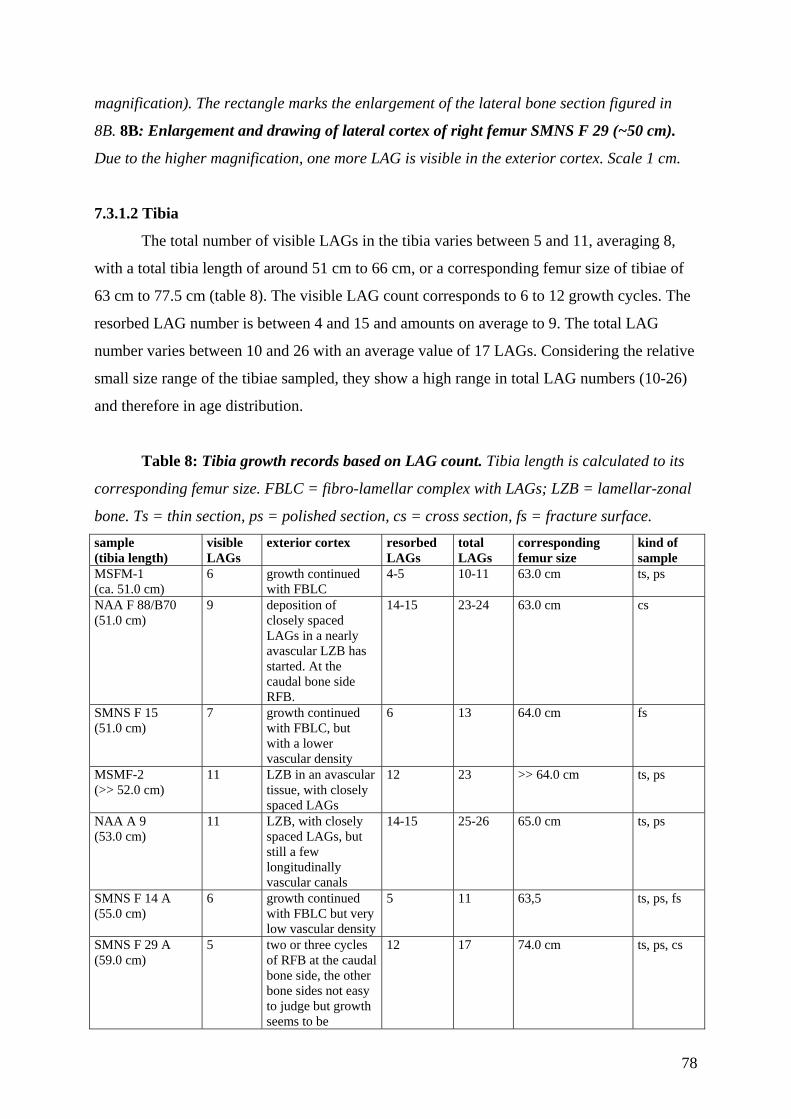
78
magnification). The rectangle marks the enlargement of the lateral bone section figured in
8B. 8B: Enlargement and drawing of lateral cortex of right femur SMNS F 29 (~50 cm).
Due to the higher magnification, one more LAG is visible in the exterior cortex. Scale 1 cm.
7.3.1.2 Tibia
The total number of visible LAGs in the tibia varies between 5 and 11, averaging 8,
with a total tibia length of around 51 cm to 66 cm, or a corresponding femur size of tibiae of
63 cm to 77.5 cm (table 8). The visible LAG count corresponds to 6 to 12 growth cycles. The
resorbed LAG number is between 4 and 15 and amounts on average to 9. The total LAG
number varies between 10 and 26 with an average value of 17 LAGs. Considering the relative
small size range of the tibiae sampled, they show a high range in total LAG numbers (10-26)
and therefore in age distribution.
Table 8: Tibia growth records based on LAG count. Tibia length is calculated to its
corresponding femur size. FBLC = fibro-lamellar complex with LAGs; LZB = lamellar-zonal
bone. Ts = thin section, ps = polished section, cs = cross section, fs = fracture surface. sample (tibia length)
visible LAGs
exterior cortex resorbed LAGs
total LAGs
corresponding femur size
kind of sample
MSFM-1 (ca. 51.0 cm)
6 growth continued with FBLC
4-5 10-11 63.0 cm ts, ps
NAA F 88/B70 (51.0 cm)
9 deposition of closely spaced LAGs in a nearly avascular LZB has started. At the caudal bone side RFB.
14-15 23-24 63.0 cm cs
SMNS F 15 (51.0 cm)
7 growth continued with FBLC, but with a lower vascular density
6 13 64.0 cm fs
MSMF-2 (>> 52.0 cm)
11 LZB in an avascular tissue, with closely spaced LAGs
12 23 >> 64.0 cm ts, ps
NAA A 9 (53.0 cm)
11 LZB, with closely spaced LAGs, but still a few longitudinally vascular canals
14-15 25-26 65.0 cm ts, ps
SMNS F 14 A (55.0 cm)
6 growth continued with FBLC but very low vascular density
5 11 63,5 ts, ps, fs
SMNS F 29 A (59.0 cm)
5 two or three cycles of RFB at the caudal bone side, the other bone sides not easy to judge but growth seems to be
12 17 74.0 cm ts, ps, cs

79
continued with FBLC
SMNS F 48-2 (66.0cm)
7-8 growth continued with FBLC
7 14-15 77.5 cm fs
As table 8 shows, the tibia samples derive only from medium-sized individuals. Fifty
percent of the tibia samples are from Frick. As mentioned before these, individuals are
generally smaller than the Trossingen individuals. The Frick tibiae all belonged to the same
size class, between 51 to 53 cm, corresponding to a femur size between 63 cm and 65 cm.
Nevertheless, one of these tibiae shows continued growth with laminar fibro-lamellar bone,
whereby the others of the same size had dramatically decreased or stopped growth. In the
Trossingen samples, growth had decreased in one relatively small tibia, but the other tibiae
continued growth, including the largest one (right, 66 cm, SMNS F 48-2). Thus, there are
individuals of around 6.30 m to 6.50 m in which growth had decreased greatly after a total
LAG number of 23/24 (right?, 51 cm, NAA F88/B70), 22 (left, 52 cm, MSFM-2, figure 14F),
and 22/23 (right, 53 cm, NAA A9). Tibia MSFM-2 had deposited, after growth had stopped,
two more LAGs, and tibia NAA A9 three more LAGs. On the other hand, there are tibiae of
about the same size in which growth continued with laminar fibro-lamellar bone at a total
LAG number of 10/11 (right, 51 cm, MSFM-1), 11 (right, 55 cm, SMNS F 14, figure 14E)
and 13 (right, 51 cm, SMNS F 15, figure 9). The larger tibiae, belonging to individuals of
around 7.40 m and 7.75 m, also continued growth with laminar fibro-lamellar bone at a total
LAG number of 17 (left, 59 cm, SMNS F 29A) and 14/15 (right, 66 cm, SMNS F 48-2).
There are thus individuals of around 6,5 m body length which show fibro-lamellar
bone up to the 20 and 23 LAG followed by lamellar-zonal bone and a dramatically growth
rate decrease in some specimens. In other individuals growth continued at a size of 6.40 m
(right, 55 cm, SMNS F 14A; right, 51 cm, SMNS F 15), 7.40 m (left, 59 cm, SMNS F 29A),
and 7.75 m (right, 66 cm, SMNS F 48-2) and a LAG number of 11, 13, 17, and 14/15. These
examples show a significant lower LAG number at a clearly greater body length. Therefore,
the tibia samples indicate that growth stopped at variable final sizes in Plateosaurus
engelhardti.
Unfortunately, none of the really large individuals are represented by a tibia. The
tibiae that grew to larger sizes show a generally lower total LAG number and they may have
reached their maximum size around the same time, at around LAG 23, as the smaller
individuals.

80
Figure 9: 9A: Fracture surface and drawing of right tibia SMNS F 15 (51 cm).
Arrows mark the visible LAGs (Note: some LAGs are not visible at the present
magnification). The rectangle marks the enlargement of the lateral bone section figured in
9B. 9B: Enlargement and drawing of cranial cortex of right tibia SMNS F 15 (51 cm).
Scale 1 cm.

81
7.3.1.3 Fibula
Fibulae were only sampled among the Trossingen material and only in fracture
surfaces. These samples offer not as much detail as cross- polish-, and thin sections.
Nevertheless, is clear that the fibulae possess the same histology as the other long bones, but
counting LAGs is more difficult, and not all may have been identified, predominately in the
exterior cortex. Thus, it is possible that the visible LAG number is generally to low.
Additionally, in the fibula samples no growth stop could be identified, due to the lack of
clearly visible lamellar-zonal bone in the exterior cortex. However, in some samples a clear
decrease of vascular density in the fibro-lamellar bone is observable.
The total count of visible LAGs in fibula samples varies between 4 and 8, averaging 6
LAGs. The size range of the sampled fibula is between 46.5 cm to 59.0 cm, corresponding to
a femur size of around 58 cm to 77.5 cm (table 9). The visible LAG count corresponds to 5 to
9 growth cycles. The resorbed LAG number is between 5 and 15 and amounts on average to
8. The total LAG number varies between 12 and 20 with an average value of 14 LAGs.
Table 9: Fibula growth records based on LAG count.. Fibulae length is calculated to
its corresponding femur size. FBLC = fibro-lamellar complex with LAGs; LZB = lamellar-
zonal bone. Fs = fracture surface. sample (fibula length)
visible LAGs
exterior cortex resorbed LAGs
total LAGs
corresponding femur size
kind of sample
SMNS F 29 B (46.5 cm)
7 very low vascularized FBLC
6 13 58.0 cm fs
SMNS F 14 (52.5 cm)
6-7 growth continued with FBLC, but vascular density starts to decrease
6 11-12 63,5 cm fs
SMNS F 15 (53.0 cm)
5-6 low vascularized FBLC
10 15-16 66.0 cm fs
SMNS F 29 B (57.5 cm)
4-5 low vascularized FBLC
15 19-20 72.0 cm fs
SMNS F 8 (59.0 cm)
7-8 very low vascularized FBLC
6 13-14 74.0 cm fs
SMNS F 48 (ca. 59.0 cm)
7-8 difficult to judge: in some areas growth seems to have stopped, in others growth seems to have continued with FBLC but low vascularization.
5 12-13 77.5 cm fs
As table 9 shows, the fibula samples represent medium-sized individuals which also
have intermediate total LAG numbers. A possible growth decrease or stop is not well seen
due to insufficient resolution of the images. All sampled fibula seems to have continued

82
Figure 10: 10A: Fracture surface and drawing of right ? fibula SMNS F 8 (~59
cm). Arrows mark the visible LAGs (Note: some LAGs are not visible at the present
magnification). The rectangle marks the enlargement of the lateral bone section figured in
10B. 10B: Enlargement and drawing of cranio-lateral cortex of right ? fibula SMNS F 8
(~59 cm). Scale 1 cm.

83
growth with the laminar fibro-lamellar bone, but with a clearly decreasing vascular
density in the outer cortex, which may foreshadow a bone tissue change. A total LAG number
of 13 is relatively frequent. This total LAG number is shown by the smallest specimen (left,
46.5 cm, SMNS F 29 B), by a medium-sized fibula (right, 63.5 cm, SMNS F 14), as well as
by the largest specimen (right?, 59 cm, SMNS F 8, figure 10; right, 59 cm, SMNS F 48). Two
other medium-sized fibula show a somewhat (right, 53 cm, SMNS F 15: 15/16) and a
significantly (left, 57.5 cm, SMNS F 29 B: 19/20) higher total LAG number without a clear
cessation of growth. To generalize, growth in the fibula continued with laminar fibro-lamellar
bone at least somewhat after LAG 13. Then growth decrease is initiated and growth stops
around LAG 19/20 or slightly later.
The highest total LAG number (19-20) is shown by a fibula which belonged to a medium to
large individual of 7.2 m body length (left, 57.5 cm, SMNS F 29 B).
7.3.1.4 Humerus
The total count of visible LAGs in humerus samples varies between 4 and 10, it
amounts in average 7, with a total length of humerus ranging between 41 cm to 53 cm. The
humerus length corresponds with a calculated femur length from around 63.5 cm to 85.0 cm
in length (table 10). The resorbed LAG number is between 3 and 13 and amounts in average 7
to 8. The total LAG number varies between 7 and 20 LAGs with an average value of 15
LAGs. This total LAG count corresponds to 8 and 21 growth cycles.
The size range of the humeri is relative great, at least based on corresponding femur
size. Medium-sized individuals are represented as well as one large individual. Except for
sample NAA F 88/B640 (figure 11), which had stopped growth and changed its bone tissue
from laminar fibro-lamellar into lamellar-zonal bone, growth had continued with laminar
fibro-lamellar bone in all other samples, although in some with a clearly decreasing vascular
density. The samples SMNS F 14A (left, 41 cm), SMNS F 29A (left, 43.5 cm), and SMNS F
61B (right, 43.5 cm) were only studied in fracture surfaces. Thus, it is well possible that a
growth decrease had been initiated in some of these samples but remains undetected.
Humerus NAA F 88/B640 (right, 44.5 cm) belongs to a medium-sized individual of
around 6.5 m body length which had stopped growth after total LAG 14, with deposition of
closely spaced LAGs in the outermost cortex continuing to total LAG 18. Another medium-
sized humerus (left, 41 cm, SMNS F 14 A) shows a total LAG number of 19/20. In the
fracture surface a clearly decreased vascular density can be observed, and the exterior cortex
seems to be nearly avascular. Thus, maybe a bone tissue change had been initiated.
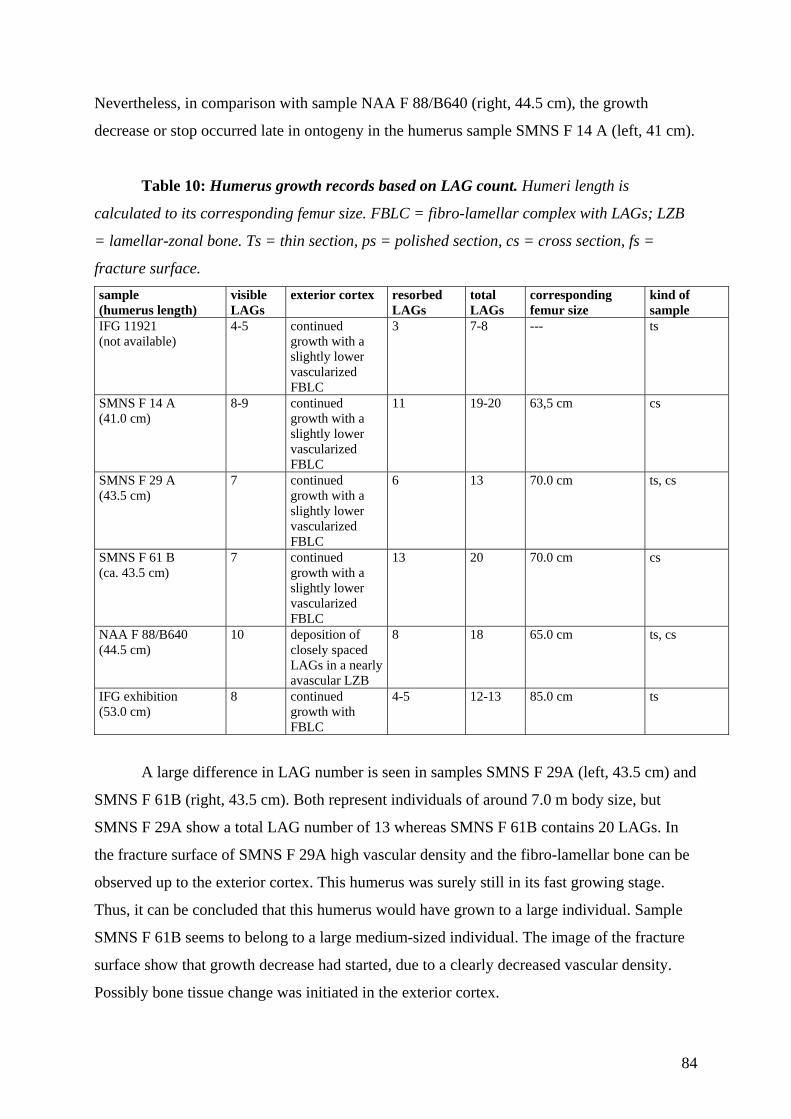
84
Nevertheless, in comparison with sample NAA F 88/B640 (right, 44.5 cm), the growth
decrease or stop occurred late in ontogeny in the humerus sample SMNS F 14 A (left, 41 cm).
Table 10: Humerus growth records based on LAG count. Humeri length is
calculated to its corresponding femur size. FBLC = fibro-lamellar complex with LAGs; LZB
= lamellar-zonal bone. Ts = thin section, ps = polished section, cs = cross section, fs =
fracture surface. sample (humerus length)
visible LAGs
exterior cortex resorbed LAGs
total LAGs
corresponding femur size
kind of sample
IFG 11921 (not available)
4-5 continued growth with a slightly lower vascularized FBLC
3
7-8 --- ts
SMNS F 14 A (41.0 cm)
8-9 continued growth with a slightly lower vascularized FBLC
11 19-20 63,5 cm cs
SMNS F 29 A (43.5 cm)
7 continued growth with a slightly lower vascularized FBLC
6 13 70.0 cm ts, cs
SMNS F 61 B (ca. 43.5 cm)
7 continued growth with a slightly lower vascularized FBLC
13 20 70.0 cm cs
NAA F 88/B640 (44.5 cm)
10 deposition of closely spaced LAGs in a nearly avascular LZB
8 18 65.0 cm ts, cs
IFG exhibition (53.0 cm)
8
continued growth with FBLC
4-5 12-13
85.0 cm ts
A large difference in LAG number is seen in samples SMNS F 29A (left, 43.5 cm) and
SMNS F 61B (right, 43.5 cm). Both represent individuals of around 7.0 m body size, but
SMNS F 29A show a total LAG number of 13 whereas SMNS F 61B contains 20 LAGs. In
the fracture surface of SMNS F 29A high vascular density and the fibro-lamellar bone can be
observed up to the exterior cortex. This humerus was surely still in its fast growing stage.
Thus, it can be concluded that this humerus would have grown to a large individual. Sample
SMNS F 61B seems to belong to a large medium-sized individual. The image of the fracture
surface show that growth decrease had started, due to a clearly decreased vascular density.
Possibly bone tissue change was initiated in the exterior cortex.
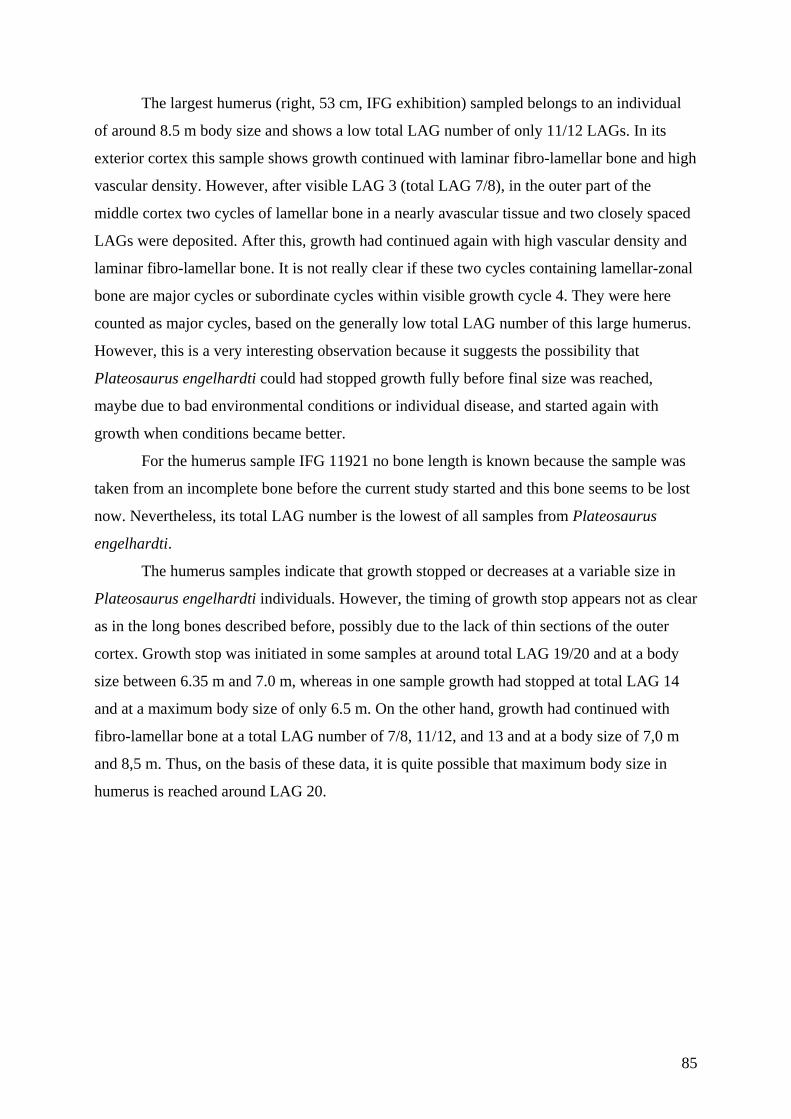
85
The largest humerus (right, 53 cm, IFG exhibition) sampled belongs to an individual
of around 8.5 m body size and shows a low total LAG number of only 11/12 LAGs. In its
exterior cortex this sample shows growth continued with laminar fibro-lamellar bone and high
vascular density. However, after visible LAG 3 (total LAG 7/8), in the outer part of the
middle cortex two cycles of lamellar bone in a nearly avascular tissue and two closely spaced
LAGs were deposited. After this, growth had continued again with high vascular density and
laminar fibro-lamellar bone. It is not really clear if these two cycles containing lamellar-zonal
bone are major cycles or subordinate cycles within visible growth cycle 4. They were here
counted as major cycles, based on the generally low total LAG number of this large humerus.
However, this is a very interesting observation because it suggests the possibility that
Plateosaurus engelhardti could had stopped growth fully before final size was reached,
maybe due to bad environmental conditions or individual disease, and started again with
growth when conditions became better.
For the humerus sample IFG 11921 no bone length is known because the sample was
taken from an incomplete bone before the current study started and this bone seems to be lost
now. Nevertheless, its total LAG number is the lowest of all samples from Plateosaurus
engelhardti.
The humerus samples indicate that growth stopped or decreases at a variable size in
Plateosaurus engelhardti individuals. However, the timing of growth stop appears not as clear
as in the long bones described before, possibly due to the lack of thin sections of the outer
cortex. Growth stop was initiated in some samples at around total LAG 19/20 and at a body
size between 6.35 m and 7.0 m, whereas in one sample growth had stopped at total LAG 14
and at a maximum body size of only 6.5 m. On the other hand, growth had continued with
fibro-lamellar bone at a total LAG number of 7/8, 11/12, and 13 and at a body size of 7,0 m
and 8,5 m. Thus, on the basis of these data, it is quite possible that maximum body size in
humerus is reached around LAG 20.

86
Figure 11: 11A: Fracture surface and drawing of right humerus NAA F88/B640
(44.5 cm). Arrows mark the visible LAGs (Note: some LAGs are not visible at the present
magnification). The rectangle marks the enlargement of the lateral bone section figured in
11B. 11B: Enlargement and drawing of cranio-medial cortex of right humerus NAA
F88/B640 (44.5 cm). Scale 1 cm.

87
7.3.1.5 Scapula
The total count of visible LAGs in the scapula samples varies between 5 and 11, on
average 7, with total scapula length ranging from 36.5 cm to 49.5 cm. The scapula length
corresponds with a calculated femur length of around 48 cm to 73 cm (table 11). This LAG
count corresponds to 6 and 12 growth cycles. The resorbed LAG number is between 3 and 10,
with an average value of 6 LAGs. The total LAG number varies between 8 and 18 with an
average total LAG number of 13 LAGs. This corresponds with 9 to 19 growth cycles.
Table 11: Scapula growth records based on LAG count. Scapula length is calculated
to its corresponding femur size. FBLC = fibro-lamellar complex with LAGs; LZB = lamellar-
zonal bone. Ts = thin section, ps = polished section, cs = cross section, fs = fracture surface. sample (scapula length)
visible LAGs
exterior cortex resorbed LAGs
total LAGs
corresponding femur size
kind of sample
MSFM (36.5 cm)
11 closely spaced LAGs in LZB
5-6 16-17
48.0 cm ts, ps
NAA (>> 39.0 cm)
8 closely spaced LAGs, in LZB but still low vascularization available
10 18 51.0 cm cs
SMNS F 29 (>> 42.0 cm)
5 continued growth 3 8 >>62.0 cm cs
SMNS F 14 B (47.0 cm)
6 the last two LAGs were deposited little closer, still a few vascular canals
8-9 14-15
63.5 cm ts, ps, fs
SMNS F 29 B (48.0 cm)
7 continued growth 3-4 10-11 71.0 cm ts, ps, fs
SMNS F 29 A (49.5 cm)
5 continued growth 5-6 11-12 73.0 cm ts, ps
In spite of a relative small medullary cavity, the remodeling zone in the scapulae is
broad and active and sometimes half of the primary cortex is remodelled. In comparison to the
long bones and the pubis, scapula samples therefore show an intermediate resorbed LAG
number. Due to its combination of bone tissues, the scapula, although a flat bone, takes up an
intermediate position between long bones and the pubis. This is expressed by a lower visible
LAG number and a higher resorbed and therefore total LAG number in contrast to the pubis
samples. Thus, the scapula grows not as slowly as the pubis, but also not as fast as femur,
tibia, fibula, and humerus. The size range of scapula is relatively great, representing small to
medium-sized individuals. As the other bones, small scapulae can show high total LAG
numbers and large ones lower or similar LAG numbers as the small scapulae samples.
The scapula samples MSFM (left, 36.5 cm) and NAA (right?, 39 cm) contain a few
closely deposited LAGs in an avascular bone tissue in the exterior cortex which indicates a

88
complete growth stop at 4.8 m and 5.1 m body length. The total LAG number in these
samples is 16/17 and 18. Growth had decreased strongly after total LAG 14/15 (MSFM, left,
36 cm) and after LAG 16 (NAA, right?, 39 cm). The samples from Trossingen belong to
larger individuals, and only in sample SMNS F 14B (right, 47 cm), a growth decrease had
been initiated, at a total LAG number of 13/14 and a body size of 6.35 m. The samples SMNS
F 29 (left, 42 cm), SMNS F 29 B (left, 48 cm, figure 12), and SMNS F 29A (left, 49.5 cm)
would have continued to grow with a total LAG number of 8, 10/11, and 11/12 and a body
size of >> 6.2 m, 7.1 m, and 7.3 m at the time of death.
The scapulae from Trossingen represent medium-sized individuals. Very large
individuals are not documented in the scapulae from Trossingen. At around 5 m, the scapulae
from Frick represent very small individuals when growth had stopped. In the scapula samples,
it is conspicuous that the larger individuals have a generally lower total LAG number in
comparison to smaller individuals.
medullary region
lateral
median
dorsal
ventral

89
Figure 12: 12A: Fracture surface and drawing of left scapula SMNS F 29 B (48
cm). Arrows mark the visible LAGs (Note: some LAGs are not visible at the present
magnification). The rectangle marks the enlargement of the lateral bone section figured in
12B. 12B: Enlargement and drawing of ventral cortex of left scapula SMNS F 29 B (48
cm). Scale 1 cm.
7.3.1.6 Pubis
The size range differences and the range of LAG numbers are very low in the sampled
pubes. The total count of visible LAGs in pubis samples varies between 9 and 11, and it
amounts on average to 10. Pubes size range is between 48 cm to 53,5 cm. These pubes length
corresponds to a calculated femur length of around 59 cm to 66 cm (table 12). The resorbed
LAG number is between 2 and 4 and amounts on average to 3. The total LAG number varies
between 11 and 13 LAGs with an average value of 13 LAGs. This total LAG count
corresponds to 12 to 14 growth cycles.
Among the studied bones, the slowest growing bone in the skeleton of P. engelhardti
is the pubis due to its purely lamellar-zonal bone tissue. The pubis shows the lowest resorbed
LAG number, whereas the visible LAG count is the highest in all bones. The total LAG
number is low to intermediate in comparison with the long bones. This also fits well with the
observed small medullary region in pubis samples, at least at the lateral bone side. Thus, it

90
can be assumed that the growth record in the pubis is the most realistic and complete of all P.
engelhardti bones.
Table 12: Pubis growth records based on LAG count. Pubis length is calculated to
its corresponding femur size. First decrease indicates possible onset of maturity. The number
in parentheses indicates the total LAG number of this first decrease. FBLC = fibro-lamellar
complex with LAGs; LZB = lamellar-zonal bone. Ts = thin section, ps = polished section, cs
= cross section, fs = fracture surface. sample (pubis length)
visible LAGs
first decrease
exterior cortex resorbed LAGs
total LAGs
corresponding femur size
kind of sample
NAA pubis (without No.) (not available)
11 6 (8)
closely spaced LAGs, but with low vascularization
2 13 --- ts, ps
SMNS F 29 (48.0 cm)
10 6 (8-9)
closely spaced LAGs, but with low vascularization
2-3 12-13 59.0 cm cs
SMNS F 14 B (50.0 cm)
9 5 (9)
closely spaced LAGs in an avascular tissue
4 13
63.5cm ts, ps, fs
SMNS F 29 B (right, 52.5 cm)
10 6 (9)
closely spaced LAGs, in an avascular tissue
3 13
65.0 cm ts, ps
SMNS F 29 B (left, 53.5 cm)
9 6 (8)
closely spaced LAGs in a partially avascular tissue
2 11
66.0 cm ts, ps, fs
As table 12 shows, the pubis samples represent only medium-sized individuals
between 5.9 and 6.6 m body length. LAGs are always relatively closely, due to the thin
cortex, and no bone tissue change is present because only still vascularized lamellar-zonal
bone was deposited in pubes. However, in the samples SMNS F 14B (left, 50 cm) and SMNS
29B (right, 52.5 cm), the LAGs were deposited in an avascular tissue, indicating that these
two samples had stopped growth. Growth decrease was initiated in both specimen after total
LAG 9, and the total LAG numbers at time of death amounts to 13 in both samples. In
addition, sample SMNS F 29B (left, 53.5 cm, figure 13) and sample NAA (without No.) show
at least a partially avascular tissue, respectively a clear decrease in vascular density in the
exterior cortex, so growth stop was initiated at a total LAG number of 11 and 13. Only sample
SMNS F 29 (left, 48 cm) had continued with slow growth, but vascular density had already
decreased at a total LAG number of 12/13. Thus, on the basis of the pubis samples, maximum
size is detected at between 6.35 m and 6.5 m body length, due to a clear growth stop there. At

91
9 LAGs, the total LAG number when growth definitively had stopped is conspicuous lower as
in the long bone samples.
The other pubes also show a decreased vascular density around the same total LAG
number. It cannot be detected, due to the lamellar-zonal bone tissue and a generally low
vascular density in pubis, if slow growth continued or if they would have stopped growth
soon. The comparison of the pubes data with that of the long bones is difficult because the
resorbed LAG number in long bones is generally overestimated as result of their large
medullary cavities. Thus, the extrapolated LAG number seems to be more realistic in pubes.
medullary region
dorsal
ventral
lateralmedian

92
Figure 13: 13A: Fracture surface and drawing of left pubis SMNS F 29 (48 cm).
Arrows mark the visible LAGs (Note: some LAGs are not visible at the present
magnification). The rectangle marks the enlargement of lateral bone section figured in 13B.
13B: Enlargement and drawing of lateral cortex of left pubis SMNS F 29 (48 cm). Scale 1
cm.
7.3.1.7 Other bones
Table 13: Growth record on the basis of the LAG count in various other bones.
FBLC = fibro-lamellar complex with LAGs; LZB = lamellar-zonal bone.Ts = thin section, ps
= polished section, cs = cross section, fs = fracture surface. sample visible
LAGs resorbed LAGs
total LAGs
exterior cortex kind of sample
vertebra IFG RW 12
7 7-8 14-15 a thick layer of RFB in the outer cortex
ts, ps
vertebra IFG RW 14
7 2-3 9-10 bone surface is partially disturbed but the visible tissue shows no indications of a decrease in growth, in contrast the exterior most growth cycle is more highly vascularized than the inner ones
ts, ps
rib SMNS F 29
5-6 7-8 12-14 the outer cortex consist of closely deposited LAGs, but it is still high vascularized with longitudinal canals
cs
rib 4-5 makes no not closely deposited LAGs in lamellar- ts, ps

93
F88/738 sense possible zonal tissue rib F88/738
not possible
makes no sense
not possible
remodeled ts, ps
foot phalange IFG 8159
5-6 makes no sense
not possible
closely deposited LAGs in lamellar-zonal tissue
ts, ps
ischium SMNS F 27
3 7-8 10-11 thick layer of RFB in the exterior cortex
fs
7.3.1.7.1 Vertebrae
Growth cycles are clear in the vertebrae, and each ends in a LAG. Zones and annuli
are not as clearly set off as in other bones sampled. The vascularization is generally high, but
decreases clearly within each growth cycle and from the inner to the outer cortex. Growth
cycle thickness also decreases gradually from the inner to the outer cortex. In both samples, 7
LAGs are visible (IFG RW 12, fig. 14G).
7.3.1.7.2 Ribs
In the rib, growth cycle thickness is generally low and decreases little from the inner to
the outer cortex. At least 5-6 LAGs are visible, and extrapolation suggests a total LAG count
of around 12-15, depending on bone side (fig. 14H).
The two samples of ribs from the Frick locality show similar features, and only in the
exterior cortex around 4-5 LAGs can be counted. The LAGs are closely spaced and developed
in a nearly avascular lamellar-zonal tissue. The more distal rib sample preserves no growth
marks due to high remodeling.
7.3.1.7.3 Ischia
Only the lateral part of the ischia shows limited remodeling, and a relative good
growth record is present with 3 clear LAGs. Extrapolation suggests a total of 10-11 LAGs, or
11-12 growth cycles.
7.3.1.7.4 Foot phalange
Only in the exterior cortex, where the primary bone tissue is lamellar-zonal, closely
spaced LAGs are seen. Around 5 to 6 LAGs can be counted (fig. 14I).

94
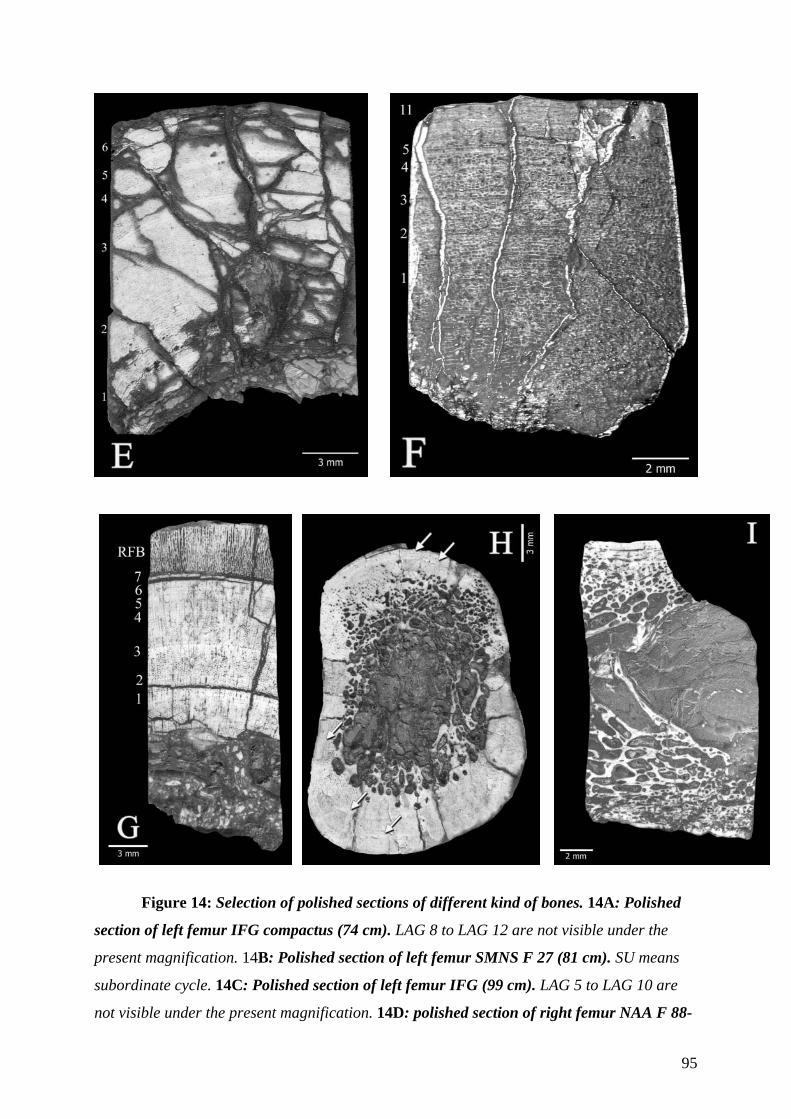
95
Figure 14: Selection of polished sections of different kind of bones. 14A: Polished
section of left femur IFG compactus (74 cm). LAG 8 to LAG 12 are not visible under the
present magnification. 14B: Polished section of left femur SMNS F 27 (81 cm). SU means
subordinate cycle. 14C: Polished section of left femur IFG (99 cm). LAG 5 to LAG 10 are
not visible under the present magnification. 14D: polished section of right femur NAA F 88-

96
B130 (56.5 cm). 14E: Polished section of left tibia SMNS F 14 A (55.0 cm). 14F: polished
section of left tibia MSFM-2 ( 52.0 cm). LAG 6 to LAG 10 are not visible under the present
magnification. 14G: polished section of vertebra IFG RW 12. Note the thick layer of RFB in
the outermost cortex. 14H: cross section of the median part of a rib (SMNS F 29). The
arrow at the left side marks an area with dense lamellar-zonal bone with several LAGs
deposited. 14I: polished section of a foot phalange (IFG 8159). No growth cycles are visible
under the current magnification. Numbers mark visible LAGs.
7.3.2 Single individuals sampled by several bones
Skeletochronological correlation between different bone types is always an interesting
thing due to varying growth rates and varying activities of the medullary cavity in the
different kind of bones during ontogeny. An additional source of error is the determination of
LAG numbers for the single bones. It thus is not easy to reconstruct the growth history of a
single individual on the basis of several bones. The results of such a study, mainly time data
given in years, should always be seen as approximation and not as an exact value.
Two individuals from the Trossingen locality were sampled from several bones (table
14). Individual SMNS F 14 is represented by six bones: a femur, a tibia, a fibula, a humerus, a
scapula, and a pubis. Individual SMNS F 48 is represented by three bones: a femur, a tibia,
and a fibula. Probably a left and a right pubis of find SMNS F 29 B also belong to a single
individual, due to their similar size and shape. The bones and their histology have already
been considered in previous sections, namely those covering the analysis of the single bones.
In the following section, the main focus lies on how the growth record of the single bones fits
together to yield the growth record of a single individual.
7.3.2.1 SMNS F 14
On the basis of its isolated position in the quarry (unpublished field notes of
SEEMANN, stored in the SMNS) and due to the proportions and form of the bones, find SMNS
F 14 belongs to a single individual. The femur length amounts 63.5 cm, which indicates a
medium-sized individual in the Trossingen population.
Although only the femur sample shows a clear growth stop in its exterior cortex, as
indicated by the beginning of deposition of lamellar-zonal bone, the other sampled long bones
of SMNS F 14 also show a clear decrease of vascular density within the laminar fibro-
lamellar complex of the outer cortex, but no lamellar-zonal bone was deposited. The scapula
shows high vascular density up to the bone surface, and only at the lateral side a slight

97
decrease in vascular density can be observed. The pubis shows in its exterior cortex
that growth had nearly stopped, indicated by nearly avascular bone tissue. All together, the
growth record of all bones indicate that this individual had undergone a clear growth
decrease, respectively growth stop, and had therefore nearly reached its final size. However,
the differences in histology mean that bones of a single individual not only grew at different
growth rates but also stopped growing in diameter at a varying time.
Table 14: LAG counts in different bones of the single individuals SMNS F 14,
SMNS F 29B, and SMNS F 48. sample visible LAGs resorbed LAGs total LAGs
SMNS F 14 femur length: 63.5 cm
femur 7 7-8 14-15
tibia 6 5 11
fibula 6-7 6 12-13
humerus 8-9 11 19-20
scapula 6 8-9 14-15 pubis 9 4 13
SMNS F 48 femur length: 77.5 cm
femur 5 9 14 tibia 7-8 7 14-15 fibula 7-8 5 12-13
SMNS F 29 corresponding femur length: ca. 65.5 cm
pubis F29 B (right)
10 3 13
pubis F 29 B (left)
9 2 11
The visible LAG number varies not much in the bones of individual SMNS F 14,
being between 6 and 9 LAGs. In addition, the observed growth decrease or stop in the exterior
cortex occurs in all sampled bones quite consistently after visible LAG 5. But when the
resorbed LAG number is added, differences in the total LAG number between the bones
result, due to the various sources of error discussed earlier.
Thus, the total LAG number for this individual lies between 11 and 20. Most frequent
are total LAG count of 13 to 15, but at a total LAG number of 11, the tibia shows as well as
the humerus, at a total LAG number of 19-20, a great deviation from this average. Growth
stop was initiated between total LAG 9 to 13/14. The onset of sexual maturity is possibly
recorded by the growth decrease in the pubis after total LAG 9.

98
To summarize, it is hypothesized that on the basis of the majority of values, this
individual grew at high rates up to around its 12th year of age. Afterwards growth started to
decrease significantly. The individual stopped growing completely after the 15th year (figure
15).
The maximum possible age for this individual is suggested in the humerus at around
20/21 years. This is in strong contrast to the pubis growth record with the maximum LAG
number amounting to only 13. This discrepancy is again the result of an overestimated
resorbed LAG number in the long bones. More realistic is the total LAG number of the pubis.
Using the resorbed LAG number of the pubis (4 resorbed LAGs) for the other bones the total
LAG number ranges only between 10 and 13. Note that than the pubis shows the highest total
LAG number. As different growth patterns of each single bone must take into account, it
seems unlikely to get the exact same total LAG number for all bones.
7.3.2.2 SMNS F 48
Again on the basis of its isolated position in the quarry (unpublished field notes of
SEEMANN, stored in the SMNS) and due to the proportion and form of the bones,
find SMNS F 48 belonged to a single individual. The length of the femora is 76.0 cm (right),
respectively 77.5 cm (left), representing a fairly large individual.
In the femur, tibia, and fibula of SMNS F 48, growth had continued with
laminar fibro-lamellar bone up to death. It thus can be concluded that this individual had not
reached its maximum size and would have continued growth. The differences between the
visible LAG numbers in the different bones are relatively high. In the femur, there are only 5
visible LAGs, but in the tibia and fibula, 7-8 are visible. However, the total LAG
number is less variable and amounts in all three sampled bones to between 13 and 15 LAGs,
suggesting an age at death of about 16 years (figure 15). The less variable total LAG count
here can possibly be explained by the relatively wide visible growth cycles of this still fast
growing individual. Maybe an indication for an relatively younger individual where
extrapolation did not result in such an overestimate as in other/older specimens.
7.3.2.3 SMNS F 29
Find SMNS F 29 is composed of mainly left body sides of at least three
individuals. Due to the proportion and form, a left and a right pubis are assumed to belong to
a single individual. Unfortunately, no other elements of this individual can be identified. The
corresponding femur length for the pubes amounts to around 66 cm, indicating a medium-

99
SMN
S F
48
77.5
cm
SMN
S F
29
66 c
mSM
NS
F 14
, oth
er b
ones
63.
5 cm
SMN
S F
14, p
ubis
63
.5 c
m
size
time
2
4
6
8
10
1
2
14
16
1
8
20
2
2
24
2
6
28
3
0
Figure 15: Average growth curves of individuals SMNS F 14, SMNS F 48, and SMNS F 29.
Note the high variability of growth patterns.
Black line represents fast growth with fibro-lamellar bone, gray line represents slowed down
growth, but still with fibro-lamellar bone, bright line represents growth with lamellar zonal bone.

100
sized individual.
In their exterior cortex both pubes show a clear decrease in growth as indicated by
closely spaced LAGs in a nearly (SMNS F 29 B, right, 52.5 cm), respectively partially
(SMNS F 29B, left, 53.5 cm) avascular bone tissue. Thus it can be concluded that maximum
size was nearly reached and growth had nearly stopped in the pubes.
Visible LAG number differs only by one, and growth decreases in both pubes after
visible LAG 6 which corresponds to total LAG number of 8 and 9, respectively. This is the
most likely time of reaching sexual maturity. Total LAG number differs by two cycles
between the left and right pubis, but considering the possible error sources, this is also not
very much. Thus, the individual from which these two pubes originated had reached its
maximum size of around 6,6 m after 12 to 14 years. Sexual maturity was reached earlier in
life, after the 9th or 10th year (figure 15).
02468
10121416182022242628
40 45 50 55 60 65 70 75 80 85 90 95 100 105
femur length in cm
LA
G n
umbe
r
Figure 16: Femur length plotted against visible and total LAG number. Note that
there is no correlation possible between LAG number and size. Black symbols mark the
visible LAG number, and white symbols mark the total LAG number. Circles represent Frick
specimens, squares the Trossingen specimens. All bones were scaled to their corresponding
femur length.

101
0
5
10
15
20
25
30
0 500 1000 1500 2000 2500 3000 3500 4000 4500
mass estimate in kg
LAG
num
ber
A
2468
10121416182022242628
0 500 1000 1500 2000 2500 3000 3500 4000mass estimation in kg
LAG
num
ber
B
Figure 17: LAG count plotted against mass estimate. 17A: LAG count plotted
against mass estimate only for the femora. 17B: LAG count plotted against mass estimate
for all sampled bones, scaled to their femur length. Mass estimates for the specimens is
based on the mean value for the largest femur (left, 99 cm, IFG exhibition) of data given by
SEEBACHER (2001) and SANDER (1992) (see table 6). Black symbols represent visible LAG
number and white symbols total LAG number. Squares mark the Trossingen specimens, and
circles mark the Frick specimens. All bones scaled to their femur length.

102
7.3.3 Results from LAG count
On the basis of the LAG counts some figures were constructed to check several
questions. In figure 16 and figure 17 visible and total LAG number are plotted against femur
length and mass estimate to see if there is a correlation between LAG number and bone length
or body mass. Figure 18 shows the relationship between deposited bone tissue in the exterior
cortex (= growth stage) and femur length (= body size). In this figure the main difference to
other dinosaurs comes out, that is a very high size range of maximum size.
02468
101214161820222426
45 50 55 60 65 70 75 80 85 90 95 100
femur length in cm
LAG
num
ber
A
02468
10121416182022242628
45 47 49 51 53 55 57 59 61 63 65 67 69
femur length in cm
LAG
num
ber
B

103
Figure 18: Relationship between growth stage and body size. Bones separated in the
categories: „continued growth“, slowed down growth”, and “stopped growth”. Continued
growth means that growth had continued with laminar fibro-lamellar bone, without any
significant growth decrease. Slowed down of growth means that vascular density becomes
very low in the fibro-lamellar complex and bone tissue change was initiated or lamellar-zonal
bones, which is relatively high vascularized, is deposited. Stopped growth means that
lamellar-zonal bone had been deposited with several closely spaced LAGs in avascular bone
tissue in long bones as well as in flat bones .18A: Relationship between growth stage and
body size in Trossingen. 18B: Relationship between growth stage and body size in Frick.
Black symbols represent the visible LAG number, white symbols represent total LAG
numbers. Squares represent continued growth, diamonds slowed down growth, and the circles
stopped growth. All bones scaled to femur length. Note that this distribution represents no
clear line but a very broad range.
8. Discussion
8.1 Qualitative growth record
8.1.1 Varying growth in different bone types during ontogeny
Studying different kind of bones of the skeleton of Plateosaurus engelhardti confirms
that every bone has its own ontogenetic history and therefore its own growth record, as
several authors have concluded before (CASTANET & SMIRINA 1990, RICQLÈS 1983, REID
1990, CHINSAMY 1993). In Plateosaurus bones, this is especially evident in the different
growth speeds of long and flat bones and additionally in the histological differences between
pubis and scapula. Although they both belong to the category flat bone (FRANCILLON-
VIEILLOT et al. 1990), they show different bone tissues and growth rates.
Thus, even bones from single individuals (SMNS F 14, SMNS F 48) show different counts of
lines of arrested growth (table 14, figure 15). Extrapolation of the resorbed LAGs also did not
give a uniform result for these individuals, but the differences are not quite as great. They can
mainly be attributed to a general error of the extrapolation method.
8.1.2 Differences between Frick and Trossingen locality
As mentioned before, in contrast to Trossingen, the locality of Frick contains only
small to small-medium-sized individuals (figure 1), all sampled bones from Frick representing
a size range of between 4.8 m and 6.5 m body length. Most samples had decreased or
completely stopped growth, only one shows continued growth at a size of 6.30 m (figure 18).

104
Thus, the generally smaller size of Frick bones does not represent younger individuals
but the Frick population consists in general of smaller individuals than that in Trossingen.
The maximum size may have been around 6.5 m in Frick, with some individuals having
stopped growth earlier. Maximum size in Trossingen is around 10 m, but most individuals
stay clearly smaller, somewhat around 6.0 m to 7.5 m
Two hypotheses may explain the lack of larger individuals in Frick: Either large
specimens were less common in Frick than in Trossingen, and simply have not been found yet
or the Plateosaurus population from Frick consists beside a basically similar growth strategy
of generally smaller individuals than that from Trossingen. If the population consists
generally of smaller individuals, again two explanations are possible. One is a biological
cause, like a different habitat, or the Frick specimens belonged to a different species then
those from Trossingen.
8.1.3 General patterns and metabolism
The analysis of the histological data results in a contradictory picture of the life history
of Plateosaurus engelhardti. On one hand, Plateosaurus engelhardti grew at least as adult
with the laminar fibro-lamellar complex, representing fast growth similar to that of birds and
mammals, and also to extinct sauropods. But in contrast to sauropods, birds, and mammals,
periods of fast growth were regularly interrupted in Plateosaurus engelhardti throughout the
whole recorded life time by cyclical growth marks, expressed by the regular deposition of
LAGs. This cyclical interruption of growth, together with a lower vascular density and a
smaller distance between the single laminae in the bone tissue compared to birds, mammals,
and sauropods indicates a generally lower growth rate than sauropods and mammals show,
but a higher one in comparison to extant wild reptiles. Like in sauropods, birds, and
mammals, the deposition of lamellar-zonal bone and closely spaced LAGs in the outermost
cortex shows that Plateosaurus engelhardti had determinate growth (SANDER 2000). Indeed,
growth stop occurred at a variable body size and age.
Nevertheless, Plateosaurus engelhardti must have had a relative high metabolic rate to
maintain these periods of fast growth during three-fourth of its ontogeny. Another possibility
is that these periods of fast growth were supported by periods of optimal environmental
conditions in the past. The generally irregular distances between the growth cycles, as well as
small and/or poorly vascularized cycles in the inner/younger cortex and large and/or highly
vascularized cycles in the outer cortex lead to the conclusion that Plateosaurus engelhardti
growth was strongly influenced by environmental factors, similar to extant reptiles. Such
105
environmental factors concern mainly climate and food availability and quality. However,
illness, and starvation or poor quality of food could also affect growth of endotherms.
8.1.4 Sexual dimorphism
CARPENTER (1999) describes use and function of possible sexual display organs and
dinosaur behavior during courtship. Additionally he gave attention to the possibility that
many display structures, like traces of dinosaur skin, are only rarely fossilized (CARPENTER
1999). He also warned against an over-rating of display organs like crests and frills, and
preferred the method of sexing dinosaurs on the basis of the robustness of the skeleton
(CARPENTER 1999). Based on many examples in extant tetrapods, CARPENTER (1999) believes
that in most dinosaurs the more robust form represents the female.
Looking at extant reptiles, no general principle of which sex is the larger one, can be
established. For example, in crocodiles the male is always the larger form, in contrast to
turtles and tortoises where in most taxa (not in all !) females grow generally larger than males.
The sexes of the largest extant lizard, the Komodo monitor (V. komodoensis) are generally of
around the same size, but most females stay smaller than males (AUFFENBERG 1980). Similar
contradictionary patterns are seen in extant birds. While in most raptorial birds the female is
the larger form, males and females of most songbirds are of around the same size. Sex
differences are expressed here predominately in color. In many taxa of large mammals, males
are larger than females, but in smaller mammals, again no size difference occurs.
Sexual dimorphism in dinosaurs documented only by size differences is rare until yet.
The before mentioned histological study of Syntarsus rhodiensis (CHINSAMY 1990) leads to
the conclusion that the robust specimen, which shows erosional cavities possibly formed
during formation of eggshell, represents the female (CARPENTER 1999). Another example is
the increased angle between the ischium and tail (possibly for a better accommodation of the
eggs through the cloaca, CARPENTER 1999) in the robust form of Tyrannosaurus rex.
As mentioned before, prosauropods lacked clear display structures. Thus, a sexual
dimorphism expressed in body size and robustness seems possible and reasonably for
prosauropods and has already been suggested by many authors (WEISHAMPEL & CHAPMAN
1990, GOW et al. 1990, GALTON 1997, 2000, BENTON et al. (2000), but unequivocal
documentation has remained exclusive. GALTON (2001) had suggested the less numerous and
more robust and larger morph being the male in Trossingen.
Sexual dimorphism expressed in variable body size and robustness in females and
males is expected to be represented in the bone microstructure (e.g. deposition of different

106
bone tissues, different growth rates expressed by the degree of vascularization), because it
represents different growth strategies/patterns of the sexes. This can be realized in recent
reptiles in two ways (ANDREWS 1976): One possibility is that the juveniles of both sexes grow
at similar rates until the individual of the smaller sex reach its final size. Individuals of the
larger sex continue to increase in size. The second possibility is that juveniles of both sexes
start to grow with different growth rates. The larger sex grows faster, and sexual maturity is
reached at nearly the same age but at different sizes.
SANDER (1999) on the basis of his bone-histological research of the Tendaguru
sauropods, discussed sexual morphs in Barosaurus bones. SANDER (1999: 109) interpreted the
fast growing morph (Type A) as the male and the slower growing Type B as the female.
However he could also not exclude the two types representing different taxa (SANDER 2000,
REMES 2004).
On the basis of the current histological study, no evidence in bone microstructure
could be found to document a sexual dimorphism in the bones of Plateosaurus engelhardti.
The qualitative and quantitative growth record indicates that growth had stopped at strongly
variable final sizes, ranging from around 6.5 m to nearly 10 m (figure 18). A division into two
groups that may represent the two sexes is not possible on the basis of these data. Excluding
the presence of different taxa, the best explanation remains a very strong intraspecific
variability.
These histologic results suggest that the morphological differences which had lead to
the division into robust and gracile bones or morph before seems to represent only this high
variability in final body size. On the other hand, figure 16, 17, and 18 show that there are
some individuals of Plateosaurus which grew in shorter times than others to higher body
sizes.
8.1.5 Sexual maturity
Of considerable interest for Plateosaurus engelhardti life history is the onset of sexual
maturity. Unfortunately, this moment is difficult to determine in Plateosaurus engelhardti by
bone histology. At least two different possible times can be considered. The first is the bone
tissue change from laminar fibro-lamellar bone to lamellar-zonal bone. According to RICQLES
(1976, 1980) avascular lamellar bone is deposited in extant mammals after reaching sexual
maturity. Also, growth of reptiles slows clearly after sexual maturity is reached (ANDREWS
1976). While many authors prefer this bone tissue change (beside its meaning for the
attainment of maximum size) also in dinosaurs as being the onset of sexual maturity

107
(VARRICCHIO 1993, CHINSAMY 1994, CHINSAMY & DODSON 1995, REID 1997, CURRY 1998,
HORNER et al. 2001) others (SANDER 1999, 2000; HORNER et al. 2000) concluded that sexual
maturity was reached well before maximum size, and thus, before the change from fibro-
lamellar tissue to lamellar-zonal tissue.
But this would mean for Plateosaurus engelhardti that sexual maturity was reached
relatively late in ontogeny. Based on the data from the long bones, this would be not before
the 16th year of life. However, if this were the case, sexual maturity was either reached at the
same age nor at a uniform body size. A similar pattern can be observed in extant reptiles: Size
and age of adult reptiles need not to be correlated, because individual final size varies within a
broad range and also size at sexual maturity varies considerably (ANDREWS 1976).
Nevertheless, the decrease in growth rate and the subsequent growth stop indicated by
the change in bone tissue in all cases marks the attainment of full body size and is therefore an
important landmark in the growth pattern of P. engelhardti.
The second possibility for the onset of sexual maturity in P. engelhardti is that it
occurs earlier in ontogeny, and that this event is possibly only recorded in the histology of the
pubis but not in the long bones. In these, the histological evidence was destroyed by the
enlargement of their active and large medullary cavities. According to the growth record in
pubis, sexual maturity would have been attained around the 9th year of life and at a body size
of around 6 m. This seems to be a more reasonable age (and size) for the onset of sexual
maturity in Plateosaurus engelhardti. The attainment of sexual maturity before final size is
reached is also typical for most reptiles.
8.2 Quantitative growth record: Skeletochronology
This section serves to briefly summarize the quantitative aspects of P. engelhardti life
history, keeping in mind the approximate nature of the values.
The youngest individuals have a total LAG number of 8 (left scapula SMNS F 29, 42
cm; humerus IFG 11921, unknown length), and at least the scapula belonged to an individual
of around 6.2 m body size. The smallest sampled specimen had stopped growth and shows a
total LAG number of 16/17. It was only around 4.8 m long (left scapula MSFM 36.5 cm). On
the basis of the largest femur (left, 99.0 cm, IFG exhibition), and the tibia sample NAA A9
(53 cm), a maximum LAG number of 25, respectively 26/27 years is suggested for
Plateosaurus engelhardti. Because these individuals, like the others at Trossingen and Frick
died from an accident (miring; SANDER 1992) and not of old age, the maximum age of
Plateosaurus engelhardti can be assumed to be higher. In contrast to the femur (IFG 99 cm),

108
which represents the maximum documented size for P. engelhardti, the tibia belongs to a
medium-sized individual of only around 6.5 m body length. Most individuals grew up to their
16 year of life with laminar fibro-lamellar bone, than growth started to decrease and finally
stopped. Most individuals had stopped growth completely somewhat after their 20th year of
life. The most likely onset of sexual maturity, as recorded in the pubis, is after 9 years, after
roughly one third of life had passed.
It is striking that the longest bones do not necessarily have the highest LAG numbers
(figure 16-18). In fact, no correlation between bone length (= body size) and LAG number (=
age) is apparent in Plateosaurus engelhardti bones (table 7-12; figure 16, 17).
A look at figure 18 shows that there is no correlation between bone length and growth
cessation/growth stop, either. But again it is documented that some bones, and thus
individuals grew to considerably larger size than others. The main conclusion must be again
that growth stopped in Plateosaurus engelhardti at variable final body sizes.
There are a number of possible sources of error that could explain such a high
variability: 1. An extreme methodical error in recording (but there is no evidence for this); 2.
LAGs are, in spite of experiments with recent tetrapods (e.g. tetracycline, specimen sampled
of known age; for references see CASTANET & SMIRINA 1990, and CASTANET et al. 1993,
GROSSE 1999), not annual, but random; 3. A sexual dimorphism that is hidden in the apparent
great variability . Because a sexual dimorphism cannot be worked out on the basis of the
current bone histological data, and because the annual deposition of growth marks is main
premise of the current study, the best explanation remains a very high intraspecific variability
in Plateosaurus engelhardti.
9. Comparison of growth of Plateosaurus engelhardti with that of some other extinct and
extant tetrapods
Many studies about dinosaur bone histology and some about skeletochronology were
published in the last decade. In table 15, the results of a selection of these and other studies
are summarized and will be compared and discussed in the following with the bone
histological data for Plateosaurus engelhardti. The main focus is here on the similarities and
differences concerning general growth pattern and life history. The tetrapods compared are
discussed in order of phylogenetic proximity to Plateosaurus.

109
9.1 Other prosauropods
Only CHINSAMY (1993) did a detailed skeletochronology study of a prosauropod,
using femora of Massospondylus carinatus. This study therefore needs to be compared in
detail with the results of the current study of Plateosaurus engelhardti bone histology.
CHINSAMY (1993) described a similar highly vascularized fibro-lamellar bone as in
Plateosaurus engelhardti. The distribution of secondary osteons and cancellous bone is also
similar in both prosauropods. Both share a stratification of the cortex through growth marks
(LAGs), reflecting periods of fast and slow growth.
In small and therefore young M. carinatus specimens, the same bone tissue occurs as
in adults, but growth rates decrease generally during ontogeny. CHINSAMY (1993) calculated
that in the first 5 years, 50% of femoral growth was attained, with growth slowing down
afterwards. The mathematical formula of CHINSAMY (1993), age = 0,05 (femur length) 1.52,
indicates that in M. carinatus, in contrast to Plateosaurus engelhardti, size and age were
much more closely correlated and that reliable age estimates on the basis of bone length are
possible. Thus, CHINSAMY (1993) was able to construct a S-shaped growth curve for M.
carinatus on the basis of her bone histological data. M. carinatus apparently did not have such
a high variability in adult size as P. engelhardti, and this implies a very different growth
pattern and life history of M. carinatus.
The life expectancy in M. carinatus is lower (max. 15 years documented) than in
Plateosaurus engelhardti (max 26/27 years documented). However, this could be the result of
differences in the extrapolation methods used. The method used by CHINSAMY (1993) is
likely more accurate because resorbed growth marks were estimated on the basis of juvenile
specimen. This was not possible in P. engelhardti.
As opposed to the general similarity in bone tissue, vascular system, cyclical growth,
and irregular cycle distances (CHINSAMY 1993: 325: fig. 6), the two prosauropods differ in
another important point. This is the lack of closely spaced LAGs in the outer cortex of M.
carinatus, even in the largest individuals. This led CHINSAMY (1993) to conclude that M.
carinatus had an indeterminate growth as supposedly seen in extant ectotherms. In
Plateosaurus engelhardti, on the other hand, growth was clearly determinate and stopped in
the last third of life. [The concept of indeterminate growth requires some comment: Although
none of modern groups of the reptiles grow throughout their whole life, it was thought for a
long time that reptiles had an indeterminate growth. Growth continues in some reptiles for
quite a long time, after sexual maturity is reached, as opposed to birds and mammals.

110
Additionally, the variability in final size is much greater than in birds and mammals. The idea
of an indeterminate growth in reptiles has its origin in these facts.]
Possible reasons for these differences are: 1. CHINSAMY did not sample adult
individuals of M. carinatus which would have stopped growth. 2. M. carinatus and P.
engelhardti are not as closely related as generally believed. 3. They are closely related and the
observed differences are real.
Comparing P. engelhardti growth with that of Thecodontosaurus antiquus (CHERRY
2002) shows that they agree in bone tissue and vascular system, too but that LAGs are
missing in the limb bones of T. antiquus. CHERRY (2002) also did not found any indication of
determinate growth in T. antiquus. However, differences may well be due to the juvenile
status of all sampled bones. CHERRY (2002) notes that there are much larger individuals of
Thecodontosaurus than those sampled by her.
A cursory look at a fractured Sellosaurus gracilis pubis in the SMNS collection
(SMNS 5715) shows a nearly identical bone tissue to that observed in P. engelhardti pubes.
9.2 Sauropods
The first who described sauropod bone tissue with LAGs was RICQLES (1983)
studying the humerus of a half grown Bothriospondylus (now Lapparentosaurus). Bone
microstructure was fibro-lamellar bone with typical plexiform to reticular or, in restricted
areas only, parallel longitudinal primary osteons. RICQLES (1983) counted LAGs in this
sample and concluded that this individual had needed at least 16 and at most 26 years to reach
slightly less than half maximum size. He suggested an age of roughly 43 years for an
individual to reach 2/3 of maximum adult size, agreeing well with CASE’s (1978) estimates of
40 years for the onset of sexual maturity of another sauropod, Hypselosaurus. This is a very
great age for sauropods, and a very late onset of reproduction and seem unrealistic in
comparison with modern tetrapods (DUNHAM et al. 1989). The unrealistic character also
appears in the light of newer studies of sauropods (see below, table 15) which indicates
substantially lower ages for reaching sexual maturity and maximum size in sauropods. Thus,
e. g Janenschia reached sexual maturity at around 11 years (SANDER 2000). Apatosaurus
needed around 8-10 years for reaching sub-adult size (CURRY 1998). RIMBLOT-BALY (1995)
concluded that Lapparentosaurus needed two decades to reach “adult conditions”, but they
did not specify the meaning of that term.
Modern bone histological studies of sauropods document a generally uniform bone
microstructure which is already observable in the earliest known sauropod, Isanosaurus

111
(SANDER et al. in press). But different interpretation of this microstructure still leads to
different results, depending on the assumptions of the authors. Thus, e. g. CURRY (1998) and
SANDER (1999, 2000) suggested a determinate growth on the basis of the deposition of
lamellar-zonal bone in the exterior cortex, whereas RIMBLOT-BALY et al (1995) suggested an
indefinite growth for Lapparentosaurus, although they noted a similar “lamellar, accretionary
tissue at the cortical periphery in their largest samples identical to that observed in
Apatosaurus bone” (CURRY 1998: 662). CURRY (1998) interpreted this as indication of
determinate growth for Lapparentosaurus, too.
Cyclical growth patterns, mainly related to differences in the vascular system, are
observable in many sauropod long bones. On the basis of these and other structural
characteristics (SANDER 2000), ontogenetic stages are documented. True LAGs occur mainly
in the exterior cortex when lamellar-zonal bone was deposited (except in Janenschia and
some Barosaurus specimen in which LAGs also appear in FBL). Thus, as a general trend, it is
clear that sauropods started with very rapid continuously growth, followed by a gradual
decline into adulthood.
Bone tissue and vascular system are generally similar in Plateosaurus and sauropods
(table 15), but there are major differences in bone microstructure in the amount of fibro-
lamellar bone in the cortex, cyclical interruptions of growth by clear growth marks/LAGs,
laminae distances, and vascular density. Laminae distances (based only on estimation, not
quantified) and vascular density are in sauropods considerably greater than in prosauropods.
All three differences indicate fundamentally higher growth rates in sauropods than in
prosauropods.
Data from skeletochronology agree relatively well with this. Like some sauropods,
Plateosaurus possibly shows an early onset of sexual maturity at around 9 years (table 12). A
size of around 5 m may have been reached within 8 years. In that this is about half maximum
size, this is also similar to data for sauropods (Of course, sauropods reached a much larger
size in the same time). Growth is generally determinate in both and final size was reached in
Plateosaurus also within similar time spans as sauropods i.e. in the 2nd and 3rd decade of life.
Both seem to share the pattern of growth continuing after sexual maturity.
Thus, it can be concluded that Plateosaurus and sauropods show generally a similar
life history, but sauropods reached in the same time interval quite a larger body sizes due to
their higher growth rates and their strategy of continuously faster and uninterrupted growth.
An important difference between both life history is the very high variability in adult size of

112
Plateosaurus, indicating a more “reptilian” growth pattern and life history, whereas most
sauropods show lower or no variability in adult size range.
Table 15: Bone histological studies in some dinosaurs, and other extant and extinct
tetrapods. FBL = fibro-lamellar bone tissue, LZ = lamellar-zonal bone; SM = sexual
maturity, MS = maximum size, bl = body length, bm= body mass. taxon sampled bones bone tissue cyclical growth remarks life history data authors DINOSAURS prosauropod Plateosaurus engelhardti
long bones, vertebrae, ribs, phalanx, pubes, scapulae
laminar FBL, LZ
stratification of cortex by annual growth marks (zone-annulus-LAG)
only adult bones were sampled; high variation in adult body size; no correlation between age and size possible
individuals of 5 m are at least 8 years old, in most individuals growth continued with FBL up to 16 years, then growth slowed down and growth stopped around 20 years, than deposition of LZ; SM is reached at around 9-10 years, maximum documented age around 26/27, maybe higher; determinate growth.
RICQLES 1968 REID 1990 KLEIN & SANDER current study
prosauropod Massospondylus carinatus
growth series of femora
laminar FBL
stratification of cortex by annual growth marks (zone-annulus-LAG)
constructed a S-shaped growth curve
after 5 years half of MS was reached, growth slows down afterwards, but was indeterminate, maximum documented age was 15 years
CHINSAMY 1993a
prosauropod Thecodontosaurus antiquus
femora, tibiae, humeri, phalanx, rib
FBL LAGs occur only in the rib sample
maybe only juvenile bones sampled
relatively high growth rate
CHERRY 2002
sauropod Isanosaurus
humerus FBL no growth marks
increase in growth rate must have been a considerable increase in metabolic rate, possible made by a bird-like lung
very fast growth throughout whole ontogeny
SANDER et al. 2004
sauropod Apatosaurus
scapulae, radii, ulnae, femur
laminar to plexiform FBL; longitudinally vascularized LZ
no LAGs documented in the FBL; cyclicity in vascularity in scapulae samples; LAGs in the LZ
radii & ulnae show consistent bone depositional rates throughout ontogeny; need 8-10 years for reaching sub-adult size
three ontogenetic phases: Growth stage A: laminar to sub-plexiform FBL up to 73% of MS, no LAGs or annuli Growth stage B: primarily parallel-fibered bone, sparse longitudinal vascularization, up to 91 % of MS, annuli, initial LAGs Growth stage C: primarily avascular and/or longitudinally vascularized lamellar bone;
CURRY 1998 SANDER & TÜCKMANTEL 2003

113
determinate growth
sauropod Barosaurus (type A & B)
humeri, femora, tibia, fibula
plexiform, reticulate, and laminar FBL
type B shows irregularly spaced LAGs throughout the cortex
ontogenetic change in histology; dense Haversian bone in Type B
SM at around 70% of MS; determinate growth; division of bones in two types (A, B), maybe related to a sexual dimorphism or to the occurrence of different taxa
SANDER 1999, 2000 REMES 2004
sauropod Dicraeosaurus
humeri, femora laminar FBL; LZ
LAGs mainly in the LZ; polish lines
no ontogenetic change in histology, but only sub-adult and adult bones sampled (sample contains little size variation)
SM at around 80% of MS; determinate growth
SANDER 1999, 2000
sauropod Brachiosaurus
humeri, femora, ulna, tibia
laminar FBL; LZ
LAGs occurred mainly in the exterior cortex and within the LZ; polish lines
secondary osteons were scattered through the cortex; ontogenetic change in histology
SM at around 40 % of MS; determinate growth
SANDER 1999, 2000
sauropod Lapparentosaurus madagascariensis
growth series of humeri (30 to 155 cm)
plexiform to reticular FBL; in restricted areas parallel longitudinal primary osteons;
LAGs;
high remodeling; clear bone tissue change during ontogeny
need 43 years to reach 2/3 of MS
RICQLES 1983
sauropod Lapparentosaurus madagascariensis
growth series of humeri (30 to 155 cm)
laminar FBL during later ontogeny a cyclical pattern of deposition appeared suggesting yearly cycles of growth, but no real LAGs
adult conditions in about two decades, indefinite growth
RIMBLOT-BALY et al. (1995)
sauropod Janenschia
humerus, femur laminar FBL ; LZ
LAGs in the outer FBL cortex; LAGs within the LZ; polish lines
SM at around 11 years, MS was reached around 26 years, and this special specimen died at 38 years; determinate growth
SANDER 1999, 2000
taxon sampled bones bone tissue cyclical growth remarks life history data authors theropod Herrarosaurus
femur azonal FBL no growth marks
STARCK & CHINSAMY 2002
theropod Syntarsus rhodiensis
femora FBL LAGs and annuli
MS reached in 7 years; determinate growth
CHINSAMY 1993B
theropod Troodon formosus
metatarsalia, tibiae
laminar to sub-plexiform FBL; moderate and avascular LZ
LAGs three ontogenetic stages; after Troodon had reached 50 kg no more significant growth happened
adult size was possibly reached in 3-5 years, SM and MS were reached when LZ appears
VARRICCHIO 1993
ornithopod Dryosaurus (medium-sized; bm = 70 kg)
femora FBL growth without any interruptions, no LAGs
indeterminate growth
CHINSAMY 1994
ceratopsian Psittacosaurus mongoliensis
growth series of long bones
FBL complex annual growth lines
ontogenetic changes documented in bone histology; P. had an S-shaped growth curve; max. growth was faster than in
in the first few years less increase in body mass, with 5 years body mass increase and rapid growth starts maybe up to the 8-9 years, then
ERICKSON & TUMANOVA 2000

114
extant reptiles and marsupials, but slower than in most avian and eutherian taxa
plateau of somatic growth is observable
hadrosaurid Maiasaurus peeblesorum (MS = 7-9m)
vertebrae, ribs, limb girdles, long bones
FBL LZ in exterior cortex of some specimen
by the sub-adult stage, LAGs appeared regularly
six different ontogenetic stages were documented on the basis of relative bone size but also by histological changes
late juvenile stage (3,5 m) were reached in 1-2 years; maturity was reached at about 7 years and 7 m; adult size was reached in 6-8 years; determinate growth
HORNER et al. 2000 ; PADIAN et al 2001
taxon sampled bones bone tissue cyclical growth remarks life history data authors REPTILES testudines Caretta caretta
humeri LZ annual deposition of zones and LAGs
captive rearing gives unnatural results, because the individuals grow faster ; secondary osteons occur
SM at 13-15 years; statistically, nesting females are of around 900 mm
ZUG et al. 1986
lizard Megalania prisca (bl = 4.5 m; bm = 2200 kg))
dermal bones zonal bone annual growth lines
gigantic size due to sustaining juvenile growth rates for a larger period of time and delaying onset of somatic adulthood
ERICKSON et al. 2003, AUFFENBERG 1980
lizard Varanus komodiensis (bl = 3 m, bm = 50 kg)
osteoderms, vertebrae
LZ LAGs high remodeling disturbs growth record, number of LAGs found in osteoderms agrees with that of LAG number found in vertebrae of the same individual;
males grew at faster rates and become larger than females; both sexes reach SM at around 150 cm and of an average of around 5 years; longevity over 26 years, some authors estimates ages of 50 years
AUFFENBERG 1980
crocodile Deinosuchus riograndensis (bl: 8-10, 17 m; bm: 2500-5000 kg)
dorsal osteoderms
LZ annual growth rings
gigantism by prolonging ontogeny
needs around 35 years for adult size; maximum documented age about 50 years
ERICKSON & BROSCHU 1999
crocodile Crocodylus niloticus (bl = max. 5 m; bm = max. 1000 kg)
osteoderms LZ LAGs SM depends strongly on age and size; males generally grow faster and get larger than females
SM between 12-15 years at a size of 2-3 m and a weight of 70-100kg; longevity at around 25, maybe up to 50 years
POOLEY & GANS 1976 CHINSAMY 1994
taxon sampled bones bone tissue cyclical growth remarks life history data authors BIRDS AND MAMMALS
extant birds highly vascularized FBL; in the exterior cortex of adults of some species narrow layer of lamellar bone
rapid growth without zonation; in the outermost cortex, where growth slows LAGs can occur in the long bones of some extant birds
growth slowed down clearly after onset of SM; extant birds reach maturity too rapidly to lay down growth lines
grow within short periods to adult size; SM is closely followed by MS
CHINSAMY & ELZANOWSKI 2001; PADIAN et al 2001
extant mammals FBL fast growth up to
MS, SM is closely followed by MS

115
9.3 Other dinosaurs
As table 15 shows, already the earliest theropods, Herrerasaurus and Syntarsus, grew
very fast with fibro-lamellar bone tissue. But while Herrerasaurus grew uninterrupted to
adulthood, in the cortex of Syntarsus, LAGs and annuli appeared regularly, indicating cyclical
interruptions of growth. Growth in Syntarsus was clearly determinate. Additionally to cyclical
and determinate growth, Troodon, Psittacosaurus, and Maiasaurus show different growth
stages, and onset of sexual maturity is in all closely followed by attainment of maximum size.
Only Dryosaurus has had a different pattern, no growth marks appeared in its cortex, and
growth seems to be indeterminate (but maybe individuals sampled were not old enough ?).
Thus, bone tissue in dinosaurs differs mainly in the occurrence or absence of growth
marks within the fibro-lamellar bone and the degree of vascularization. In most dinosaurs
LAGs are present within lamellar-zonal bone, deposited in the outermost cortex and clearly
indicating a determinate growth. In some other dinosaurs (e. g. Dryosaurus) this cessation of
growth is still lacking. Growth marks deposited within the fibro-lamellar bone tissue,
indicating a clearly cyclical growth during main or whole ontogeny appears also regularly in
dinosaurs.
Juveniles show the highest growth rates in all dinosaurs but with increasing age
growth rates slowed down. Nevertheless dinosaurs grew to their adult size relatively quickly,
much as large birds and mammals do today.
Thus, growth strategy and growth pattern of Plateosaurus fit well into the picture of
dinosaurian growth strategies and patterns. It shows that Plateosaurus as a relatively basal
dinosaur, although cyclical interrupted, had grown with fibro-lamellar bone and shows, in
contrast to reptiles, relatively high growth rates. The onset of sexual maturity is assumed as
relatively early in ontogeny, at somewhere between half and 2/3 of maximum size. Growth
continued relatively fast up to adult size, then plateaued, and was clearly determinate, also
like in most studied dinosaurs. This is the general pattern seen in all dinosaurs, only growth
rates varies, following the rule the larger the dinosaur had become the faster growth was.
There is only one important difference: Though the high variability in final size in
Plateosaurus is not known from any other studied dinosaur.
9.4 Reptiles
Most reptiles grow with lamellar-zonal bone with primary longitudinal canals. Bone
tissue becomes avascular in adulthood. Only monitors show an exceptionally extensive
vascularization in their primary cortex. Secondary osteons are lacking, except in restricted

116
areas in turtles and crocodiles. Reptiles always grow cyclical interrupted, independent of
living in seasonal or constant environments. This documents an endogeneous determination or
rhythm of growth. Growth marks are annual in reptiles as many recent studies have shown
(mark-release-recapture method; marking cycles with tetracycline; for references see
CASTANET & SMIRINA 1990, and CASTANET et al. 1993, GROSSE 1999). Crocodiles and turtles
under optimal captive conditions are able to grow as juveniles with fibro-lamellar tissue. They
form quite periodical, fibro-lamellar bone in the zones followed by layers of lamellated bone
or a LAG (CHINSAMY 1994). Beside this, crocodiles and turtles retained a rather
plesiomorphic or generalized condition of their bone tissue, often close in agreement with
large extinct amphibians (steogocephalians).
ANDREWS (1976) reviewed the high variability in the growth rates of reptiles
depending on environmental conditions. The advantage of such a growth strategy is that low
growth rates allow reptiles to persist at times or at places of low resource availability. In
contrast captive reptiles, e. g. turtles of the genus Trachemys, can be raised under constant
optimal conditions to their maximum size (around 20 cm) in less than half of the time (3
years) which they needed normally in the wild (6 years). European land tortoises (Testudo
spp.) can be raised within 4-5 years to the size where sexual maturity usually starts, in the
wild they will need around 10-12 years (ROGNER 1996). However, such fast growth is most of
the time coupled with various diseases in these captive individuals and not comparable with
optimal conditions in the wild.
Life history patterns of reptiles are fairly uniform. They all grow relatively fast to
sexual maturity, then growth slows down but can continue for several years and usually stops.
But maximum size can include in many reptiles a wide range of size (mostly in larger taxa
such as crocodiles, turtles, and some of the giant snakes, not in more modern forms like
lizards). Three landmarks on a growth curve of an individual reptile are significant: Size at
hatching size at sexual maturity, and maximum size. The onset of sexual maturity in reptiles
is coupled to a specific size and weight, and not to a specific age, because growth depends
strongly on environmental conditions in reptiles. Thus, the range of age at maturity is as large
as that of final size. Therefore size and age need not to be correlated (e.g. see ZUG et al 1986:
figure 9). This leads to a large phenotypic diversity in many reptiles concerning the final size.
In others, body size variation is limited, but maximum size is attained at a variety of possible
ages, strongly depending on individual history.
Although Plateosaurus shows a clearly higher growth rates than modern wild reptiles
it is similar in its strong variation in maximum size and growth rate. Also conspicuously

117
”reptilian” is the high dependency of Plateosaurus on environmental conditions as evidenced
by irregularly deposited growth cycles.
9.5 Birds and mammals
Growth patterns and strategies of birds and mammals are also quite well known. Both
show a similar, rather simple growth pattern with very fast rates, depositing highly
vascularized fibro-lamellar tissue. Growth is continuous up to sexual maturity and there is
little variation in adult size. When sexual maturity and maximum size is reached growth stops
and lamellar-zonal tissue is deposited in some taxa in the exterior cortex. Thus, growth is
clearly determinate and correlated with size. Strong remodeling and Haversian bone is
common in the bones of birds and mammals. Larger mammals need longer times for growth
and reaching sexual maturity and maximum size can include several years. Smaller mammals,
like most rodents need only a few weeks to attain sexual maturity and maximum size. Most
birds grow within their first years to maximum size and become mature, in many small
songbirds it takes only a few weeks.
Thus, there is beside a similar bone tissue no more similarity between Plateosaurus
and extant birds and mammals.
10 Summary and conclusions
The bone histological study of various cross-, polish-, and thin-sections of long and
girdle bones of Plateosaurus engelhardti shows that the primary bone tissue in adult
individuals was the laminar fibro-lamellar complex regularly interrupted by LAGs.
Deposition of LAGs is a clear indication that Plateosaurus engelhardti individuals were not
able to maintain high rates of bone deposition continuously during much of their life history.
Nevertheless, the presence of laminar fibro-lamellar bone reflects a presumably high
metabolic rate, and growth rate. Changes in growth during ontogeny are only observable in
the exterior cortex where the fibro-lamellar complex changes in some specimen into nearly
avascular lamellar-zonal tissue and clearly indicates a determinate growth pattern. Earlier
changes in growth could not be documented due to the lack of juveniles.
Different rates of the bones in a single skeleton are documented. The primary cortex of
the pubis consists only of lamellar-zonal bone clearly indicating a slower growth than in long
bones. Therefore, the onset of sexual maturity is possibly preserved in the pubes. Large
medullary cavities of the long bones makes extrapolation necessary and leads to a general
overestimation of total LAG numbers (=ages) in the long bones.

118
Skeletochronology results in ages for different life history events similar to other
studied dinosaurs. A size of around 5 m could be reached in 8 years, sexual maturity starts
around 9 years. The maximum documented age was around 26/27 years, but longevity was
higher than this. Most individuals approached maximum size around 16-20 years. Deposition
of LAGs in largely avascular lamellar-zonal bone after growth indicates a plateauing of
growth. There is a very high variability of adult size. The sample shows specimen which
stopped growth around 6.5 m and others which continued growth at a body size of over 8 m.
Sexual dimorphism could not be documented within this variability but remains possible. The
largest sampled bone represents an individual of 10 m body size which had stopped growth at
around 20 years and lived for several (5) years longer.
Bone microstructure and some aspects of life history (continued growth after onset of
sexual maturity) of Plateosaurus were similar to other studied dinosaurs. But cyclical
interrupted growth, continued growth after sexual maturity, high dependency on
environmental conditions, and the high range of final body size in adults indicates a more
reptilian (plesiomorphic) growth pattern than was available in most other dinosaurs. On the
other hand, high growth rates, and the deposition of fibro-lamellar bone shows that
Plateosaurus was surely “not simply reptilian”. Like many other dinosaurs, Plateosaurus
engelhardti combines features of ectothermy and endothermy, and it cannot be put easily into
one of the categories used today. Therefore, physiology should be termed “dinosaurian”, as
REID (1990) had suggested.

119
Acknowledgements
I am extremely grateful to PD Dr. MARTIN SANDER. This work would not have been
possible without his help, and his engagement, and not least without his idea for studying
bone histology of Plateosaurus. He supported not only constantly the progress of this
research, always very patiently explaining histological details (some more than once) but also
spending hours correcting my English to make the current study accessible for other
interested scientists. Additionally, he made many of the cited references available to me, and
spend much time in counting LAGs (again and again). Many discussions and controversies
with him make this project so interesting for me.
I am also very grateful to Dr. R. WILD from the SMNS, PD Dr. R. FOELIX from the
NAA, the Saurierkomission Frick (MSF), and Prof. Dr. H.U. PFRETZSCHNER from the IFG
who allowed us to sample and study the Plateosaurus bones from Trossingen and Frick. This
study would not have been possible without their confidence in the usefulness of our
endevour.
Further, I very much would like to thank our preparator Olaf DÜLFER (IPB) for making
me welcome in his lab and helping me, processing the polished sections into thin sections. He
spent much time in trying to obtain good thin sections from the terribly brittle samples of
Trossingen bone. He never gave up and always had new ideas. Also many thanks must go to
our photographer Georg OLESCHINSKI (IPB), for the very high-resolution pictures of fracture
surfaces, cross, -polish -, and thin section and of course for his time. Many thanks go also to
our graphic artist, Doro KRANZ (IPB), for her kind support and advice in using different
graphics programs and for her very constructive ideas for the arrangement of the figures. I am
also very grateful to the preparators of the SMNS for impregnating some of the Trossingen
bones in Zaponlack for us.
Finally, I would like to say a huge thanks to all the people in the museums and
institutes (IPB, IFG, MSF, NAA, SMA, SMNS) who gave me a warm welcome and/or spend
time in discussion. These are, in alphabetical order, Rainer FOELIX, Annalisa GOTTMANN, Ben
PABST, Monica RÜMBELI, Iwan STÖSSEL, Kurt WETTSTEIN, and Rupert WILD.
This research was funded by the Graduiertenförderung of Nordrhein-Westfalen. Many
thanks go to PD Dr. Martin SANDER (IPB) and Prof. Dr. Wofgang BÖHME (ZFMK) for their
letters of recommendations which help me to get this stipend. I would also like to thank Prof.
Dr. Jes Rust who read and evaluated this thesis.

120
References
Amprino R. 1947. La structure du tissu osseux envisagèe comme expression de diffèrences
dans la vitesse de l' accroisement. Archives de Biologie 58: 315-330.
Andrassy P. 2004. Gibt es Stillstandslinien bei pleistozänen Säugetieren? Paläohistologische
Untersuchungen an Langknochen pleistozäner Großsäuger. Unpublished master thesis,
University of Bonn.
Andrews RM. 1982. Patterns of growth in reptiles. In: Gans C, Pough FH., ed. Biology of the
Reptilia. London: Academic Press, 273-320.
Auffenberg W. 1981. The behavioral ecology of the Komodo monitor. Gainesville:
University Press Florida.
Bakker RT. 1986. The dinosaur heresies: New theories unlocking the mystery of the
dinoaurs and their extinction. New York: William Morrow and Co. Inc.
Benton MJ, Juul L, Storrs GW, and Galton PM. 2000. Anatomy and Systematics of the
Prosauropod dinosaur Thecodontosaurus antiquus from the Upper Triassic of
Southwest England. Journal of Vertebrate Paleontology 20: 77-108.
Carpenter K. 1999. Eggs, Nests, and Baby Dinosaurs. Bloomington and Indianapolis:
Indiana University press.
Case TJ. 1978. Speculations on the growth rate and reproduction of some dinosaurs.
Paleobiology 4: 320-326.
Castanet J. 1994. Age existimation and longevity in reptiles. Gerontology 40: 174-192.
Castanet J, Cheylan M. 1979. Les marques de croissance des os et des ecilles comme
indicateur de l'age chez Testudo hermanni et Testudo graeca (Reptilia, Chelonia,
Testudinidae). Canadian Journal of Zoology 57: 1649-1665.
Castanet J, Francillon-Vieillot H, Meunier FJ, Ricqlès A de. 1993. Bone and individual
aging. In: Hall BK, ed. Bone. Volume 7: Bone growth - B. Boca Raton: CRC Press,
245-283.
Castanet J, Newman DG, Saint Girons H. 1988. Skeletochronological data on the growth,
age, and population structure of the tuatara, Sphenodon punctatus, on Stephens and
Lady Alice Islands, New Zealand. Herpetologica 44: 25-37.
Castanet J, Smirina E. 1990. Introduction to the skeletochronological method in amphibians
and reptiles. Annales des Sciences Naturelles, Zoologie, Paris, Série13. Vol. 11: 191-
196.
Cherry C. 2002. Bone histology of the primitive dinosaur, Thecodontosaurus antiquus.
Unpublished master thesis, University of Bristol.
121
Chinsamy A. 1990. Physiological implications of the bone histology of Syntarsus
rhodesiensis (Saurischia: Theropoda). Palaeontologia africana 27: 77-82.
Chinsamy A. 1992. Ontogenetic growth of the dinosaurs Massospondylus carinatus and
Syntarsus rhodesiensis. Journal of Vertebrate Paleontology 12: 23A.
Chinsamy A. 1993a. Bone histology and growth trajectory of the prosauropod dinosaur
Massospondylus carinatus (Owen). Modern Geology 18: 319-329.
Chinsamy A. 1993b. Image analysis and the physiological implications of the vascularisation
of femora in Archosaurs. Modern Geology 19: 101-108.
Chinsamy A. 1994. Dinosaur bone histology: Implications and inferences. In: Rosenberg GD
and Wolberg DL, eds. Dino Fest.: Paleontological Society, Special Publication No. 7:
213-227.
Chinsamy A. 1997. Sex and old bones ? Journal of Vertebrate Paleontology 17: 450.
Chinsamy A, Dodson P. 1995. Inside a dinosaur bone. American Scientist 83: 174-180.
Chinsamy A, Elzanowski A. 2001. Evolution of growth pattern in birds. Nature 412: 402.
Colbert EH. 1964. Relationships of saurischian dinosaurs. American Museum Novitates
2181: 1-24.
Currey JD. 1962. The histology of the bone of a prosauropod dinosaur. Palaeontology 5:
238-246.
Curry KA. 1998. Histological quantification of growth rates in Apatosaurus. Journal of
Vertebrate Paleontology 18: 36A.
Curry KA. 1999. Ontogenetic histology of Apatosaurus (Dinosauria: Sauropoda): New
insights on growth rates and longevity. Journal of Vertebrate Paleontology 19: 654-
665.
Dunham AE, Overall K L, Porter W P, Forster C A. 1989. Implications of ecological
energetics and biophysical and developmental constraints for life-history variation in
dinosaurs. In: Farlow JOe, ed. Paleobiology of the dinosaurs.: The Geological Society
of America, Inc., Boulder., pp. 1-21.
Enlow DH. 1969. The bone of reptiles. In: Gans Ce, ed. Biology of the Reptilia. London:
Academic Press.
Enlow DH, Brown SO. 1956. A comparative histological study of fossil and recent bone
tissues. Part I. The Texas Journal of Science 9: 405-439.
Enlow DH, Brown SO. 1957. A comparative histololgical study of fossil and recent bone
tissues. Part II. The Texas Journal of Science 9: 186-214.
Enlow DH, Brown SO. 1958. A comparative histological study of fossil and recent bone

122
tissues. Part III. The Texas Journal of Science 10: 187-230.
Erickson GM, Brochu CA. 1999. How the "terror crocodile" grew so big. Nature 398: 205-
206.
Erickson GM, Curry-Rogers K, Yerby SA. 2001. Dinosaurian growth patterns and rapid
avian growth rates. Nature 412: 429-432.
Erickson GM, Ricqles A de, Buffrenil V de , Molnar R, Bayless MK. 2003. Vermiform
bones and the evolution of gigantism in Megalania - How a reptilian fox became a
lion. Journal of Vertebrate Paleontology 9 23: 966-970.
Erickson GM, Tumanova TA. 2000. Growth curve of Psittacosaurus mongoloiensis Osborn
(Ceratopsia: Psittacosauridae) inferred from long bone histology. Zoological Journal
of the Linnean Society 130: 551-566.
Farlow JO, Brett-Surmann M.K. (eds.). 1997. The Complete Dinosaur. Bloomington and
Indianapolis: Indiana University Press.
Farlow JO, Dodson P, Chinsamy A. 1995. Dinosaur biology. Annual Review of Ecology and
Systematics 26: 445-471.
Ferguson MWJ, Honig LS, Bringas P Jr., Slavkin HC. 1982. In vivo and in vitro
development of first branchial arch derivates in Alligator mississippiensis. In: Dixon
A, Sarnat B., ed. Factors and Mechanisms influencing bone growth. New York: Alan
R. Liss., pp 275-296.
Foelix R. 1999a. Neue Saurierfunde in Frick: Internet Resource: http://www.sauriermuseum-
frick.ch/grabungen.htm. 40-46.
Foelix R. 1999b. Röntgen im Museum. Aargauische Naturforschende Gesellschaft,
Mitteilungen 35: 147-160.
Fraas E. 1913. Die neuesten Dinosaurierfunde in der schwäbischen Trias.
Naturwissenschaften 1913: 1097-1100.
Francillon-Vieillot H, Buffrénil V. de, Castanet J, Géraudie J, Meunier FJ, Sire JY,
Zylberberg L, Ricqlès A de. 1990. Microstructure and mineralization of vertebrate skeletal
tissues. In: Carter Je, ed. Skeletal biomineralization: Patterns, processes and
evolutionary trends. New York: Van Nostrand Reinhold, 471-530.
Galton P, M. 2001. The prosauropod dinosaur Plateosaurus MEYER, 1837 (Saurischia:
Sauropodomorpha; Upper Triassic). II. Notes on the referred species. Revue de
Palèobiology, 20: 435-502.
Galton PM. 1985. Cranial anatomy of the prosauropod dinosaur Plateosaurus from the
Knollenmergel (Middle Keuper, Upper Triassic) of Germany. Part II: All the cranial

123
material and details of soft-part anatomy. Geologica et Palaeontologica. Marburg 19:
119-159.
Galton PM. 1986. Prosauropod dinosaur Plateosaurus (=Gressylosaurus) (Saurischia:
Sauropodomorpha) from the Upper Triassic of Switzerland. Geologica et
Palaeontologica 20: 167-183.
Galton PM. 1990. Basal Sauropodomorpha-Prosauropoda. In: Weishampel P, Dodson P,
Osmòslka H., ed. The Dinosauria. Berkeley: University of California Press., 320-344.
Galton PM. 1997. Comments on sexual dimorphism in the prosauropod dinosaur
Plateosaurus engelhardti (Upper Triassic, Trossingen). Neues Jahrburch für Geologie
und Paläontologie, Monatshefte 1997: 674-682.
Galton PM. 2000. The prosauropod dinosaur Plateosaurus MEYER, 1837 (Saurischia:
Sauropodomorpha). I. The syntypes of P. engelhardti MEYER, 1837 (Upper Triassic,
Germany), with notes on other European prosauropods with "distally straight" femora.
Neues Jahrbuch Geologie und Paläontologie, Abhandlungen. Stuttgart 216: 233-275.
Gow C, Kitching JW, Raath MA. 1990. Skulls of the prosauropod dinosaur
Massospondylus carinatus OWEN in te collections of the Bernard PRICE Institute for
Paleontological Research. Palaeontologia africana, Johannesburg. 27: 45-58.
Grine F, Kitching JW. 1987. Scanning electron microscopy of early dinosaur egg shell
structure: A comparsion with other rigid sauropod eggs. Scanning Micropscope 1:
615-630.
Gross W. 1934. Die Typen des mikroskopischen Knochenbaues bei fossilen Stegocepahlen
und Reptilien. Zeitschrift der Anatomie und Entwicklungsgeschichte 203: 731-764.
Grosse W-R. 1999. Altersbestimmung bei mitteleuropäischen Amphibien mittels
Skeletochronologie am Beispiel der Kreuz-, Erd- und Wechselkröte (Anura,
Bufonidae). Elaphe Heft 3/1999: 80.
Heerden J, van. 1997. Prosauropods. In: Farlow JO, Brett-Surmann MK., ed. The complete
dinosaur. Bloomington: Indiana University Press, 242-263.
Horner J, Ricqles A de, Padian K. 2000. Long bone histology of the hadrosaurid dinosaur
Maiasaura peeblesorum: Growth dynamics and physiology based on an ontogenetic
series of skeletal elements. Journal of Vertebrate Paleontology 20: 115-129.
Horner J, Ricqlès A de, Padian K. 1999. Variation in dinosaur skeletochronology
indicators: Implications for age assessment and physiology. Paleobiology 25: 295-
304.
Horner JR, Padian K, Ricqlès A de. 2001. Comparative osteohistology of some embryonic

124
and perinatal archosaurs: developmental and behavioral implications for dinosaurs.
Paleobiology 27: 39-58.
Hotton N. 1980. An alternative to dinosaur endothermy: The happy wanderers. In: Thomas
D, Olson EC., ed. A cold look at the warm blooded dinosaurs.: American Association
for the Advancement of Science Selected Symposium, Wetsview Press, 311-350.
Huene F, von. 1908. Die Dinosaurier der europäischen Triasformationen mit
Berücksichtigung der außereuropäischen Vorkommnisse. Geologische und
Paläontologische Abhandlungen. Jena Supplement 1: 1-419.
Huene F, von. 1926. Vollständige Osteologie eines Plateosauriden aus dem Schwäbischen
Keuper. Geologische und Paläontologische Abhandlungen. Jena Neue Folge Band
15: 139-179.
Huene F, von. 1928. Lebensbild des Sauriervorkommens im obersten Keuper von
Trossingen. Paleobiologica 1: 103-116.
Huene F, von. 1929. Die Plateosaurier von Trossingen. Umschau 1929: 880-882.
Huene F, von. 1932. Die fossile Reptil-Ordnung Saurischia, ihre Entwicklung und
Geschichte. Monographie Geologie Paläontologie Serie 1: 1-361.
Huene F, von. 1944. Arbeitserinnerungen. Selbstbiographien von Naturforschern 2: 1-52.
Hungerbühler A. 1998. Taphonomy of the prosauropod dinosaur Sellosaurus, and its
implications for carnivore faunas and feeding habits in the Late Triassic.
Palaeogeography, Palaeoclimatology, Palaeoecology 143: 1-29.
Jaekel O. 1913-14. Über die Wirbeltierfunde in der oberen Trias von Halberstadt.
Paläontologische Zeitschrift 1: 155-215.
Klein N. in prep. A turtle from the Late Triassic locality of Frick (northern Switzerland).
Klevezal GA. 1996. Recording structures of mammals: Determination of age and
reconstruction of life history. Rotterdam: Balkema.
Meyer HH, von. 1837. Mitteilung an Prof. Bronn (Plateosaurus engelhardti). Neues
Jahrbuch für Geologie und Paläontologie 1837: 316.
Moratalla JJ, Powell JE. 1994. Dinosaur nesting patterns. In: Carpenter K, Hirsch K.,
Horner JR., ed. Dinosaur Eggs and Babies. Cambridge: Cambridge University Press,
37-46.
Moser M. 2000. The influence of pedogenesis on the taxonomy of Plateosaurus. In: E. Frey
(Ed.). 5th European Workshop on Vertebrate Paleontology. Program. Abstracts.
Excursion Guides. Staatliches Museum für Naturkunde, Karlsruhe: 57.
Moser M. 2003. Plateosaurus engelhardti Meyer, 1837 (Dinosauria: Sauropodomorpha) aus
125
dem Feuerletten (Mittelkeuper, Obertrias) von Bayern. Zitteliana B 24: 188.
Neill WT. 1971. The Last of the Ruling Reptiles: Alligators, Crocodiles, and their kin. New
York and London.: Columbia University Press.
Padian K. 1997. Growth Lines. In: Currie PJ, Padian K., ed. Encyclopedia of dinosaurs. San
Diego: Academic Press, 288-291.
Padian K, Ricqles A de, Horner JR. 2001. Dinosaurian growth rates and bird origins.
Nature 412: 405.
Pooley AC, Gans G. 1976. The Nile Crocodile. Scientific American 234: 114-124.
Raath MA. 1990. Morphological variation in small theropods and its meaning in systematics:
evidence from Syntarsus rhodesiensis. In: Carpenter K, Currie PJ., ed. Dinosaur
Systematics. Approaches and Perspectives. Cambridge: Cambridge University Press,
93-105.
Reid REH. 1981. Lamellar-zonal bone with zones and annuli in the pelvis of a sauropod
dinosaur. Nature 292: 49-51.
Reid REH. 1987. Bone and dinosaurian "endothermy". Modern Geology 11: 133-154.
Reid REH. 1990. Zonal "growth rings" in dinosaurs. Modern Geology 15: 19-48.
Reid REH. 1997a. How dinosaurs grew. In: Farlow JO, Brett-Surman MK., ed. The complete
dinosaurs. Bloomington and Indianapolis: Indiana University Press, 403-413.
Reid REH. 1997b. Histology of bones and teeth. In: Currie PJ, Padian K., ed. Encyclopedia
of Dinosaurs. London: Academic Press, 329-339.
Remes K. 2004. Revision von "Barosaurus" africanus (Sauropoda, Diplodocinae) aus den
Tendaguru - Schichten Tansanias. unpublished master thesis, University of Berlin.
Ricqlès A, de. 1968. Recherches Palèohistologiques sur les os longs des tetrapodes. I.-
Origine du tissu osseux plexiforme des dinosaurians sauropodes. Annales de
Palèontologie 54: 133-145.
Ricqlès A, de. 1976. Recherches palèohistologiques sur les os longs des tètrapodes. VII. Sur
le classification, la significationfonctionelle et l' histoire des tissus osseux des
tètrapodes. Annales de Palèontologie 62: 71-126.
Ricqlès A, de. 1980. Tissue structures of dinosaur bone. Functional significance and possible
relation to dinosaur physiology. In: Thomas RDK and Olson EC, eds. A cold look at
the warm-blooded dinosaurs. American Association for the Advancement of Science.
Selected Symposium. Boulder, Colorado: Westview Press, 103-139.
Ricqlès A, de. 1983. Cyclical growth in the long limb bones of a sauropod dinosaur. Acta
Palaeontologica Polonica 28: 225-232.

126
Ricqlès A, de, Meunier FJ, Castanet J, Francillon-Vieillot H. 1991. Comparative
microstructure of bone. In: Hall BK, ed. Bone. Volume 3: Bone matrix and bone
specific products. Boca Raton: CRC Press, 1-78.
Rieber H. 1985a. Saurier und andere Fossilien von Frick. Frick Gestern Heute 1: 5-18.
Rieber H. 1985b. Der Plateosaurier von Frick. Uni Zürich. 1985: 3-4.
Rimblot-Baly F, Ricqles, A de, Zylberberg L. 1995. Analyse Paléohistologique d'une série
de croissance partille chez Lapparentosaurus madagascariensis (Jurassique Moyen):
Essai sur la dynamique de croissance d'un dinosaure sauropode. Annales de
Palèontologie (Invert - Vert.) 81: 49-86.
Rogner M. 1996. Schildkröten 2. Hürtgenwald: Heidi-Rogner-Verlag.
Sander PM, Klein N, Buffetaut E, Cuny G, Suteethorn V, LeLoeuff J. 2004. Adaptive
radiation in sauropod dinosaurs: Bone histology indicates rapid evolution of giant
body size through acceleration. Organisms, Diversity & Evolution 4: 165-173.
Sander PM, Tückmantel C. 2003. Bone lamina thickness, bone apposition rates, and age
estimates in sauropod humeri and femora. Paläontologische Zeitschrift 77: 161-172.
Sander PM. 1990. Skeletochronology in the small Triassic reptile Neusticosaurus. Annales
des Sciences Naturelles, Zoologie, Paris, Série 13, Vol. 11: 213-217.
Sander PM. 1992. The Norian Plateosaurus Bonebeds of central Europe and their
taphonomy. Palaeogeography, Palaeoclimatology, Palaeoecology 93 (1992): 255-
299.
Sander PM. 1998. Growth strategies of the Tendaguru sauropods: A paleohistological
perspektive. Journal of Vertebrate Paleontology 18: 74A (Abstract).
Sander PM. 1999a. Life history of the Tendaguru sauropods as inferred from long bone
histology. Mitteilungen aus dem Museum für Naturkunde der Humboldt-Univ. Berlin,
Geowissenschaftliche Reihe 2: 103-112.
Sander PM. 1999b. Die Norian Plateosaurus "Friedhöfe" im Keuper: Belege für einen
Massentod ? In: Hauschke N, Wild R., ed. Trias. Eine ganz andere Welt. Mitteleuropa
im frühen Erdmittelalter. München: Pfeil, 81-104.
Sander PM. 2000. Long bone histology of the Tendaguru sauropods: Implications for growth
and biology. Paleobiology 26.
Sander PM, Gee CT. 1989 a. Earthwatch-Freiwillige graben Fricker Dinosaurier aus. Uni
Zürich. 1989: 33-34.
Sander PM, Gee CT. 1989 b. Mit Earthwatch auf Dinosaurierjagd. Fossilien 4: 157-165.
Seebacher F. 2001. A new method to calculate allometric length-mass relationships of

127
dinosaurs. Journal of Vertebrate Paleontology 21: 51-60.
Seemann R. 1932. Verlauf und Ergebnis der Trosssinger Sauriergrabung. Jahreshefte des
Vereins für vaterländische Naturkunde. Wuerttemberg 88: LII-LIV.
Seemann R. 1933. Das Saurischierlager in den Keupermergeln bei Trossingen. Jahreshefte
des Vereins für vaterländische Naturkunde. Wuerttemberg 89: 129-160.
Seitz AL. 1907. Vergleichende Studien über den makroskopischen Knochenbau fossiler und
rezenter Reptilien. Nova Acta Academiae Caesareae Leopoldino-Carolinae
Germanicae Naturae Curiosorum 87: 230-370.
Sereno PC. 1989. Prosauropod monophyly and basal sauropodomorph phylogeny. Journal of
Vertebrate Paleontology Supplement no. 3.
Starck JM, Chinsamy A. 2002. Bone microstructure and developmental plasticity in birds
and other dinosaurs. Journal of Morphology 254: 232-246.
Upchurch P. 1997. Prosauropoda. In: Currie PJ, Padian K., ed. Encyclopedia of Dinosaurs.
London: Academic Press, 599-607.
Varricchio DJ. 1993. Bone microstructure of the Upper Cretacious theropod dinosaur
Troodon formosus. Journal of Vertebrate Paleontology 13: 99-104.
Varricchio DJ. 1997. Growth and embrylogy. In: Currie PJ and Padian K, eds. Encyclopedia
of Dinosaurs. London: Academic Press, 282-288.
Weishampel DB. 1984. Trossingen: E. Fraas, F. v. Huene, R. Seemann and the "Schwäbische
Lindwurm" Plateosaurus. In: Reif WE, Westphal, F., ed. 3rd Symposium of Mesozoic
Terrestrail Ecosystems. Tübingen: Attempto, 249-253.
Weishampel DB, Chapman RE. 1990. Morphometric study of Plateosaurus from
Trossingen (Baden-Würtemberg, BRD/Germany). In: Carpenter K, Currie PJ., ed.
Dinosaur Systematics: Perspectives and Approaches: Cambridge University Press, 43-
51.
Weishampel DB, Dodson P, Osmolska H. (eds.). 1990. The Dinosauria. Los
Angeles: University of California Press.
Weishampel DB, Westphal, F. 1986. Die Plateosaurier von Trossingen. Tübingen:
Attempto.
Wellnhofer P. 1993. Prosauropod dinosaurs from the Feuerletten (Middle Norian) of
Ellingen near Weissenburg in Bavaria. Revue de Paèobiologie Vol. spec. 7: 263-271.
Wikelski M, Thom C. 2000. Marine iguanas shrink to survive "El Nino". Nature 403: 37.
Wilson JA. 2002. Sauropod dinosaur phylogeny: Critique and cladistic analysis. Zoological
Journal of the Linnean Society 136: 217-276.

128
Wink CS, Elsev RM, Hill EM. 1987. Changes in femoral robusticity and porosity during the
reproductive cycle of the female alligator (Alligator misssissippiensis). Journal of
Morphology 193: 317-321.
Yates A. 2001. A new look at Thecodontosaurus and the origin of sauropod dinosaurs.
Journal of Vertebrate Paeontology 21: 116A.
Ziegler B. 1986. Der Schwäbische Lindwurm. Funde aus der Urzeit im Museum am
Löwentor: Konrad Theiss Verlag.
Zug GR, Rand St. 1987. Estimation of age in nesting female Iguana iguana: Testing
skeletochronology in a tropical lizard. Amphibia-Reptilia 8: 237-250.
Zug GR, Wynn AH, Ruckdeschel C. 1986. Age determination of loggerhead sea turtle,
Caretta caretta, by incremental growth marks in the skeleton. Smithsonian
contributions of zoology 427: 1-34.

1
Rheinische Friedrich-Wilhelms-Universität Bonn, September 2004
Institut für Paläontologie
Nussallee 8
53115 Bonn
Dipl.-Geol. Nicole Klein
Erklärung
Hiermit erkläre ich an Eides statt, daß ich für meine Promotion keine anderen als die
angegebenen Hilfsmittel benutzt habe, und daß die inhaltlich und wörtlich aus anderen
Werken entnommenen Stellen und Zitate als solche gekennzeichnet sind.
Nicole Klein


![4.6km 245kcal 0466-26-1911 C] 0466-27-4437 c 0466-29 …4.6km 245kcal 0466-26-1911 C] 0466-27-4437 c 0466-29-5875 ã3-13-37 [0 0466-25-7357 ©0466-34-5851 0466-50-5036 C.O.)](https://img.dokumen.tips/doc/110x75/61241088484f1a141f370c20/46km-245kcal-0466-26-1911-c-0466-27-4437-c-0466-29-46km-245kcal-0466-26-1911.jpg)