Embed Size (px)
Citation preview

Bondgraph modeling of thermo-fluid systems
ME270 Fall 2007
Stephen Moore
Professor Granda
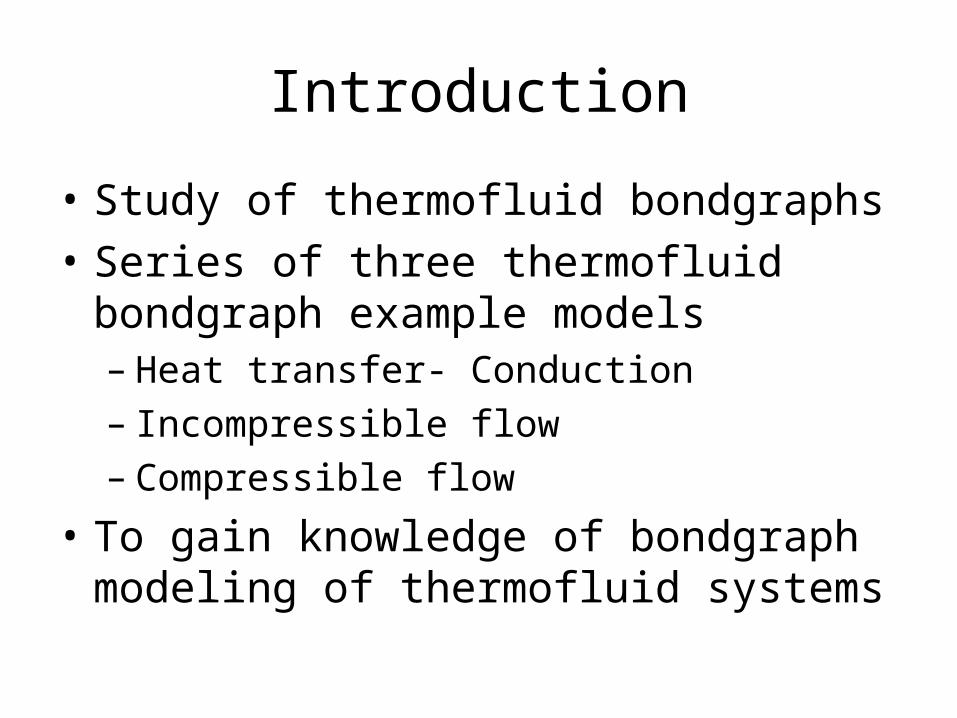
Introduction
• Study of thermofluid bondgraphs
• Series of three thermofluid bondgraph example models– Heat transfer- Conduction– Incompressible flow– Compressible flow
• To gain knowledge of bondgraph modeling of thermofluid systems

Heat transfer• Resistance is thermal • T- temperature • - heat flow • - entropy flow • Pseudo bonds
– T * ≠ Power
Note: Refer to Figure 12.1, “System Dynamics”
Q
S
QT1 T2
RT1 T2
1
S 2
S
S
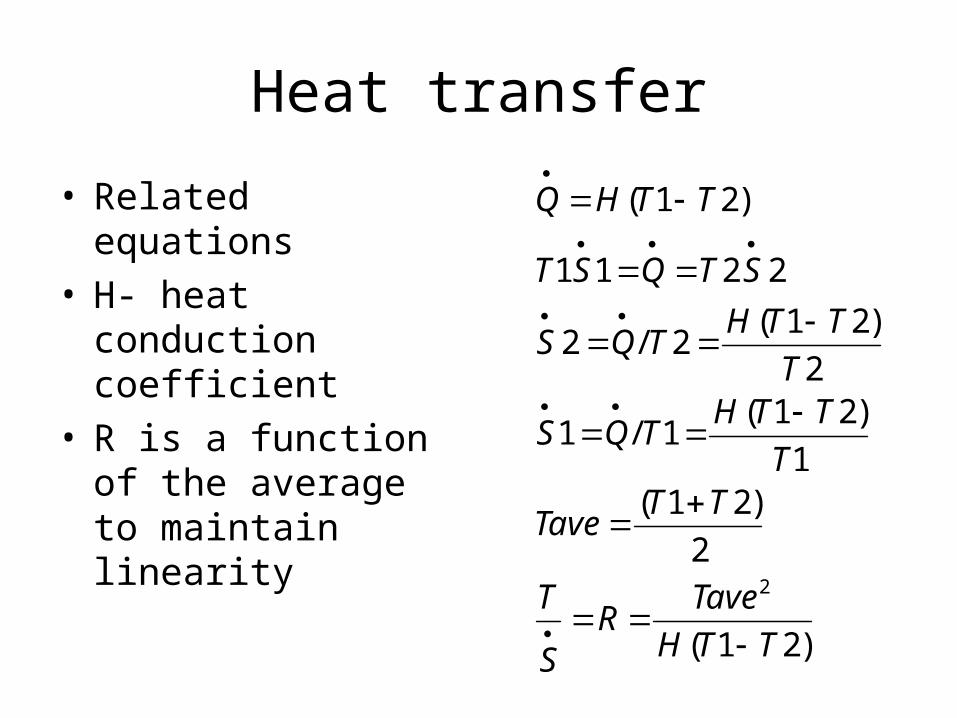
Heat transfer
• Related equations• H- heat conduction
coefficient • R is a function of the
average to maintain linearity
)21(
2
)21(1
)21(1/1
2
)21(2/2
2211
)21(
2
TTH
TaveR
S
T
TTTave
T
TTHTQS
T
TTHTQS
STQST
TTHQ

Heat transfer
• Results– Differential equations in Matlab are
developed from momentum and displacement- I and C elements
– Simulink used to display results

Heat transfer• Simulink model
T1 = 373K, T2 = 273KhGW = 0.037 W/mK
hAl = 237 W/mK
Glass Wool Aluminum

Tank emptying
• Incompressible, one-dimensional flow
• Model gives estimate of the time it takes to empty a tank
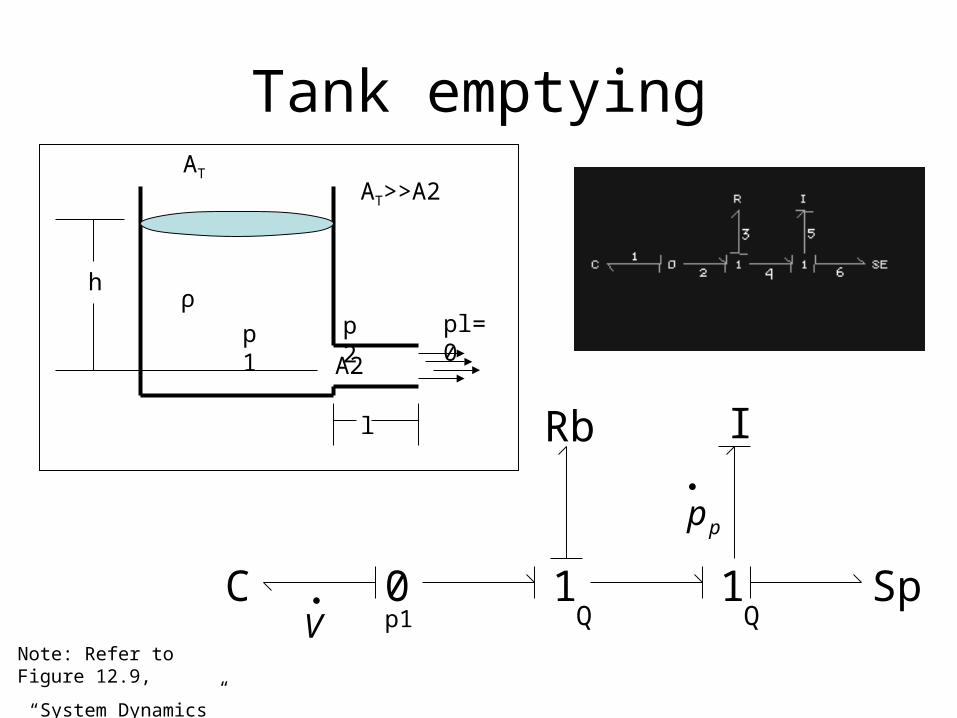
Tank emptyingAT
ρ
p1 p2
A2
pl=0
h
l
AT>>A2
0
V
pp
Rb
CQ
I
SpQ
1 1p1
Note: Refer to Figure 12.9,
“System Dynamics”

Tank emptying
• -Volumetric flow rate out of the tank
• -Rate of pressure momentum in the pipe
Tpp
p
A
gVp
L
A
Ap
pL
AV
2
222
2
2
V
pp
• Rb- Bernoulli resistance of pipe– Indicates a loss of kinetic energy
as the fluid leaves the system– Difficult to accurately determine
without experimental data• C - capacitance of the tank• I – inertia of the flow

Tank emptying
• System parameters– Water at ambient
conditions (μ, λ, ρ)– Tank diameter- 10 m– Tank depth- 10 m– Outlet pipe diameter-
0.5 m– Length- 1 m
• Resistance-
5625 N*s/m^5
Resistance was determined by P3/Q3
(R~ P3/Q3)
• Capacitance-
.008 m^4*s^2/kg
• Inertia-
4000 kg/m*s
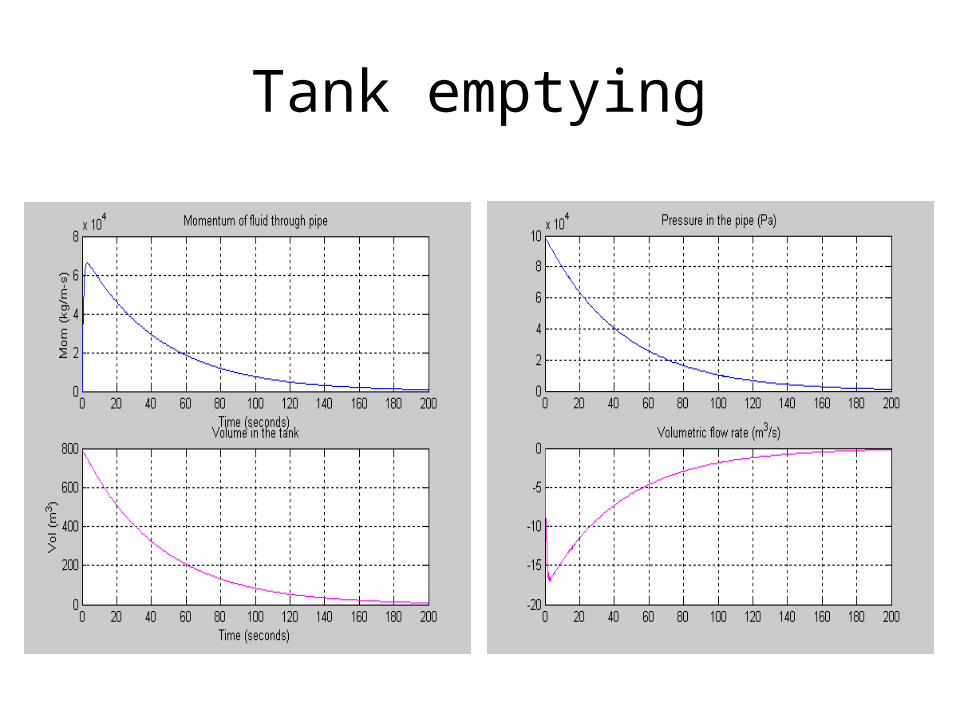
Tank emptying

Tank emptying

Tank emptying

Air cylinder
• Models compressible flow
• Capacitive fields
• Resistive fields
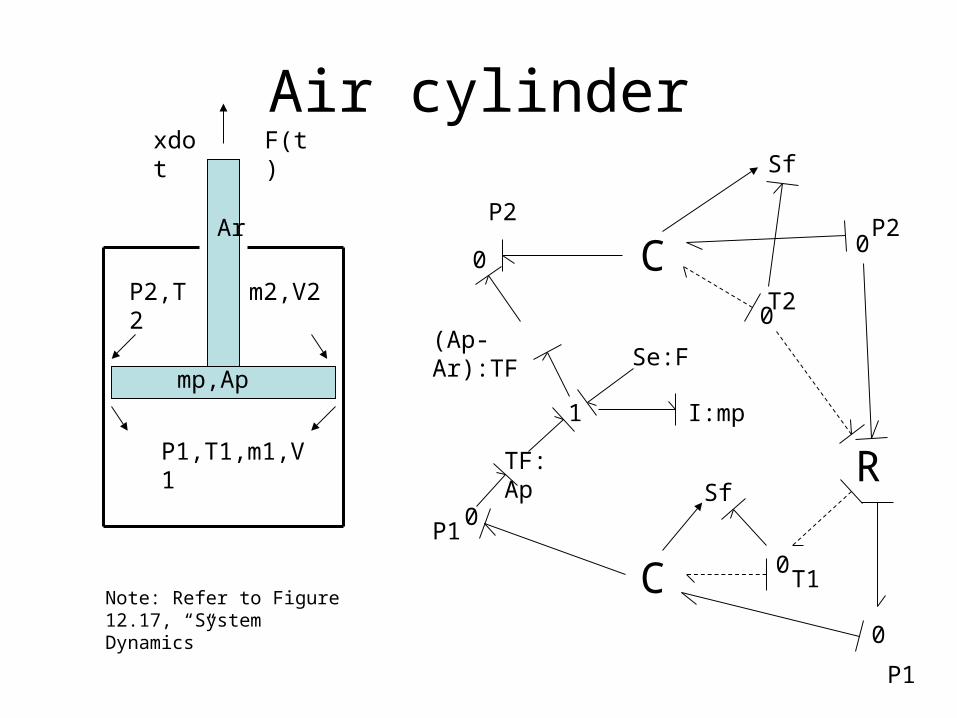
Air cylinderF(t)xdot
P1,T1,m1,V1
P2,T2 m2,V2
mp,Ap
Ar
P1
C
C
R0
1
00
0
0
0
Sf
Sf
Se:F
T1
P2
T2
P2
TF: Ap
(Ap-Ar):TF
P1
I:mp
Note: Refer to Figure 12.17, “System Dynamics”

Air cylinder
• The single R element with 4 bonds requires 16 values
• Two C elements 4 bonds each require 18 values
• The values are approximate values

Air cylinder
• The working fluid:– Air at 25oC and 100 KPa– Cp - 1005 N-m/Kg K– Cv - 718 N-m/Kg K– Volume - 0.012272 m3
– Mass – 0.014253 Kg– Lower chamber is empty– Upper chamber is full
• Geometry:– Cylindrical chamber– 0.25 m diameter– 0.25 m height– Mass cylinder is 3.4 kg
• Applied force– 25 N upward

Air cylinder• Results
– Volume in upper and lower chambers• Expect upper chamber to decrease volume and lower chamber to
increase volume with time

Air cylinder• Results
– Pressures in upper and lower chambers• Expect pressure in the upper chamber to increase while the lower
chamber decreases

Air cylinder• Results
– Mass flow in the chambers• Expect mass flow out of the upper chamber and into the lower
chamber

Air cylinder
• The model worked, however, the results obtained are incorrect
• The values of the R-field and C-field are based on rough approximations
• More work is required to adequately model the air cylinder

Conclusion
• Thermofluid bondgraphs are significantly different than typical bondgraphs
• Care must be taken to ensure the correct parameters are chosen for C, I and R elements, especially for R-fields, C-fields and I-fields
• Expect most thermofluid bondgraphs to represent non-linear systems
• CampG and Matlab obtains the differential equations easily.