Embed Size (px)
Citation preview
Board Groupthink
Jeffrey L. Colesa
Naveen D. Danielb Lalitha Naveenc
November 2014
Abstract
______________________________________________________________________________ Corporate boards are comprised of individual directors but make decisions as a group. The quality of their decisions affects firm value. In this study, we focus on one particular aspect of group dynamics, groupthink. Groupthink is described as a mode of thinking by highly cohesive groups where the desire for consensus and agreement by the group members overrides critical thinking and correct judgment. While board groupthink has been criticized by both academic and practitioners, ours is the first study to undertake a systematic investigation of the effect of groupthink on firm value. We develop four proxies for groupthink, based on the idea that greater interaction among group members leads to greater group cohesiveness which in turn leads to greater groupthink. We hypothesize that (i) groupthink negatively affects firm value, and (ii) groupthink will have a more negative effect on firm value for firms in dynamic industries (industries that are rapidly growing, are highly innovative, are experiencing increase in competitive environment, or have high merger activity). While we do not find support for the first prediction, we do find results consistent with our second prediction. Our results have implications for the appropriate design of corporate boards. ______________________________________________________________________________ JEL Classifications: G32; G34; K22 Keywords: Groupthink; Boards; Corporate governance; High-growth industries; Innovative industries, Fluid industries, Merger Intensity, Dynamic industries ______________________________________________________________________________ a David Eccles School of Business, University of Utah, Salt Lake City, UT 84112, USA; [email protected] b LeBow College of Business, Drexel University, Philadelphia, PA., 19104, USA; [email protected] c Fox School of Business, Temple University, Philadelphia, PA., 19122, USA; [email protected] We thank seminar participants at the New Ideas session at the Corporate Governance Conference at Drexel University, Temple University, and the University of Toronto, for helpful comments.
1
Board Groupthink
Corporate boards are groups of individuals who, among other things, make strategic
decisions on behalf of shareholders. The value of the firm will be dictated by the quality of the
decisions being made by the group. The quality of these decisions is greatly impacted by group
dynamics. Group dynamics has been extensively studied by social psychologists but financial
economists have rarely explored the impact of group dynamics on firm value. In this paper, we
focus on one particular aspect of group decision-making, groupthink. Our contribution is to
develop measures of board groupthink, and demonstrate empirically that the negative effect of
board groupthink to firm value is particularly detrimental to firms in industries that face
challenging and more dynamic environments (such as industries that experience rapid growth,
are more innovative, operate in more fluid product markets, or experience higher levels of
merger activity).
Groupthink is described in Janis’ (1971) pioneering work as a mode of thinking by highly
cohesive groups where the desire for consensus and agreement by the group members overrides
critical thinking and correct judgment. Dissenting opinions are ignored or discouraged by the
group in the interests of reaching a unanimous decision. Janis uses several case studies to
illustrate how a group of smart individuals could still make bad decisions due to group
dynamics––a kind of negative synergistic effect. Thus, corporate boards, even if they include
highly talented individuals, could still make costly mistakes if they suffer from groupthink.
Several industry participants have commented on the negative aspects of board
groupthink, blaming it for failures such as those at Enron and Worldcom as well as for the recent

2
financial crises.1 Similarly, a recent article in Forbes notes that “many companies have
individuals who serve as directors indefinitely, creating a situation where the board can become
stale and not open to new ideas and the perspectives of newer members.”2
PIMCO, one of the largest global investment firms, with nearly $2 trillion in assets under
management, goes to great lengths to avoid groupthink in its decision-making. In its annual
meeting where the firm attempts to predict secular trends that will drive markets in the future, it
specifically invites speakers who are outside the firm and new hires that are not yet influenced by
the PIMCO way of thinking, with the stated objective of avoiding groupthink.3 The Institutional
Shareholder Services (ISS) encourages avoidance of groupthink through its governance rating
system, which states that "[l]imiting [nonexecutive] director tenure allows new directors to the
board to bring fresh perspectives.” CALPERS, similarly, announced in 2011 that they were
developing a new digital resource devoted to finding “untapped diverse talent to serve on
corporate boards” and that this would be “an important step towards challenging groupthink in
corporate boardrooms.”
Academic research reinforces the idea that groupthink leads to bad group-decision-
making. Benabou (2012) develops a model to explain corporate cultures characterized by
groupthink and provides several examples of negative consequences associated with groupthink
1 See “The Death of Groupthink” (Bloomberg Businessweek, 2/5/2008), “Diversity fails to end boardroom groupthink" (Financial Times online, 5/25/2009), “Banks: A better black-swan repellent” (Economist, 2/18/2010), and “Toyota, Accelerating into trouble” (Economist, 2/11/2012). 2 Sarbanes-Oxley 10 Years Later: Boards Are Still the Problem (Forbes, 7/29/2012) 3 In the 2010 Economic Outlook posted on PIMCO’s website, Mohamed El-Erian, the CEO of PIMCO writes, “Once again, we were privileged to listen to presentations by four global thought leaders who exposed us to fresh perspectives,…, And, once again, our new class of MBAs and PhDs enlightened us with their views of the world…”(refer http://www.pimco.com/Documents/Secular%20Outlook%20May_10%20WEB.pdf)
3
(see page 10 of his online appendix). Shiller attributes the Fed’s failure to forecast the financial
crises to groupthink.4 Adams, Hermalin, and Weisbach (2010) do not specifically discuss
groupthink, but note the paucity of research on board decision-making. They argue that it is
important to understand how board decisions are affected by group dynamics, particularly since
such decisions have a great impact on firm value. Our work is an attempt at addressing this gap
in the literature.
Groupthink is not desirable for any organization. Thus, our first hypothesis (H1) is that
firm value will decline with groupthink. It is not clear, however, at what level of groupthink we
will be able to detect a significant negative relation with firm value. We predict that the effect of
groupthink on firm value will vary with firm and industry characteristics. Specifically, for firms
that operate in stable product and factor markets, groupthink may be relatively less harmful, and
may even be beneficial to the extent that it speeds up decision making. This is because the
business environment does not require that the board make any decisions that change firm
strategy––the current status quo is effective. For certain other firms, however, groupthink may
be more harmful. For instance, firms in dynamic industries (industries that are rapidly growing,
highly innovative, have fluid product markets, or those that experience high merger activity)
require the board to evaluate several alternatives and pick the best given the information
available. Managerial discretion is greater in such firms, and thus the role of the board is
potentially more important. But boards that are subject to groupthink “limit [their] discussions to
a few alternative courses of action (often only two) without an initial survey of all the
alternatives that might be worthy of consideration” (Janis, 1971). Thus, greater groupthink
4 Challenging the Crowd in Whispers, Not Shouts, New York Times (11/1/2008)
4
should reduce firm value in such firms. Based on the arguments above, we propose our second
hypothesis (H2): Groupthink will have a more negative effect on firm value for firms in
dynamic industries.
To test our hypotheses, we first construct proxies for groupthink and industry dynamism.
We develop four proxies for groupthink, based on the idea that greater interaction among group
members leads to greater group cohesiveness, which in turn leads to greater groupthink (Janis,
1971). The first measure, Overlap, measures the extent of overlap in directors’ service. The idea
here is that spending time together over a prolonged period creates cohesiveness, which breeds
groupthink. Thus a board where many pairs of directors have substantial overlap in terms of
their tenure on the board will have higher groupthink, all else equal. We compute this measure
as follows. For a board with n directors, for each of the nC2 pairs, we estimate the number of
years that the pair has been together on this board. We then average this overlap across all the
nC2 pairs. The bigger this number, the greater is the board groupthink.
Our second measure of groupthink, Dirtenure, is the average of the tenures of all the
directors. The third measure, Fracdir9, is the fraction of directors that has been on the board for
9 years or more. We choose the cutoff of 9 years since this is the median of director tenure.5
Finally, to extract the common information in all these proxies, we use factor analysis (as in
Coles, Daniel, and Naveen (2008)) and form a factor score––termed Groupthink–– using the
natural logarithm of Overlap, the natural logarithm of Dirtenure, and Fracdir9. The correlation
among the three proxies is in the range of 0.82 to 0.89. The correlation between the factor and
the individual components is in excess of 0.90.
5 Interestingly, ISS suggests closer scrutiny of firms with greater average director tenure, arguing that such boards get less independent and lack fresh ideas. See http://www.issgovernance.com/policy-gateway/2014-policy-information/

5
We construct five proxies for more challenging industry environments. For ease of
exposition, we term these as our dynamism proxies since our measures capture the extent to
which industry conditions are changing quickly. Our proxies are: (i) Industry Growth, which is
the average annual sales growth of all firms in the industry. (ii) Industry R&D, which is an
indicator variable that equals one if the average ratio of research and development expenses to
assets at the industry level is above the 75th percentile value. We choose the 75th percentile value
because more than 60% of firms do not have any R&D. (iii) Industry Fluidity, which is the
average (at the industry level) of the fluidity scores of Hoberg, Phillips, and Prabhala (2014).
Hoberg et al. develop their fluidity scores based on a text-based search of firms’ product
descriptions in their 10K filings. They argue that a firm’s fluidity score captures changes in the
firm’s product market due to moves made by competitors. (iv) Industry Mergers, which is the
number of mergers in the industry scaled by the number of firms in that industry (see, for
example, Harford (2005)). The higher this value, the bigger the changes to the industry
environment (see, for example, Harford (2005)). (v) Finally, we construct a Dynamism index,
which is the sum of 4 indicator variables. We start with the industry averages of sales growth,
R&D to assets, fluidity, and industry mergers. We compute the 50th percentile level of these
measures (75th for R&D to assets) for each year across all industries. We define an indicator
variable that equals one if the value of the industry average is above the 50th percentile for that
year (75th for R&D to assets) across all industries, and equals zero otherwise. Dynamism is the
sum of the four indicator variables and, thus, varies from 0 to 4. Greater values of this measure
indicate more dynamic industries.
We test our hypotheses using board data for a large cross-section of firms (S&P 1500
firms) for a long time-period (1996-2010). In keeping with much of the corporate governance

6
literature, we use Tobin’s q as a measure of firm value.6 This is the sum of the market value of
equity plus book value of debt divided by the book value of assets.
We find that, on average, groupthink has no effect on firm value. This is inconsistent
with our first prediction. However, consistent with our second prediction, we find strong
evidence that the effect of groupthink on firm value is more negative in dynamic industries. Our
results are not driven by director diversity (based on gender or country of origin), governance
(CEO and Chairman duality, board co-option, institutional blockholding, and the governance
score of Gompers, Ishii, and Metrick (2003)), or firm age, all of which could be correlated with
groupthink. We find that the negative effect of groupthink on firm value for dynamic industries
is concentrated in firms with smaller boards and in firms that have boards with fewer outside
connections. This is consistent with the idea that groupthink is higher in smaller boards and in
boards with fewer outside connections.
Our results are also robust if we define industry dynamism based on the time-series rather
than on the cross-section. Specifically, for each of our four main dynamism proxies, we define
an indicator variable that equals one if the value of the industry average is above the 50th
percentile (75th percentile for R&D to assets) across all years for each industry (rather than
across all industries within a year), and equals zero otherwise. Time-series Dynamism is the sum
of the four indicator variables.
One potential concern in most studies of corporate finance is endogeneity. We believe
that endogeneity is less of a concern in our study for two reasons. First, our inclusion of firm
fixed-effects in all the regressions controls for any firm-level omitted variables that are time
6 See for example, Morck, Shleifer, and Vishny (1988), McConnell and Servaes (1990), Hermalin and Weisbach (1991), and Yermack (1996)
7
invariant. Our year fixed effects control for any changes in the macro environment that might
affect both groupthink and firm value. Second, we use industry-level values of dynamism rather
than firm-level values. Regardless, we cannot rule out that endogeneity could be driving our
results because we do not have a clean instrument or natural experiment.
Our study has implications for policies specifying term limits for directors. This issue
has been the focus of debate, with many governance advocates calling for term limits. The idea
is that groupthink is more likely when the board is overly cohesive, which in turn is more likely
when the same set of directors stays on the board for a long time together. Our finding that
groupthink is detrimental to firm value suggests that setting term limits for directors may be
important, particularly in dynamic industries.
We organize the remainder of our paper as follows. In Section I, we discuss the data and
present summary statistics. In Section II we present our key results, while in Section III, we
consider the robustness of our results to alternative explanations and alternative specifications.
Section IV concludes.
I. Data and Summary Statistics
Our starting point is the RiskMetrics database, which covers directors of S&P500, S&P
MidCap, and S&P SmallCap firms. We obtain data for the period 1996-2010. RiskMetrics
presents the board data separately for the period 1996-2007 (legacy dataset) and for the period
2008 onwards. We use the procedure described in Coles, Daniel, and Naveen (2014) to merge
the two datasets and clean the director data. We obtain accounting data from Compustat and
stock return data from CRSP. We exclude firms incorporated outside the U.S. Measures of
product market fluidity are from the online data provided by Hoberg and Phillips
8
(http://www.rhsmith.umd.edu/industrydata/). The data provides the fluidity for each firm, which
we average across all firms in each industry-year.
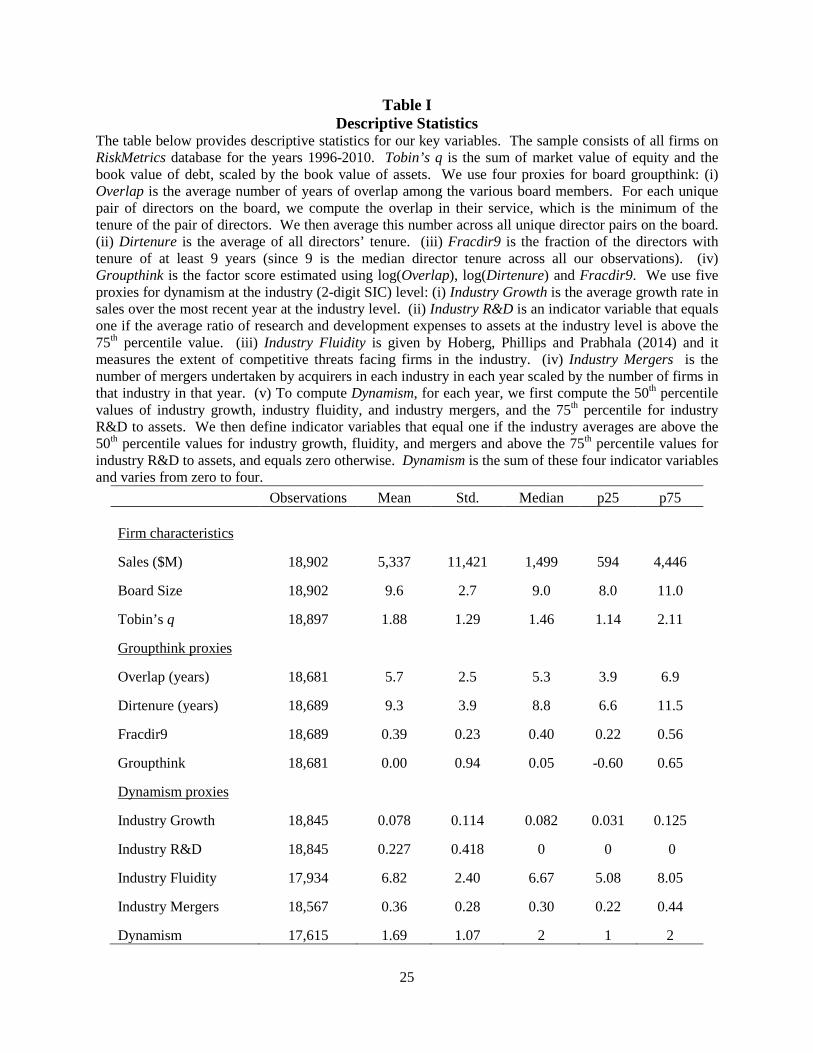
Table I presents the summary statistics. The Appendix provides details of all variables
used. We winsorize all variables at the 1st and 99th percentile levels in order to minimize the
impact of outliers. The average sales for firms in our sample is $5,337 million and the average
board has about 10 directors (median = 9). The average Tobin’s q is 1.88.
In terms of our proxies for groupthink, the average Overlap is 5.7, which means that, on
average, any pair of directors in our sample has served together on the same board for 5.7 years.
Thus, directors appear to spend a lot of time together in common board service. The average
director tenure (Dirtenure) is 9.3 and the average of Fracdir9 (i.e., fraction of directors who have
served together on a firm’s board for more than 9 years) is 39%.
Obviously, there is correlation across our three groupthink measures. To extract the
common variation in these variables, we compute the factor score, Groupthink, based on the
logarithm of Overlap, the logarithm of Dirtenure, and Fracdir9. The table indicates that the
factor score (computed separately for each firm-year) has a mean of 0.00 and a standard
deviation of 0.94.
The last part of the Table presents our dynamism measures. The average industry sales
growth is 7.8% per year. The average R&D for the firms in the high-R&D industries (not shown
in table) is 14.7%. The product market fluidity measure has a mean of 6.82. The higher this
variable, the higher is the change in competitive threats faced by the industry. This variable is
derived from business descriptions in firms’ annual 10-K statements obtained using web-
9
crawling scripts. Fluidity reflects moves by rival firms competing in a firm's product space.7
Intuitively, fluidity is greater when the words in the firm’s business description overlap more
with the words of the rivals’ business description. Since our fluidity variables are at the industry
level, they reflect the aggregate threats faced by the industry.8
To estimate Industry Mergers, we obtain data from SDC on the number of merger
announcements made by US public acquirers, with reported deal value greater than $1 million.
We then scale the number of deals by the number of firms in that industry in that year. The
average of Industry Mergers is 0.36.
Finally, we form an index variable, Dynamism, for each firm-year to capture the
combined effect of the above measures. For each year, we first compute the 50th percentile
values of average industry sales-growth, average industry fluidity, and average industry mergers,
and the 75th percentile for average industry R&D to assets. We then define an indicator variable
that equals one if the industry averages for sales growth, fluidity, and industry mergers are
greater than the 50th percentile values and equals zero otherwise. For R&D to assets, the
indicator variable equals one if the average R&D to assets for the industry is greater than the 75th
percentile values and equals zero otherwise. Dynamism is the sum of these four indicator
variables and thus, varies from 0 to 1. The mean in our sample is 1.69 and the median is 2.0.
Industries that score high on Dynamism during our sample period include
communications (AT&T, Verizon etc.) in the 1997-2001 period and chemicals & allied products
(Alpharma, Abbott Labs etc.) in 2007-2010. Industries that score low on Dynamism during our
sample period (all years) include textile mill products (Burlington Industries, Fruit of the Loom
7 To get a better sense for how this variable is derived, refer the example provided in Appendix 2 of Hoberg et al. 8 We thank N.R. Prabhala for providing us with more insight into this variable.
10
etc.), paper (International Paper, Georgia Pacific etc.), food (Heinz, Hershey etc.) and lumber
(Louisiana-Pacific, Weyerhauser etc.).
Table II reports the correlations between our various proxies for groupthink (Panel A)
and the correlations between our proxies for industry dynamism (Panel B). As expected, our
variables for groupthink are all highly correlated. The correlation between the natural logarithm
of Overlap, and the natural logarithm of Dirtenure is 0.89, and that between log(Overlap) and
Fracdir9 (the fraction of the board with tenure more than 9 years) is 0.82. Groupthink, as
expected, is highly positively correlated (correlations>0.90) with all three measures.
In terms of the proxies for industry dynamism, there appears to be substantially less
correlation among the various measures we use (Panel B of Table II). This is not too surprising
as our measures here are called “dynamism measures” for ease of exposition, but in fact
represent different stages of the industry life-cycle (innovation, growth, greater competitive
threats, and greater industry consolidation).
II. Main Results
We present below tests of the two predictions of the paper.
A. Impact of Groupthink on q: Univariate Evidence
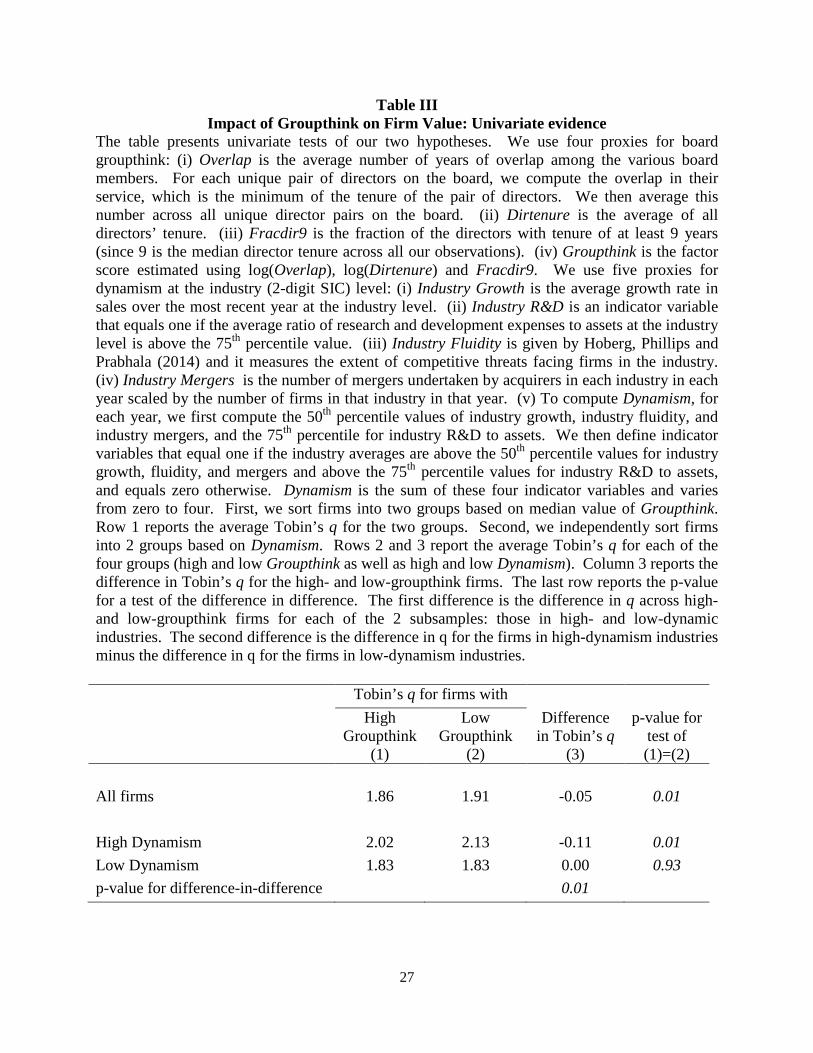
Our first prediction is that firm value will be negatively related to groupthink. Table III
reports the results of the test of this prediction. We sort firms into 2 groups based on median
values of Groupthink. We find that the Tobin’s q for firms with high Groupthink is smaller than
for firms with low Groupthink (1.86 versus 1.91) and this difference is statistically significant (p
= 0.014). These results are consistent with our first prediction. The economic significance of
11
these results, however, is weak. The difference in Tobin’s q across the two groups (= –0.05) is
2.7% of the average q (given a mean q of 1.88).
Our second prediction is that the effect of groupthink on firm value is more negative for
firms in dynamic industries. To test this, we also sort firms (independently) into two groups
based on median value of Dynamism. We find that in firms with high values of Dynamism,
Tobin’s q is smaller for firms with high Groupthink compared to firms with low Groupthink
(2.02 versus 2.13, difference = –0.11). This difference is statistically significant (p<0.01).
Interestingly, we do not observe this pattern for firms in industries with low values of Dynamism.
In such firms, Tobin’s q is not significantly different across high and low Groupthink firms (1.83
for both groups), difference = 0.00, p = 0.93). The difference in difference (= –0.11–0 = –0.11)
is significant both statistically (p = 0.01) and economically (about 6% of mean q). These results
are consistent with our prediction that, in dynamic industries, groupthink has a more negative
effect on firm value.
The inferences are generally similar (in untabulated results) when we use the three
individual components underlying the Groupthink factor (Overlap, Dirtenure, and Fracdir9)
with Dynamism. Similarly, when we use the four components underlying the Dynamism factor
(Industry Growth, Industry R&D, Industry Fluidity, and Industry Mergers) in conjunction with
Groupthink, results follow a similar pattern, except that the results for Industry Growth and
Industry R&D are weaker. Overall, the univariate evidence suggests that, on average, groupthink
leads to lower firm value, and this effect is due to firms in dynamic industries.
B. Impact of Groupthink on q: Multivariate Evidence
Next, we test our prediction in a multivariate setting. Our dependent variable is Tobin’s
q and our key explanatory variables include the Groupthink factor as a proxy for board
12
groupthink, our proxies for industry dynamism, and the interaction of these two variables. Table
IV presents the results. All other explanatory variables are as in Coles, Daniel, and Naveen
(2008). All regressions, both here and through the rest of the paper, include firm-fixed effects
and year-fixed effects. Also, here and through the rest of the paper, t-statistics are based on
standard errors that are adjusted for firm-level clustering.
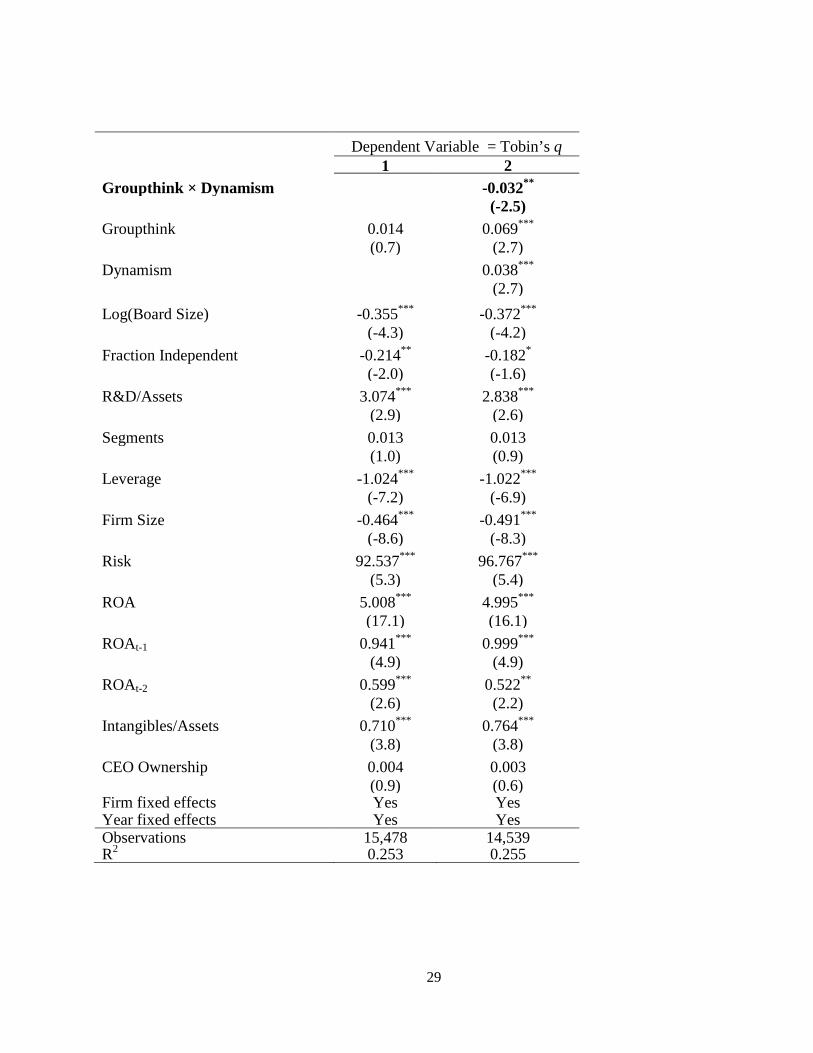
In the first column of Table IV, we examine the effect of groupthink on firm value for the
full sample of firms. The coefficient on the Groupthink is 0.014, and this is statistically
insignificant (p-value = 0.47). In terms of economic significance, the results indicate that when
Groupthink increases from the 25th to 75th percentile value (an increase of 1.25 in our data),
Tobin’s q increases by 0.018 (= 1.25 × 0.014). This represents a change of 0.9% relative to the
mean q. Thus in economic terms also, the result is insignificant. On average, groupthink does
not impact firm value.
We next turn to our prediction that the effect of groupthink on firm value will be more
negative in dynamic industries. In column 2, we examine the effect of Dynamism, which
captures the common variation in growth, innovation, product market fluidity, and merger
intensity. The variable of interest is the interaction of Groupthink with Dynamism. The
coefficient on this variable is negative and significant (= –0.032, p-value = 0.02). This shows
that as industry dynamism increases, the effect of groupthink on q becomes more negative,
which is consistent with our prediction.9
9 In our regressions to this point, we use firm-fixed effects and, therefore, do not include industry dummies. One concern may be that the relation between groupthink and q that we document is due to some (omitted) industry-level variable that is correlated with q. To address this concern, we use industry-adjusted q (Tobin’s q of the firm minus the median Tobin’s q of the industry) as the dependent variable. The results are very similar to our main results.
13
The coefficient on Groupthink Factor is positive and statistically insignificant, but recall
that this is the coefficient for firms that have Dynamism = 0. Only 15% of our sample firms is in
this category. The total effect of groupthink on firm value turns negative when Dynamism = 2.2.
Dynamism, by construction, can only take 5 possible values: 0, 1, 2, 3, or 4. The distribution of
Dynamism is as follows: Dynamism = 0 for 15% of the firms, ≤ 1 for 44% of firms, ≤ 2 for 76%
of firms and ≤ 3 for 96% of firms. Thus, the total effect of groupthink on firm value is negative
for about 24% (= 100% – 76%) of the sample.
C. Using Underlying Components of Groupthink
In this subsection, we test whether our results hold if we consider the variables used to
construct Groupthink. Panel A of Table V presents the results. We estimate the same
specification as in Column 2 of Table IV, but replace Groupthink with log(Overlap) in Column
1, log(Dirtenure) in Column 2 , and Fracdir9 in Column 3. In all cases, we use the Dynamism
index as our measure of industry dynamism. In all cases, for brevity, we show only the results
relating to the main variables of interest––the interaction of Groupthink with Dynamism.
In column 1, we find that the coefficient on the interaction variable is negative and
statistically significant (coefficient = –0.053, p-value = 0.04), indicating that, as overall industry
dynamism increases, the effect of groupthink (proxied by log(Overlap)) on q becomes more
negative. In Column 2, we use log(Dirtenure) as the proxy for groupthink. We continue to find
that the interaction term is significantly negative (coefficient = –0.091, p-value < 0.01). Finally,
in Column 3, we use Fracdir9 as our measure of groupthink and find the same result. The
coefficient of the interaction of Fracdir9 with Dynamism is negative and significant (coefficient
= –0.121, p-value = 0.02).
14
The coefficient on Groupthink is positive in all specifications. This implies that the
effect of groupthink on q for firms whose Dynamism = 0 is positive. As stated earlier, fewer than
15% of firms belong to this category. The total effect of groupthink on firm value turns negative
when Dynamism equals 2.3, 1.8, and 2.4 for the 3 specifications. Thus, using the distribution of
Dynamism given above, the total effect of groupthink on firm value is negative for 24%, 56%,
and 24% of the sample.
D. Using Underlying Components of Dynamism
In this subsection, we test whether our results hold if we consider the underlying
variables used to construct Dynamism. We estimate the same specification as in Column 2 of
Table IV, but replace Dynamism with each of the four individual dynamism proxies. In all cases,
we use the Groupthink factor. Panel B of Table V reports the results.
In column 1, we use Industry Growth and the interaction of Groupthink with Industry
Growth. We find that the coefficient on the interaction of Groupthink with Industry Growth is
negative (= –0.178) and statistically significant (p-value = 0.03). This is consistent with our
prediction that the effect of groupthink on firm value is more negative in high growth industries.
Column 2 of Panel B reports the results using Industry R&D. Once again, we see that the
coefficient on the interaction term (Groupthink × Industry R&D) is negative and statistically
significant (= –0.080, p-value = 0.06). This indicates that in firms that are in highly innovative
industries, the effect of groupthink on firm value is more negative relative to firms that are in less
innovative industries. Once again, the results are consistent with our prediction.
In column 3, we use Industry Fluidity. The coefficient on the interaction of Groupthink
with Industry Fluidity is negative and significant (= –0.011, p-value = 0.08). Finally, Column 4
reports the results using Industry Mergers. As before, the results are consistent with our
15
prediction. The coefficient on the interaction term (Groupthink × Industry Mergers) is negative
and statistically significant (= –0.223, p-value = 0.03). This indicates that in firms that are in
more merger-intensive industries, the effect of groupthink on firm value is more negative relative
to firms that are in less merger-intensive industries.
The coefficient on Groupthink is positive and significant in 3 of the 4 specifications.
Recall that this is the effect of groupthink on q for firms that have the corresponding dynamism
measure = 0. The total effect of groupthink on firm value turns negative at about the 85th, 78th,
75th, and 100th percentile value of Industry Growth, Industry R&D, Industry Fluidity, and
Industry Merger respectively. Thus, the total effect of groupthink on firm value is negative for
15%, 22%, 25%, and 0% of the sample.
Overall, the results confirm our earlier finding that the effect of groupthink on firm value
is negative in industries that are rapidly growing, where the firm needs to be more innovative,
where the product markets are rapidly changing, and where the merger intensity is high.
III. Alternative Explanations and Robustness
Having established our main results, we explore in more detail whether alternative
explanations are consistent with our results. We also consider the robustness of our results to
alternative specifications.
A. Time-series Dynamism
In our results so far, we use the cross-sectional values of Dynamism. Thus some
industries could have consistently (over time) low values of Dynamism while others could have
consistently high values. For example, as mentioned earlier, industries like paper, textiles, food
etc. have consistently low values of Dynamism. These industries, however, could still be subject
16
to shocks in the time-series. To address this, we construct an alternative Dynamism measure,
which we term as Time-Series Dynamism. For each year, we first form the industry levels of
sales growth, R&D, fluidity, and mergers as before. For each industry, we then compute the 50th
percentile values of average industry sales-growth, average industry fluidity, and average
industry mergers, and the 75th percentile for average industry R&D to assets using the time series
of these values within that industry. Finally, we define an indicator variable that equals one if
the averages of industry growth, industry fluidity, and industry mergers for a given year are
greater than the 50th percentile values and equals zero otherwise. For R&D to assets, the
indicator variable equals one if the average industry R&D to assets for a given year is greater
than the 75th percentile values and equals zero otherwise. Time-Series Dynamism is the sum of
these four indicator variables and, thus, varies from 0 to 4, with a mean of 1.65 (which is similar
to the cross-section Dynamism variable).
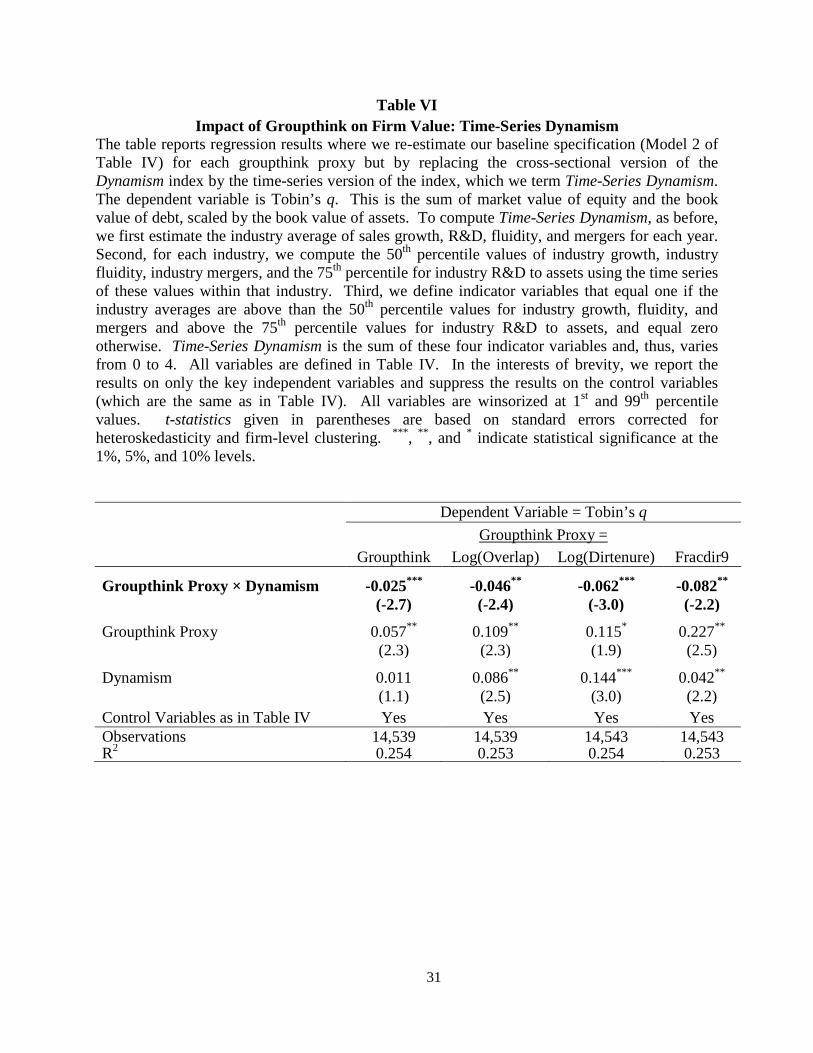
Table VI reports the results where we replicate Model 2 of Table IV using the 4 proxies
for groupthink but with Time-series Dynamism. In all cases, as expected, we find the coefficient
on the interaction term to be significantly negative at the 5% level or better.
B. Diversity
In this section, we measure diversity along two dimensions: gender (fraction of female
directors on the board) as well as based on country of origin (fraction of foreign directors on the
board).
One view is that diversity in boards reduces the negative effect of groupthink.10 The call
for greater female representation on boards in several European countries stem from this idea
10 See “The Death of Groupthink”, Bloomberg Businessweek (2/5/2008) and “Why Directors Should Champion Diversity”, by the Managing Partner of Ernst & Young in Director Journal (November 2010).
17
that diversity can reduce groupthink. In Norway a new law passed in 2003 required that women
should constitute 40% of boards of Norwegian firms. More recently, the UK government
appointed a commission, which recommended that women should constitute at least 25% of the
boards of FTSE 100 firms.
A contrasting point of view is that diversity does not help reduce groupthink because the
board members who represent the minority are frequently too intimidated to criticize other
directors.11 Also, absent regulation, boards would pick the best possible directors for the firm,
but faced with constraints in terms of regulations requiring a certain percentage of women or
minorities, boards are forced to make choices that may be suboptimal. In support of this latter
view, Ahern and Dittmar (2012) examine the effect of the Norwegian regulation requiring
greater representation of women on boards. They find that the constraint imposed by the quota
caused a significant drop in the stock price at the announcement of the law and a large decline in
Tobin’s q over the following years. Adams and Ferreira (2009) find that mandating gender
quotas for directors can reduce value in well-governed firms. We, therefore, examine the impact
of gender diversity on our results.
The rationale for considering diversity along the dimension of director nationality stems
from recent work that discusses the role of foreign directors (country of origin of the directors is
outside the U.S.) on the boards of U.S. firms. These directors are shown to be weak monitors but
good advisors (Masulis, Wang, and Xie, 2012; Daniel, McConnell, and Naveen, 2013),
particularly in multi-national corporations. Indeed, Daniel et al. find that these directors are most
valuable when their country of origin has a business culture that is very different from that of the
11 See “Diversity fails to end boardroom groupthink”, FT.com (5/25/2009) and “Why Diversity can Backfire”, WSJ.com(6/14/2012).
18
U.S. For example, a foreign director from a civil law country would be more valuable to a U.S.
firm than one from a common law country because the director’s expertise would be particularly
valuable to the board. This also suggests that boards that have a greater proportion of foreign
directors may have less groupthink because the foreign director would have a different
perspective.
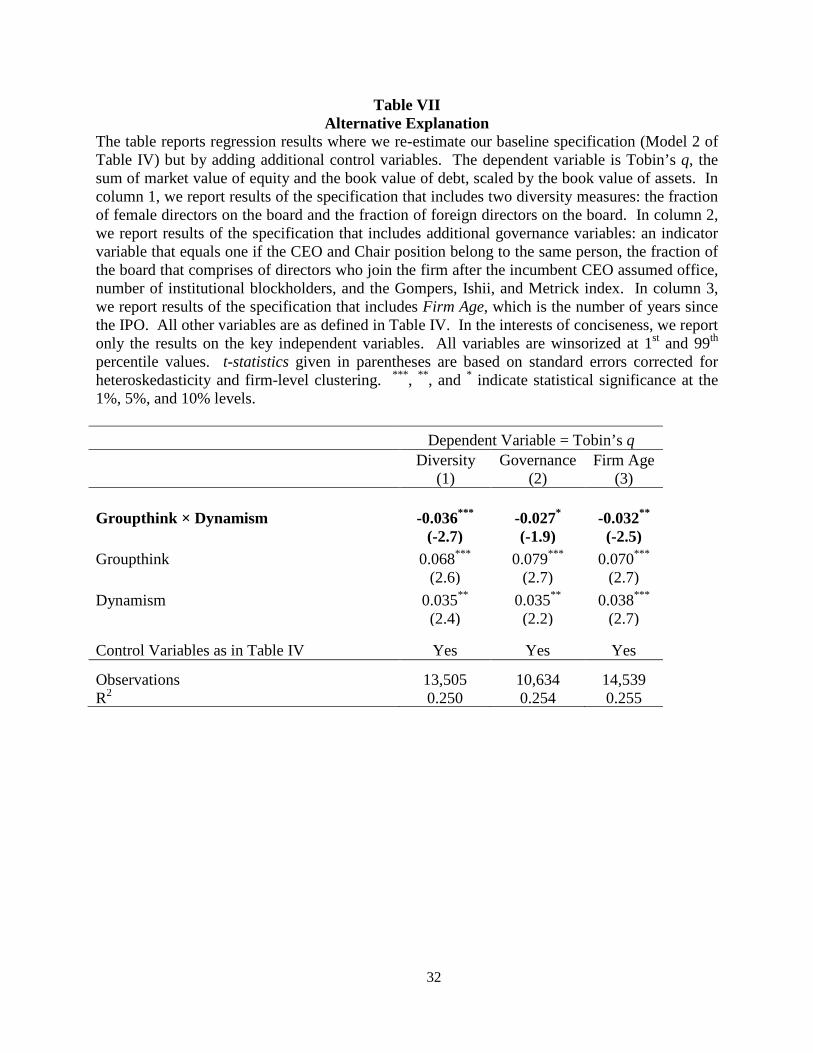
In our first specification in Table VII, we control for diversity in the regressions and
examine whether groupthink still has a negative effect on q. We include both diversity measures
as additional variables in our baseline specification (Column 2 of Table IV). As before, we only
report the results on key variables of interest. The coefficient of the interaction of Groupthink
and Dynamism is significantly negative (= –0.036, p-value < 0.01) indicating that groupthink has
a negative effect on firm value even after controlling for board diversity.
Additionally, we sort firms into two groups based on high and low values for each of the
two diversity measures and then estimate the baseline regression for each of these groups
separately. In untabulated results, the interaction of Groupthink with Dynamism is significantly
negative in the high group for fraction female directors, but is not significant in the low group of
fraction female directors. For fraction of foreign directors, we find that the coefficient is not
significant in the high group, but is significantly negative in the low group. It appears that
inclusion of female directors on the board does not mitigate the problem of groupthink, but
inclusion of foreign directors on the board does appear to reduce the harmful effect of
groupthink.
C. Governance
In our baseline regression, we use the same set of control variables as in Coles, Daniel,
and Naveen (2008). It is possible, however, that an omitted governance variable could be
19
leading to lower q as well as higher groupthink. Therefore, we include several additional
governance variables in our regression specification. Specifically, we include CEO duality (an
indicator variable that equals one if the same individual serves as both CEO and Chairman of the
board), board co-option (the fraction of the board comprised of directors with tenure less than the
CEO as in Coles, Daniel, and Naveen (2014)), the governance index of Gompers, Ishii, and
Metrick (2003), and the number of institutional blockholders.
Column 2 of Table VII reports the results. We find that controlling for additional
governance variables does not qualitatively change our results. The coefficient on the interaction
of Groupthink with Dynamism continues to be negative and statistically significant (= –0.027, p–
value = 0.06), indicating that groupthink has a negative effect on firm value for firms in more
dynamic industries.
D. Firm Age
It is possible that our results obtain because of our failure to include firm age in our main
regressions. In particular, Tobin’s q is negatively related to firm age as older firms have fewer
growth options. Older firms may also have more groupthink because directors have had a
chance to be together for a longer period. We, therefore, include firm age as an additional
variable in the baseline regression specification. We find (column 3 of Table VII) that our main
results remain. The coefficient on the interaction of Groupthink with Dynamism is negative and
statistically significant (= –0.032, p–value = 0.02).
E. Board Size and Board Connections
In this sub-section, we examine additional implications of our hypotheses. Our proxies
for groupthink are based on the idea that directors who spend more time interacting only with
one another lack fresh perspective, and such boards are subject to groupthink. The degree to
20
which groupthink sets in will depend on the size of the board. It will take longer for groupthink
to take root in a larger board (compared to a smaller board) even though both boards may have
the same meeting frequency (and may meet for the same amount of time). This is because it will
take more time for directors in a larger board to develop cohesiveness (and therefore
groupthink), relative to directors in a smaller board. Thus, we expect the negative impact of
groupthink on firm value in dynamic industries to be weaker in firms with larger boards.
The degree to which groupthink sets in will also depend on the number of outside
connections that each board member has. It will take longer for groupthink to take root in a
board with greater number of outside connections (compared to a board with fewer outside
connections) even though both boards may have the same size. This is because the board with
more outside connections will have access to a larger set of viewpoints. Thus, we expect the
negative impact of groupthink on firm value in dynamic industries to be weaker in firms with
more outside connections.
To test these hypotheses, we sort firms into two groups based on the median board size
each year and two groups based on the number of outside connections each year. Board
connections is computed as in Coles et al. (2012). For each director, we first add up the number
of outside directors that he or she is directly connected to by virtue of board service in another
firm. We then cumulate this across all directors on the board and get the number of unique
outside connections for the entire board.
Columns 1 and 2 of Table VIII report the results for the small- and large-board
subsamples for our baseline specification (Model 2 of Table IV). Columns 3 and 4 report the
results for boards with low- and high-connections subsamples. The results indicate that the
negative effect of groupthink on q for firms in dynamic industries is concentrated in the
21
subsample with smaller boards and those with fewer connections: the coefficient on the
interaction of Groupthink with Dynamism is negative and significant only for the small-board
subsample and low-connections subsample.
The results indicate that the negative effect of groupthink on q for firms in dynamic
industries is concentrated in the subsample with low outside connections. The coefficient on the
interaction of Groupthink with Dynamism is negative and significant only for this subsample,
and is insignificant for the high-connections subsample.
Overall, these results are consistent with our main hypotheses and point to the benefits (in
terms of new perspectives) of having larger boards and more connected boards.
IV. Conclusions
Despite a large number of papers devoted to the topic of corporate boards, we know very
little about how boards work as social groups and how board decision-making affects firms.
Gaining some insight into the board decision-making process is important, as the dynamics of
the board will affect the quality of decisions made by the board, which in turn will impact firm
value. In this study, we examine one aspect of group decision-making––groupthink––and its
impact on firm value. Groupthink is characterized in the literature on social psychology as a
mode of thinking in highly cohesive groups, wherein critical thinking is suppressed in the
interests of arriving at a unanimous decision.
We hypothesize that firms that face challenging environments will suffer greatly from
board groupthink. Firms that face quickly-changing environments require a board to evaluate
several potentially risky alternatives and pick the best given the information available. But a
board that is subject to groupthink “limits [their] discussions to a few alternative courses of
22
action (often only two) without an initial survey of all the alternatives that might be worthy of
consideration.” [Janis, 1971]
Our proxies for groupthink are based on the idea that greater cohesiveness is associated
with greater groupthink (Janis (1971)). Greater cohesiveness comes from group members being
together on the board for a long time. Our measures include board overlap (which is the overlap
in tenure for any pair of directors averaged across all possible director pairs on the board),
average director tenure, and the fraction of the board than has a tenure greater than the median
director tenure of 9 years.
We construct several proxies for industries that face more challenges. These are based on
the average industry growth, average industry R&D to assets, average product market fluidity for
the industry, and merger intensity of the industry. The fluidity measure is based on Hoberg et al.
(2014) measure of fluidity, which is designed to capture changing threats to the firms from
rivals.
Overall, we do not find that groupthink is negatively related to firm value. We find,
however, that groupthink has a more negative effect on firm value in dynamic industries. Our
results have important implications for recent proposals limiting director tenure.
23
References
Adams, R., D. Ferreira, 2009. Women in the boardroom and their impact on governance and performance? Journal of Financial Economics 94, 291-309.
Adams, R., B. Hermalin, and M. Weisbach, 2010. The role of boards of directors in corporate governance: a conceptual framework and survey. Journal of Economic Literature 48, 58-107.
Ahern, K. R., Ditmar, A. K., 2012. The changing of the boards: the impact on firm valuation of mandated female board representation, Quarterly Journal of Economics 127, 137-197.
Benabou, R., 2012. Groupthink: collective delusions in organizations and markets. Review of Economic Studies, Forthcoming.
Coles, J., N. Daniel, and L. Naveen, 2008. Boards: does one size fit all? Journal of Financial Economics 87, 329-356.
Coles, J., N. Daniel, and L. Naveen, 2012. Board Advising. Working Paper, University of Utah, Drexel University, and Temple University.
Coles, J., N. Daniel, and L. Naveen, 2014. Co-opted boards. Review of Financial Studies 27, 1751-1796.
Harford, J., 2005. What drives merger waves? Journal of Financial Economics 77, 529-560.
Hermalin, B., M. Weisbach, 1991. The effects of board composition and direct incentives on firm performance. Financial Management 20, 101-112.
Hoberg, G., G. Phillips, 2010. Product market synergies and competition in mergers and acquisitions: a text-based analysis. Review of Financial Studies 23, 3773-3811.
Hoberg, G., G. Phillips, 2014. Text-based network industries and endogenous product differentiation. Working paper, University of Southern California and University of Maryland.
Hoberg, G., G. Phillips, and N. Prabhala, 2014. Product Market Threats, Payouts, and Financial Flexibility. Journal of Finance, Forthcoming.
Janis, 1971. Groupthink. Psychology Today 5, 43-46, 74-76
Masulis, R., Wang, C., and Xie, F., 2012. Globalizing the boardroom: The effect of foreign directors on corporate governance and firm performance. Journal of Accounting and Economics, 53, 527-551.
McConnell, J., N. Daniel, and L. Naveen, 2013. The advisory role of foreign directors in U.S. firms. Working Paper, Purdue University, Drexel University, and Temple University.

24
McConnell, J., Servaes, H., 1990. Additional evidence on equity ownership and corporate value. Journal of Financial Economics 27, 595-612.
Morck, R., Shleifer, A., Vishny, R., 1988. Management ownership and market valuation: an empirical analysis. Journal of Financial Economics 20, 293-315.
Yermack, D., 1996, Higher market valuation of companies with a small board of directors, Journal of Financial Economics, 40, 185-212.
25
Table I Descriptive Statistics
The table below provides descriptive statistics for our key variables. The sample consists of all firms on RiskMetrics database for the years 1996-2010. Tobin’s q is the sum of market value of equity and the book value of debt, scaled by the book value of assets. We use four proxies for board groupthink: (i) Overlap is the average number of years of overlap among the various board members. For each unique pair of directors on the board, we compute the overlap in their service, which is the minimum of the tenure of the pair of directors. We then average this number across all unique director pairs on the board. (ii) Dirtenure is the average of all directors’ tenure. (iii) Fracdir9 is the fraction of the directors with tenure of at least 9 years (since 9 is the median director tenure across all our observations). (iv) Groupthink is the factor score estimated using log(Overlap), log(Dirtenure) and Fracdir9. We use five proxies for dynamism at the industry (2-digit SIC) level: (i) Industry Growth is the average growth rate in sales over the most recent year at the industry level. (ii) Industry R&D is an indicator variable that equals one if the average ratio of research and development expenses to assets at the industry level is above the 75th percentile value. (iii) Industry Fluidity is given by Hoberg, Phillips and Prabhala (2014) and it measures the extent of competitive threats facing firms in the industry. (iv) Industry Mergers is the number of mergers undertaken by acquirers in each industry in each year scaled by the number of firms in that industry in that year. (v) To compute Dynamism, for each year, we first compute the 50th percentile values of industry growth, industry fluidity, and industry mergers, and the 75th percentile for industry R&D to assets. We then define indicator variables that equal one if the industry averages are above the 50th percentile values for industry growth, fluidity, and mergers and above the 75th percentile values for industry R&D to assets, and equals zero otherwise. Dynamism is the sum of these four indicator variables and varies from zero to four.
Observations Mean Std. Median p25 p75
Firm characteristics
Sales ($M) 18,902 5,337 11,421 1,499 594 4,446
Board Size 18,902 9.6 2.7 9.0 8.0 11.0
Tobin’s q 18,897 1.88 1.29 1.46 1.14 2.11
Groupthink proxies
Overlap (years) 18,681 5.7 2.5 5.3 3.9 6.9
Dirtenure (years) 18,689 9.3 3.9 8.8 6.6 11.5
Fracdir9 18,689 0.39 0.23 0.40 0.22 0.56
Groupthink 18,681 0.00 0.94 0.05 -0.60 0.65
Dynamism proxies
Industry Growth 18,845 0.078 0.114 0.082 0.031 0.125
Industry R&D 18,845 0.227 0.418 0 0 0
Industry Fluidity 17,934 6.82 2.40 6.67 5.08 8.05
Industry Mergers 18,567 0.36 0.28 0.30 0.22 0.44
Dynamism 17,615 1.69 1.07 2 1 2

26
Table II Correlations
The table below reports the correlations among the proxies for board groupthink and among the proxies for industry dynamism. We use four proxies for board groupthink: (i) Overlap is the average number of years of overlap among the various board members. For each unique pair of directors on the board, we compute the overlap in their service, which is the minimum of the tenure of the pair of directors. We then average this number across all unique director pairs on the board. (ii) Dirtenure is the average of all directors’ tenure. (iii) Fracdir9 is the fraction of the directors with tenure of at least 9 years (since 9 is the median director tenure across all our observations). (iv) Groupthink is the factor score estimated using log(Overlap), log(Dirtenure) and Fracdir9. We use five proxies for dynamism at the industry (2-digit SIC) level: (i) Industry Growth is the average growth rate in sales over the most recent year at the industry level. (ii) Industry R&D is an indicator variable that equals one if the average ratio of research and development expenses to assets at the industry level is above the 75th percentile value. (iii) Industry Fluidity is given by Hoberg, Phillips and Prabhala (2014) and it measures the extent of competitive threats facing firms in the industry. (iv) Industry Mergers is the number of mergers undertaken by acquirers in each industry in each year scaled by the number of firms in that industry in that year. (v) To compute Dynamism, for each year, we first compute the 50th percentile values of industry growth, industry fluidity, and industry mergers, and the 75th percentile for industry R&D to assets. We then define indicator variables that equal one if the industry averages are above the 50th percentile values for industry growth, fluidity, and mergers and above the 75th percentile values for industry R&D to assets, and equals zero otherwise. Dynamism is the sum of these four indicator variables and varies from zero to four.
Panel A: Groupthink Proxies
Log(Overlap) Log(Dirtenure) Fracdir9 Groupthink
Log(Overlap) 1.00 Log(Dirtenure) 0.89 1.00
Fracdir9 0.82 0.84 1.00 Groupthink 0.96 0.97 0.90 1.00
Panel B: Dynamism Proxies
Industry Growth
Industry R&D
Industry Fluidity
Industry Mergers
Industry Growth 1.00 Industry R&D -0.002 1.00 Industry Fluidity 0.06 0.04 1.00 Industry Mergers 0.05 0.27 0.13 1.00
27
Table III Impact of Groupthink on Firm Value: Univariate evidence
The table presents univariate tests of our two hypotheses. We use four proxies for board groupthink: (i) Overlap is the average number of years of overlap among the various board members. For each unique pair of directors on the board, we compute the overlap in their service, which is the minimum of the tenure of the pair of directors. We then average this number across all unique director pairs on the board. (ii) Dirtenure is the average of all directors’ tenure. (iii) Fracdir9 is the fraction of the directors with tenure of at least 9 years (since 9 is the median director tenure across all our observations). (iv) Groupthink is the factor score estimated using log(Overlap), log(Dirtenure) and Fracdir9. We use five proxies for dynamism at the industry (2-digit SIC) level: (i) Industry Growth is the average growth rate in sales over the most recent year at the industry level. (ii) Industry R&D is an indicator variable that equals one if the average ratio of research and development expenses to assets at the industry level is above the 75th percentile value. (iii) Industry Fluidity is given by Hoberg, Phillips and Prabhala (2014) and it measures the extent of competitive threats facing firms in the industry. (iv) Industry Mergers is the number of mergers undertaken by acquirers in each industry in each year scaled by the number of firms in that industry in that year. (v) To compute Dynamism, for each year, we first compute the 50th percentile values of industry growth, industry fluidity, and industry mergers, and the 75th percentile for industry R&D to assets. We then define indicator variables that equal one if the industry averages are above the 50th percentile values for industry growth, fluidity, and mergers and above the 75th percentile values for industry R&D to assets, and equals zero otherwise. Dynamism is the sum of these four indicator variables and varies from zero to four. First, we sort firms into two groups based on median value of Groupthink. Row 1 reports the average Tobin’s q for the two groups. Second, we independently sort firms into 2 groups based on Dynamism. Rows 2 and 3 report the average Tobin’s q for each of the four groups (high and low Groupthink as well as high and low Dynamism). Column 3 reports the difference in Tobin’s q for the high- and low-groupthink firms. The last row reports the p-value for a test of the difference in difference. The first difference is the difference in q across high- and low-groupthink firms for each of the 2 subsamples: those in high- and low-dynamic industries. The second difference is the difference in q for the firms in high-dynamism industries minus the difference in q for the firms in low-dynamism industries.
Tobin’s q for firms with
Difference in Tobin’s q
(3)
p-value for test of (1)=(2)
High Groupthink
(1)
Low Groupthink
(2)
All firms 1.86 1.91 -0.05 0.01 High Dynamism 2.02 2.13 -0.11 0.01 Low Dynamism 1.83 1.83 0.00 0.93 p-value for difference-in-difference 0.01
28
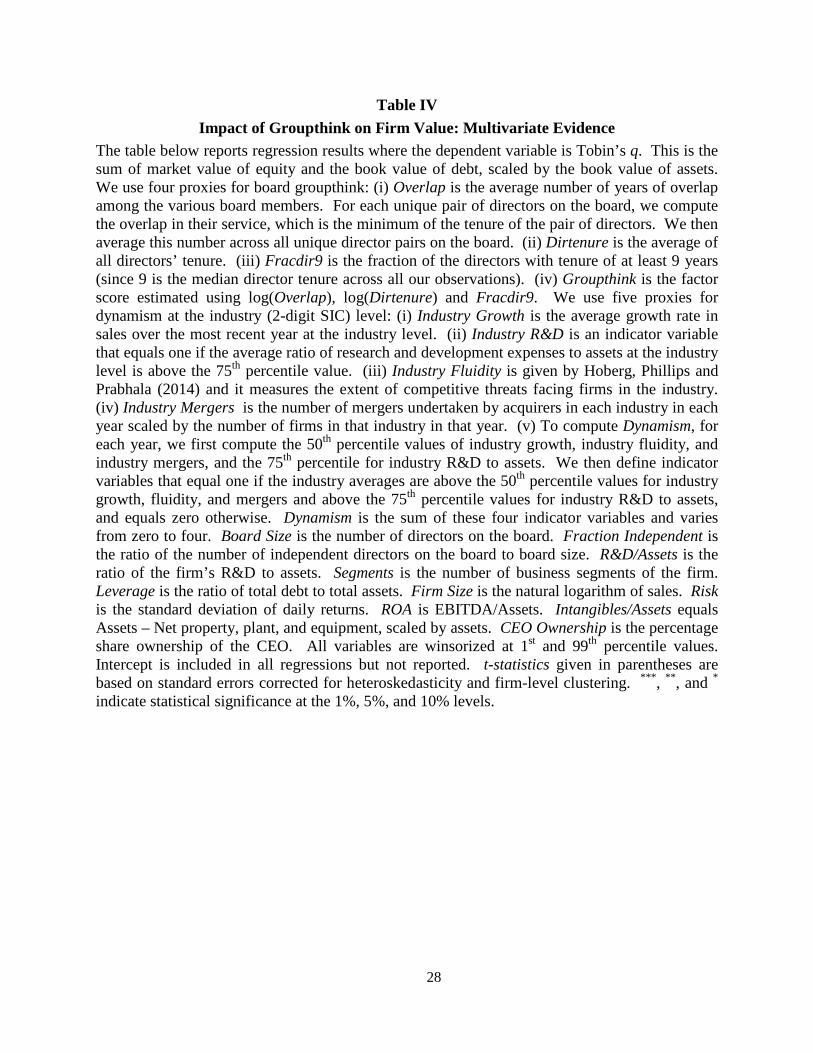
Table IV Impact of Groupthink on Firm Value: Multivariate Evidence
The table below reports regression results where the dependent variable is Tobin’s q. This is the sum of market value of equity and the book value of debt, scaled by the book value of assets. We use four proxies for board groupthink: (i) Overlap is the average number of years of overlap among the various board members. For each unique pair of directors on the board, we compute the overlap in their service, which is the minimum of the tenure of the pair of directors. We then average this number across all unique director pairs on the board. (ii) Dirtenure is the average of all directors’ tenure. (iii) Fracdir9 is the fraction of the directors with tenure of at least 9 years (since 9 is the median director tenure across all our observations). (iv) Groupthink is the factor score estimated using log(Overlap), log(Dirtenure) and Fracdir9. We use five proxies for dynamism at the industry (2-digit SIC) level: (i) Industry Growth is the average growth rate in sales over the most recent year at the industry level. (ii) Industry R&D is an indicator variable that equals one if the average ratio of research and development expenses to assets at the industry level is above the 75th percentile value. (iii) Industry Fluidity is given by Hoberg, Phillips and Prabhala (2014) and it measures the extent of competitive threats facing firms in the industry. (iv) Industry Mergers is the number of mergers undertaken by acquirers in each industry in each year scaled by the number of firms in that industry in that year. (v) To compute Dynamism, for each year, we first compute the 50th percentile values of industry growth, industry fluidity, and industry mergers, and the 75th percentile for industry R&D to assets. We then define indicator variables that equal one if the industry averages are above the 50th percentile values for industry growth, fluidity, and mergers and above the 75th percentile values for industry R&D to assets, and equals zero otherwise. Dynamism is the sum of these four indicator variables and varies from zero to four. Board Size is the number of directors on the board. Fraction Independent is the ratio of the number of independent directors on the board to board size. R&D/Assets is the ratio of the firm’s R&D to assets. Segments is the number of business segments of the firm. Leverage is the ratio of total debt to total assets. Firm Size is the natural logarithm of sales. Risk is the standard deviation of daily returns. ROA is EBITDA/Assets. Intangibles/Assets equals Assets – Net property, plant, and equipment, scaled by assets. CEO Ownership is the percentage share ownership of the CEO. All variables are winsorized at 1st and 99th percentile values. Intercept is included in all regressions but not reported. t-statistics given in parentheses are based on standard errors corrected for heteroskedasticity and firm-level clustering. ***, **, and * indicate statistical significance at the 1%, 5%, and 10% levels.
29
Dependent Variable = Tobin’s q
1 2 Groupthink × Dynamism -0.032**
(-2.5) Groupthink 0.014 0.069*** (0.7) (2.7) Dynamism 0.038*** (2.7) Log(Board Size) -0.355*** -0.372*** (-4.3) (-4.2) Fraction Independent -0.214** -0.182* (-2.0) (-1.6) R&D/Assets 3.074*** 2.838*** (2.9) (2.6) Segments 0.013 0.013 (1.0) (0.9) Leverage -1.024*** -1.022*** (-7.2) (-6.9) Firm Size -0.464*** -0.491*** (-8.6) (-8.3) Risk 92.537*** 96.767*** (5.3) (5.4) ROA 5.008*** 4.995*** (17.1) (16.1) ROAt-1 0.941*** 0.999*** (4.9) (4.9) ROAt-2 0.599*** 0.522** (2.6) (2.2) Intangibles/Assets 0.710*** 0.764*** (3.8) (3.8) CEO Ownership 0.004 0.003 (0.9) (0.6) Firm fixed effects Yes Yes Year fixed effects Yes Yes Observations 15,478 14,539 R2 0.253 0.255

30
Table V Impact of Groupthink on Firm Value: Robustness to Groupthink and Dynamism Proxies
The table reports regression results where we re-estimate our baseline specification (Model 2 of Table IV) but by replacing Groupthink factor by the individual components of groupthink (Panel A) and by replacing Dynamism index by the individual components of dynamism (Panel B). The measures of groupthink are log(Overlap), log(Dirtenure), and Fracdir9 and the measures of Dynamism are Industry Growth, Industry R&D, Industry Fluidity and Industry Mergers. The dependent variable is Tobin’s q. This is the sum of market value of equity and the book value of debt, scaled by the book value of assets. All variables are defined in Table IV. In the interests of brevity, we report the results on only the key independent variables and suppress the results on the control variables (which are the same as in Table IV). All variables are winsorized at 1st and 99th percentile values. t-statistics given in parentheses are based on standard errors corrected for heteroskedasticity and firm-level clustering. ***, **, and * indicate statistical significance at the 1%, 5%, and 10% levels.
Panel A: Proxies for Groupthink Dependent Variable = Tobin’s q Groupthink Proxy = Log(Overlap) Log(Dirtenure) Fracdir9
Groupthink Proxy × Dynamism -0.053** -0.091*** -0.121**
(-2.1) (-3.1) (-2.3)
Groupthink Proxy 0.122** 0.160*** 0.293*** (2.4) (2.7) (3.1)
Dynamism 0.125*** 0.232*** 0.085*** (2.7) (3.4) (3.2) Control Variables as in Table IV Yes Yes Yes Observations 14,539 14,543 14,543 R2 0.254 0.255 0.255
Panel B: Proxies for Dynamism
Dependent Variable = Tobin’s q Dynamism Proxy =
Industry Growth
Industry R&D
Industry Fluidity
Industry Mergers
Groupthink × Dynamism Proxy -0.178** -0.080* -0.011* -0.223**
(-2.2) (-1.9) (-1.8) (-2.1)
Groupthink 0.029 0.038** 0.088* 0.096** (1.5) (2.0) (1.9) (2.4)
Dynamism Proxy -0.128* 0.054 0.045*** 0.363*** (-1.7) (0.9) (3.4) (2.9) Control Variables as in Table IV Yes Yes Yes Yes Observations 15,446 15,446 14,803 15,206 R2 0.255 0.255 0.254 0.257
31
Table VI Impact of Groupthink on Firm Value: Time-Series Dynamism
The table reports regression results where we re-estimate our baseline specification (Model 2 of Table IV) for each groupthink proxy but by replacing the cross-sectional version of the Dynamism index by the time-series version of the index, which we term Time-Series Dynamism. The dependent variable is Tobin’s q. This is the sum of market value of equity and the book value of debt, scaled by the book value of assets. To compute Time-Series Dynamism, as before, we first estimate the industry average of sales growth, R&D, fluidity, and mergers for each year. Second, for each industry, we compute the 50th percentile values of industry growth, industry fluidity, industry mergers, and the 75th percentile for industry R&D to assets using the time series of these values within that industry. Third, we define indicator variables that equal one if the industry averages are above than the 50th percentile values for industry growth, fluidity, and mergers and above the 75th percentile values for industry R&D to assets, and equal zero otherwise. Time-Series Dynamism is the sum of these four indicator variables and, thus, varies from 0 to 4. All variables are defined in Table IV. In the interests of brevity, we report the results on only the key independent variables and suppress the results on the control variables (which are the same as in Table IV). All variables are winsorized at 1st and 99th percentile values. t-statistics given in parentheses are based on standard errors corrected for heteroskedasticity and firm-level clustering. ***, **, and * indicate statistical significance at the 1%, 5%, and 10% levels. Dependent Variable = Tobin’s q
Groupthink Proxy =
Groupthink Log(Overlap) Log(Dirtenure) Fracdir9
Groupthink Proxy × Dynamism -0.025*** -0.046** -0.062*** -0.082**
(-2.7) (-2.4) (-3.0) (-2.2)
Groupthink Proxy 0.057** 0.109** 0.115* 0.227** (2.3) (2.3) (1.9) (2.5)
Dynamism 0.011 0.086** 0.144*** 0.042** (1.1) (2.5) (3.0) (2.2) Control Variables as in Table IV Yes Yes Yes Yes Observations 14,539 14,539 14,543 14,543 R2 0.254 0.253 0.254 0.253
32
Table VII Alternative Explanation
The table reports regression results where we re-estimate our baseline specification (Model 2 of Table IV) but by adding additional control variables. The dependent variable is Tobin’s q, the sum of market value of equity and the book value of debt, scaled by the book value of assets. In column 1, we report results of the specification that includes two diversity measures: the fraction of female directors on the board and the fraction of foreign directors on the board. In column 2, we report results of the specification that includes additional governance variables: an indicator variable that equals one if the CEO and Chair position belong to the same person, the fraction of the board that comprises of directors who join the firm after the incumbent CEO assumed office, number of institutional blockholders, and the Gompers, Ishii, and Metrick index. In column 3, we report results of the specification that includes Firm Age, which is the number of years since the IPO. All other variables are as defined in Table IV. In the interests of conciseness, we report only the results on the key independent variables. All variables are winsorized at 1st and 99th percentile values. t-statistics given in parentheses are based on standard errors corrected for heteroskedasticity and firm-level clustering. ***, **, and * indicate statistical significance at the 1%, 5%, and 10% levels.
Dependent Variable = Tobin’s q
Diversity
(1) Governance
(2) Firm Age
(3) Groupthink × Dynamism -0.036*** -0.027* -0.032**
(-2.7) (-1.9) (-2.5)
Groupthink 0.068*** 0.079*** 0.070*** (2.6) (2.7) (2.7) Dynamism 0.035** 0.035** 0.038*** (2.4) (2.2) (2.7)
Control Variables as in Table IV Yes Yes Yes
Observations 13,505 10,634 14,539 R2 0.250 0.254 0.255

33
Table VIII Impact of Groupthink on Firm Value: Influence of Board Size and Connections
The table reports regression results where we re-estimate our baseline specification (Model 2 of Table IV) for various subsamples. The dependent variable is Tobin’s q, which is the sum of market value of equity and the book value of debt, scaled by the book value of assets. Board Size is the number of directors on the board. Outside Connections is computed as follows. For each firm, we compute the number of unique outside directors that each director on that firm is connected to, and then we cumulate this number across all directors for that firm. Small and large board subsamples are based on the median board size for each year. Low and high outside connections subsamples are based on the median outside connections for each year. All other variables are as defined in Table IV. In the interests of conciseness, we report only the results on the key independent variables. All variables are winsorized at 1st and 99th percentile values. t-statistics given in parentheses are based on standard errors corrected for heteroskedasticity and firm-level clustering. ***, **, and * indicate statistical significance at the 1%, 5%, and 10% levels.
Dependent Variable = Tobin’s q Board size Outside connections
Small Large
Low High Groupthink × Dynamism -0.037** -0.006 -0.041** -0.022
(-2.2) (-0.4) (-2.3) (-1.2)
Groupthink 0.061* 0.043 0.068* 0.056 (1.8) (1.1) (1.8) (1.5) Dynamism 0.055*** 0.003 0.057*** 0.027 (2.9) (0.2) (2.8) (1.4)
Observations 8,723 5,816 7,181 7,358 R2 0.231 0.308 0.243 0.291