Embed Size (px)
Citation preview

BoAML Global Real Estate Conference 2015 New York, 17 September 2015

BoAML Global Real Estate Conference, New York, 17 September 2015 Page 2
Recent events
Shareholder structure*
Liquidity Ranking of European Real Estate Companies
Vonovia Market Update
* As of August 27, 2015
** Calculated based on all trading days in 2015 ytd
Sources: Bloomberg, Deutsche Börse, Kempen & Co Analysis
Deutsche Annington has been rebranded to Vonovia on
September 2, 2015, following the integration of Gagfah
The tickers have been changed accordingly
Bloomberg:
ANN:GY VNA:GY
Reuters:
ANNGn.DE VNAn.DE
Vonovia will enter the DAX 30 Index as per market opening
on September 21, 2015 with a free float market cap of
c€13bn
Vonovia’s daily turnover of c€40m** (#2 real estate
company in Europe is expected to further increase
# Company Total turnover
(€m) Average Daily turnover (€m)
1 Unibail-Rodamco 16,500 94.3
2 Vonovia 6,939 39.9
3 Land Securities 6,525 37.1
4 British Land Co 6,340 36.0
5 Klepierre 4,995 28.5
6 Deutsche Wohnen 3,731 21.3
7 Hammerson 3,482 19.8
8 Swiss Prime Site 2,613 15.2
9 Intu Properties 2,259 12.8
10 Leg Immobilien 2,122 12.2
Wellington Management
Blackrock
8.5%
5.6%
Lansdowne Parnters
2.4%
72.4%
The Wellcome Trust
Other free float
3.1% Sun Life Financial 3.4%
Norges Bank
4.6%

BoAML Global Real Estate Conference, New York, 17 September 2015 Page 3
FY 2014 (TERP-adjusted)
Change vs June Guidance 2015 incl.
SÜDEWO
Guidance 20151
(August)
L-f-l rental growth 2.5% 2.6-2.8%
Vacancy 3.4% ~3%
Rental Income €789.3m €1,400-1,420m
FFO 1 €286.6m €560-580m
FFO 1 (Group)/share €1.00 €1.20-1.24
EPRA NAV2/ share €23.04 €27.50-28.50
Maintenance €173.8m +€10m ~€340m
Modernization €171.7m €280-300m
Privatization (#) 2,238 +600 ~2,900
FMV step-up (Privatization)
37.6% ~30%
Non-Core (#) 1,843 opportunistic
FMV step-up (Non-Core)
10.9% ~0%
Dividend/share3 €0.74 up to €0.94 €0.94
2015 guidance confirmed and specified
1 Incl. acquisitions pro rata; per share numbers based on 466.0 million shares currently outstanding
2 Incl. goodwill (guidance excl. goodwill: €22-23/share) 3 To be recommended to the AGM. Going forward, the stated dividend policy of ~70% of FFO1 (Group) remains unchanged FY 2014 is TERP-adjusted (TERP factor=1.051). FY 2014 not TERP adjusted: FFO1 Group/share=€1.06, EPRA NAV/share=€24.22, Dividend/share=€0.78

BoAML Global Real Estate Conference, New York, 17 September 2015 Page 4
Business Strategy
Financing Strategy 2
Maintain adequate liquidity at all time while optimising financing costs based on target maturity profile and rating
Portfolio Mgmt. Strategy
3
Focus on core regions and selection of appropriate investment programs in order to strengthen EBITDA margin.
Extension Strategy 4 Increase customer satisfaction/value by offering additional services
Acquisition Strategy 5
Innovative
Tra
ditio
nal
Property Mgmt. Strategy
1
Long-term focus on EBITDA margin by increasing rent, reducing vacancy, reducing operating cost, adequate maintenance, increasing customer satisfaction
Selective pursuit of available opportunities with our disciplined approach framework:
Increase FFO/share without dilution of NAV/share
Increase asset base to achieve economies od scale from operational strategies
Reputation & Customer Satisfaction

BoAML Global Real Estate Conference, New York, 17 September 2015 Page 5
Operating performance
Adjusted EBITDA (€m)
Vacancy rate (total portfolio, %)
Fair value (€m)
Residential in-place rent (like-for-like, €/sqm)
Adj. EBITDA Rental Adj. EBITDA Sales
5.30
5.41
5.55 5.58
5.73
31 Dec 2012 31 Dec 2013 31 Dec 2014 30 June 2014 30 June 2015
3.9
3.5 3.4
3.8%
3.5%
31 Dec 2012 31 Dec 2013 31 Dec 2014 30 June 2014 30 June 2015
437,3 442,7
503,9
236,0
426,6
36,7 27,7
50,1
22,4
19,5
2012 2013 2014 H1 2014 H1 2015
474,0 470,4
2,372
2,468
Adj. EBITDA Rental/unit (€)
9.982,0 10.326,7 12.759,1
21.299,2
31 Dec 2012 31 Dec 2013 31 Dec 2014 30 June 2015
839 901
Fair value per sqm (€)
Per unit data based on average number of units over the respective period H1 2015 include 4 months of GAGFAH
2,709 964
554,0
Property Mgmt. Strategy 1
446,1
1,424 951
258,4
1,317

BoAML Global Real Estate Conference, New York, 17 September 2015 Page 6
Operating performance (cont’d)
FFO 1 excl. maintenance (€m)
EPRA NAV (€m)
AFFO (€m)
FFO 1 (€m)
169.9
223.5
286.6
130.3
264.3
2012 2013 2014 H1 2014 H1 2015
3,758.4
5,123.4
6,578.0
10,087.5
31 Dec 2012 31 Dec 2013 31 Dec 2014 30 June 2015
1)Per share data based on number of shares outstanding as of 31 Dec 2012 (200.0m), 31 Dec 2013 (224.2m), 30 June 2014 (240.2m), 31 Dec 2014 (271.6m), 30 June 2015 (358.5m) 2)Per unit data based on average number of units over the respective period H1 2015 numbers include 4 months of GAGFAH
922
0.85
per unit (€)2
18.79
24.22
per share (€)1
297.2
360.0
431.7
199.4
371.4
2012 2013 2014 H1 2014 H1 2015
1,612
146.2
203.5
258.3
119.5
224.6
2012 2013 2014 H1 2014 H1 2015
793
1,389
1,246
1.00 1,541
1.06
2,007
2,321
1,135
22.85
per share (€)1
per unit (€)2 per unit (€)2
Property Mgmt. Strategy 1
882
0.74 28.14
1,240 750
772
0.54
1,113 667

BoAML Global Real Estate Conference, New York, 17 September 2015 Page 7
Platform Efficiency evidenced by DeWAG and Vitus
5.03
+1.4%
+3.4%
Vitus
5.10
DeWAG
6.91 6.68
4.1
DeWAG
3.8 4.3
-0.5pp -0.5pp
Vitus
3.6
Consolidated as of: DeWAG (1 April 2014), Vitus (1 Oct. 2014) Units as of 30 June 2015: DeWAG (11K), Vitus (20.5K)
6463
75757876
Vitus DeWAG
H1 2015 Before integration Business Plan
Business plan reflects efficiency gains from
our platform
Actual performance exceeding business plan
Assumption for maintenance/sqm in Business Plan: DeWAG = €11.67 Vitus = €10.75
Rent/sqm & month (€)
Vacancy rate (%)
EBITDA Rental margin (%)
Property Mgmt. Strategy 1

BoAML Global Real Estate Conference, New York, 17 September 2015 Page 8
FFO build-up
63 64
7577
SÜDEWO GAGFAH
2015 pro forma incl. synergies Before integration
FFO1/ share
287
640-660
2015 guidance
560-580
2015 full-year run rate + run
rate of synergies
780-800
2015 full- year run rate
2014
€1.00
€1.20-1.24
€1.37-1.42
€1.67-1.72
GAGFAH +€39m Franconia +€4m SÜDEWO +€36m
Dividend policy: ~70% of FFO1
4.2%**
4.8%**
5.8%**
3.6%*
FFO1 yield
*based on closing price of 30 Dec. 2014 (€28.12)
**based on closing price of 18 Aug. 2015 (€29.25)
Without operating FFO growth after 2015 2015 guidance incl. pro rata contribution of acquisitions: GAGFAH (10 months), Franconia (9 months), SÜDEWO (6 months) Based on number of outstanding shares per 31 Dec. 2014 = 271.6m and current = 466.0m
EBITDA Rental margin (%)
FFO 1 (€m)
FFO synergies
Property Mgmt. Strategy 1

BoAML Global Real Estate Conference, New York, 17 September 2015 Page 9
Proforma LTV of 50.0% close to mid-term target of <50%
LTV post closing
and funding of
GAGFAH
transaction
LTV H1 2015
LTV: 56.4% Proforma1:
50.0%
Key drivers further influencing leverage
Acquisitions Valuation Financing Disposals
Closing of
Franconia
acquisition as of
April 1st, 2015
Potential over-
equitizing of future
acquisitions
(€1.9 bn
acquisition of
SÜDEWO Group)
Usual increase in
line with rental
growth
Additional yield
compression
possible in
appraised values
Harmonization of
GAGFAH along
Deutsche
Annington
standards
(€232m)
Approved
authorized and
contingent capital
Strong access to
equity as well as
debt capital
markets
(€2.2 bn rights
issue
successfully
placed)
The combined
group has a
sizeable portfolio
of privatization /
non-core assets
New non-strategic
portfolio offers
further disposal
potential
<50%
LTV target
Mid-term target of
<50%
LTV H1 2015
LTV: 56.4% Proforma1:
50.0% <50%
1 acquisition of Südewo/post rights issue
Financing Strategy 2

BoAML Global Real Estate Conference, New York, 17 September 2015 Page 10
Maturity profile and financing sources
CMBS included at economic maturity
0
1.000
2.000
3.000
4.000
5.000
2015 2016 2017 2018 2019 2020 2021 2022 2023 2024 2025 2026 from 2027
Mortgages Structured Loans Bond Hybrid Hybrid (Equity) CMBS SüDeWo
Bond incl. Hybrid
41%
Mortgages 9%
Structured Loans 24%
CMBS 26%
Current maturity of around 7 years
Current interest cost of 2.9%
Refinancing of €1.9bn to increase unencumbrance
Target maturity of around 8 years
Maturity Profile August 1, 2015 (€m)
Debt Structure August 1, 2015
Financing Strategy 2

BoAML Global Real Estate Conference, New York, 17 September 2015 Page 11
Focused & Action-driven Portfolio Management Strategy
Portfolio Management Strategy Portfolio Breakdown
* As of June 30, 2015, all locations and assets of the GAGFAH portfolio that
are strategically relevant are included in the “Operate” category. The
analysis of the investment potential of the portfolio will be completed by Q3
2015.
*
STR
ATEG
IC
NO
N
STR
ATEG
IC
Pri
vati
ze/
No
n-c
ore
Operate: rent growth, vacancy reduction, effective and
sustainable maintenance spending and cost savings.
Upgrade buildings: comprehensive investments with a
focus on energy efficiency
Optimize apartments: selective investments in individual
flats (focus on senior living and high-end modernization in
strong markets that allow a rental premium for fully
refurbished apartments)
Privatize: opportunistic retail sales at attractive premiums
above current valuation
Non-core: portfolio optimization through sale of assets that
have limited development potential in terms of condition
and/or location
Locations and assets that do not form an integral part of
Vonovia’s strategy. Mostly average location and asset
quality with stable cash flows. Under permanent review.
Value-driven asset management approach in locations with
above-average development potential Residential units `000 sqm Vacancy rate
In-place rent (€/sqm)
Operate* 192,106 11,762 2.5% 5.64
Upgrade buildings
49,411 3,091 2.6% 5.69
Optimize apartments
36,849 2,378 2.5% 6.19
STRATEGIC 278,366 17,231 2.5% 5.72
NON STRATEGIC 31,676 1,958 6.9% 4.81
Privatize 21,477 1,465 4.7% 5.60
Non-core 16,697 1,023 11.4% 4.50
TOTAL 348,216 21,677 3.5% 5.58
Portfolio Mgmt. Strategy 3

BoAML Global Real Estate Conference, New York, 17 September 2015 Page 12
Modernization Program remains an important Value Driver
2 3
5
12 12
20
Ø 2009-2011
2012 2013 IPOGuidancefor 2014
2014 old 2015FC
new 2015FC (incl.
GAGFAH)
Un
its (
'000)
Inv
estm
en
t v
olu
me
(€m
)
DA DeWAG Vitus GAGFAH '000 units
Investment as a Continued Focus Strong Investment Track Record
34
57 65
150
172
200+
280 - 300
7.0% 6.8% 7.2% 7.2% 7.0% 7.0%
yie
ld
Expected 2015 investment volume
between €280 and €300 million including
GAGFAH
Yield commitment of ~7% (unlevered)
remains unchanged
Continuous investment focus on energy &
demographic change
Well underway on execution of 2015
modernization program as expected
(75 % of planned investment volume
initiated and under construction)
Portfolio Mgmt. Strategy 3

BoAML Global Real Estate Conference, New York, 17 September 2015 Page 13
Sales Results
Privatization
H1 2014 H1 2015 Change (€m) Change (%)
# units sold 1,190 1,221 31.0 3%
Income from disposal of properties (€m) 118.3 123.6 5.3 4%
Fair value disposals (€m) -88.6 -92.8 -4.2 5%
Adjusted profit from disposal of properties (€m) 29.7 30.8 1.1 4%
Fair value step-up 33.5% 33.2% -0.3pp
Target ~30-35% Target ~30%
Non-core disposals
H1 2014 H1 2015 Change (€m) Change (%)
# units sold 702 2,829 2,127.0 303%
Income from disposal of properties (€m) 20.6 97.8 77.2 375%
Fair value disposals (€m) -19.1 -97.0 -77.9 408%
Adjusted profit from disposal of properties (€m) 1.5 0.8 -0.7 -47%
Fair value step-up 7.9% 0.8% -7.1pp
Target = 0% Target = 0%
Portfolio Mgmt. Strategy 3

BoAML Global Real Estate Conference, New York, 17 September 2015 Page 14
Extension strategy offers additional growth with existing tenants
NEW BUSINESS PROOF OF CONCEPT
BULDING
Multi- media
Intelligent Sourcing
Kitchen
Metering
Home care
kiwi
Par-king
DHL
AAL
UP AND RUNNING
Apartment moderni-
zation
Heating-system
refurbishment
Attic con-version
Energy
APARTMENT
SERVICES Craftsmen
services (DTGS)
Energy-efficient modernisation
Bathroom moderni-
sation
Extension Strategy 4

BoAML Global Real Estate Conference, New York, 17 September 2015 Page 15
GAGFAH integration ahead of plan
Headline 1
Headline 2
Granular integration processes in place and fully running
Initial segmentation of combined portfolio completed (final allocation in Q3 2015)
Bottom-up synergy analysis completed
Corporate holding functions agreed including works council approval
IT integration of financial data completed / one integrated SAP-IT platform for the entire group (since
1 July 2015)
Dry run for rent collection successful (go-live on 15 December 2015)
Organizational integration of operational units (regions, TGS etc.) on track
Integration ahead of schedule with higher synergies and lower one-off costs than planned
Substantially increased economies of scale (purchasing, extension strategy)
Increased scale de-risking the platform
Acquisition Strategy 5

BoAML Global Real Estate Conference, New York, 17 September 2015 Page 16
GAGFAH: Bottom-up analysis results in much higher synergies at lower cost Acquisition Strategy 5
Gagfah integration one year ahead of schedule, with synergies and probability of achieving synergies so far higher than expected and costs to raise synergies lower than expected
Bottom-up analysis results in substantially higher synergies of c. €130m, vs. originally assumed €84m
Craftsmen (TGS) and further extension
Leverage balcony / bath-tub additions
Shared services
Increased purchasing power
Further vacancy reduction
Complementary portfolios allow for synergies in both organisations
IT Integration sets basis for operating synergies and reduces fixed costs
Refinancing of current Gagfah debt at DAIG marginal financing cost
Overall platform benefits further from improved business profile and lower cost of
capital
Maintain adequate liquidity at any time while optimising financing costs
Operating
synergies
Property
Management &
Extension
Financing synergies
Personnel cost overhead Overhead
Consolidation of acquisition and sales departments Other
Portfolio
management
Optimise portfolio to investment program, sales and tactical acquisitions
Modernisation programme to drive further growth and vacancy reduction
Innovative portfolio management – disposal of assets
€130m
Current
Synergies
€84m
At announcement
€310m
At announcement
Costs
€255m
Current
+55%
-18%

BoAML Global Real Estate Conference, New York, 17 September 2015 Page 17
Acquisition pipeline update
Acquisition Pipeline 2015 (as of 30 June 2015)
127k
74k
55k 45k
20k
0
20
40
60
80
100
120
140
Examined Detailed analysis Due diligence, partlyongoing
Bids Signed
resi
den
tial
un
its
58%
43%
35%
16%
Acquisition Strategy 5

BoAML Global Real Estate Conference, New York, 17 September 2015 Page 18
Acquisition market
Total market
FY 2014
thereof > €100m/deal
Share of Deutsche Annington (DAIG)/GAGFAH (53,300 units / €3,033m)
Total # of transactions of residential real estate portfolios in 2014 (≥100 units): 232 transactions, 226K units, €12.1bn market volume
Total market
H1 2015
thereof > 1000 units (€6.2bn)
Share of Vonovia (20,350 units / €1,938m)
Total # of transactions of residential real estate portfolios in 2014 (≥50 units): 124 transactions, 122K units, €8.9bn market volume
69%
31%
59%
41%
78%
22%
Others Vonovia Others Vonovia
75%
25%
Acquisition Strategy 5
Source: CBRE Marketview 2014, Savills Marktbericht Wohnungsportfolios Deutschland 2014 Source: CBRE Marketview 2015

BoAML Global Real Estate Conference, New York, 17 September 2015 Page 19
External Growth through disciplined process
BBB+ Rating (stable)
Maintaining rating
Fulfillment of all DA‘s acquisition
criteria
FFO / share +
Accretive
NAV / share ≥ At least neutral
Strategic fit +
Scale benefits, geographical
diversification and strengthening footprint in
growth regions, increase of asset density, etc.
Total return matrix
Value growth & return matrix to identify the most attractive markets
Assessment is based on proprietary scorecard which draws from our comprehensive data pool and our local expertise as the nation-wide owner and operator of residential real estate
Acquisition Criteria
Every potential acquisition is put to the test to see if it meets the four key criteria
Exp
ecte
d v
alu
e gr
ow
th (
%)
Current return (%)
Acquisition Strategy 5

BoAML Global Real Estate Conference, New York, 17 September 2015 Page 20
Clear business strategy for sustainable, profitable growth
Promising operating and financial performance
Solid and innovative financing providing high degree of flexibility
Value enhancing and focused portfolio management
Innovative extension business with attractive growth potential
Successful and fast integration of acquisitions due to scalable business model
Summary

BoAML Global Real Estate Conference, New York, 17 September 2015 Page 21
APPENDIX

BoAML Global Real Estate Conference, New York, 17 September 2015 Page 22
Highlights H1 2015
Promising operational and financial performance
L-f-l Rent growth +2.7% yoy (€5.73)
Vacancy rate -0.3pp yoy (3.5%)
FFO1 per share +35.9% yoy (€0.74)
EPRA NAV per share +16.2% (€28.14) vs year-end 2014
Platform efficiency evidenced by DeWAG and Vitus
GAGFAH integration ahead of plan
SÜDEWO transaction closed and funded
Integration work on track
FFO1 per share +20-24% (€1.20-1.24)
EPRA NAV per share +19-24% (€27.50-28.50)
Recommended dividend per share of €0.94 (+27%)
2015 guidance confirmed and specified
LTV incl. SÜDEWO and rights issue of 50.0% close to mid-term target of <50%

BoAML Global Real Estate Conference, New York, 17 September 2015 Page 23
KPI Definitions
EPRA NAV is used as an indicator of the Group’s long-term equity and is
calculated according to EPRA’s Best Practice Recommendations. The adjusted
NAV represents the EPRA NAV less goodwill.
FFO1 is calculated as the profit or loss for the period adjusted for sales-related,
non-recurring, non-cash or similar items. It approximates the sustainable,
recurring operating cash flow to the Group before payments to equity hybrid
investors and minorities. This FFO1 is not determined on the basis of a specific
international reporting standard but is to be regarded as a supplement to other
performance indicators determined in accordance with IFRS. The FFO1 per share
is calculated on the basis of all outstanding, dividend-bearing shares.
The LTV shows the ratio of net debt (excluding equity hybrid) to property value.
IFRS profit or loss for the period adjusted by
• the profit or loss from sales • the effects from property held for sale • specific effects which do not relate to the period, are non-recurring or do not relate
to the objective of the Company • the net income from fair value adjustments of investment properties, • depreciation and amortisation • deferred and prior-year current taxes (tax expenses/income), • transaction costs • prepayment penalties and commitment interest • valuation effects on financial instruments • the unwinding of discounting for provisions, particularly pension provisions • and other prior-year interest expenses • income that is not of a long-term nature
Group equity (including goodwill),
+ deferred taxes on properties and assets held for sale
+ fair value of derivative financial instruments
- deferred taxes on derivative financial instruments
+ Non-derivative financial liabilities (excluding equity hybrid)
- Foreign currency effects
- Cash and cash equivalents
= Net debt
+ Fair value of investment property
+ Fair value of trading properties and assets held for sale
+ Fair value of properties used by the Group
= Fair value
Description Calculation
EPRA
NAV
FFO1
LTV

BoAML Global Real Estate Conference, New York, 17 September 2015 Page 24
Consolidation Scope
DAIG DeWAG Vitus GAGFAH Franconia SÜDEWO
H1 2014 6 months 3 months - - - -
FY 2014 12 months 9 months 3 months - - -
H1 2015 6 months 6 months 6 months 4 months 3 months -
FY 2015 Guidance 12 months 12 months 12 months 10 months 9 months 6 months

BoAML Global Real Estate Conference, New York, 17 September 2015 Page 25
H1 2015 Key Figures
€m H1 2015 H1 2014 Change (€) Change (%)
Residential units (k) 348,216 184,682 163,534 89%
Rental income 628.0 376.7 251.3 67%
Vacancy rate (%) 3.5 3.8 - -0.3pp
Monthly in-place rent/ sqm (like-for-like, €) 5.73 5.58 0.15 3%
Adjusted EBITDA Rental 426.6 236.0 190.6 81%
Adjusted EBITDA Rental /unit (€) 1,424 1,317 107.0 8%
Income from disposal of properties 221.4 138.9 82.5 59%
Adjusted EBITDA Sales 19.5 22.4 -2.9 -13%
Adjusted EBITDA 446.1 258.4 187.7 73%
FFO1 264.3 130.3 134.0 103%
FFO2 283.8 152.7 131.1 86%
FFO1 before maintenance 371.4 199.4 172.0 86%
AFFO 224.6 119.5 105.1 88%
Fair value market properties3 21,299.2 12,759.1 8,540.1 67%
EPRA NAV3 10,087.5 6,578.0 3,509.5 53%
LTV (%)4 56.4 49.7 6.7 13%
FFO1/ share (€)1 0.74 0.54 0.20 37%
EPRA NAV / share (€)2 28.14 24.22 3.92 16% 1 Based on the number of shares as of the reporting date: 30.06.2015: 358.5m and 30.06.2014: 240.2m 2 NAV / share based on the number of outstanding shares as of the reporting date: 30.06.2015: 358.5m and 31.12.2014: 271.6m 3 30.06.2015 vs. 31.12.2014 4 LTV at 31.12.2014 adjusted for effects of capital measures

BoAML Global Real Estate Conference, New York, 17 September 2015 Page 26
EBITDA
Bridge to Adjusted EBITDA (€m)
H1 2015 H1 2014 Change
(€) Change
(%)
Profit for the period 84.9 70.0 14.9 21%
Net interest result 237.1 142.6 94.5 66%
Income taxes 59.3 30.6 28.7 94%
Depreciation 4.8 3.4 1.4 41%
Net income from fair value adjustments of investment properties
0.0 -20.8 20.8 -100%
EBITDA IFRS 386.1 225.8 160.3 71%
Non-recurring items 60.2 30.7 29.5 96%
Period adjustments -0.2 1.9 -2.1 -111%
Adjusted EBITDA 446.1 258.4 187.7 73%
Adjusted EBITDA Rental 426.6 236.0 190.6 81%
Adjusted EBITDA Sales 19.5 22.4 -2.9 -13%
Rental Segment (€m) H1 2015 H1
2014 Change
(€) Change
(%)
Average number of units over the period 299,580 179,198 120,382 67%
Rental income 628.0 376.7 251.3 67%
Maintenance -107.1 -69.1 -38.0 55%
Operating costs -94.3 -71.6 -22.7 32%
Adjusted EBITDA Rental 426.6 236.0 190.6 81%
Sales Segment (€m) H1 2015 H1
2014 Change
(€) Change
(%)
Number of units sold 4,050 1,892 2,158 114%
Income from disposal of properties 221.4 138.9 82.5 59%
Carrying amount of properties sold -204.8 -120.9 -83.9 69%
Revaluation of assets held for sale 15.2 11.3 3.9 35%
Profit on disposal of properties (IFRS) 31.8 29.3 2.5 9%
Revaluation (realized) of assets held for sale -15.2 -11.3 -3.9 35%
Revaluation from disposal of assets held for sale
15.0 13.2 1.8 14%
Adjusted profit from disposal of properties 31.6 31.2 0.4 1%
Selling costs -12.1 -8.8 -3.3 38%
Adjusted EBITDA Sales 19.5 22.4 -2.9 -13%
EBITDA increase driven by rental business
Adjusted EBITDA Rental reflects acquisitions as well as operational
performance
Adjusted EBITDA Sales below previous year level: higher Non-Core
sales volumes offset by lower Non-Core step-ups, also higher
selling costs due to increased sales volumes

BoAML Global Real Estate Conference, New York, 17 September 2015 Page 27
FFO
€m
Actuals Change
H1 2015 H1 2014 €m %
Adjusted EBITDA 446.1 258.4 187.7 73%
(-) Interest expense FFO -153.1 -98.9 -54.2 55%
(-) Current income taxes -9.2 -6.8 -2.4 35%
(=) FFO2 283.8 152.7 131.1 86%
(-) Adjusted EBITDA Sales -19.5 -22.4 2.9 -13%
(=) FFO1 264.3 130.3 134.0 103%
thereof attributable to shareholders 251.5 130.3 121.2 93%
thereof attributable to equity hybrid investors 12.8 - - -
(-) Capitalized maintenance -39.7 -10.8 -28.9 268%
(=) AFFO 224.6 119.5 105.1 88%
(+) Capitalized maintenance 39.7 10.8 28.9 268%
(+) Expenses for maintenance 107.1 69.1 38.0 55%
(=) FFO1 excl. maintenance 371.4 199.4 172.0 86%

BoAML Global Real Estate Conference, New York, 17 September 2015 Page 28
NAV
€m
Actuals Change
June 30, 2015
December 31, 2014
€m %
Equity attributable to shareholders 7,523.8 4,932.6 2,591.2 53%
Deferred taxes on investment property/ properties for sale 2,445.5 1,581.0 864.5 55%
Fair value of derivative financial instruments1 158.9 88.1 70.8 80%
Deferred taxes on derivative financial instruments -40.7 -23.7 -17.0 72%
EPRA NAV 10,087.5 6,578.0 3,509.5 53%
Goodwill -2,292.8 -106.0 -2,186.8 na
Adjusted NAV 7,794.7 6,472.0 1,322.7 20%
EPRA NAV per share (€)2 28.14 24.22 3.92 16%
Adjusted NAV per share (€)2 21.74 23.83 -2.09 -9%
1 Adjusted for effects from cross-currency swaps 2 Based on number of shares outstanding as of respective reporting dates (31 Dec. 2014: 271.6m; 30 June 2015: 358.5m)

BoAML Global Real Estate Conference, New York, 17 September 2015 Page 29
P&L
€m H1 2015 H1 2014 Change (€m) Change (%)
Income from property letting 913.8 542.3 371.5 68.5
Rental income 628.0 376.7 251.3 66.7
Ancillary costs 285.8 165.6 120.2 72.6
Other income from property management 14.0 9.0 5.0 55.6
Income from property management 927.8 551.3 376.5 68.3
Income from sale of properties 221.4 138.9 82.5 59.4
Carrying amount of properties sold -204.8 -120.9 -83.9 69.4
Revaluation of assets held for sale 15.2 11.3 3.9 34.5
Profit on disposal of properties 31.8 29.3 2.5 8.5
Net income from fair value adjustments of investment properties 0.0 20.8 -20.8 -100
Capitalized internal modernization expenses 65.3 34.2 31.1 90.9
Cost of materials -425.4 -246.4 -179.0 72.6
Expenses for ancillary costs -279.1 -160.6 -118.5 73.8
Expenses for maintenance -109.2 -61.3 -47.9 78.1
Other costs of purchased goods and services -37.1 -24.5 -12.6 51.4
Personnel expenses -138.1 -87.9 -50.2 57.1
Depreciation and amortisation -4.8 -3.4 -1.4 41.2
Other operating income 36.9 19.8 17.1 86.4
Other operating expenses -113.2 -74.9 -38.3 51.1
Financial income 2.7 2.8 -0.1 -3.6
Financial expenses -238.8 -145.0 -93.8 64.7
Profit before tax 144.2 100.6 43.6 43.3
Income tax -59.3 -30.6 -28.7 93.8
Current income tax -7.9 4.9 -12.8 -261.2
Other (incl. deferred tax) -51.4 -35.5 -15.9 44.8
Profit for the period 84.9 70.0 14.9 21.3
Comments
Increase mainly acquisition-related (residential
units 348k vs 185k), additionally in-place rent on a
like-for-like basis increased by 2.7%
Slight increase due to higher Non-Core Sales
volumes, partially offset by lower Non-Core Step-
ups
Increase reflects larger portfolio size and in-
sourcing effect of our own craftsmen organization
Increase mainly reflects increased portfolio size,
additionally vacancy rate decreased by 0.3pp
Increase mainly acquisition-related
Ramp-up from 3,283 to 5,877 employees leads to
increased personnel expenses which primarily
result from GAGFAH merger & TGS growth
Increase mainly due to acquisitions (especially
GAGFAH) and increased recurring income / cost
reimbursements
Increase mainly related to additional expenses of
acquisitions as well as consulting and audit fees
for GAGFAH merger, other effects comprise
vehicle and travelling costs which mainly
increased due to insourcing
Strongly impacted by additional financings as a
result of acquisitions and by transaction costs for
GAGFAH deal financing
Internal quarterly review of fair value of investment
properties did not result in any significant changes
compared to 31 December 2014

BoAML Global Real Estate Conference, New York, 17 September 2015 Page 30
Modernization and Maintenance
Comments
Compared to 6M 2014, revenues
of in-house craftsmen organisation
increased significantly due to
successful TGS implementation
and increased portfolio size
Maintenance and modernization (€m) H1 2015 H1 2014 Change (€m) Change (%)
Maintenance expenses 107.1 69.1 38.0 55%
Capitalized maintenance 40.1 11.0 29.1 265%
Modernization work 118.0 61.4 56.6 92%
Total cost of modernization and maintenance 265.2 141.5 123.7 87%
Thereof sales of own craftmen’s organisation 168.8 78.6 90.2 115%
Thereof bought-in services 96.4 62.9 33.5 53%
Modernization and maintenance / sqm (€) 14.15 12.36 1.79 14%
Modernization programme mainly
addressing investments in buildings
or apartments regarding energy
efficiency, senior living and high-
standard refurbishments

BoAML Global Real Estate Conference, New York, 17 September 2015 Page 31
Maintenance and Modernization
10.28 10.71 10.82 11.93 12.23
0.89 1.29 2.02 1.84 2.42
2.89 3.95
5.59 6.19
14.47
14.06
15.95
18.43 19.95
29.12
~31
0,00
5,00
10,00
15,00
20,00
25,00
30,00
35,00
2010 2011 2012 2013 2014 2015e
Maintenance (€/sqm) Capitalized maintenance (€/sqm) Modernization (€/sqm)
included in …
FFO
1
AFF
O
Cas
h F
low

BoAML Global Real Estate Conference, New York, 17 September 2015 Page 32
Balance Sheet
Comments €m Jun 30, 2015 Dec 31, 2014
Investment Properties 21,196.5 12,687.2
Other non-current assets 2,580.4 292.8
Total non-current assets 23,776.9 12,980.0
Cash and cash equivalents 313.6 1,564.8
Other financial assets 1.4 2.0
Other current assets 309.7 212.4
Total current assets 624.7 1,779.2
Total Assets 24,401.6 14,759.2
Total equity attributable to DA shareholders 7,523.8 4,932.6
Equity attributable to hybrid capital investors 1,021.4 1,001.6
Non-controlling interests 185.7 28.0
Total equity 8,730.9 5,962.2
Provisions 546.4 422.1
Trade payables 0.9 1.0
Non derivative financial liabilities 12,203.9 6,539.5
Derivative financial liabilities 138.0 54.5
Liabilities from finance leases 98.8 88.1
Liabilities to non-controlling interests 38.4 46.3
Other liabilities 35.9 8.6
Deferred tax liabilities 1,624.9 1,132.8
Total non-current liabilities 14,687.2 8,292.9
Provisions 338.5 211.3
Trade payables 83.4 51.5
Non derivative financial liabilities 266.4 125.3
Derivative financial liabilities 91.1 21.9
Liabilities from finance leases 4.7 4.4
Liabilities to non-controlling interests 8.0 7.5
Income tax liabilities 44.4 0.0
Other liabilities 147.0 82.2
Total current liabilities 983.5 504.1
Total liabilities 15,670.7 8,797.0
Total equity and liabilities 24,401.6 14,759.2
Increase driven by GAGFAH acquisition € 8,184.8m
as well as the “Franconia” acquisition € 298.1m
Increase of non controlling interest by consolidation of GAGFAH €119.2m
Increase driven by consolidation of GAGFAH,
as well as issuing EMTN Bonds of € 1.0bn.
Increase mainly driven by GAGFAH acquisition
Preliminary Goodwill of € 2,186.8m included
Capital increase of € 2,783.2m included
Increase generally driven by GAGFAH acquisition € 456.5m
Decrease basically driven by cash consideration GAGFAH € 2,022.5m

BoAML Global Real Estate Conference, New York, 17 September 2015 Page 33
Goodwill
€m
Actuals
June 30, 2015 Dec. 31, 2014
Goodwill DeWAG 10.7 10.7
Goodwill Vitus 95.3 95.3
Goodwill GAGFAH (preliminary) 2,186.8 -
Total Goodwill (as of reporting date) 2,292.8 106.0
Goodwill SÜDEWO (preliminary until 31.12.2015)1 approx. 340 -
1 As per 8 July 2015; incl. deferred taxes of approx. €230m

BoAML Global Real Estate Conference, New York, 17 September 2015 Page 34
GAGFAH Goodwill – Q2 development by PPA item €m
€m
Preliminary Goodwill as at March 31, 2015 2,203.4
Investment properties (IAS 40) -232.1
Property, plant and equipment (IAS 16) +1.4
Multi-employer post-retirement benefit plan obligation (VBL) +27.6
Deferred taxes +64.2
Consideration for acquired share in extended offer period due to Luxembourg corporate requirements
+238.0
Adjustment for non-controlling interests to 93.80% -119.2
Miscellaneous +3.5
Indicative and preliminary Goodwill as at June 30, 2015 = Movement
2,186.8 -16.6

BoAML Global Real Estate Conference, New York, 17 September 2015 Page 35
LTV
€m
June 30, 2015
Proforma1 June 30,
2015
Dec. 31, 2014
Non-derivative financial liabilities 12,470.3 12,470.3 6,664.8
Foreign currency effects -154.4 -154.4 -84.0
Cash and cash equivalents -313.6 -313.6 -1,564.8
Funds held for GAGFAH and Franconia acquisitions2 - - 1,322.5
Net cash effect of rights issue - -300.0 -
Liquid funds (SÜDEWO) - -167.8 -
Adjusted net debt 12,002.3 11,534.5 6,338.5
Fair value of Vonovia portfolio 21,299.2 21,299.2 12,759.1
Fair value of SÜDEWO portfolio - 1,748.0 -
Fair value of Vonovia + SÜDEWO portfolio 21,299.2 23,047.2 12,759.1
LTV 56.4% 50.0% 49.7%
1 Post rights issue/SÜDEWO acquisition 2 Adjusted for equity instruments Perpetual hybrid not treated as liability

BoAML Global Real Estate Conference, New York, 17 September 2015 Page 36
Bond and Rating KPI‘s (as per June 30, 2015)
Covenant Level Actual
LTV
Total Debt / Total Assets
<60%
51%
Secured LTV
Secured Debt / Total Assets
<45%
31%
ICR
LTM1 EBITDA / LTM Interest Expense
>1.80x
2.81x
Unencumbered Assets
Unencumbered Assets / Unsecured Debt
>125%
207%
Covenant Level
Debt to Capital
Total Debt / Total Equity + Total Debt
<60%
ICR
LTM EBITDA / LTM Interest Expense
>1.80%
Bond KPIs
Rating KPIs
1 LTM = last 12 months

BoAML Global Real Estate Conference, New York, 17 September 2015 Page 37
Development of Unencumbrance Ratio
50%
Sept. 2016 Dec 2015
c.44%
June 2015
32%
Prepayment of existing secured loans in Q3/Q4 2015
Further reductions of secured financings
Unencumbrance ratio
Unencumbrance ratio dropped from 50% pre GAGFAH down to 32% including GAGFAH
S&P provides up to 18 months (i.e. 30 Sept 2016) to reach 50% unencumbrance ratio

BoAML Global Real Estate Conference, New York, 17 September 2015 Page 38
Evolution of average interest costs/interest rate sensitivity
2012 2011 2010 2009 2008 2007 2006
4,5
4,0
Q2 2015
5,0
3,5
3,0
2,5
Q1 2015 2014 2013
2,0
3.3%
4.4% 4.4% 4.4%
3.5% 3.5% 3.4% 3.4%
2.9% 2.9%
3.2%
Evolution of average interest costs
Development Outlook
Reduction of average interest costs since 2012, while extended and smoothened the maturity profile at the same time
Superior mix of secured and unsecured refinancing sources to reduce risk and maximise funding options
Included a €700m Hybrid with 4.6% coupon to our capital structure for the 2014 acquisitions instead of Convertibles, so that FFO dilution could be avoided
We will further optimise our capital structure as well as debt profile in terms of costs and maturity. Our focus is not purely on minimising the average interest costs. We also consider the optimal product mix, the overall economic benefit and the shareholder interests to support long term growth.
Next aim is to reduce the refinancing volume for 2018 quickly

BoAML Global Real Estate Conference, New York, 17 September 2015 Page 39
Bonds / Rating
Rating agency Rating Outlook Last Update
Standard & Poor’s BBB+ Stable 10 Mar 2015
Corporate investment grade rating
Bond ratings
*EUR-equivalent re-offer yield
Amount Issue price CouponFinal Maturity
DateRating
3 years 2.125%
Euro Bond
6 years 3.125%
Euro Bond
4 years 3.200% 3.200%
Yankee Bond (2.970%)*
10 years 5.000% 5.000%
Yankee Bond (4.580%)*
8 years 3.625%
EMTN (Series No. 1)
60 years 4.625%
Hybrid Bond
8 years 2.125%
EMTN (Series No. 2)
perpetual 4%
Hybrid Bond
5 years 0.875%
EMTN (Series No. 3)
10 years 1.500%
EMTN (Series No. 4)
BBB+
€ 500m 98.455% 1.5000% 31 Mar 2025 BBB+
€ 500m 99.263% 0.875% 30 Mar 2020
€ 1,000m 100.000% 4.000% perpetual BBB-
€ 500m 99.412% 2.125% 9 July 2022 BBB+
BBB+
€ 700m 99.782% 8 Apr 2074 BBB-
€ 500m 99.843% 8 Oct 20213.625%
4.625%
USD 250m 98.993% 2 Oct 2023 BBB+
USD 750m 100.000% 2 Oct 2017 BBB+
BBB+
€ 600m 99.935% 3.125% 25 July 2019 BBB+
€ 700m 99.793% 2.125% 25 July 2016
Amount Issue Price Coupon Final Maturity Date Rating

BoAML Global Real Estate Conference, New York, 17 September 2015 Page 40
CMBS
CMBS Overview as of June 30, 2015
Name Amount Coupon Final Maturity Date
German Residential Funding 2013-1 Limited €1,874m 2.80% Aug 27, 2018
German Residential Funding 2013-2 Limited €683m 2.68% Nov. 27, 2018
Taurus 2013 (GMF1) PLC €1,038m 3.35% May 21, 2018

BoAML Global Real Estate Conference, New York, 17 September 2015 Page 41
2015 Modernization Program on track
Three investment modules in 2015 delivering
~7% unlevered yield:
“Upgrade buildings” – energetic building
modernization
“Optimize apartments” – vacant flat
modernization
“New products” (e.g. bathroom)
75 % of planned investment volume initiated
and under construction
Bulk of “upgrade building” projects
has started as planned during Q2
“Optimize apartments” confirm expectations
€m
280-300
Start of Construction
Q3/Q4
FC Under Construction
100% 75%
25%
2015 Modernization Program

BoAML Global Real Estate Conference, New York, 17 September 2015 Page 42
German Residential Big and Safe Harbor
Germany and its resilient economy provide a comparatively safe harbor for foreign investments
Due to its regulatory structure, the German residential rental market is largely immune to macro-economic
fluctuations
With a GDP contribution of more than €430bn the German real estate industry represents almost 20% of
Germany’s GDP
The net asset value of residential buildings is more than €4.2 trillion (valued at replacement costs)
German resi market: important pillar of the German economy
Sources: Federal Statistics Office (Real GDP growth and market rent growth) Company rent growth: Since DA IPOed in 2013, the data up until and including 2011 relates to GAGFAH
Economic downturns do not impact rental growth
-6
-4
-2
0
2
4
2006 2007 2008 2009 2010 2011 2012 2013 2014
GDP growth (%) Market rent growth (%) Company rent growth (%)
∑ 12.3%
∑ 10.8%
∑ 14.7%
% Cumulative

BoAML Global Real Estate Conference, New York, 17 September 2015 Page 43
German Resi – Favorable Fundamentals
16,1 17,8
13,8 15,5
5,0 3,8
3,8 2,9 1,4 1,0
2010 2030
5 or more persons
4 persons
3 persons
2 persons
1 person
73,1% 73,4% 73,8% 74,6%
75,6% 76,9%
78,3%
2000 2005 2010 2015E 2020E 2025E 2030E
% of People Living in German Cities
40.1 ∑ 41.0 ∑
2% 4%
10% 11% 12% 13% 15% 16% 16% 17%
20%
23%
Esse
n
Do
rtm
un
d
Bre
men
Co
logn
e
Stu
ttga
rt
Du
ssel
do
rf
Ber
lin
Fran
kfu
rt
Ham
bu
rg
Leip
zig
Dre
sden
Mu
nic
hSQM per capita growth in Germany’s largest cities until 2025
38,7 38,9 39,1 39,4 39,6 39,8 39,9 40,1 40,2 40,5 40,6 40,8 41,0 41,2
0,3 0,3 0,2 0,2 0,2 0,2 0,2 0,2 0,1 0,1 0,2 0,2 0,2 0,2
0,0
5,0
10,0
15,0
20,0
25,0
30,0
35,0
40,0
45,0
2001 2002 2003 2004 2005 2006 2007 2008 2009 2010 2011 2012 2013 2014
Housing stock (million) New constructions (million)
Sources: Federal Statistics Office, IW Köln
million
Continuous trend of migration to the cities
New supply falls short of demand Increasing trend towards smaller households (million)
BoAML Global Real Estate Conference, New York, 17 September 2015 Page 44
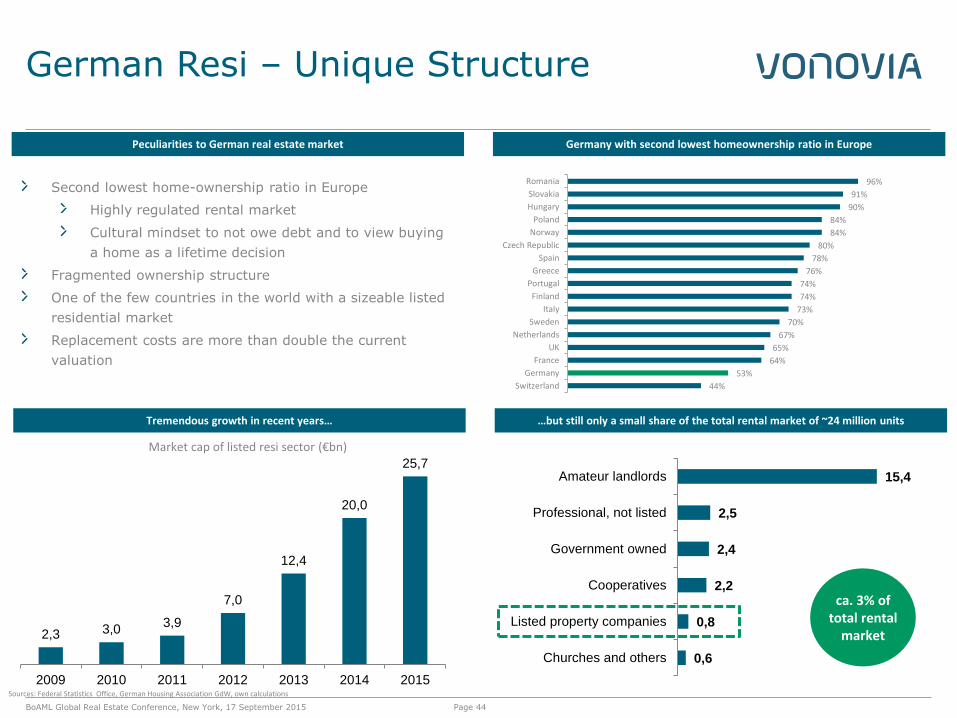
German Resi – Unique Structure
…but still only a small share of the total rental market of ~24 million units
Sources: Federal Statistics Office, German Housing Association GdW, own calculations
0,6
0,8
2,2
2,4
2,5
15,4
Churches and others
Listed property companies
Cooperatives
Government owned
Professional, not listed
Amateur landlords
ca. 3% of total rental
market
Germany with second lowest homeownership ratio in Europe
2,3 3,0 3,9
7,0
12,4
20,0
25,7
2009 2010 2011 2012 2013 2014 2015
Tremendous growth in recent years…
Market cap of listed resi sector (€bn)
Second lowest home-ownership ratio in Europe
Highly regulated rental market
Cultural mindset to not owe debt and to view buying
a home as a lifetime decision
Fragmented ownership structure
One of the few countries in the world with a sizeable listed
residential market
Replacement costs are more than double the current
valuation
Peculiarities to German real estate market
96%
91%
90%
84%
84%
80%
78%
76%
74%
74%
73%
70%
67%
65%
64%
53%
44%
Romania
Slovakia
Hungary
Poland
Norway
Czech Republic
Spain
Greece
Portugal
Finland
Italy
Sweden
Netherlands
UK
France
Germany
Switzerland

BoAML Global Real Estate Conference, New York, 17 September 2015 Page 45
What you can expect of our Q3 Reporting
We will…
… update you on 2016 modernization program incl. portfolio segmentation and drill-own for all recent acquisitions
… update you on 2015 disposal program
… update you on the expected 2015 valuation corridor
… update you on operational synergies (timing)
… give you guidance for FY 2016
… on 3 November 2015

BoAML Global Real Estate Conference, New York, 17 September 2015 Page 46
IR Contact & Financial Calendar
2015
March 5 Full year results 2014
Apr 30 Annual General Meeting
Jun 01 Interim report Q1 2015
Aug 19 Interim report H1 2015
Nov 3 Interim report 9M 2015
2016
March 3 Full year results 2015
May 12 Annual General Meeting
May 12 Interim report Q1 2016
Aug 2 Interim report H1 2016
Nov 3 Interim report 9M 2016
Investor Relations Vonovia SE Philippstr. 3 44803 Bochum Germany +49 234 314 1609 [email protected] www.vonovia.de
Financial Calendar Contact

BoAML Global Real Estate Conference, New York, 17 September 2015 Page 47
Disclaimer
This presentation has been specifically prepared by Vonovia SE and/or its affiliates (together, “Vonovia”) for internal use. Consequently, it may not be sufficient or appropriate for the purpose for which a third party might use it.
This presentation has been provided for information purposes only and is being circulated on a confidential basis. This presentation shall be used only in accordance with applicable law, e.g. regarding national and international insider dealing rules, and must not be distributed, published or reproduced, in whole or in part, nor may its contents be disclosed by the recipient to any other person. Receipt of this presentation constitutes an express agreement to be bound by such confidentiality and the other terms set out herein.
This presentation includes statements, estimates, opinions and projections with respect to anticipated future performance of Vonovia ("forward-looking statements") which reflect various assumptions concerning anticipated results taken from DA’s current business plan or from public sources which have not been independently verified or assessed by Vonovia and which may or may not prove to be correct. Any forward-looking statements reflect current expectations based on the current business plan and various other assumptions and involve significant risks and uncertainties and should not be read as guarantees of future performance or results and will not necessarily be accurate indications of whether or not such results will be achieved. Any forward-looking statements only speak as at the date the presentation is provided to the recipient. It is up to the recipient of this presentation to make its own assessment of the validity of any forward-looking statements and assumptions and no liability is accepted by Vonovia in respect of the achievement of such forward-looking statements and assumptions.
Vonovia accepts no liability whatsoever to the extent permitted by applicable law for any direct, indirect or consequential loss or penalty arising from any use of this presentation, its contents or preparation or otherwise in connection with it.
No representation or warranty (whether express or implied) is given in respect of any information in this presentation or that this presentation is suitable for the recipient’s purposes. The delivery of this presentation does not imply that the information herein is correct as at any time subsequent to the date hereof.
Vonovia has no obligation whatsoever to update or revise any of the information, forward-looking statements or the conclusions contained herein or to reflect new events or circumstances or to correct any inaccuracies which may become apparent subsequent to the date hereof.
Tables and diagrams may include rounding effects.