Embed Size (px)
Citation preview

Version: 1.0
First created: 11/03/2011 Updated: http://efficient-products.defra.gov.uk Last reviewed: 11/03/2011 1 of 49 0845 600 8951
BNWAT02 Showers: market projections and product details
Version 1.0
This Briefing Note and referenced information is a public consultation document and will be used to inform Government decisions. The information and analysis forms part of the Evidence Base created by Defra‟s Market Transformation Programme.
1 Introduction
The Market Transformation Programme (MTP) is designed to transform the market to
increase uptake of sustainable products, reducing the operational environmental impact of
products.
The main ways of doing this are:
Effective regulation;
Better information for consumers;
Incentives to change purchasing trends and habits; and
Policies on procurement, planning, and construction activity.
The MTP has an important role in providing the evidence underpinning policy development.
In its widest sense the MTP covers electrical, heating, lighting, and water using products and
appliances in the domestic sector. The MTP is also tackling energy using products in the
commercial/non household sector.
It is advisable to read this briefing note in conjunction with BNWAT03 Baths: market
projections and product details as the MTP strategy targets personal bathing as a whole.
BNWAT03 sets out useful information to support a transition from high volume baths to
smaller volume models, in the context of continuing to promote showering as an alternative
to bathing. The strategic aim is to reduce the overall demand for water and carbon
emissions currently associated with personal washing.
This briefing note is for showers as part of the domestic water using products element of the
MTP. The information in this note is for England and Wales as Defra and Welsh Assembly
Government actions and policies may not be applicable in Scotland and Northern Ireland.
The supplementary note BNWAT08: Modelling projections of water using products contains
more information on the water sector MTP modelling process and assumptions. It is
recommended that is referred to when using this briefing note.

Version: 1.0
First created: 11/03/2011 Updated: http://efficient-products.defra.gov.uk Last reviewed: 11/03/2011 2 of 49 0845 600 8951
1.1 Water sector MTP goal
The purpose of the MTP is to create opportunities that will transform the market towards
more sustainable products. The goal of this MTP is to significantly increase the market
share of the most sustainable shower product types, by elevating sales of these products
above current levels, and above what is projected under the Reference Scenario. Detailed
information on different types of shower is presented in Appendix A.
The current trend is for a rapidly increasing number of customers to own showers that
provide high flow-rate, which together with higher frequency of use, results in water and
energy use by showers often being greater than for baths1. The MTP aim to slow, halt, or
reverse this trend.
1.2 Purpose of the briefing note
The overall purpose of this briefing note is to inform and advise Government and other policy
makers and stakeholders of the environmental benefits of implementing policies and taking
actions to actively transform the market.
The projections in the MTP define three scenarios, based on assumptions on sales and
stock levels of products: Reference, Policy, and Earliest Best Practice (EBP) and the
environmental implications of each. These scenarios reflect what is possible if a set of
actions is taken. These scenarios should not be considered to be forecasts. These
projections are for households in England and Wales only.
Other analysts may assess and use the MTP assumptions as a basis on which to develop
their own consumption forecasts. For example, water industry users may use this
information to benchmark their individual forecasts and assumptions. Supporting information
on the product types, historical stock levels, product specifications and testing, and
associated technical issues are included within appendices. More information on how water
is used in different buildings is available in briefing note BNWAT06 Water use in new and
existing buildings”.
1 United Utilities (2007). Water and Energy Efficient Showers. Project Report.

Version: 1.0
First created: 11/03/2011 Updated: http://efficient-products.defra.gov.uk Last reviewed: 11/03/2011 3 of 49 0845 600 8951
1.3 Content of the briefing note
This briefing note contains the following information:
Section Information
1 Introduction
2 Shower market scenarios: Base year and scenario assumptions, projection outputs, scenario actions
3 Environmental benefits: water and energy consumption per scenario
4 Recommendations to progress the water sector MTP
Appendix A
Product details
A.1 Shower product definitions
A.2. Volume per use
A.3 Shower lifespan
A.4 Shower product innovations
Appendix B
The current market
B.1 Showering as a micro-component of water demand
B.2 Existing shower ownership
B.3 Applicability of water efficient models per building type
Appendix C
Transforming the market
C.1 The impact of the globalised market on England and Wales
C.2 Factors that influence consumer use and uptake of showers
Appendix D
WC Technical specification and testing
D.1 Regulations
D.2 Standards
D.3 Performance criteria and tests
D.4 Impact of water supply systems on shower performance

Version: 1.0
First created: 11/03/2011 Updated: http://efficient-products.defra.gov.uk Last reviewed: 11/03/2011 4 of 49 0845 600 8951
2 Shower market scenarios
2.1 Future market scenarios
The three standard scenarios presented in this briefing note are in-line with those used
elsewhere in the wider MTP. The scenarios are used to project and demonstrate the
potential impacts of the market transformation strategies, actions and targets. These are:
The “Reference Scenario”: This is a projection of what is likely to happen without any
new policy intervention. The scenario is based on current trends, technology
developments and policies that are already in place.
The “Policy Scenario”: This scenario estimates what could be achieved through an
ambitious but feasible set of policy measures if the agreement of all stakeholders was
obtained.
The “Earliest Best Practice Scenario” (EBP): This is a projection of what could happen
if the best available products and technologies were adopted, coupled with ambitious
Government policies.
The Policy and EBP scenarios assume that the actions required to ensure the successful
implementation of the policies are delivered. The impact of these policy combinations is
translated in the MTP model as projected sales and stock levels (ownership) of each of the
product sub-types. Further information on this is available in BNWAT08 Modelling
projections of water using products.
2.2 Summary of model outputs
Figure 2.1 shows the future water consumption projections for showering under the three
scenarios until 2030. Water consumption increases in all three scenarios which reflect the
shift in bathing patterns. Figure 2.2 shows the water consumption for the model outputs for
showers and baths combined to reflect the overall trend in bathing. Tables 2.1 and 2.2
quantify the consumption data at key time intervals.

Version: 1.0
First created: 11/03/2011 Updated: http://efficient-products.defra.gov.uk Last reviewed: 11/03/2011 5 of 49 0845 600 8951
Figure 2.1 Shower water consumption projections for England and Wales
Shower water consumption - England & Wales
0
100,000
200,000
300,000
400,000
500,000
600,000
1999 2004 2009 2014 2019 2024 2029
Wat
er c
on
sum
pti
on
(M
l/ye
ar)
Reference Scenario Policy Scenario EBP Scenario
Table 2.1 Shower water consumption projections for England and Wales
Year 2010 2015 2020 2025 2030
Ml/year: Reference 325,577 352,531 402,945 442,126 478,059
Ml/year: Policy 325,577 357,023 415,270 464,694 512,972
Ml/year: EBP 325,577 345,643 369,431 384,115 405,081
Version: 1.0
First created: 11/03/2011 Updated: http://efficient-products.defra.gov.uk Last reviewed: 11/03/2011 6 of 49 0845 600 8951
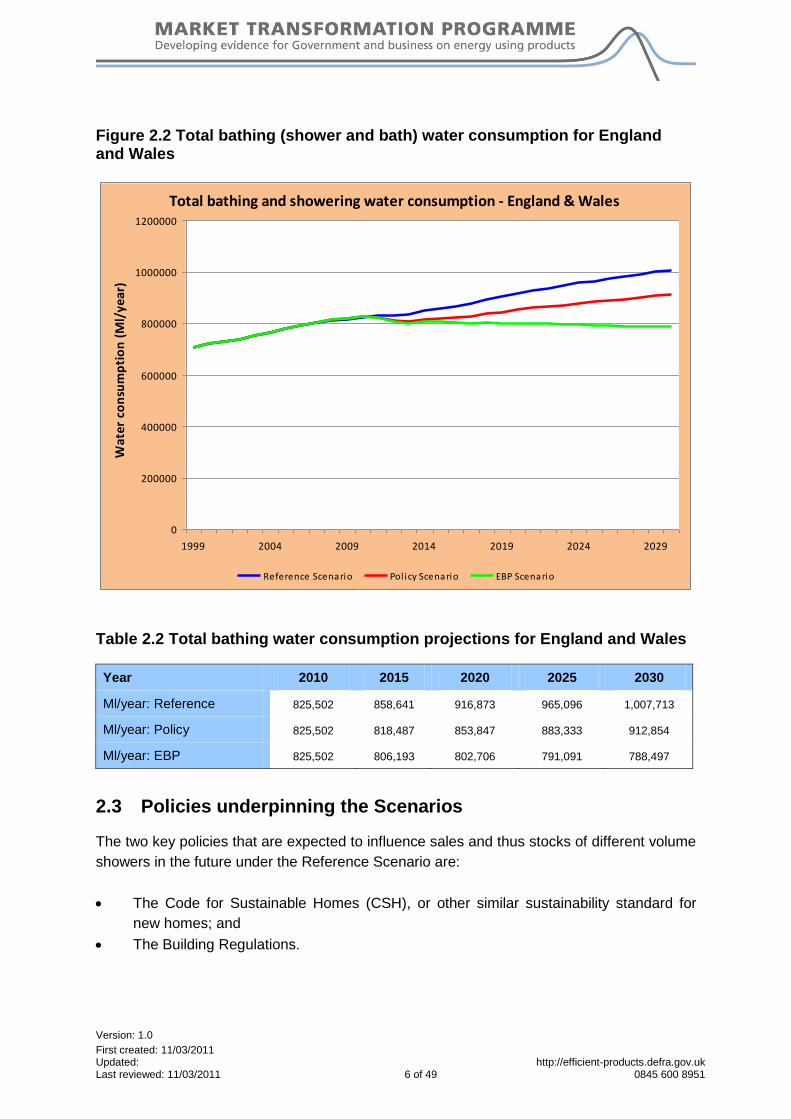
Figure 2.2 Total bathing (shower and bath) water consumption for England and Wales
Total bathing and showering water consumption - England & Wales
0
200000
400000
600000
800000
1000000
1200000
1999 2004 2009 2014 2019 2024 2029
Wat
er c
on
sum
pti
on
(M
l/ye
ar)
Reference Scenario Pol icy Scenario EBP Scenario
Table 2.2 Total bathing water consumption projections for England and Wales
Year 2010 2015 2020 2025 2030
Ml/year: Reference 825,502 858,641 916,873 965,096 1,007,713
Ml/year: Policy 825,502 818,487 853,847 883,333 912,854
Ml/year: EBP 825,502 806,193 802,706 791,091 788,497
2.3 Policies underpinning the Scenarios
The two key policies that are expected to influence sales and thus stocks of different volume
showers in the future under the Reference Scenario are:
The Code for Sustainable Homes (CSH), or other similar sustainability standard for
new homes; and
The Building Regulations.
Version: 1.0
First created: 11/03/2011 Updated: http://efficient-products.defra.gov.uk Last reviewed: 11/03/2011 7 of 49 0845 600 8951
However, under the more ambitious Policy and EBP Scenarios it is assumed that individual
stakeholders will respond to these policies more rigorously, either due to successful
influencing strategies or a reversion to more regulatory based implementation.
Under the Policy Scenario the same drivers exist but there is a greater emphasis on
providing developers, builders and retailers with better information on using lower flow
showers to meet the CSH and Building Regulations. It assumes more effective
implementation and accelerated take up of the more sustainable products. Additional
policies will contribute to the direction driven by CSH and Building Regulations:
Green Deal;
EU Green Procurement Policy;
Ongoing activities of organisations such as Waterwise; and
Developer/Housing Association policies on Smart Refurbishment.
Product labelling.
The policies outlined above will also be relevant to the EBP Scenario, but the impact is
assumed to be much greater, with more households opting for the most efficient products
available, (e.g. a greater number of homes will attempt to achieve Code for Sustainable
Home level 6 thus requiring more water efficient showers)
Additional factors are assumed to result in particularly positive responses to these polices
and other activities under the EBP scenario.
Section 2.4 sets out the base year (2010) assumptions that underpin all three scenarios.
Section 2.5 expands on this describing how water efficiency would manifest under
alternative future scenarios.
Table 2.2 presents more detailed assumptions on how these policies would manifest under
each scenario. Table 2.3 presents the key assumptions of ownership, frequency of use, and
volume per use. Table 2.4 summarises how sales of different product types is projected to
change over time, under the three scenarios. These projections are illustrated in Figure 2.2,
and the impacts on projected stock levels are illustrated in Figure 2.3. The actions that would
be required for this to take place and for the projections to be realised are presented in
sections 2.5.1 to 2.5.3.
2.4 Base year and generic assumptions
The MTP model disaggregates showers into a several sub-products based on electrical
power rating, and variants of mixer shower (Appendix A)2. The results are presented in the
following categories:
Electric showers (all electric);
Gravity showers (mixer and bath/shower mixer); and
2 Further information regarding shower categories and classification is included in: BNWAT08: MTP
Modelling and Assumptions.

Version: 1.0
First created: 11/03/2011 Updated: http://efficient-products.defra.gov.uk Last reviewed: 11/03/2011 8 of 49 0845 600 8951
Power showers (mixer with integral pump, mixer with separate pump and mixer
pressurised, including combination boiler mains fed systems).
The following assumptions have been applied to calculate all three shower projections:
Ongoing development of new-build homes3 has increased the market for bathroom
products in England and Wales. The demand for additional housing, in-line with
changing demographic factors including a higher proportion of single-person
households, will continue to stimulate the new-build sector.
An estimated five million new homes will be built by 2030. House builders choose to
install en-suite bathrooms in a wider variety and greater number of homes which
increases the overall number of showers.
Increasing numbers of existing homes are modified to include additional bathrooms
and/or en-suite facilities. This continues to drive an enlarged shower market.
In 2010, 81 per cent of households in England and Wales had at least one shower
installed: 39 per cent of households had a main shower that was electric; 42 per cent
had a main shower that was a mixer shower; 19 per cent did not have a shower.
There are 19.5 million showers in stock in homes in England and Wales.
In 2010, 1.9 million showers were sold.
By 2030, 2.6 million showers will be sold per annum.
Electric showers have a lifespan of 10 years (with an assumed standard deviation of
five years).
Mixer showers have a lifespan of 12 years (with an assumed standard deviation of five
years).
In 2010 the frequency of showering (excluding other forms of bathing) was 1.04 times
per person per day. This is expected to increase.
The main factors affecting the amount of water used when showering are the flow rate
and duration of shower:
The MTP model calculates volume per use by multiplying the flow rate by the
showering duration.
Shower duration is expected to increase. The model assumes duration of 5.31
minutes in 2010 increasing to 5.4 minutes in 2015 and 5.5 minutes from 2020
onwards.
The model calculates the weighted average flow rate for all mixer showers (gravity and
power). It then calculates consumption based on the weighted average of the product
ranges being sold and consumption in existing stock. This takes the impact of savings
through retrofit devices into account.
Further detail on the implications of population growth and housing development on the
shower market is presented in Appendix C.
3 England: www.communities.gov.uk/documents/housing/xls/table-104.xls
Wales: www.communities.gov.uk/documents/housing/xls/table-106.xls

Version: 1.0
First created: 11/03/2011 Updated: http://efficient-products.defra.gov.uk Last reviewed: 11/03/2011 9 of 49 0845 600 8951
Table 2.2 Shower scenario projections assumptions
Scenario Reference Policy EBP
Total ownership
Ownership of mixer showers is assumed to
increase from 42 per cent (of all households) in
2010 to 52 per cent in 2030 and electric showers
from 39 per cent in 2010 to 42 per cent in 2030.
The ownership of showers is the same as the
reference scenario, however the flow rates of
both electric and mixer showers are slightly less
than in the Reference Scenario.
The ownership of showers is the same as the
Reference Scenario; however the flow rates of both
electric and mixer showers are much less than in the
Reference Scenario.
New build installations
The Code for Sustainable Homes (CSH) and the
Building Regulations drive uptake of water efficient
shower heads, but this activity does not reverse the
overall trend of increasing shower water
consumption.
More new homes are built to higher water
efficiency standards adhering to the Building
Regulations or the Code for Sustainable Homes.
Consequently, the average flow rate of showers
declines as more water efficient shower heads
and/or flow restrictors are installed.
More new homes are built to the highest water
efficiency standards set out in the Code for
Sustainable Homes.
Replacement of existing stock
The market for shower products increases as more
people switch from bathing to showering. Electric
showers are particularly popular. Plumbing
systems in the UK are moving towards combination
boilers and mains hot water systems. Within the
mixer shower range, power showers are
increasingly common.
The difference between the Policy and EBP Scenario
is the more rapid slow down in sales of power
showers in existing homes.
Flow rate The average flow rate of electric showers increases
from 5 litres to 5.07 litres by 2030. Mixer shower
volumes decline from 9.4 to 9.1 litres by 2030.
Flow rates from electric and mixer showers
decline at a faster rate: from 5.0 and 9.4
litres/min in 2010 to 4.8 and 8.9 litres/min by
2030, respectively.
Flow rates from electric and mixer showers decrease
more significantly and at a faster rate, from 5.0 and
9.4 litres/min in 2010 to 4.1 and 6.9 litres/min by 2030.
respectively.
Frequency of use
There is an overall increase in showering as more
people switch from taking baths to showering.
Overall frequency of showering increases due to
the immediacy and convenience of showers
compared to baths.
The frequency of use increases further with the
policy and EBP scenarios. This is supported by
research undertaken by United Utilities that
indicates there is a growing trend toward daily or
twice daily showering because of the ease of
taking a shower4.
There is an overall increase in showering, with both
electric and gravity shower use increasing as
showering in general increases.
Frequency of use increases which reflects the shift
from bathing to showering as per the policy scenario.
4 United Utilities (2007). Water and energy efficient showers. Project Report

Version: 1.0
First created: 11/03/2011 Updated: http://efficient-products.defra.gov.uk Last reviewed: 11/03/2011 10 of 49 0845 600 8951
Table 2.3 presents the ownership, volume per use, and frequency of use data used in the
MTP model, which may help to inform demand forecasts.
Table 2.3 Ownership, volume, and frequency of use
Reference Scenario
Year 2010 2015 2020 2025 2030
Ownership: Electric shower 0.39 0.44 0.46 0.47 0.48
Ownership: Mixer shower 0.42 0.45 0.46 0.45 0.46
Frequency of use 1.04 1.09 1.16 1.19 1.21
Volume: Electric shower 26.54 27.37 27.88 27.88 27.88
Volume: Mixer shower 49.80 49.99 50.58 50.21 50.03
Policy Scenario
Year 2010 2015 2020 2025 2030
Ownership As per the Reference Scenario
Frequency of use 1.04 1.12 1.21 1.27 1.33
Volume: Electric shower 26.54 26.48 26.71 26.63 26.63
Volume: Mixer shower 49.80 49.67 50.21 49.74 49.34
EBP Scenario
Year 2010 2015 2020 2025 2030
Ownership As per the Reference Scenario
Frequency of use 1.04 1.12 1.21 1.27 1.33
Volume: Electric shower 26.54 24.77 23.36 22.58 22.42
Volume: Mixer shower 49.80 39.71 39.24 38.39 37.72
See BNWAT08: Modelling and Assumptions for information on the assumptions
Mixer shower volume is a modelled average of the different types of mixer shower that are
available. The dramatic reduction in mixer shower volume under the EBP Scenario by 2015
reflects the change in the mix of shower type sales, particularly the reduction in sales of
showers with integral pumps which have a much higher flow rate than other types of mixer.

Version: 1.0
First created: 11/03/2011 Updated: http://efficient-products.defra.gov.uk Last reviewed: 11/03/2011 11 of 49 0845 600 8951
Table 2.4 Product mix of showers under the scenarios
Percentage of sales: England and Wales – Reference Scenario
Sub Product Electric Mixer Power shower
Average flow rate (l/min) 5 7.2 11.8
2010 48 27 25
2015 50 26 24
2020 50 26 24
2025 51 26 23
2030 51 26 23
Percentage of sales: England and Wales – Policy Scenario
Sub Product Electric Mixer Power shower
Average flow rate (l/min) 5 7.2 11.8
2010 48 27 25
2015 49 27 24
2020 50 28 22
2025 51 29 21
2030 51 29 20
Percentage of sales: England and Wales – EBP Scenario
Sub Product Electric Mixer Power shower
Average flow rate (l/min) 5 7.2 11.8
2010 48 27 25
2015 49 27 24
2020 50 29 21
2025 51 30 19
2030 51 32 17
Version: 1.0
First created: 11/03/2011 Updated: http://efficient-products.defra.gov.uk Last reviewed: 11/03/2011 12 of 49 0845 600 8951
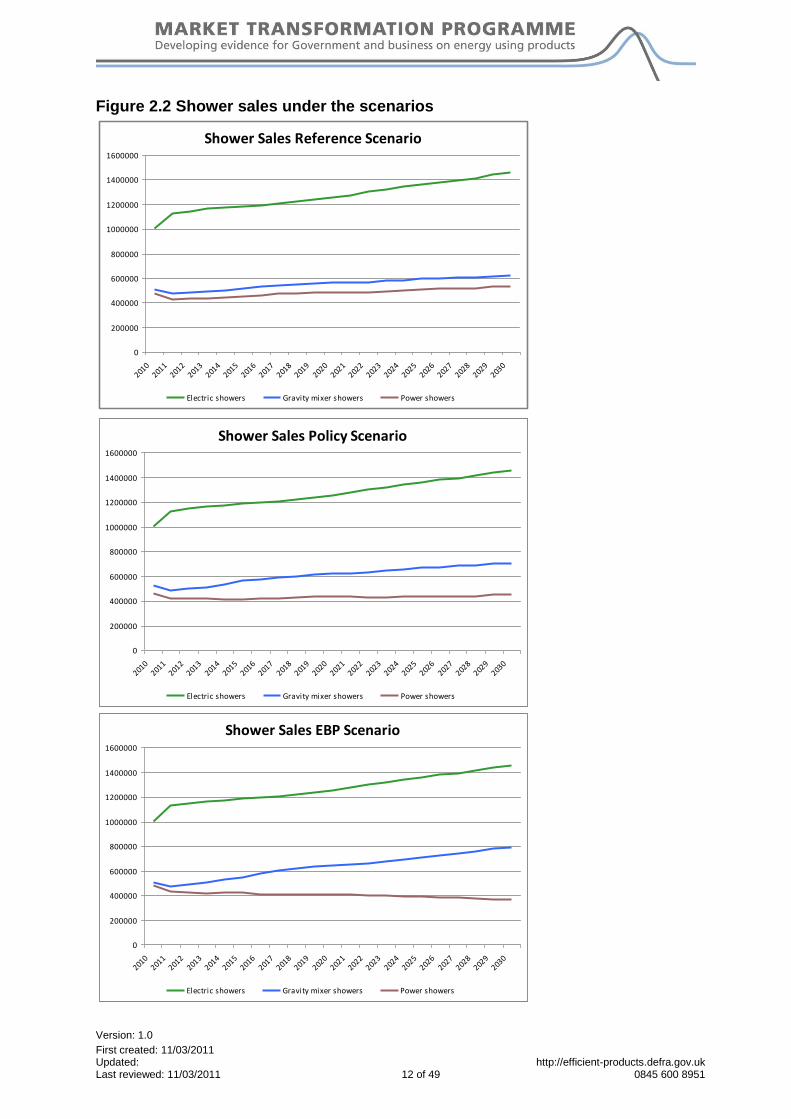
Figure 2.2 Shower sales under the scenarios
Shower Sales Reference Scenario
0
200000
400000
600000
800000
1000000
1200000
1400000
1600000
2010
2011
2012
2013
2014
2015
2016
2017
2018
2019
2020
2021
2022
2023
2024
2025
2026
2027
2028
2029
2030
Electric showers Gravity mixer showers Power showers
Shower Sales Policy Scenario
0
200000
400000
600000
800000
1000000
1200000
1400000
1600000
2010
2011
2012
2013
2014
2015
2016
2017
2018
2019
2020
2021
2022
2023
2024
2025
2026
2027
2028
2029
2030
Electric showers Gravity mixer showers Power showers
Shower Sales EBP Scenario
0
200000
400000
600000
800000
1000000
1200000
1400000
1600000
2010
2011
2012
2013
2014
2015
2016
2017
2018
2019
2020
2021
2022
2023
2024
2025
2026
2027
2028
2029
2030
Electric showers Gravity mixer showers Power showers

Version: 1.0
First created: 11/03/2011 Updated: http://efficient-products.defra.gov.uk Last reviewed: 11/03/2011 13 of 49 0845 600 8951
Figure 2.3 Shower stock levels under the scenarios
0
2000000
4000000
6000000
8000000
10000000
12000000
14000000
16000000
Shower stock levels Reference Scenario
Electric showers Gravity mixer showers Power showers
0
2000000
4000000
6000000
8000000
10000000
12000000
14000000
16000000
Shower stock levels Policy Scenario
Electric showers Gravity mixer showers Power showers
0
2000000
4000000
6000000
8000000
10000000
12000000
14000000
16000000
Shower stock levels EBP Scenario
Electric showers Gravity mixer showers Power showers
Version: 1.0
First created: 11/03/2011 Updated: http://efficient-products.defra.gov.uk Last reviewed: 11/03/2011 14 of 49 0845 600 8951
2.5 Actions
Action is required to transform the market. Many of the actions require Government to take
the lead but other stakeholders would be required to take ownership of actions to ensure that
market transformation takes place.
2.5.1 Actions to achieve the Reference projection
The Reference Scenario is not very demanding. It requires current policies and activities to
continue, such as the manufacture, sale and promotion of efficient showers.
Actions to deliver the Reference Scenario projection:
Manufacturers should continue to produce the water efficient showers that are
currently available.
Water companies should continue to inform customers on water efficiency in general,
how they can save water in the shower, and how saving hot water will help them to
reduce their energy bills. This is a key action, required to address ongoing concerns
regarding the performance of efficient showers.
Retailers should to continue stocking water efficient showers, shower heads and flow
regulation devices.
The manufacturing and retail sector should consider whether testing regimes are
required in order to enable meaningful labelling schemes for shower performance to be
developed. Testing should reflect real-world conditions, taking account of how mains
supply pressures affect shower flow rates. Testing results should be shared and
should be used to influence design and manufacture, if appropriate.
2.5.2 Actions to achieve the Policy projection
The focus of the Policy Scenario is to encourage sales of „normal‟ mixer showers at the
expense of power showers. No action is required to further encourage uptake of electric
showers.
Participants at a “Guardian Sustainable Business”5 event discussed the approaches that
successful businesses are using to influence consumer sustainable behaviours and
procurement choices. One key point is that business and Government should move away
from trying overtly to convince people to change. Messaging and influencing actions need to
be much more subtle, appealing to relevant values and behaviours that will in turn generate
the procurement choice required. Appealing to peoples‟ values to change behaviour is one
option, but actively incentivising people to change their behaviour can in turn lead to a
change in values that may be sustained in the longer term. The following list of actions
5 http://www.guardian.co.uk/sustainable-business/events (quotes protected under the Chatham House
Rule).

Version: 1.0
First created: 11/03/2011 Updated: http://efficient-products.defra.gov.uk Last reviewed: 11/03/2011 15 of 49 0845 600 8951
includes various steps to implement the policies that have been specified, but also actions
that target consumer procurement choices:
Purchasers of water-using products (i.e. the public) need to know who they can trust to
give them information on the consumption level and performance of products. At a
stakeholder workshop in 2010, the general consensus was that information is better
received from sources that are independent of the water companies. Stakeholders
across the industry need to work together to identify/develop a source of information
that is independent, credible, and trustworthy. This would support the next action:
The Water Industry (companies and regulators) should examine the feasibility of
targeted pressure regulation in homes in areas where high mains pressures are
unavoidable6.
To achieve the Policy Scenario, customers need to be actively dissuaded from
purchasing power showers. This would be achieved through a combination of better
information and financial measures. Water companies and energy companies should
give customers more information on how their water and energy consumption is
affected by high volume showering, supported by information on products that are
available to help them to reduce their shower flow rate.
Manufacturers and researchers should continue to work together to continue improving
the shower experience as well as the style of water efficient showers, so that there is a
water efficient showerhead to suit all bathroom styles. Shower manufacturers should
produce and promote water saving showerheads that limit flow without impairing
customer acceptance. They should be fixed-head and not provide the user with an
opportunity to select higher flow setting7.
The Bathroom Manufacturers Association (BMA) should pursue the implementation of
a single, consistent product labelling scheme to be adopted by manufacturers and
retailers within England and Wales. This would require leadership from the BMA to
encourage collaboration between manufacturers and retailers to progress this.
Product labels should provide clear information on how much water (including hot
water) the product uses, how this translates into the water efficiency level of the
product, and the energy and carbon implications of the shower (comparative to other
products that are available).
A labelling scheme once developed, should be applied to all UK sales (including
imports). Any scheme needs to consider the risk that some customers could be
deterred from buying a shower labelled as „efficient‟ or ranked with a low flow rate
because they assume that these products will be less effective with lower
performance.
6 United Utilities (2007). Water and Energy Efficient Showers. Project Report 7 United Utilities (2007). Water and Energy Efficient Showers. Project Report

Version: 1.0
First created: 11/03/2011 Updated: http://efficient-products.defra.gov.uk Last reviewed: 11/03/2011 16 of 49 0845 600 8951
The Government, water companies, energy companies, and manufacturers should
make more use of the studies that have been done to examine the relationship
between shower flow rate and shower performance (as perceived by user). This
information should be more widely distributed to help combat perceptions that water
efficiency leads to an inadequate shower experience.
Marketing strategies for water efficient showers need to be developed so that the
emphasis is on the most modern, best available technologies, rather than reduced flow
rate. It is recommended that the BMA takes the lead on this, liaising with its members
on the importance of appropriate messages.
Public workshops have suggested that information on its own is insufficient to change
buying habits and that financial incentives are needed to persuade customers to buy
water efficient showers. The cost of products needs to be examined in detail to clarify
if there is a price premium on water efficient products. Further action would then be
necessary to target this. Fiscal incentives could be considered, however, this action
may be more appropriate to achieve the EBP Scenario.
Under a Policy Scenario it is unlikely that manufacturers will stop producing high flow
„luxury‟ showers. Retrofit devices that can be installed in new and existing showers
are more likely to be acceptable. The Government, water companies, and energy
companies should work together to influence retailers to include water efficient shower
heads and flow restrictors within their product range, and actively promote these to
customers, alongside the standard shower units, with the consumption information.
The market must be able to respond to changes in demand, so that customers can
access more water efficient products. Retailers need to provide a range of water
efficient products in different styles. These products need to be clearly promoted in
store and online.
The Policy Scenario assumes that sustainable water using products will be promoted
by organisations such as the BMA, and manufacturers/retailers keen to demonstrate
their green credentials.
2.5.3 Actions to achieve the Earliest Best Practice (EBP) projection
To achieve the flow reductions required under the EBP scenario the Government may
need to consider introducing specific maximum flow limits for shower installations.
However, this would not be possible through the Building Regulations which would
only reach new build homes. Amendments to the Water Supply (water fittings)
Regulations may be the most effective EBP route, but the Regulations must be
compatible with legislation regarding European trade barriers.
Fiscal incentives (or disincentives) to dissuade customers from buying inefficient
shower products should be considered. The retailers and manufacturers should

Version: 1.0
First created: 11/03/2011 Updated: http://efficient-products.defra.gov.uk Last reviewed: 11/03/2011 17 of 49 0845 600 8951
consider development of a scheme to encourage the removal of existing power
showers or installation of low flow retrofits.
Some water companies (e.g. Portsmouth Water8) already have a policy to meter
customers who have a power shower (in the same way as they meter on ownership of
a sprinkler) but this is not universal and there is no information on how this is enforced.
Under an EBP scenario this is a policy that if implemented on a wide scale could
significantly influence people‟s decisions to buy and install a power shower, although it
is likely that this would meet with some resistance from customers and retailers.
Retailers should amend their product lines to improve the availability of efficient
showers in place of power showers. It would be beneficial for all retailers to co-operate
and reach agreement regarding their product ranges to ensure a level playing field so
one retailer isn‟t benefitting from stocking higher volume power showers. The
Government may need to develop voluntary agreements with the major retailers to
begin the process. The BMA may have a critical role in facilitating discussions
between retailers and manufacturers to ensure that the manufacturing base and
product orders are aligned.
Retailers would have to manage customer expectations regarding the perceived
advantages of power showers. To help retailers, it is recommended that retailers work
with other stakeholders to inform customers on wider water resources management
issues and overcome perceptions about efficient showers.
8 http://www.portsmouthwater.co.uk/customer_services/default.aspx?id=256

Version: 1.0
First created: 11/03/2011 Updated: http://efficient-products.defra.gov.uk Last reviewed: 11/03/2011 18 of 49 0845 600 8951
3 Environmental Benefits of the MTP
3.1.1 Reduced water consumption
This section quantifies how much water could be saved per person and across England and
Wales as a result of achieving the Policy and EBP scenarios. It takes into account the
population forecasts published by the Office of National Statistics. The water saved is
assumed to be potable water. The calculations are based on the assumptions set out in
Section 2. Figure 3.1 illustrates the projections of total water consumption from showers
across England and Wales. Table 3.2 summarises the main results and quantifies the water
savings.
Figure 3.1 Total annual shower water consumption across England and Wales
Shower water consumption - England & Wales
0
100,000
200,000
300,000
400,000
500,000
600,000
1999 2004 2009 2014 2019 2024 2029
Wat
er c
on
sum
pti
on
(M
l/ye
ar)
Reference Scenario Policy Scenario EBP Scenario
Table 3.2 Total annual shower water consumption across England and Wales
Total WC consumption (Ml/year) Total (Ml/yr) Saved
Year Reference Policy EBP Policy EBP
2000 220,711 220,711 220,711 0 0
2010 325,577 325,577 325,577 0 0
2015 352,531 357,023 345,643 4,492 6,888
2020 402,945 415,270 369,431 12,325 33,514
2030 478,059 512,972 405,081 34,913 72,978

Version: 1.0
First created: 11/03/2011 Updated: http://efficient-products.defra.gov.uk Last reviewed: 11/03/2011 19 of 49 0845 600 8951
Water consumption is highest in the Policy Scenario due to increased numbers of people
showering more frequently as policies and social trends favour showering rather than
bathing. Figure 2.2 shows that overall shower and bath water consumption is lower in the
Policy and EBP scenarios than in the Reference Scenario.
These figures are based at the national level and whilst saving water is an issue for the
whole country, the „value‟ of water is likely to be greatest in areas of water stress, particularly
the south and east. More information on this is available in the Environment Agency
publication, Areas of Water Stress Final Report9. Demand management is a key option to
reduce pressure on resources. However, in many parts of the country demand for water is
driving the need for water transfers and other supply side options.
Significant energy is required to transfer water (raw water or potable) and to treat raw water
to potable quality, lower quality raw water requiring more treatment and thus more energy.
Therefore, the „value‟ of saving water is greatest in areas where pumped transfers of water
are greatest, and where there are significant treatment requirements.
3.1.2 Reduced energy consumption
This section is concerned with the potential energy savings that households could achieve
under the Policy and EBP scenarios. More detailed information and facts on the relationship
between water and energy use is available within BNWAT07 Water and Energy Use.
Embodied energy in Showering
By reducing the volume of water that is required for shower use it is possible to reduce the
amount of water that is abstracted, treated, distributed (clean water), and moved through the
sewer collection system to be treated (wastewater). Therefore, less energy will be required
within these services. However, it should be noted that the impact of reduced volumes will
have a negligible impact on the energy requirements associated with treating wastewater to
discharge as this is largely driven by load (quantity of contaminant matter rather than total
volume of water).
In England and Wales households use approximately 1.1 million Ml of hot water each year
(excluding washing machines and dishwashers) and this is forecast to increase to 1.3
million10 Ml/yr by 2030 unless hot water is used more efficiently11. Total carbon emissions
arising from hot water use in households is approximately 9.9 MtCO2e/year (1.5 per cent of
the total UK net carbon emissions12. Boiler inefficiencies are a key element driving high
energy consumption and associated emissions.
9 Environment Agency (2007). Areas of water stress: final classification
10 BNWAT08 Water and energy use.
11 2010 water sector MTP model
12 BNWAT08 Water and energy use.

Version: 1.0
First created: 11/03/2011 Updated: http://efficient-products.defra.gov.uk Last reviewed: 11/03/2011 20 of 49 0845 600 8951
Energy directly associated with Showers
Showering requires hot water, which is heated in the home, usually by either a gas-fired
boiler or by the element in electric showers. Pumped showers use additional energy. The
2007 study by United Utilities13 reports that a pump uses 300 watts per use.
The amount of energy used by a shower depends on the following factors:
The type of water supply system (see Appendix D.4);
Boiler efficiency (electric showers are assumed to be 100per cent efficient);
Heat losses in internal plumbing systems;
Showering water temperature;
The power rating of the shower (for electric showers);
Type and presence of a pump (for certain types of mixer shower); and
Duration of shower.
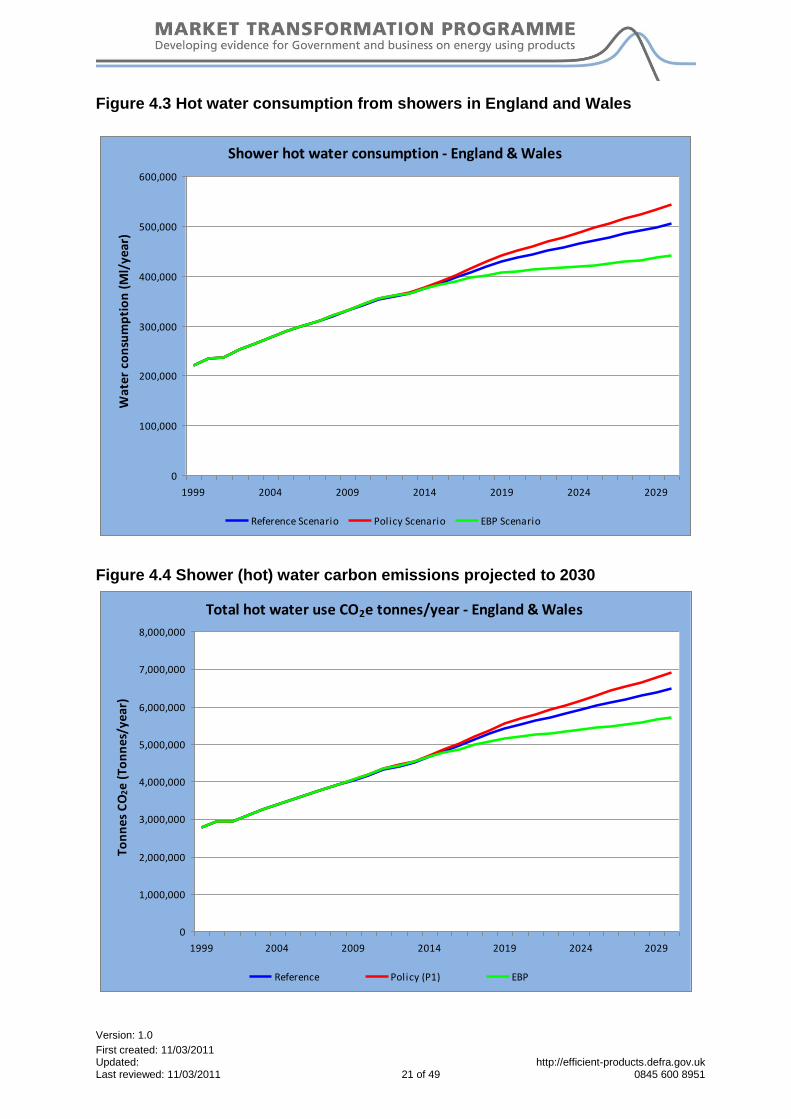
Figure 4.3 shows the projected demands for household hot water use (showers) in England
and Wales under the Reference baseline, Policy, and EBP scenarios. Reducing water use
by transforming the market towards more efficient water using products will also reduce
energy use.
13
United Utilities (2007). Water and Energy Efficient Showers. Project Report
Version: 1.0
First created: 11/03/2011 Updated: http://efficient-products.defra.gov.uk Last reviewed: 11/03/2011 21 of 49 0845 600 8951
Figure 4.3 Hot water consumption from showers in England and Wales
Shower hot water consumption - England & Wales
0
100,000
200,000
300,000
400,000
500,000
600,000
1999 2004 2009 2014 2019 2024 2029
Wat
er c
on
sum
pti
on
(M
l/ye
ar)
Reference Scenario Policy Scenario EBP Scenario
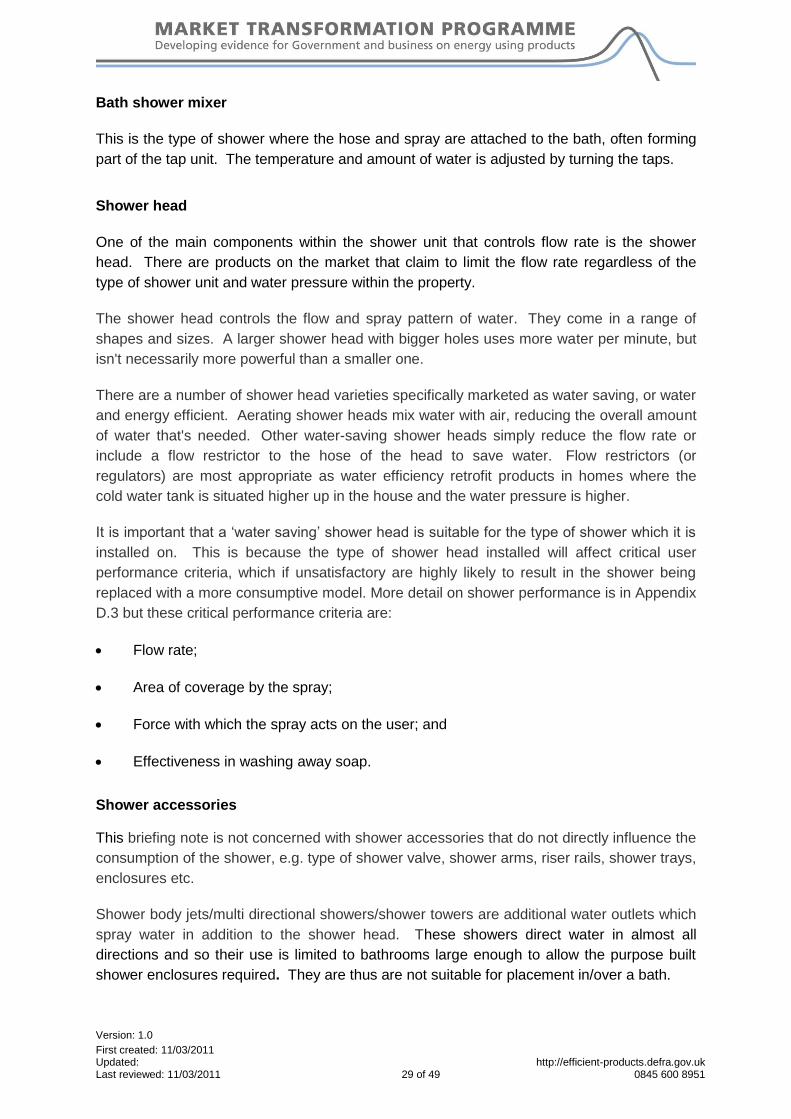
Figure 4.4 Shower (hot) water carbon emissions projected to 2030
Total hot water use CO2e tonnes/year - England & Wales
0
1,000,000
2,000,000
3,000,000
4,000,000
5,000,000
6,000,000
7,000,000
8,000,000
1999 2004 2009 2014 2019 2024 2029
Ton
nes
CO
2e
(To
nn
es/y
ear)
Reference Policy (P1) EBP

Version: 1.0
First created: 11/03/2011 Updated: http://efficient-products.defra.gov.uk Last reviewed: 11/03/2011 22 of 49 0845 600 8951
Table 4.3 Total annual carbon emissions associated with shower hot water
Total Shower CO2e (Tonnes/year) CO2e saving (Tonnes /year)
Year Reference Policy EBP Policy EBP
2000 2,927,704 2,927,704 2,927,704 0 0
2010 4,157,553 4,157,553 4,157,553 0 0
2015 4,801,987 4,851,498 4,764,833 49,511 37,154
2020 5,519,084 5,663,900 5,206,279 144,816 312,806
2030 6,478,195 6,910,474 5,719,564 432,278 758,632
The results show that under the Policy Scenario carbon emissions would actually increase
within the shower group. This reflects the aims of the policies to increase uptake and use of
showers over baths. However, these results should be considered in line with the overall
results which clearly show that total carbon emissions in the Policy and EBP Scenarios
would be significantly lower than in the Reference Scenario, as the switch from bathing to
showering results in overall less hot water use for total personal washing.
More detailed information on water and energy is included in BNWAT07: Water and Energy
Use.

Version: 1.0
First created: 11/03/2011 Updated: http://efficient-products.defra.gov.uk Last reviewed: 11/03/2011 23 of 49 0845 600 8951
4 Recommendations to progress the water sector MTP
The MTP needs to identify and implement actions to overcome customers‟ habitual
procurement decisions and reluctance to buy water efficient products:
In the longer term there is clearly a need for the MTP to take more and better account
of behaviour. Further work and decisions need to be made to confirm the appropriate
remit of MTP. Relevant areas may include: considering how existing behaviours and
perceptions affect consumer choice of products.
There is a clear need for more research to understand the drivers behind consumer
choice and then develop further actions directly targeting this important aspect of water
use. The MTP and the water industry need to understand more about public
perceptions of water efficiency. It will be important to consider how „efficient‟ products
should be promoted if user behaviour can easily render them inefficient. For example,
the promotion of low flow showers that do not provide an acceptable user experience
which are then removed.
Better and more effective use of international experience and case studies targeting
customer purchases would add value to the MTP. It is necessary to understand the
context of those situations, including the incentives that those overseas customers
have (EBP scenario). Reviews of international experience must consider factors
relevant to England and Wales specifically, including plumbing systems, drainage
systems, the price of water, and information on water scarcity.
When discussing water efficiency in new developments one issue that often come up
is the potential negative impact of reduced flows on drainage and sewerage
processes. The Environment Agency has published research examining the impact of
water efficiency on drainage14. Its report concludes that, while the full impact of
demand reductions on wastewater flows is not fully understood, it may result in
increased sewer blockages and other operational problems such as odour complaints
and sewer flooding…However, other issues such as the inappropriate use of sewers to
dispose of unwanted food and material based wipes, and the poor condition of some
drainage systems also contribute to the problem. It is important that water efficiency is
not excluded on this basis without all factors being taken into account and so the
Environment Agency results need to be more widely publicised.
Government, utility companies, researchers should continue to explore the potential to
deliver water efficiency in tandem with energy efficiency. The argument that saving
water, especially hot water, can help reduce household and industry energy bills is
powerful. However, whilst the unit price of water supplied is relatively low (e.g. 94p/m3
14
Environment Agency (2008) Less water to waste: Impact of reductions in water demand on wastewater collection and treatment systems. Science project SC060066, Environment Agency, Bristol.

Version: 1.0
First created: 11/03/2011 Updated: http://efficient-products.defra.gov.uk Last reviewed: 11/03/2011 24 of 49 0845 600 8951
average England and Wales15) and the majority of households are still unmetered, the
financial incentive of saving „cold‟ water is not as strong.
In various situations stakeholders companies have expressed the opinion that whilst
water efficiency is appended to energy efficiency it will continue to be viewed as a
secondary, less important resource. Not all the reasons for saving water relate to
energy directly and until water is recognised as important in its own right many of these
issues will not be fully recognised. For example, low flows in groundwater fed rivers
and groundwater resources at risk of saline intrusion due to over abstraction.
Manufacturers have indicated that less desirable products would be phased out using
usual stock management methods. It would be useful for the MTP to better
understand these methods, and the usual timescales to phase out products. In the
longer term the MTP may seek more evidence on supplier capacity.
It is important to understand the size and influence of house-building at a national level
on product uptake. Also, the potential impact of Local Development Frameworks
influencing product uptake, is driven by the number of local authorities mandating, in
their Core Strategies that CSH targets are met.
The actions above target customers‟ propensity to change and their procurement decisions.
However, they need to be supported by actions to improve information classifying showers in
terms of their „resource‟ efficiency (water and energy) and performance:
Manufacturers and British Standards should to work together to develop test standards that
enable the performance of showers to be more readily compared (e.g. soap removal tests
and user experience). More information is required on the performance of showers under
different scenarios (including varying mains pressure), to enable the optimum balance
between performance and resource consumption to be estimated.
Actions to increase uptake of products that can be classified as water efficient require
clear definitions of water efficiency and product performance. At the moment there is
no clear definition of water efficient shower performance. A range of flow rates is used
to describe a product as efficient or highly consumptive. Using the methods in BS
6340 [Showers] manufacturers, the BMA and BSI should work together to improve the
definitions for future use.
Manufacturers should work together with academic researchers to develop a test
procedure to assess overall shower performance in terms of the additional comfort
parameters: temperature gradient and skin pressure. This should include a review
international shower test methodologies, notably those defined in the Australian and
New Zealand Standards and consider their applicability to the UK marketplace. Once
products can be assessed in this way, the results could be incorporated into labelling
15
Ofwat (online). Water service unit costs (2006-07). http://www.ofwat.gov.uk/legacy/aptrix/ofwat/publish.nsf/Content/rpt_int_08unitcostswater.html

Version: 1.0
First created: 11/03/2011 Updated: http://efficient-products.defra.gov.uk Last reviewed: 11/03/2011 25 of 49 0845 600 8951
schemes to help consumers understand and compare the overall performance of the
products that are available.
The MTP should work with manufacturers the BMA and water companies to examine
and address the issue of multiple shower head units, to determine their impact on
consumption. Issues to be resolved include whether each shower head should be
rated individually and then averaged, or whether their ratings should be added
together. In the current review of the Australian and New Zealand Standard,
consideration is being given to defining the performance (including flow rate) of a multi-
head shower system as the sum of its parts. Some water companies, such as
Portsmouth Water16, have policies to compulsorily meter customers who have a power
shower. This type of policy should consider the overall flow impact of multi-shower
heads.
The industry needs to better understand the impact of water pressure on water
consumption and thus the efficiency of water using products, especially showers. The
Government and water companies should work together to organise data collation and
analysis of the main plumbing systems in England and Wales. It is recommended that
the MTP/water companies liaise with plumbing trade bodies to support this action. The
research should provide robust and easy to understand information on the impact
between water pressure and water consumption. It is possible that available water
pressure could be a limiting factor in the growth of very highly consumptive showers.
The outputs of this may impact on the development of a labelling system.
In line with stakeholder comments, longer term improvements of the water sector MTP may include:
Making more use of the MTP energy sector „What-if‟ tool for water using products. The
tool presents a range of scenarios on the future energy consumption until 2020 for
nearly 30 domestic and commercial products. As with the water sector MTP it includes
a Reference Scenario, a Policy Scenario, and an Earliest Best Practice Scenario. This
tool could provide an option to explore regional variation.
Implementing regular reality checks to ensure MTP is accurate and relevant.
Quantifying the uncertainty in the modelling outputs.
Collating better data to understand the base year situation and to inform the
projections. More work is needed to determine exactly what data would deliver the
required improvements: topic areas (e.g. household data, plumbing systems data,
behavioural research, product sales, etc), sources of data, frequency of updates,
quality assessment, responsibilities to provide and analyse data, etc. Any actions to
identify and collate data must take into account commercial sensitivities/confidentiality.
16
http://www.portsmouthwater.co.uk/customer_services/default.aspx?id=256

Version: 1.0
First created: 11/03/2011 Updated: http://efficient-products.defra.gov.uk Last reviewed: 11/03/2011 26 of 49 0845 600 8951
It is important that the data relationship between the MTP and the data providers (e.g.
the water companies) does not become circular i.e. that water company data that is
based on the MTP briefing notes is not used as a source to update future MTP
information. Information on micro-components has been examined by isolating data
from the small number of companies that did not use the MTP to develop their own
analyses. The MTP should work more closely with the water industry to ensure that
the most appropriate and robust micro-component data continues to be made
available.
The MTP should work with Water UK, UK Water Industry Research (UKWIR), water
companies, and the Environment Agency to improve the quality of micro-component
use data and to re-affirm the baseline situation.

Version: 1.0
First created: 11/03/2011 Updated: http://efficient-products.defra.gov.uk Last reviewed: 11/03/2011 27 of 49 0845 600 8951
Appendix A
Product details
A.1 Shower product definitions
This briefing note covers domestic showers only. It does not include safety showers, or
showers not intended for use by humans.
There are two main categories of shower: electric and mixer showers. The major difference
between the types is that electric showers heat the water in the unit so require only a cold
water feed, whilst mixer showers mix inputs from both hot and cold water feeds.
Table A.1 summarises the products included within the MTP models and the shower
volumes used to calculate consumption.
Table A.1 Shower product types included in MTP modelling
Product flow rate Factors affecting actual
volume Regulation/Approval
Electric shower
6 litres per minute* Duration, power capacity,
capacity to heat water to desired
temperature,
incoming water temperature
Building Regulation part 17K caps
total potential consumption. It
does not specifically target
showers.
Mixer shower (no pump)
5 to 15 litres/minute.
Average is
approximately 10-12
litres/minute
Duration, water pressure,
showerhead, flow regulation.
Water Supply (Water Fittings)
Regulations 1999 specify that any
person who proposes to install a
pump or booster drawing more
than 12 litres per minute,
connected directly or indirectly to
a supply pipe shall notify the
water undertaker to gain
consent**
Mixer shower with pump (powershower)
>12 litres/minute. Duration, water pressure,
showerhead, flow regulation.
* “A „good shower‟ by traditional UK standards” (Environment Agency 2007. Conserving water in buildings.)
6 litres/min is typical flow rate from electric showers stated by manufacturers during consultation.
** This requirement is primarily to prevent backflow but it does create an opportunity for water companies to
target pumped use where necessary.
Electric shower
An electric shower rapidly heats cold water as it flows towards the shower head, heating only
the water that is actually used. Electric showers have typical flow-rates of 3 to 8 l/min. The
flows are inherently low and any modification to the showerhead or flow characteristics could
damage the heating unit17. The power output of electric showers is measured in kilo watts
17
United Utilities (2007). Water and Energy Efficient Showers. Project Report.

Version: 1.0
First created: 11/03/2011 Updated: http://efficient-products.defra.gov.uk Last reviewed: 11/03/2011 28 of 49 0845 600 8951
(kW) and varies between 7.5 kW to 10.5 kW. Higher rated showers are able to heat water
more rapidly and deliver higher volumes of heated water through the shower head. An
electric pump can be added to an electric shower to increase the flow rate if the water
pressure is low. A pumped electric shower is not the same as a power shower which is a
type of mixer shower.
Previous briefing notes have examined and projected consumption for each of the shower
power levels. The MTP has consulted manufacturers on this and has confirmed that this
does not add sufficient value in comparison to the level of complication that this introduces.
Therefore, electric showers are considered as one product. Duration of an electric shower is
not restricted to the volume of hot water that is stored in the system.
Mixer shower (sometimes referred to as a manual shower)
A mixer shower is one where the hose and spray come out of a wall unit and there is a
temperature control that blends the hot and cold water supply. Power showers are part of
this group. A gravity fed mixer shower typically runs off hot water from a tank/cylinder. It
can only feed hot water to the shower if the water has been pre heated in the hot water
cylinder. Once the tank is empty, there is no hot water until the boiler has refilled the tank.
Manufacturers suggest that mixer showers are best for homes with high-pressure systems.
Thermostatic mixer showers are essentially a manual mixer shower with an in-built
thermostatic mixing valve, suitable for installations in different types of property. The shower
unit is complete with a built in stabiliser to automatically adjust the water temperature, to
prevent scalding.
Mixer showers may incorporate a pump if the head in a gravity fed system is too low to
provide water at a preferred pressure. A shower pump is an additional piece of plumbing
equipment that is designed to push water through a gravity fed system where there is only
limited space (and thus limited water head) between the bottom of the cold water cylinder
and the shower location.
A conventional Power shower consists of a hot and cold feed (from stored supplies) and an
integral pump. The unit does not require an independent supply from the consumer unit as
no heating of water takes place. The integral electric pump increases the rate of flow from
the shower head, but can only be installed in a positive head of pressure position in the
property. Some manufacturers recommend these in homes with low water pressure as the
pump boosts the flow rate. However, this type of shower is the worst for saving water, and
can quickly use more water than a bath. It is also generally only installed in properties
where there is plenty of hot water storage, as pumped showers can deliver anything
between 11 to 25 litres of blended water per minute. This will drain the average sized
cylinder very quickly.
Shower panels are an all-encompassing shower panel, tower or column which incorporates
a fixed shower head and a shower handset in addition to body jets which combine to offer a
range of showering options. These units can be manually or thermostatically controlled.
The MTP has assumed these products are included as part of the power shower range.
Version: 1.0
First created: 11/03/2011 Updated: http://efficient-products.defra.gov.uk Last reviewed: 11/03/2011 29 of 49 0845 600 8951
Bath shower mixer
This is the type of shower where the hose and spray are attached to the bath, often forming
part of the tap unit. The temperature and amount of water is adjusted by turning the taps.
Shower head
One of the main components within the shower unit that controls flow rate is the shower
head. There are products on the market that claim to limit the flow rate regardless of the
type of shower unit and water pressure within the property.
The shower head controls the flow and spray pattern of water. They come in a range of
shapes and sizes. A larger shower head with bigger holes uses more water per minute, but
isn't necessarily more powerful than a smaller one.
There are a number of shower head varieties specifically marketed as water saving, or water
and energy efficient. Aerating shower heads mix water with air, reducing the overall amount
of water that's needed. Other water-saving shower heads simply reduce the flow rate or
include a flow restrictor to the hose of the head to save water. Flow restrictors (or
regulators) are most appropriate as water efficiency retrofit products in homes where the
cold water tank is situated higher up in the house and the water pressure is higher.
It is important that a „water saving‟ shower head is suitable for the type of shower which it is
installed on. This is because the type of shower head installed will affect critical user
performance criteria, which if unsatisfactory are highly likely to result in the shower being
replaced with a more consumptive model. More detail on shower performance is in Appendix
D.3 but these critical performance criteria are:
Flow rate;
Area of coverage by the spray;
Force with which the spray acts on the user; and
Effectiveness in washing away soap.
Shower accessories
This briefing note is not concerned with shower accessories that do not directly influence the
consumption of the shower, e.g. type of shower valve, shower arms, riser rails, shower trays,
enclosures etc.
Shower body jets/multi directional showers/shower towers are additional water outlets which
spray water in addition to the shower head. These showers direct water in almost all
directions and so their use is limited to bathrooms large enough to allow the purpose built
shower enclosures required. They are thus are not suitable for placement in/over a bath.
Version: 1.0
First created: 11/03/2011 Updated: http://efficient-products.defra.gov.uk Last reviewed: 11/03/2011 30 of 49 0845 600 8951
It is inadvisable to refer to specific shower types as „water efficient‟ or „not efficient‟ due to
the number of variables affecting how much water is used, and the context in which a
shower is to be used. For example, a shower providing less than 6 litres per minute may be
acceptable and more efficient than a 10 litre per minute model for a quick shower in an office
building, but in a house where demand and expectations are greater, 8 litres per minute may
be an „efficient‟ minimum. It is vital that the term „water efficient‟ does not become
synonymous with „poor performance‟.

Version: 1.0
First created: 11/03/2011 Updated: http://efficient-products.defra.gov.uk Last reviewed: 11/03/2011 31 of 49 0845 600 8951
A.2 Volume per use
Volume per use is a function of the flow rate per minute and the duration of the shower.
Flow rate is relatively straightforward to measure, although the actual flow rate of a shower
unit can be affected by the water pressure in the system to which it is connected.
Mixer showers without pumps have typical flow-rates of 5 to 15 l/min. Mixer showers with
pumps have typical flow-rates from 10 to over 20 l/min. The fitting of a flow restrictor or
regulator, or change of showerhead can be used to reduce the flow of a mixer or pumped
shower18.
In 2009, Waterwise published a number of reports and press releases addressing the issue
of shower use, and duration of use. Of particular interest is a report19 arguing against the
claim that women spend much longer in the shower than the often reported average of
around five minutes, and that people over 55 are increasingly turning to showers, but
typically shower for a shorter time than other age groups20.
Information in the United Utilities 2007 study21 reports anecdotal evidence that the
interaction between personal washing products (e.g. showers) may interact with user
behaviour in such a way that produces unexpected results. For example, more efficient
showerheads may lead to an increase in the duration of showers, resulting in overall water
consumption. Behaviour and duration of use is highly variable and relatively poorly
understood.
A.3 Shower lifespan
Estimate of renewal rate
The lifespan of a shower is 15 years. As with other products this will vary from household to
household. Bathroom style trends may affect replacement rates. Plumbing and water
supply systems are likely to influence the consumers decision regarding replacing an electric
shower with a mixer shower or vice versa. Also, shower components may be replaced more
frequently due to damage and wear or tear (e.g. tarnished hose/shower head, broken
thermostat, broken electric dial). Components may be replaced like for like, unless the
whole bathroom suite is to be replaced. The MTP model assumes 15 years is the mean
average and around this is a normal distribution. More detail is available in BNWAT08
Modelling projections of water using products.
Stock data is not disaggregated into metered and unmetered households, i.e. there is
currently no data to show whether uptake of electric showers has been greatest in houses
18
United Utilities (2007). Water and Energy Efficient Showers. Project Report. 19
Waterwise (2009). Women are faster in the shower than we think. Press release, September 2009.
20 Waterwise (2009). Shower power press release. November 2009.
21 United Utilities (2007). Water and Energy Efficient Showers. Project Report.
Version: 1.0
First created: 11/03/2011 Updated: http://efficient-products.defra.gov.uk Last reviewed: 11/03/2011 32 of 49 0845 600 8951
that are on a metered supply. There is no data on which to base estimates of stock
proportions in non-household properties. For more information on how product choice may
differ between building types, particularly between new and existing housing see BNWAT06
Water use in new and existing buildings.
A.4 Product innovation
Innovative products - Recycling showers
In these units water is used once in the showering process and is held in a storage tank and
recycled during a portion of the showering process in place of fresh water. One particular
product from Australia claims that, “the shower always starts with 100 per cent fresh mains
water and then cleans, filters and pasteurises the water before immediate re-use”. Many of
these products (e.g. Water Recycling Shower22 and the Quench Shower23 are still seeking
investment to come fully to market.
Current Manufacturing Capacity
The Bathroom Manufacturers Association (BMA) represents a large number of the
manufacturers trading bathroom water using fittings in the UK. The UK market is supplied
by manufacturers based within the UK and overseas. Within the UK the manufacturing base
is comprised of a mixture of companies with wide product ranges and a smaller number of
specialist companies manufacturing specialist „water efficient‟ products, for example
specialist showerhead companies. The relationships between manufacturers and retailers
vary with some manufacturers retailing their own goods as well as supplying retailers. Other
specialist water efficiency manufacturers provide products/parts to larger manufacturers.
Retailers source products from many suppliers.
Manufacturers and the BMA have stated that they have the capacity to respond to changes
in the market, shifting production to the more water efficient products quickly.
Non technical innovations
Other innovations that could help to transform the market include systems that would
actively encourage customers to opt for the most sustainable products. A labelling scheme
clarifying how much water the product uses based on an average water pressure to aid
comparison, could help consumers make more informed decisions.
There are also a range of products that aim to modify showering behaviour, such as shower
timers and bags for measuring shower volumes. Whilst user behaviour is particularly
important in driving water efficiency in showers, this aspect of water use is beyond the scope
of the MTP and therefore these products are not considered further in this briefing note.
22
http://www.recyclingshower.com.au/ 23
http://www.quenchshowers.com/
Version: 1.0
First created: 11/03/2011 Updated: http://efficient-products.defra.gov.uk Last reviewed: 11/03/2011 33 of 49 0845 600 8951
Appendix B
The current market
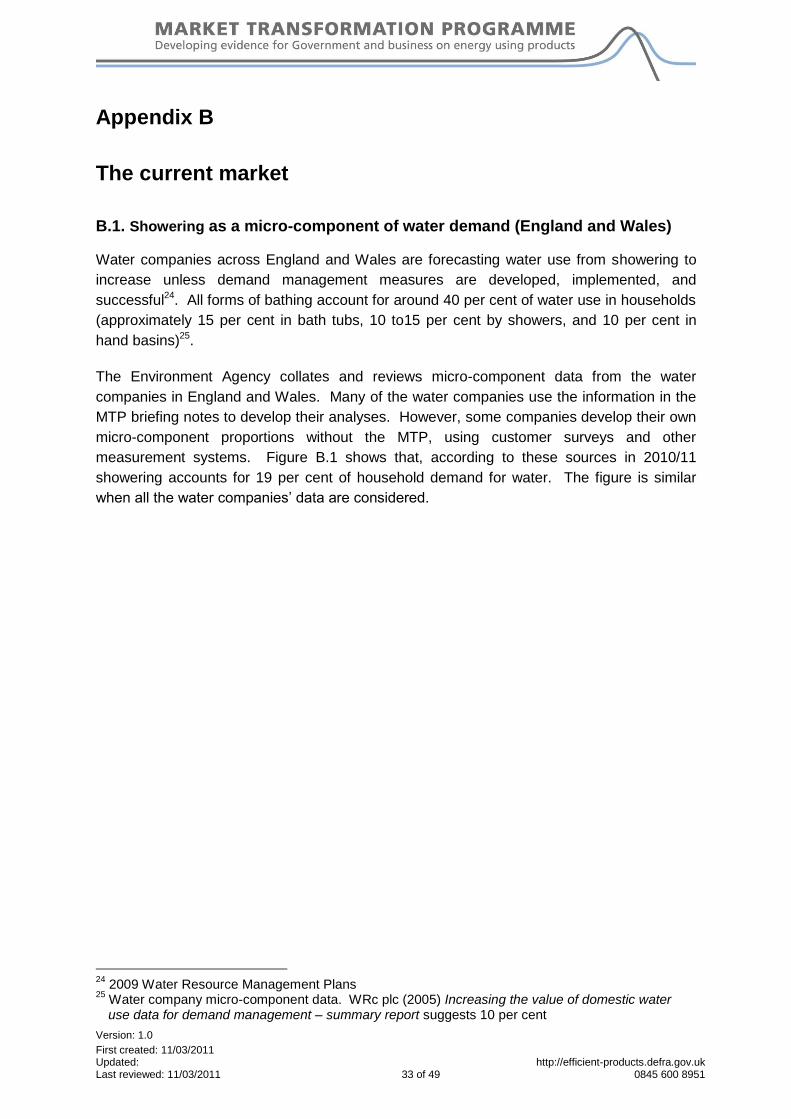
B.1. Showering as a micro-component of water demand (England and Wales)
Water companies across England and Wales are forecasting water use from showering to
increase unless demand management measures are developed, implemented, and
successful24. All forms of bathing account for around 40 per cent of water use in households
(approximately 15 per cent in bath tubs, 10 to15 per cent by showers, and 10 per cent in
hand basins)25.
The Environment Agency collates and reviews micro-component data from the water
companies in England and Wales. Many of the water companies use the information in the
MTP briefing notes to develop their analyses. However, some companies develop their own
micro-component proportions without the MTP, using customer surveys and other
measurement systems. Figure B.1 shows that, according to these sources in 2010/11
showering accounts for 19 per cent of household demand for water. The figure is similar
when all the water companies‟ data are considered.
24
2009 Water Resource Management Plans 25
Water company micro-component data. WRc plc (2005) Increasing the value of domestic water use data for demand management – summary report suggests 10 per cent
Version: 1.0
First created: 11/03/2011 Updated: http://efficient-products.defra.gov.uk Last reviewed: 11/03/2011 34 of 49 0845 600 8951
Figure B.1 Micro components of household water consumption
Source: Water company WRMPs (based on customer surveys)
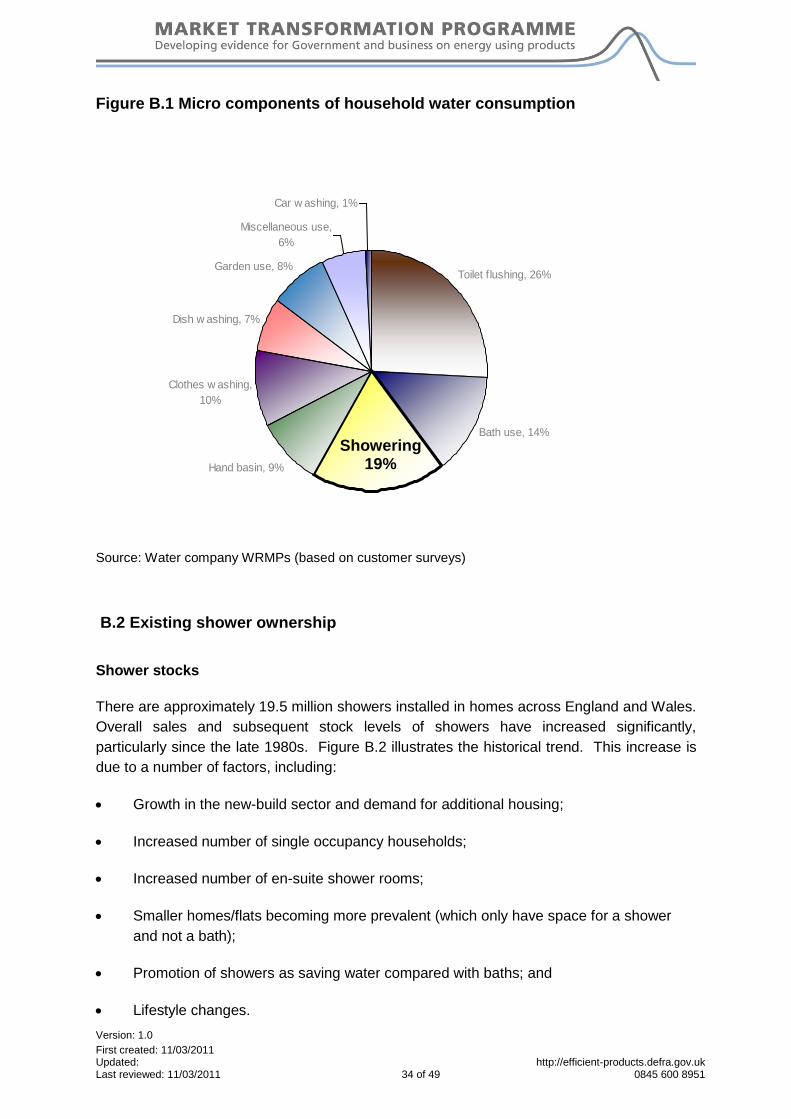
B.2 Existing shower ownership
Shower stocks
There are approximately 19.5 million showers installed in homes across England and Wales.
Overall sales and subsequent stock levels of showers have increased significantly,
particularly since the late 1980s. Figure B.2 illustrates the historical trend. This increase is
due to a number of factors, including:
Growth in the new-build sector and demand for additional housing;
Increased number of single occupancy households;
Increased number of en-suite shower rooms;
Smaller homes/flats becoming more prevalent (which only have space for a shower
and not a bath);
Promotion of showers as saving water compared with baths; and
Lifestyle changes.
Showering 19per cent
2010
Toilet f lushing, 26%
Bath use, 14%
Show er use, 19%
Hand basin, 9%
Clothes w ashing,
10%
Dish w ashing, 7%
Garden use, 8%
Miscellaneous use,
6%
Car w ashing, 1%
Showering 19%

Version: 1.0
First created: 11/03/2011 Updated: http://efficient-products.defra.gov.uk Last reviewed: 11/03/2011 35 of 49 0845 600 8951
Additional features add value to a property and many homeowners previously only having a
bath add a shower to provide more flexibility in bathing choice. Open walk-in showering
areas within the home, commonly known as wet-rooms, are also becoming very popular26.
Figure B.2 Historical trend in total shower stocks in England and Wales
Change in total shower stocks 1960 - 2010
0
5,000,000
10,000,000
15,000,000
20,000,000
25,000,000
1960
1962
1964
1966
1968
1970
1972
1974
1976
1978
1980
1982
1984
1986
1988
1990
1992
1994
1996
1998
2000
2002
2004
2006
2008
2010
Shower ownership is split fairly evenly between mixer showers and electric showers as
shown in Table B.1. The following data is based on updates to a detailed market research
investigation carried out for MTP in 2004. The updates are based on discussions with the
Bathroom Manufacturers Association and individual manufacturers. Future projections are
presented in Section 2.
Table B.1 2010 shower stocks in England and Wales – main products
Electric showers Gravity mixer showers Power showers
47.9 per cent 27.2 per cent 25.0 per cent
Source: MTP shower model. Projections informed at the 2010 stakeholder workshop based on AMA research 2004
27.
26
http://www.armitage-shanks.co.uk/plan/faqs.html 27
AMA Research (2004). Micro component research into water conservation in domestic products

Version: 1.0
First created: 11/03/2011 Updated: http://efficient-products.defra.gov.uk Last reviewed: 11/03/2011 36 of 49 0845 600 8951
Table B.2 2010 shower stock in England and Wales – disaggregated products
Electric showers kW Mixer showers Power mixer showers
7.0-7.9 8.0-8.9 9.0-9.9 10.0+ Gravity Mixer
Bath/ Shower Pressurised
Mixer with Integral Pump
Mixer - Separate Pump
0.61 3.07 3.45 2.19 4.34 0.95 1.9 1.86 1.07
3.1% 15.7% 17.8% 11.2% 22.3% 4.9% 9.9% 9.5% 5.5%
Units (millions)
Figure B.3 2010 Shower stock in households in England and Wales
Source: MTP Shower model
Shower sales
Another useful measure to understand the current market is sales data. This shows what
products are currently most popular. This is an important factor for the MTP which aims to
encourage uptake of the most sustainable products to transform the overall market and thus
water (and energy) consumption.
It is suggested that adding an additional bathroom28 and/or installing higher specification
bathroom products can add value to a property29. The trend towards high-quality products is
likely to stimulate the market, with an increasing proportion of consumers trading up to
higher specification products.
28
Nationwide (online). Housing Market Research. http://www.nationwide.co.uk/hpi/historical/What_Adds_Value_06.pdf 29
http://www.kingsbathroom.co.uk/news/bathrooms/2011/01/17/add-value-to-your-home-start-in-your-bathroom/
Detailed breakdown of product stocks 2010
Electric: 10.0+
kW, 11.2%Electric: 8.0-8.9
kW, 15.7%
Electric: 9.0-9.9
kW, 17.8%
Bath/Shower
Mixer, 4.9%
Electric: 7.0-7.9
kW, 3.1%Mixer -
Separate Pump
(power
shower), 5.5%
Mixer with
Integral Pump
(power
shower), 9.5%
Pressurised
mixer, 9.9%
Gravity mixer,
22.3%
2010 Stocks of the three main shower groups
Power
showers,
25.0%
Gravity
mixer
showers,
27.2%
Electric
showers,
47.9%

Version: 1.0
First created: 11/03/2011 Updated: http://efficient-products.defra.gov.uk Last reviewed: 11/03/2011 37 of 49 0845 600 8951
Anecdotal information suggests that more home owners are replacing „unused‟ baths with
more stylish shower enclosures, particularly where space is limited. The trend towards more
powerful mixer showers continues supported by the increased range of shower accessories
the availability of larger enclosures designed for use with higher specification showers,
shower panels, body jets and wet rooms. However, there is also a trend towards more
powerful electric showers and features designed to improve installation. Better quality
showers may lead to a greater frequency of showering, particularly in the winter when
traditionally electric showers perform poorly. This would increase water (hot water)
consumption.
In 2010 approximately 1,980,000 showers were sold in England and Wales and the
proportion of sales per shower type is shown in table B.3. These data are based on stock
levels and replacement rates, updating the extensive research undertaken in 2004, and
through discussion with the BMA and individual manufacturers.
Table B.3 2010 proportion of sales market per product type
Electric showers kW Mixer showers Power mixer showers
7.0-7.9 8.0-8.9 9.0-9.9 10.0+ Gravity Mixer
Bath / Shower Pressurised
Integral Pump
Separate Pump
9,985 229,647 369,432 389,401 428,853 81,024 201,756 166,800 102,861
0.5% 11.6% 18.7% 19.7% 21.7% 4.1% 10.2% 8.4% 5.2%
Units (millions)
Figure B.4 2010 Shower sales in households in England and Wales
Source: MTP Shower model
Comparison of Figures B.3 and B.4 show that the proportion of sales for the main product
types closely mirrors the existing stock levels. However, within the sub-products there
2010 Sales of the three main shower groups
Power
showers,
24%
Mixer
showers,
26%
Electric
showers,
50%
Detailed breakdown of product stocks 2010
Mixer - Gravity,
21.7%
Mixer -
Pressurised,
10.2%
Mixer - Integral
Pump (power
shower), 8.4%
Mixer -
Separate
Pump (power
shower), 5.2%
Electric 7.0-
7.9 kW, 0.5%
Mixer - Bath /
Shower , 4.1%
Electric 10.0+
kW, 19.7%
Electric 9.0-
9.9 kW, 18.7%
Electric 8.0-
8.9 kW, 11.6%

Version: 1.0
First created: 11/03/2011 Updated: http://efficient-products.defra.gov.uk Last reviewed: 11/03/2011 38 of 49 0845 600 8951
appears to be a shift in electric showers towards the more powerful models that are available
such as the >10.0kW variant. This is clearly at the expense of the lower ranged power
showers. This suggests that the fundamental driving factors behind product choice are not
changing, but where there is an option that is perceived to offer better performance, i.e. a
more powerful electric shower, this significantly affects consumer choices.
It has been suggested that bath shower mixers are becoming less popular as wall mounted
(and thermostatic) mixers become more popular. The main reason for this is that the
temperature of mixer showers is more reliable as it is not affected by water being used
elsewhere in the home. These are all types of mixer shower.
B.3 Applicability of water efficient models per building type
In recent years there has been an increase in the number of studies commissioned by
Government departments and agencies to better understand water efficiency in different
types of buildings. The issue of water use patterns and product acceptability is considered
in more detail in BNWAT06 Water use in new and existing buildings.
The main difference for showers is that users may be more willing to accept reduced flow
fittings outside of the home, due to slightly different purposes and priorities. For example, a
shower installed in an office building will be used after a person has cycled to work etc. In
that situation the purpose of use will be entirely functional and the user is less likely to be
seeking a high power, luxury/invigorating shower as might be expected at home. Similarly,
users are less likely to require the more powerful and consumptive flow rates that are
preferred for shampooing and rinsing hair. Further, showers in non-household environments
(e.g. offices) may be used less regularly than a shower in the home and so users may be
more willing to accept low flow rates.
Table B.4 summarises the suitability of shower flow rates in households and non-
households. In many cases electric showers are the most efficient option, particularly in
non-household properties, where lower flow rates are more acceptable. This is in line with a
recent consultation issued by WRAP, Procurement requirements for water efficiency30.
Table B.4 Water efficient mixer showers in households and non-households
Water efficiency level
Households Non-households (offices etc)
Least efficient option >12 litres/minute >8 litres/minute
Baseline 12-15 litres/minute 8 litres/minute
Efficient 8-10 litres/minute 6 litres/minute
Highly efficient < 8 litres/minute <6 litres/minute
30
www.wrap.org.uk/downloads/2010_12_23_WRAP_water_eff_model_proc_reqs_v6_AG.3382370a.10378.pdf

Version: 1.0
First created: 11/03/2011 Updated: http://efficient-products.defra.gov.uk Last reviewed: 11/03/2011 39 of 49 0845 600 8951
Appendix C
Transforming the market
C.1 Impact of globalised markets on England and Wales
As with other products increased awareness of the different product styles that are available
overseas influences consumer preferences and demand in England and Wales. Globalised
markets and global scale manufacturers directly influences the product ranges that are made
available in England and Wales.
More information from manufacturers and retailers dealing in the international market as well
as the England and Wales market would be useful to better understand how markets and
regulation elsewhere have directly affected their product ranges and how this has affected
the ranges they make available in England and Wales.
Overseas initiatives, such as the Water Efficiency Labelling and Standards (WELS) Scheme
in Australia, have influenced policy makers‟ views on the need for product labelling schemes
in the UK.
C.2 Factors that influence consumer use and uptake of showers
Uptake of any product is dependent on several factors including cost, user acceptability and
product performance. Detailed information on product performance testing and consumer
performance criteria are presented in Appendix D.3. However, there are specific factors that
have a significant impact on total shower stocks and the type of products that dominate
sales, as described for new/refurbished households and existing households below.
C.2.1 Housing development and refurbishment
The key driver behind growth in household demand for water is population growth. Figures
are currently rising, with the population of England and Wales forecast to rise from
approximately 55.2 million in 2010, to 63.0 million in 2030, an increase of 9.15 million31.
Housing data from CLG shows that the number of households in England and Wales has
increased from 17,025,000 in 1971 to 24,037,000 in 201032. Housing levels are forecast to
continue increasing in response to the increasing population and the increasing number of
low occupancy/single person housing. CLG data suggests that by 2030 the number of
households in England and Wales could reach 29,168,600.
31
http://www.statistics.gov.uk/pdfdir/pproj1009.pdf 32
England: www.communities.gov.uk/documents/housing/xls/table-104.xls Wales: www.communities.gov.uk/documents/housing/xls/table-106.xls
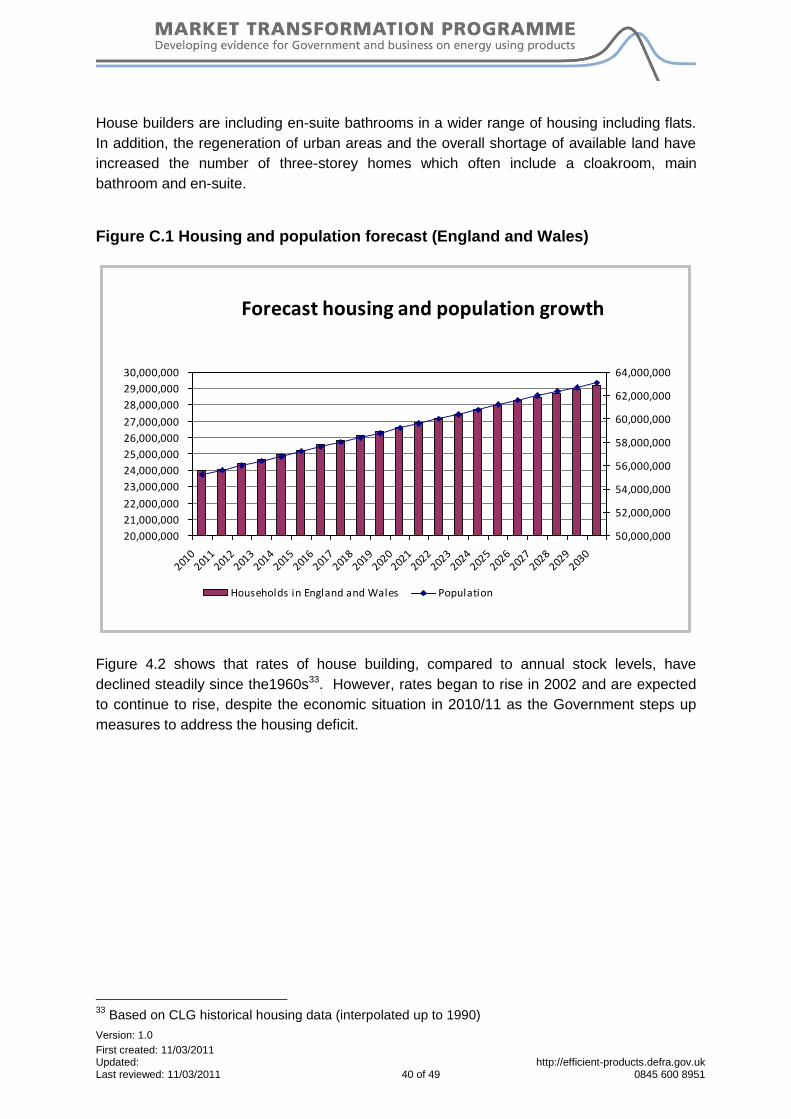
Version: 1.0
First created: 11/03/2011 Updated: http://efficient-products.defra.gov.uk Last reviewed: 11/03/2011 40 of 49 0845 600 8951
House builders are including en-suite bathrooms in a wider range of housing including flats.
In addition, the regeneration of urban areas and the overall shortage of available land have
increased the number of three-storey homes which often include a cloakroom, main
bathroom and en-suite.
Figure C.1 Housing and population forecast (England and Wales)
Forecast housing and population growth
20,000,000
21,000,000
22,000,000
23,000,000
24,000,000
25,000,000
26,000,000
27,000,000
28,000,000
29,000,000
30,000,000
2010
2011
2012
2013
2014
2015
2016
2017
2018
2019
2020
2021
2022
2023
2024
2025
2026
2027
2028
2029
2030
50,000,000
52,000,000
54,000,000
56,000,000
58,000,000
60,000,000
62,000,000
64,000,000
Households in England and Wales Population
Figure 4.2 shows that rates of house building, compared to annual stock levels, have
declined steadily since the1960s33. However, rates began to rise in 2002 and are expected
to continue to rise, despite the economic situation in 2010/11 as the Government steps up
measures to address the housing deficit.
33
Based on CLG historical housing data (interpolated up to 1990)
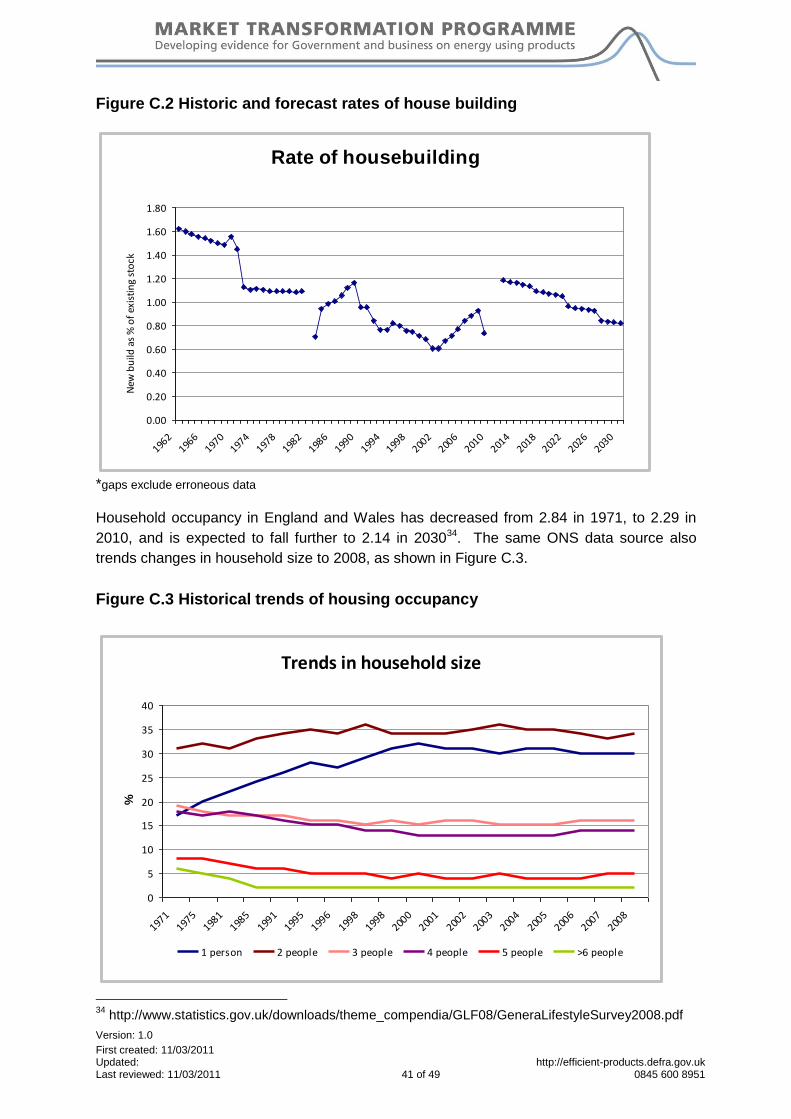
Version: 1.0
First created: 11/03/2011 Updated: http://efficient-products.defra.gov.uk Last reviewed: 11/03/2011 41 of 49 0845 600 8951
Figure C.2 Historic and forecast rates of house building
Rate of housebuilding
0.00
0.20
0.40
0.60
0.80
1.00
1.20
1.40
1.60
1.80
1962
1966
1970
1974
1978
1982
1986
1990
1994
1998
2002
2006
2010
2014
2018
2022
2026
2030
New
bu
ild a
s %
of
exis
tin
g st
ock
*gaps exclude erroneous data Household occupancy in England and Wales has decreased from 2.84 in 1971, to 2.29 in
2010, and is expected to fall further to 2.14 in 203034. The same ONS data source also
trends changes in household size to 2008, as shown in Figure C.3.
Figure C.3 Historical trends of housing occupancy
Trends in household size
0
5
10
15
20
25
30
35
40
1971
1975
1981
1985
1991
1995
1996
1998
1998
2000
2001
2002
2003
2004
2005
2006
2007
2008
%
1 person 2 people 3 people 4 people 5 people >6 people
34
http://www.statistics.gov.uk/downloads/theme_compendia/GLF08/GeneraLifestyleSurvey2008.pdf

Version: 1.0
First created: 11/03/2011 Updated: http://efficient-products.defra.gov.uk Last reviewed: 11/03/2011 42 of 49 0845 600 8951
The data shows that household occupancy appears to have levelled out following a period of
change between the 1970s and 1990s. The biggest change has been the rise of single
occupant housing which is now 30 per cent of the total housing stock at the national level.
C.2.2 Existing housing
While shower ownership is growing, there is still scope for further growth and there is growth
in multiple shower ownership.
The extensive exposure of shower products through DIY television programmes, lifestyle
magazines etc, has increased consumer awareness of the styles available in addition to
overall design co-ordination. Product development and the increasing range of styles and
technical features are likely to encourage a higher level of replacement and more frequent
replacement.
C.2.3 Product pricing
A key element that must be considered in the context of market transformation is product
pricing. If a product has a price premium associated with it then this is likely to negatively
impact on uptake. It is also important to recognise that whilst there may be no or very little
actual price premiums, the perception of price premiums may be sufficiently strong to
influence procurement decisions.
There is a large range in the price of showers available on the market. Research has shown
that price is affected by many variables, especially style and materials, and ease of
installation, rather than shower flow rate (water efficiency). Bulk purchasing can also drive
down costs. This briefing note deliberately does not specify prices because it will never be
able to accurately reflect the true range in the price of fittings at any one time.
Despite this, CLG has calculated the cost of building homes to meet the Code for
Sustainable Homes, in comparison to the cost of a „standard‟ build35. The information was
indicative but showed that the cost of installing appliances to meet level 3/4 for water is £125
more than to achieve level 1/2. The cost of the water efficient shower was included in this
total which also accounted for two low flush WCs and a smaller sized bath). However, there
is now anecdotal evidence that there no cost differential between „standard‟ and water
efficient versions.
C.2.4 User acceptability and product performance
Currently there is no single definition of „shower performance‟ and there is no standard way
of measuring it. The overall performance of a shower is the amalgam of several different
parameters, which in turn are influenced by the type of hot and cold water supply serving the
property:
35
CLG (2008) Cost Analysis of the Code for Sustainable Homes. Final Report.
Version: 1.0
First created: 11/03/2011 Updated: http://efficient-products.defra.gov.uk Last reviewed: 11/03/2011 43 of 49 0845 600 8951
Flow rate (real or apparent);
Area of coverage by the spray;
Force with which the spray acts on the user;
Effectiveness in washing away soap and shampoo;
Water temperature at the outflow
The water temperature differential between shower head and water at the foot/knee
level; and
Controllability.
There are currently no recognised test methods for „user performance criteria‟. However, a
study36 sponsored by United Utilities (UU) and undertaken by Liverpool John Moores
University (LJMU) in 2007 investigated showers in terms of both key physical performance
criteria and customer satisfaction. The report states that “WRc is using the results from the
study, on behalf of the Market Transformation Programme, to develop performance standard
tests for “spray pattern”, “spray force” and “soap removal” in order to more specifically define
water efficient showers”.
MTP identified the need to fully investigate all the factors influencing shower performance
and shower resource efficiency with the aim of devising a system of classifying, or defining,
showers such that:
- „Good‟ showers deliver a high standard of user experience, but with the least
resource consumption.
- „Poor‟ showers are those which either do not provide an adequate standard of
user experience or are unnecessarily wasteful of resources.
MTP does not cover the factors influencing consumer choice regarding the purchase of a
new shower such as style, size, cost etc. More detail on shower performance and testing is
available in Appendix D.3.
36
United Utilities (2007). Water and Energy Efficient Showers. Project Report
Version: 1.0
First created: 11/03/2011 Updated: http://efficient-products.defra.gov.uk Last reviewed: 11/03/2011 44 of 49 0845 600 8951
Appendix D
Shower technical specifications and testing
D.1 Regulations
The Water Supply (Water Fittings) Regulations are national requirements for the design,
installation and maintenance of plumbing systems, water fittings and water-using appliances.
Their purpose is to prevent misuse, waste, contamination, undue consumption or erroneous
measurement of drinking water. These regulations do not regulate shower performance.
D.2 Standards
Definition: European Standard EN 13904:2003 defines a shower as a device for ablutionary
purposes which allows water to be emitted in the form of jets or water droplets.
The current European Standards for showers are defined on the basis of the water supply
system pressure. BS EN 13904:2003 (Low-resistance shower outlets for sanitary tapware)
is for showers which are to be used with low-pressure water supply systems.
BS EN 1112:1997 (Shower outlets for (PN 10) sanitary tapware) is the equivalent standard
for high-pressure water supply systems. Both of these standards include a methodology for
calculating the flow rate for showers.
BS EN 1112: 1997 for shower outlets includes a flow rate (hydraulic characteristics) test at a
dynamic pressure of 3 bar. The test is comprehensive and defines all the equipment
necessary to measure the flow rate at 3 bar without interpretation of the requirements by the
test engineer. BS EN 1112 is currently being revised and is undergoing public consultation.
This proposed revision includes measurement of the flow rate at both high and low pressure.
The revisions of the flow rate test in BS EN 1112 make it suitable for the measurement of
flow rate through all types of shower designs likely to be found in the UK market.
BS EN 13904: 2003 includes measurement of flow rates through low-pressure shower
heads. Whilst the test is well defined, it is not considered suitable for high-pressure shower
outlets and is likely to be superseded by the revision of BS EN 1112 when this is ratified by
the EU member states.
BS 6340: Part 4:1984 (Shower Units: Specification for shower heads and related
equipment). Whilst other parts of BS 6430 have now been fully or partially replaced, Part 4 of
BS 6340 is currently retained in the UK. The standard applies to the shower head or
handset only and defines tests to measure the flow rate, the spray form and the spray
trajectories.
Version: 1.0
First created: 11/03/2011 Updated: http://efficient-products.defra.gov.uk Last reviewed: 11/03/2011 45 of 49 0845 600 8951
D.3 Shower performance criteria and tests
There have been numerous studies examining shower behaviour and consumer opinions. A
series of workshops were held by the MTP and reported in the previous briefing note
BNWATSH01: Consumer views about showers – summary report.
Flow rate through any design of shower can be measured using the test method in BS EN
111237. The primary components of this test are:
The water temperature should be less than or equal to 30 °C.
The water supply pressure should be 0.3 ± 0.02 MPa (for a high-pressure supply
system) or 0.1 ± 0.005 MPa (for a low-pressure supply system).
The flow rate should be measured once the flow has stabilised.
It is important to ensure that the water emanating from a shower head provides adequate
coverage of the shower user. This can be measured using the test method described in BS
6340: Part 438 with some minor modifications to the test method.
The primary components of this test are:
To comply with the standard, the shower head must achieve a minimum flow rate at
both 0.1 bar and at the lowest flow rate at which the „spray is well formed‟.
The spray form itself is then measured using an annular gauge and the trajectories of
the spray are also measured and must conform to the dimensions of an envelope
defined in the standard.
Test methods for flow rate and spray pattern are also specified in AS/NZS 366239, and BS
EN 1390440.
Force of spray. There are no published tests to measure the force of the spray emanating
from a shower head. Similarly, optimal pressure of the shower spray on skin is subjective.
There is a general tendency for people to prefer high rather than low spray pressure. Whilst
some showers have been found to be uncomfortably powerful41, there are often complaints
that over „aerated‟ showers have insufficient force.
37
BS EN 1112: 1997, Shower outlets for (PN 10) sanitary tapware, British Standards Institution, London.
38 BS 6340-4: 1984, Shower units. Specification for shower heads and related equipment. British Standards Institution, London.
39 AS/NZS 3662: 2005, Performance of showers for bathing. Standards Australia, www.saiglobal.com
40 BS EN 13904: 2003, Low resistance shower outlets for sanitary tapware British Standards Institution, London.
41 MTP (2006). BNWATSH01: Consumer views about showers – summary report
Version: 1.0
First created: 11/03/2011 Updated: http://efficient-products.defra.gov.uk Last reviewed: 11/03/2011 46 of 49 0845 600 8951
Temperature gradient (or thermal stability, or temperature uniformity) is another performance
criterion. This can be affected by droplet size although when questioned consumers barely
featured in their view of what makes a good shower. More important is the area of the body
that is covered by water, water covering a wide area is seen as preferable42. Focus groups
organised by Liverpool John Moores University in 200743 also found that customers want
showers to provide good water flow, at the right temperature, in order to wash and also enjoy
the experience of showering. It is perceived as important to have enough water running over
the body in order to keep warm in the shower.
Significant temperature differences between the water leaving the shower outlet and the
water falling on the shower tray can necessitate the use of additional hot water to achieve
the desired temperature and may also represent a danger associated with scalding. More
detail on this issue is covered in the United Utilities 2007 report, Water and energy efficient
showers – Project Report. The effectiveness of the water in rinsing soap could also relate to
temperature.
The 'WRc Approved' Scheme helps manufacturers demonstrate the performance of their
products. Quality, performance and installation issues are all covered in the assessment of
the product or service. 'WRc Approved' is an independent technical view on whether a
product is fit to do the job for which it is claimed or a contractor is fit to provide a specified
service. The 'WRc Approved' Scheme is owned and managed by WRc plc.
D.4 Impact of water supply systems on shower performance
The performance criteria are determined by a number of parameters including the:
Shower unit type.
Shower head type.
Type of water supply system and resulting water pressure and flow rate.
Length of dead leg of the pipe.
For mixer and power showers, the final temperature of the water delivered by the shower is
determined by a combination of the hot and cold water supply, which can vary in pressure
and flow rate depending on the type of system installed. The water pressure of the hot and
cold water feeds should be similar (i.e. both should be either high pressure or both low
pressure).
Mixing valves are used to obtain the desired temperature by adjusting the flow of hot and
cold water. Thermostatic mixing valves maintain a reasonably steady water temperature,
which can help to overcome the effects of variability in the hot and cold water supplies to the
shower unit.
42
MTP (2006). BNWATSH01: Consumer views about showers – summary report 43
United Utilities (2007). Water and energy efficient showers. Project report.
Version: 1.0
First created: 11/03/2011 Updated: http://efficient-products.defra.gov.uk Last reviewed: 11/03/2011 47 of 49 0845 600 8951
Electric showers are connected only to the cold water system and so are unaffected by the
type of hot water supply in the property.
Cold water supply
The cold water supply affects all types of shower, both electric and mixers, and can be either
direct from the mains (high pressure) or fed by gravity from a tank (low pressure). With high
pressure cold water, any type of shower can be installed apart from a pumped shower.
With a low pressure system the shower must be selected to be able to perform at a low
pressure. Pumped, electric and normal gravity-fed mixers can be installed. The head of
water must be known prior to the installation in order to ensure that the correct pressure is
available for the shower unit.
If any of the shower performance criteria are not met then the shower can be considered not
to be fully serving its purpose. However this also provides the opportunity to change one or
more of the factors to reduce the water usage whilst providing the optimum shower
experience. For example, a reduction in the flow rate could be compensated by altering
another factor, such as the force of the spray that acts on the user and/or the area of
coverage by the spray.
Hot water supply
Hot water supply is important for mixer and pumped showers. Hot water supply, like cold
water, can be either mains fed (high pressure) or fed from a tank (low pressure). In addition,
the hot water supply can be either instantaneous or fed from a water storage cylinder. How
the hot water is supplied will affect the performance of a shower.

Version: 1.0
First created: 11/03/2011 Updated: http://efficient-products.defra.gov.uk Last reviewed: 11/03/2011 48 of 49 0845 600 8951
Figure D.1 Hot water supply systems in the UK
Combination boilers (mains fed) reduce the flow of the hot water within the boiler to allow it
to be heated. Flow rates are generally good when only one outlet is being used. However,
simultaneous draw-offs from different outlets will cause the flow to rapidly reduce. Hence it
is essential to use a shower that is equipped with a thermostatic mixing valve to maintain an
acceptable temperature and prevent scalding.
Where hot water is supplied from a storage cylinder, the cylinder must be large enough to
supply water to the shower as required otherwise the hot water feed runs cold and severely
impacts on shower performance.

Version: 1.0
First created: 11/03/2011 Updated: http://efficient-products.defra.gov.uk Last reviewed: 11/03/2011 49 of 49 0845 600 8951
Related MTP information
BNWAT06: Water use in new and existing buildings
BNWAT07: Water and energy use
BNWAT08: Modelling projections of water using products
Briefing Note BNW09: Tumble drier test methodologies
Changes from earlier versions
This briefing note replaces the following previous briefing notes:
BNWATSH01: Consumer views about showers – summary report
BNWAT24: Performance and efficiency: reviewing and defining showers
BNDW Shower: Shower design and efficiency- briefing note relating to policy scenario objectives in Policy Brief
BNWAT25: Recycling showers – innovation briefing note and incorporates the previous briefing note:
BNWAT21: Performance standards for water using products – an overview
Consultation and further information
Stakeholders are encouraged to review this document and provide suggestions that may improve the quality of information provided. Email [email protected] quoting the document reference, or call the MTP enquiry line on +44 (0) 845 600 8951. For further information on related issues visit http://efficient-products.defra.gov.uk