Embed Size (px)
Citation preview

MAKING THE GRADE 1
MAKING THE GRADE
MAKING THE GRADE
February 22-25, 2015

MAKING THE GRADE 2
This presentation contains forward-looking statements. Forward-looking statements involve known and unknown risks,
uncertainties and assumptions and accordingly, actual results and future events could differ materially from those expressed or
implied in such statements. You are hence cautioned not to place undue reliance on forward-looking statements. Forward-looking
statements include words or expressions such as “guidance”, “preliminary”, “final adjustment”, “future”, “estimated”, “initial”,
“priority”, “predicts”, “targets”, “committed” and other similar words or expressions. Factors that could cause future results or
events to differ materially from current expectations expressed or implied by the forward-looking statements include the ability to
generate future cash flow, the ability to meet our guidance of between 245,000 to 275,000 ounces of gold produced at a total cash
cost of between $575 and $605 per ounce and all-in sustaining cost of between $715 and $750 per ounce, the ability to incur $37
million of capital expenditures, the ability to invest $18 million in our initial exploration program in 2015, the ability to execute on
our strategic focus, fluctuation in the price of currencies, gold or operating costs, mining industry risks, uncertainty as to calculation
of mineral reserves and resources, delays, political and social stability in Africa (including our ability to maintain or renew licenses
and permits) and other risks described in SEMAFO’s documents filed with Canadian securities regulatory authorities. You can find
further information with respect to these and other risks in SEMAFO’s 2013 Annual MD&A, as updated in SEMAFO’s 2014 First
Quarter MD&A, 2014 Second Quarter MD&A and 2014 Third Quarter MD&A, and other filings made with Canadian securities
regulatory authorities and available at www.sedar.com. These documents are also available on our website at www.semafo.com.
These forward-looking statements are dated as of February 19, 2015 and we disclaim any obligation to update or revise these
forward-looking statements, except as required by applicable law.
We also advise you that the terms “Historical Inferred Mineral Resources” and “Historical Indicated Mineral Resources”, although
recognized and required by the Canadian Securities Administrators, are not recognized by the US Securities and Exchange
Commission. There is no certainty that these Resources will be economically mineable. All mineral resources are exclusive of
mineral reserves.
In this presentation, all amounts are in US dollars unless otherwise indicated.
FORWARD-LOOKING STATEMENTS
MAKING THE GRADE 3
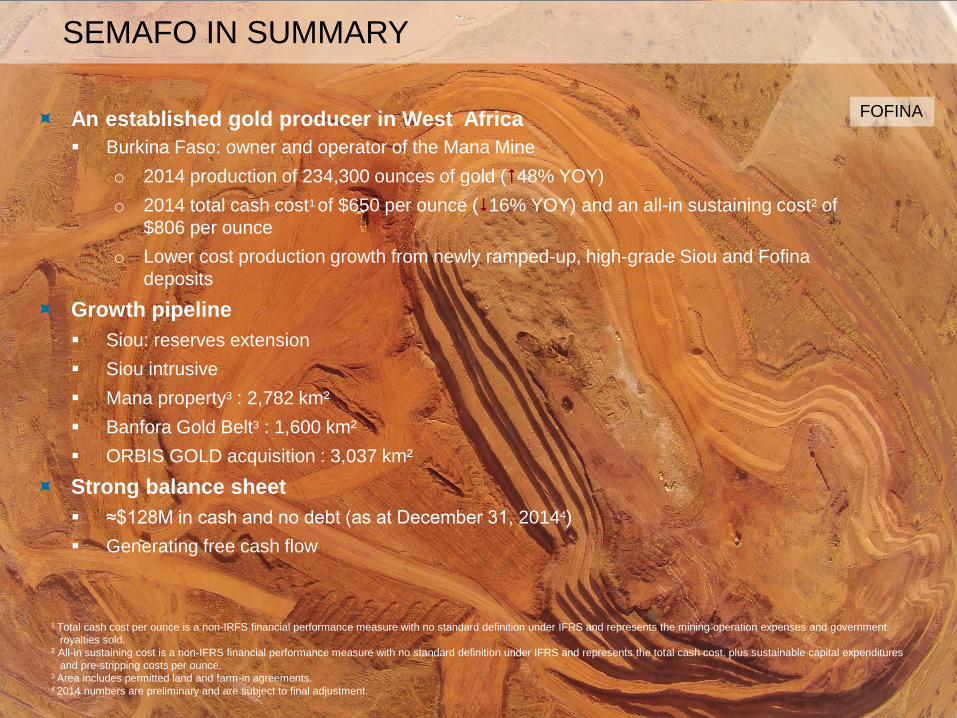
An established gold producer in West Africa
Burkina Faso: owner and operator of the Mana Mine
o 2014 production of 234,300 ounces of gold (48% YOY)
o 2014 total cash cost1 of $650 per ounce (16% YOY) and an all-in sustaining cost2 of
$806 per ounce
o Lower cost production growth from newly ramped-up, high-grade Siou and Fofina
deposits
Growth pipeline
Siou: reserves extension
Siou intrusive
Mana property3 : 2,782 km²
Banfora Gold Belt3 : 1,600 km²
ORBIS GOLD acquisition : 3,037 km²
Strong balance sheet
≈$128M in cash and no debt (as at December 31, 20144)
Generating free cash flow
SEMAFO IN SUMMARY
1 Total cash cost per ounce is a non-IRFS financial performance measure with no standard definition under IFRS and represents the mining operation expenses and government
royalties sold. 2 All-in sustaining cost is a non-IFRS financial performance measure with no standard definition under IFRS and represents the total cash cost, plus sustainable capital expenditures
and pre-stripping costs per ounce. 3 Area includes permitted land and farm-in agreements. 4 2014 numbers are preliminary and are subject to final adjustment.
FOFINA

MAKING THE GRADE 4
2014 HIGHLIGHTS
$128M STRONG Cash Balance
48% PRODUCTION Increase YOY
No Debt
$289M GOLD Sales
172.7 158.6
234.3
750 777
650
590
1,273
1,194
806
730
0
200
400
600
800
1000
1200
1400
0
50
100
150
200
250
300
2012 2013 2014 Guidance 2015
Production '000 ounces Total Cash Cost ($/oz) All-in Sustaining Cost ($/oz) **
275
245
* 2014 numbers are preliminary and are subject to final adjustment
** All-in sustaining cost comprises the total cash cost, plus sustainable capital expenditures and pre-stripping costs per ounce.
*
16% Reduction in Total Cash Cost

MAKING THE GRADE
Capital
Mana Mine
SEMAFO property
Other mines
Electric line
Orbis property
Bantou Project
Natougou Project
Nabanga Project
Korhogo Project
Mali Niger
Côte d’Ivoire
Ghana
Togo
Bénin
EXTENSIVE LAND PACKAGE 7,040 km2 in Burkina Faso

MAKING THE GRADE 6
MANA’S RESERVES AND RESOURCES(as at December 31, 2014)
MAKING THE GRADE
44%
43%
9%
2010 2011 2012 2013 2014
2.2 2.0 1.9
2.3 2.2
1.1
2.8 3.0 2.4
2.8
2.7
2.1 1.9
1.4
1.2
Siou
6.9Mt @ 4.37 g/t Au
980,000oz
Fofina
2.4Mt @ 2.62 g/t Au
205,700oz
Wona-Kona
13.2Mt @ 2.27 g/t Au
970,100oz
MANA: EXPLORATION SUCCESS
7
2010: Fofina, Fobiri 2011: Yaho 2012: Siou
Discoveries
- Reserves estimate using a conservative price of $1,100/oz
- Resources estimate at $1,400/oz

MAKING THE GRADE 8
MANA
2015 Initial Drilling Program
$12M
65,500 meters of RC drilling 41,000 meters within 30 km of
the Mana plant
170,000 meter of Auger
drilling

MAKING THE GRADE 9 9
BANFORA
2015 Initial Drilling Program
$6M
35,000 meters of RC drilling

MAKING THE GRADE 10
ORBIS TRANSACTION HIGHLIGHTS
October 16, 2014 A$0.65 Cash Bid
December 15, 2014 Bidder’s Statement lodged, which includes a minimum
acceptance condition of greater than 50%
February 11, 2015 Joint Announcement
Orbis Gold Board Unanimously Recommends Increased
SEMAFO Offer A$0.713 (A$178M or ≈US$138M)
February 16, 2015 Three of the five ORBIS directors are now nominees of SEMAFO
SEMAFO provides a short-term loan facility to Orbis Gold of
up to A$17.4M
Change of SEMAFO’s interest in Orbis Gold to 78%
(as at February 20, 2015)

MAKING THE GRADE 11
MULTIPLE HIGH GRADE GOLD PROJECTS
BANTOU Tankoro East Discovery
NABANGA
NATOUGOU

MAKING THE GRADE
0
1
2
3
4
5
ORBIS-NATOUGOU: QUALITY OUNCES
12
Natougou Historical Mineral Resource
Category Tonnes Grade Ounces
Indicated (1) (2)
7.1 Mt 5.1g/t Au 1.2 Mozs
Inferred (1) (2)
11 Mt 2.3g/t Au 0.8 Mozs
(1) As per the JORC Code. Resources estimated by Orbis Gold (2) Historical Mineral Resource reported above an 0.5g/t Au lower cut-off grade. (3) Source: Company reports.
Grade of West African Open Pit Gold Deposits (3)
Gold Deposits
Median (1.4g/t Au)
Natougou
Indicated
Siou
Mines/projects in Burkina Faso
Natougou
Inferred
MAKING THE GRADE 13
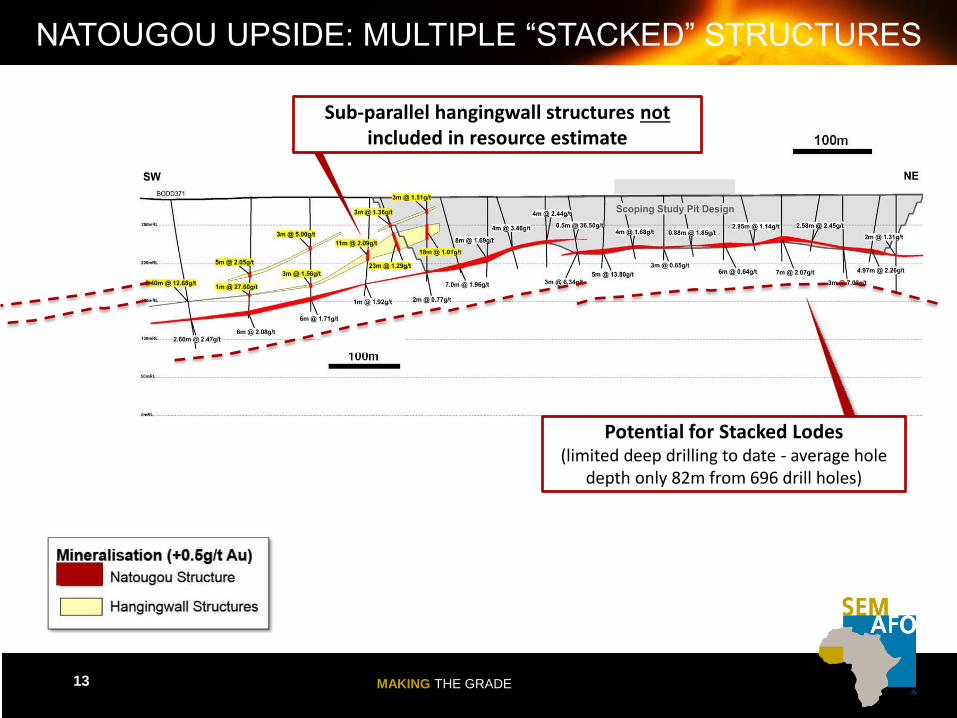
NATOUGOU UPSIDE: MULTIPLE “STACKED” STRUCTURES
Sub-parallel hangingwall structures not included in resource estimate
Potential for Stacked Lodes (limited deep drilling to date - average hole
depth only 82m from 696 drill holes)

MAKING THE GRADE 14
NATOUGOU UPSIDE: CURRENT NATOUGOU DEPOSIT
OVERLIES ONLY 4% OF 50 km2 REGIONAL SOIL ANOMALY

MAKING THE GRADE 15
NABANGA: A SECOND HIGH GRADE
PRE-DEVELOPMENT ASSET
Nabanga – Historical Inferred Mineral Resource(1)
Cut-off Grade Tonnes Grade Ounces
0.5g/t Au 3.2Mt 6.5g/t Au 660,000ozs
(1) Historical Inferred Mineral Resource figures based on a 1.5m minimum horizontal width at a 0.5 g/t Au lower cut-off grade. Drill hole intersection lengths shown are down hole lengths.
MAKING THE GRADE 16
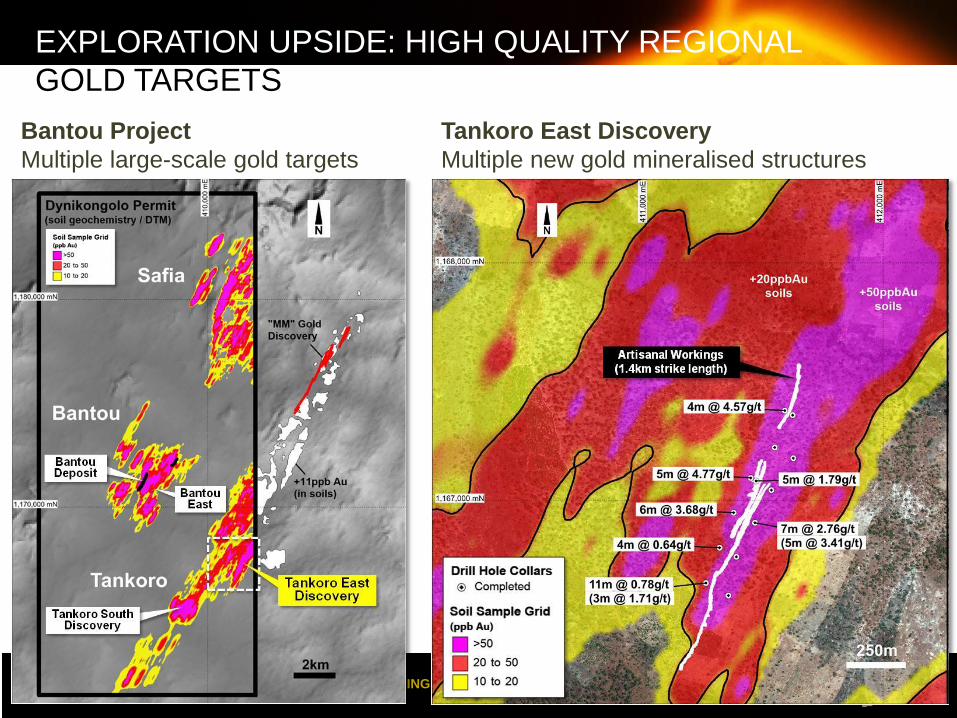
EXPLORATION UPSIDE: HIGH QUALITY REGIONAL
GOLD TARGETS
Bantou Project
Multiple large-scale gold targets
Tankoro East Discovery
Multiple new gold mineralised structures

MAKING THE GRADE 17
Côte d’Ivoire Highly mineralised greenstone belts
Korhogo Project Along strike from Tongon Mine - priority targets
EXPLORATION UPSIDE: HIGH QUALITY REGIONAL
GOLD TARGETS

MAKING THE GRADE 18
OPERATING ON A SOLID FOUNDATION

MAKING THE GRADE
19
2014 OPERATIONS HIGHLIGHTS – MANA MINE
Q4 20143 20143 2015 GUIDANCE
Ore processed (t) 638,200 2,754,400 2,500,000
Head grade (g/t) 3.30 2.90 3.60
Recovery (%) 91 91 90
Total gold ounces produced (K) 62 234 245-275
Total cash cost/ounce sold1($) 600 650 575-605
All-in sustaining cost2 ($) 700 806 715-750
1 Total cash cost is a non-IFRS financial performance measure with no standard definition under IFRS and represents the mining operation expenses and government
royalties per ounce sold. 2 All-in sustaining cost is a non-IFRS financial performance measure with no standard definition under IFRS and represents the total cash cost, plus sustainable capital expenditures
and pre-stripping costs per ounce 3 2014 numbers are preliminary and are subject to final adjustment

MAKING THE GRADE 20
2015 production guidance: 245,000 – 275,000 ounces 11% over 2014
Total cash cost1: between $575– $605 per ounce 9% over 2014
All-in sustaining cost2: between $715 - $750 per ounce 9% over 2014
CAPEX (in millions of $) 2015 Guidance
Sustaining Capital 15.0
Stripping Costs 18.0
Sustaining Capital - 2014 Deferred 4.0
Total 37.0
2015 ESTIMATED CAPEX AND PRODUCTION GUIDANCE
1 Total cash cost per ounce is a non-IFRS financial performance measure with no standard definition under IFRS and represents the mining operation expenses and government royalties per ounce sold. 2 All-in sustaining cost is a non-IFRS financial performance measure with no standard definition under IFRS and represents the total cash cost, plus sustainable capital expenditures and pre-stripping costs per ounce. 3 2014 numbers are preliminary and are subject to final adjustment
26% relative to 2014

MAKING THE GRADE
SHORT-TERM CATALYSTS
Optimised throughput from Siou and Fofina – ongoing
Focused exploration efforts in the vicinity of the Mana Mine
Extending Siou reserves at depth
RC drilling on Siou Sector, Pompoi and Pompoi Nord
With the objective of finding quality ounces
Targeted exploration on the Banfora Gold Belt permits
Completion of the Orbis Gold transaction Move towards feasibility study
43-101 resources report
Exploration on Natougou

MAKING THE GRADE
CONCLUSION
Committed to generating future cash flow through operational efficiency and disciplined exploration
Ongoing operations optimisation programs
Targeted exploration program focused on the vicinity of the Mana processing plant
Sound balance sheet
Approximately $128M in cash (as at December 31, 2014), no debt
Successful track record
Seven consecutive years of achieving production guidance
Time to bring Siou from discovery to production: 18 months
Exploration success: Mana reserves and resources have more than doubled since the mine start-up in 2008
Strong pipeline of properties exceeding 7,400 km2

MAKING THE GRADE 23
SEMAFO remains committed to making significant contributions to improving the quality of
life in the communities in which we operate.
Fondation SEMAFO focuses primarily on
developing education, health and revenue-
generating programs and projects.
SEMAFO pledges to contribute up to 2% of
its net income to support Fondation
SEMAFO.
Fondation SEMAFO is a benchmark for
other mining companies in Burkina Faso
Together for a Better Society
A national radio campaign in Burkina
Faso aimed at raising awareness and
providing information to favor
development
RESPONSIBLE MINING - CSR PROGRAM