Embed Size (px)
Citation preview
TSX: YRI | NYSE: AUY
True Value Proposition
BMO Global Metals & Mining Conference February 28 – March 2, 2016

Cautionary Note Regarding Forward-looking Statement
CAUTIONARY NOTE REGARDING FORWARD-LOOKING STATEMENTS: This news release contains “forward-looking statements” within the meaning of the United States Private Securities Litigation Reform Act of 1995 and applicable Canadian securities legislation. Except for statements of historical fact relating to the Company, information contained herein constitutes forward-looking statements, including any information as to the Company’s strategy, plans or future financial or operating performance, the outcome of the legal matters involving the damages assessment and any related enforcement proceedings.. Forward-looking statements are characterized by words such as “plan,” “expect”, “budget”, “target”, “project”, “intend,” “believe”, “anticipate”, “estimate” and other similar words, or statements that certain events or conditions “may” or “will” occur. Forward-looking statements are based on the opinions, assumptions and estimates of management considered reasonable at the date the statements are made, and are inherently subject to a variety of risks and uncertainties and other known and unknown factors that could cause actual events or results to differ materially from those projected in the forward-looking statements. These factors include the Company’s expectations in connection with the expected production and exploration, development and expansion plans at the Company’s projects discussed herein being met, the impact of proposed optimizations at the Company’s projects, the impact of the proposed new mining law in Brazil and the impact of general business and economic conditions, global liquidity and credit availability on the timing of cash flows and the values of assets and liabilities based on projected future conditions, fluctuating metal prices (such as gold, copper, silver and zinc), currency exchange rates (such as the Brazilian Real, the Chilean Peso, the Argentine Peso, and the Mexican Peso versus the United States Dollar), the impact of inflation, possible variations in ore grade or recovery rates, changes in the Company’s hedging program, changes in accounting policies, changes in mineral resources and mineral reserves, risk related to non-core asset dispositions, risks related to acquisitions, changes in project parameters as plans continue to be refined, changes in project development, construction, production and commissioning time frames, risk related to joint venture operations, the possibility of project cost overruns or unanticipated costs and expenses, higher prices for fuel, steel, power, labour and other consumables contributing to higher costs and general risks of the mining industry, failure of plant, equipment or processes to operate as anticipated, unexpected changes in mine life, final pricing for concentrate sales, unanticipated results of future studies, seasonality and unanticipated weather changes, costs and timing of the development of new deposits, success of exploration activities, permitting time lines, government regulation and the risk of government expropriation or nationalization of mining operations, environmental risks, unanticipated reclamation expenses, title disputes or claims, limitations on insurance coverage and timing and possible outcome of pending litigation and labour disputes, as well as those risk factors discussed or referred to in the Company’s current and annual Management’s Discussion and Analysis and the Annual Information Form filed with the securities regulatory authorities in all provinces of Canada and available at www.sedar.com, and the Company’s Annual Report on Form 40-F filed with the United States Securities and Exchange Commission. Although the Company has attempted to identify important factors that could cause actual actions, events or results to differ materially from those described in forward-looking statements, there may be other factors that cause actions, events or results not to be anticipated, estimated or intended. There can be no assurance that forward-looking statements will prove to be accurate, as actual results and future events could differ materially from those anticipated in such statements. The Company undertakes no obligation to update forward-looking statements if circumstances or management’s estimates, assumptions or opinions should change, except as required by applicable law. The reader is cautioned not to place undue reliance on forward-looking statements. The forward-looking information contained herein is presented for the purpose of assisting investors in understanding the Company’s expected financial and operational performance and results as at and for the periods ended on the dates presented in the Company’s plans and objectives and may not be appropriate for other purposes. All amounts are expressed in United States dollars unless otherwise indicated.
2
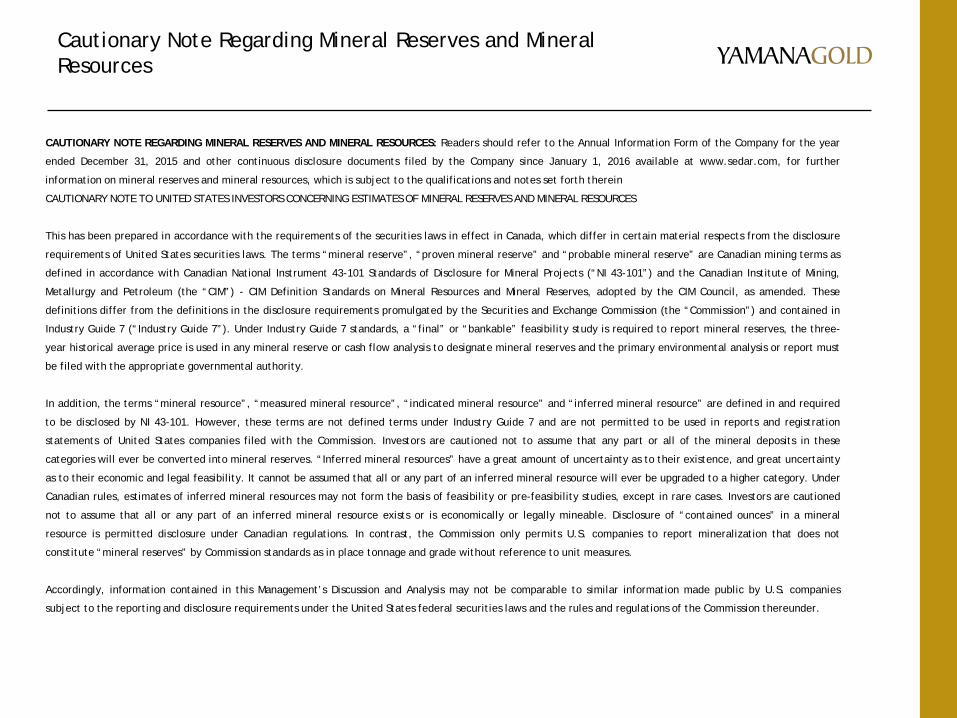
Cautionary Note Regarding Mineral Reserves and Mineral Resources
CAUTIONARY NOTE REGARDING MINERAL RESERVES AND MINERAL RESOURCES: Readers should refer to the Annual Information Form of the Company for the year
ended December 31, 2015 and other continuous disclosure documents filed by the Company since January 1, 2016 available at www.sedar.com, for further
information on mineral reserves and mineral resources, which is subject to the qualifications and notes set forth therein
CAUTIONARY NOTE TO UNITED STATES INVESTORS CONCERNING ESTIMATES OF MINERAL RESERVES AND MINERAL RESOURCES
This has been prepared in accordance with the requirements of the securities laws in effect in Canada, which differ in certain material respects from the disclosure
requirements of United States securities laws. The terms “mineral reserve”, “proven mineral reserve” and “probable mineral reserve” are Canadian mining terms as
defined in accordance with Canadian National Instrument 43-101 Standards of Disclosure for Mineral Projects (“NI 43-101”) and the Canadian Institute of Mining,
Metallurgy and Petroleum (the “CIM”) - CIM Definition Standards on Mineral Resources and Mineral Reserves, adopted by the CIM Council, as amended. These
definitions differ from the definitions in the disclosure requirements promulgated by the Securities and Exchange Commission (the “Commission”) and contained in
Industry Guide 7 (“Industry Guide 7”). Under Industry Guide 7 standards, a “final” or “bankable” feasibility study is required to report mineral reserves, the three-
year historical average price is used in any mineral reserve or cash flow analysis to designate mineral reserves and the primary environmental analysis or report must
be filed with the appropriate governmental authority.
In addition, the terms “mineral resource”, “measured mineral resource”, “indicated mineral resource” and “inferred mineral resource” are defined in and required
to be disclosed by NI 43-101. However, these terms are not defined terms under Industry Guide 7 and are not permitted to be used in reports and registration
statements of United States companies filed with the Commission. Investors are cautioned not to assume that any part or all of the mineral deposits in these
categories will ever be converted into mineral reserves. “Inferred mineral resources” have a great amount of uncertainty as to their existence, and great uncertainty
as to their economic and legal feasibility. It cannot be assumed that all or any part of an inferred mineral resource will ever be upgraded to a higher category. Under
Canadian rules, estimates of inferred mineral resources may not form the basis of feasibility or pre-feasibility studies, except in rare cases. Investors are cautioned
not to assume that all or any part of an inferred mineral resource exists or is economically or legally mineable. Disclosure of “contained ounces” in a mineral
resource is permitted disclosure under Canadian regulations. In contrast, the Commission only permits U.S. companies to report mineralization that does not
constitute “mineral reserves” by Commission standards as in place tonnage and grade without reference to unit measures.
Accordingly, information contained in this Management’s Discussion and Analysis may not be comparable to similar information made public by U.S. companies
subject to the reporting and disclosure requirements under the United States federal securities laws and the rules and regulations of the Commission thereunder.
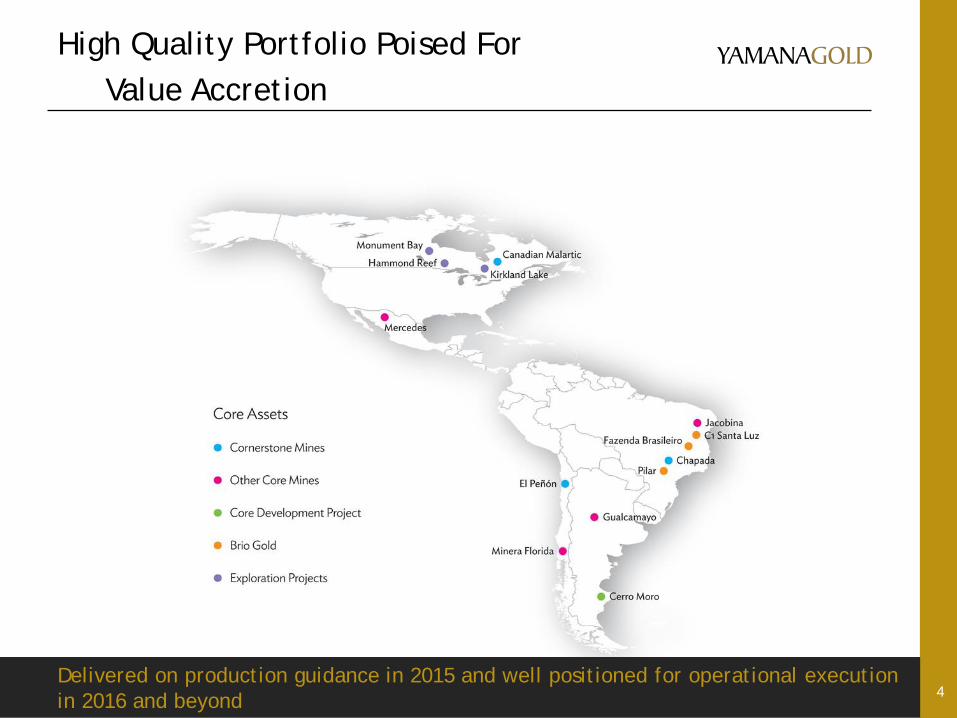
High Quality Portfolio Poised For Value Accretion
4 Delivered on production guidance in 2015 and well positioned for operational execution in 2016 and beyond
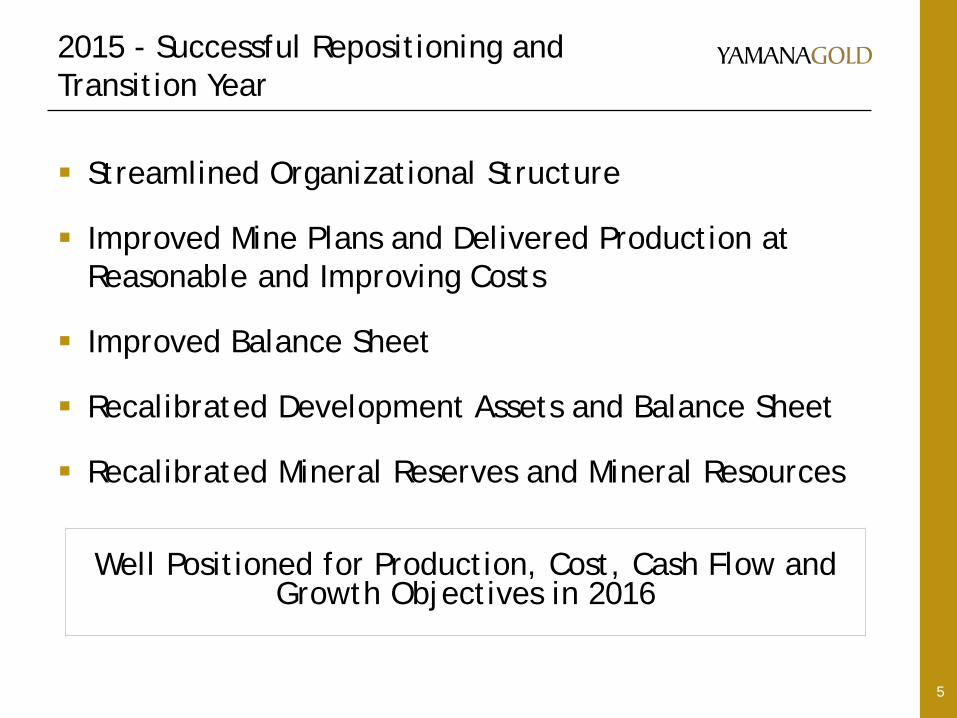
2015 - Successful Repositioning and Transition Year
5
Streamlined Organizational Structure
Improved Mine Plans and Delivered Production at Reasonable and Improving Costs
Improved Balance Sheet
Recalibrated Development Assets and Balance Sheet
Recalibrated Mineral Reserves and Mineral Resources
Well Positioned for Production, Cost, Cash Flow and Growth Objectives in 2016

Operational Results Overview
6 1. A non-GAAP measure. A reconciliation of which can be found at www.yamana.com/Q42015 2. Includes cash costs, sustaining capital, corporate general and administrative expense, and exploration expense.
2015
Production
Gold (ounces) 1.275M
Silver (ounces) 9.0M
Copper (lbs Chapada) 131M
Costs Gold Silver
Cash Costs(1) per ounce $596 $7.12
All-in Sustaining Costs(1,2) per ounce $842 $10.81
Co-Product Cash Costs per pound of copper (Chapada) $1.46
Delivered 2015 gold production within guidance range
Poised to meet or exceed 2016 targets as a result of repositioning during 2015

Delivering Financial Performance
7
1. A non-GAAP measure. A reconciliation of which can be found at www.yamana.com/Q42015. 2. Cash flow generated from operations before changes in non-cash working capital. Adjusted for one-time items including $148M in deferred revenue on metal agreements
which is a one-time positive cash flow.
Q4 2015 FY 2015
Revenue $463M $1,825
Gold Sales (ounces) 342,194 1,248,401
Silver Sales (ounces) 1.88M 8.90M
Copper Sales (lbs Chapada) 38.6M 126.0M
Adjusted Earnings/(Loss)(1) $(7.5)M $(73.7)
Per share: $(0.01) $(0.08)
Adjusted Cash Flow(1,2) $151M $530M Per share: $0.16 $0.57
Gross margin remained comparable to Q4 and FY 2014 despite falling metal prices negatively
impacting revenues

Strengthened Balance Sheet
8
YE 2015
Cash $120M
Available Credit $814M
Total Long-Term Debt (1) $1,774M
Working Capital $107M
DD&A $542M
Corporate G&A $118M
Exploration Expense $23M
Capital Expenditure $379M
Reduced debt position by $286M and improved working capital position by $64M 1. Includes debt assumed from the acquisition of Canadian Malartic which is neither corporate nor guaranteed by Yamana and current portion of long-term debt of $97 million..
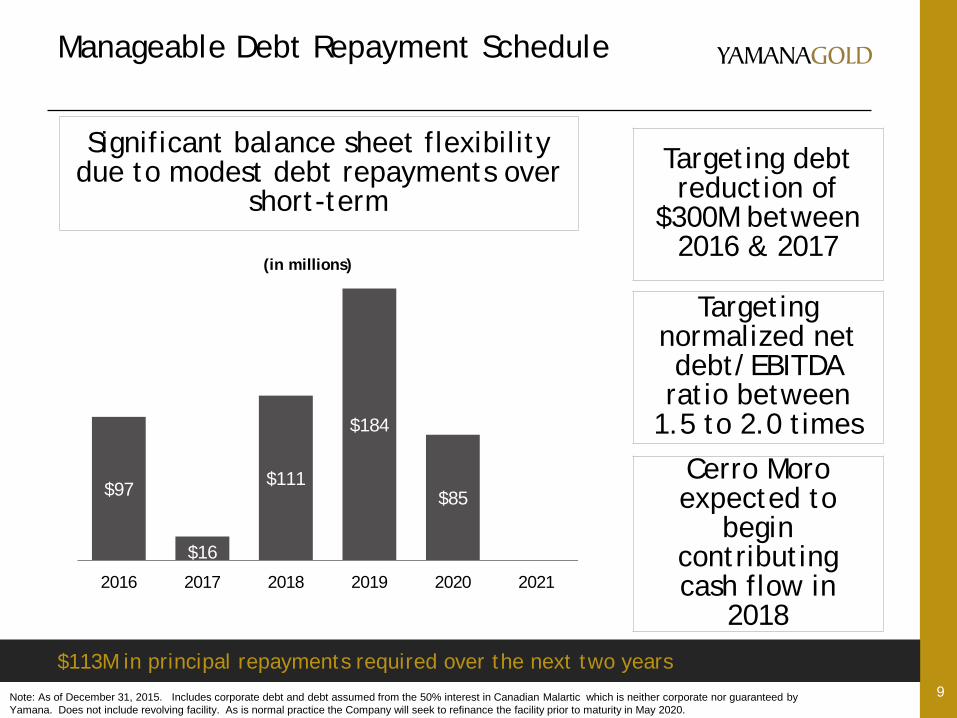
Manageable Debt Repayment Schedule
9
$97
$16
$111
$184
$85
$0
2016 2017 2018 2019 2020 2021
(in millions)
Significant balance sheet flexibility due to modest debt repayments over
short-term
$113M in principal repayments required over the next two years
Note: As of December 31, 2015. Includes corporate debt and debt assumed from the 50% interest in Canadian Malartic which is neither corporate nor guaranteed by Yamana. Does not include revolving facility. As is normal practice the Company will seek to refinance the facility prior to maturity in May 2020.
Cerro Moro expected to
begin contributing cash flow in
2018
Targeting debt reduction of
$300M between 2016 & 2017
Targeting normalized net debt/EBITDA
ratio between 1.5 to 2.0 times

Portfolio Consists of Three Divisions Ten producing Mines with Three Cornerstone Mines
10

Development Pipeline
11
Advanced Exploration Scoping PEA/Pre-
Feasibility Feasibility Execution
Monument Bay
Chapada Expansion Project
C1 Santa Luz
Deep Carbonates
Project
Kirkland Lake
Cerro Moro
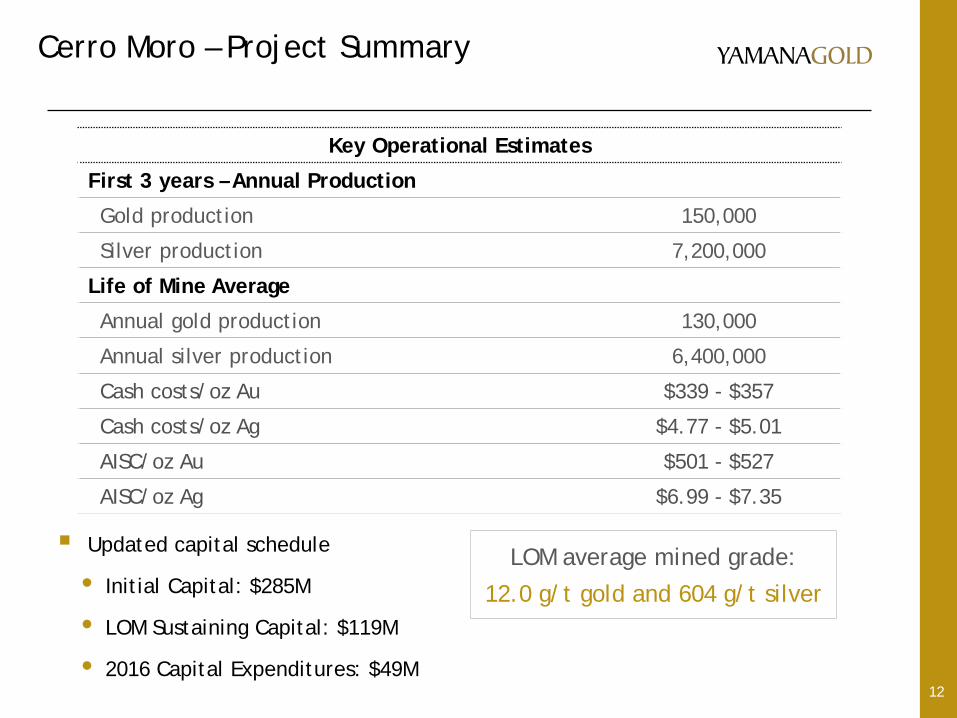
Cerro Moro – Project Summary
12
Updated capital schedule
• Initial Capital: $285M
• LOM Sustaining Capital: $119M
• 2016 Capital Expenditures: $49M
Key Operational Estimates
First 3 years – Annual Production
Gold production 150,000
Silver production 7,200,000
Life of Mine Average
Annual gold production 130,000
Annual silver production 6,400,000
Cash costs/oz Au $339 - $357
Cash costs/oz Ag $4.77 - $5.01
AISC/oz Au $501 - $527
AISC/oz Ag $6.99 - $7.35
LOM average mined grade:
12.0 g/t gold and 604 g/t silver

2015 Mineral Reserves and Mineral Resource Estimate
13
17.7 16.3 19.6
15.9
14.1 16.3
21.6 24.8
10.1 13.4 13.9 15.2
2012 2013 2014 2015
Gol
d O
unce
s (m
illio
ns)
Proven and Probable mineral reserves Measured and Indicated mineral resources
Inferred mineral resources
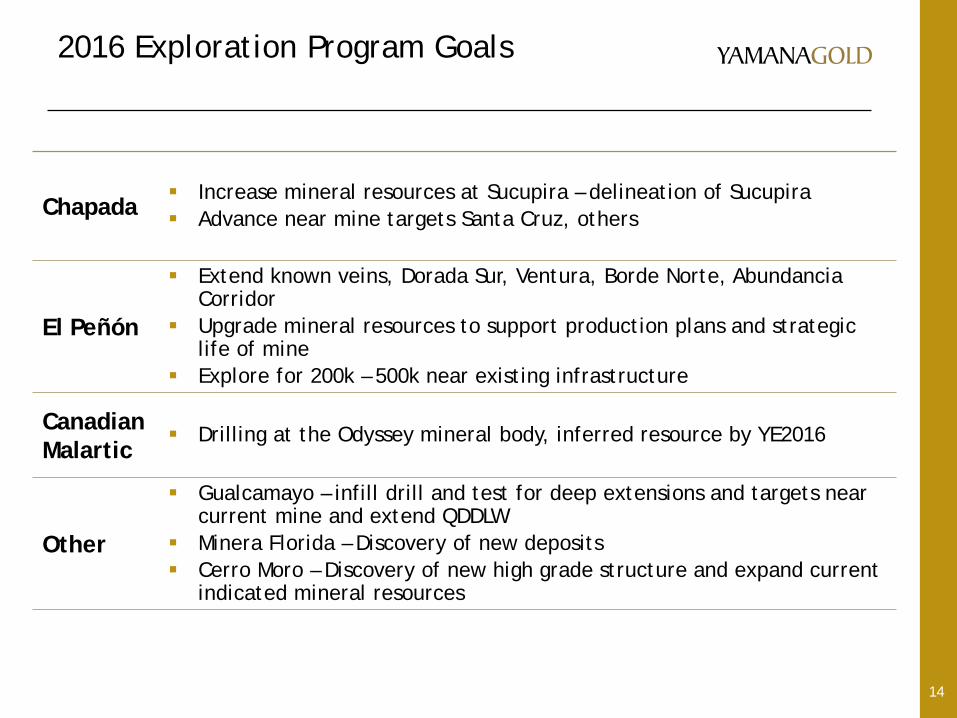
2016 Exploration Program Goals
14
Chapada Increase mineral resources at Sucupira – delineation of Sucupira Advance near mine targets Santa Cruz, others
El Peñón
Extend known veins, Dorada Sur, Ventura, Borde Norte, Abundancia Corridor
Upgrade mineral resources to support production plans and strategic life of mine
Explore for 200k – 500k near existing infrastructure
Canadian Malartic
Drilling at the Odyssey mineral body, inferred resource by YE2016
Other
Gualcamayo – infill drill and test for deep extensions and targets near current mine and extend QDDLW
Minera Florida – Discovery of new deposits Cerro Moro – Discovery of new high grade structure and expand current
indicated mineral resources
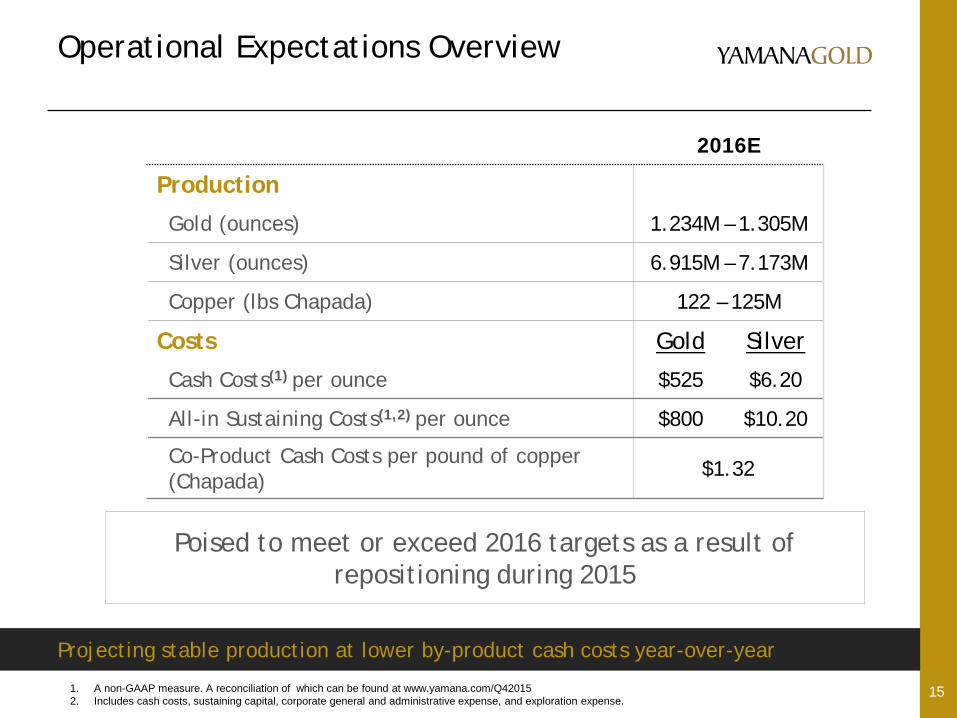
Operational Expectations Overview
15 1. A non-GAAP measure. A reconciliation of which can be found at www.yamana.com/Q42015 2. Includes cash costs, sustaining capital, corporate general and administrative expense, and exploration expense.
2016E
Production
Gold (ounces) 1.234M – 1.305M
Silver (ounces) 6.915M – 7.173M
Copper (lbs Chapada) 122 – 125M
Costs Gold Silver
Cash Costs(1) per ounce $525 $6.20
All-in Sustaining Costs(1,2) per ounce $800 $10.20
Co-Product Cash Costs per pound of copper (Chapada) $1.32
Projecting stable production at lower by-product cash costs year-over-year
Poised to meet or exceed 2016 targets as a result of repositioning during 2015

2016-2018 Expectations Gold Production
16
2016 2017 2018
Gold Ounces Chapada 116k – 122k 110k 90k
El Peñón 235k – 250k 245k 245k
Canadian Malartic (50%) 280k – 290k 300k 305k
Gualcamayo 150k – 165k 155k 150k
Mercedes 85k – 90k 88k 82k
Minera Florida 110k – 115k 110k 110k
Jacobina 110k – 115k 120k 130k
Pilar 85k – 90k 100k 98k
Fazenda Brasileiro 63k – 68k 65k 65k
Cerro Moro - - 76k
Total Yamana 1.23M – 1.31M 1.29M 1.35M
Continue to project year over year gold production growth at lower costs