Embed Size (px)
Citation preview

For peer review only
Lifetime alcohol use and overall and cause-specific mortality in the European Prospective Investigation into Cancer and
nutrition (EPIC) study.
Journal: BMJ Open
Manuscript ID: bmjopen-2014-005245
Article Type: Research
Date Submitted by the Author: 11-Mar-2014
Complete List of Authors: Ferrari, Pietro; International Agency for Research on Cancer, Nutrition and Metabolism Licaj, Idlir; International Agency for Research on Cancer,
Muller, David; International Agency for Research on Cancer, Kragh-Andersen, Per; University of Copenhagen, Department of Biostatistics Johansson, Mattias; International Agency for Research on Cancer, Boeing, Heiner; German Institute of Human Nutrition Potsdam-Rehbruecke, Weiderpass, Elisabete; University of Tromso, Department of Community Medicine, Faculty of Health Sciences Dossus, Laure; INSERM, Nutrition, Hormones and Women's Health, U1018 Dartois, Laureen; Inserm, Center for Research in Epidemiology and Population Health Fagherazzi, Guy; Inserm, U1018 Team 9 Bradbury, Kathryn; University of Oxford, Cancer Epidemiology Unit,
Nuffield Department of Population Health Wareham, Nicholas; Institute of Metabolic Science, Addenbrooke’s Hospital, the Medical Research Council Epidemiology Unit Duell, Eric; Catalan Institute of Oncology (ICO-IDIBELL), Unit of Nutrition, Environment and Cancer Gurrea, Aurelio; Navarra Public Health Institute, MOLINA-MONTES, Esther; Andalusian School of Public Health, Navarro, Carmen; Murcia Regional Health Authority, Murcia, Wallström, Peter; Lund University, Clinical Sciences, Malmö Tjønneland, Anne; The Institute of cancer epidemiology, Danish Cancer society,
Olsen, Anja; Danish Cancer Society, Institute of Cancer Epidemiology Trichopoulou, Antonia; Hellenic Health Foundation,, Benetou, Vasiliki; University of Athens, Medical School, clinical neurophysiology Trichopoulos, Dimitrios; Hellenic Health Foundation,, ; Harvard School of Public Health, Department of Epidemiology Tumino, Rosario; "Civic- M.P.Arezzo" Hospital, Cancer Registry and Histopathology Unit Agnoli, Claudia; Fondazione IRCCS Istituto Nazionale dei Tumori, Sacerdote, Carlotta; CPO-Piemonte, ; HuGeF Foundation, Palli, Domenico; CSPO-Scientific Institute of Tuscany, Molecular and Nutritional Epidemiology Unit
Li, Kuanrong; Division of Clinical Epidemiology, German Cancer Research Center, Kaaks, Rudolf; Deutsches Krebsforschungszentrum Peeters, Petra; University Medical Center Utrecht, Department of
The linked image cannot be displayed. The file may have been moved, renamed, or deleted. Verify that the link points to the correct file and location.
For peer review only - http://bmjopen.bmj.com/site/about/guidelines.xhtml
BMJ Open on M
arch 11, 2020 by guest. Protected by copyright.
http://bmjopen.bm
j.com/
BM
J Open: first published as 10.1136/bm
jopen-2014-005245 on 3 July 2014. Dow
nloaded from

For peer review only
Epidemiology Beulens, Joline; University Medical Center Utrecht, Julius Center Nunes, Luciana; International Agency for Research on Cancer, Nutrition and Metabolism Gunter, Marc; Imperial College, London, School of Public Health Norat, Teresa; Imperial College London Brennan, Paul; International Agency for Research on Cancer, Overvad, Kim; Aarhus University, Department of Public Health Riboli, Elio; Imperial College London, Department of Epidemiology and
Biostatistics, School of Public Health Romieu, Isabelle; IARC,
<b>Primary Subject Heading</b>:
Epidemiology
Secondary Subject Heading: Public health
Keywords: NUTRITION & DIETETICS, Epidemiology < ONCOLOGY, CARDIOLOGY
The linked image cannot be displayed. The file may have been moved, renamed, or deleted. Verify that the link points to the correct file and location.
Page 1 of 38
For peer review only - http://bmjopen.bmj.com/site/about/guidelines.xhtml
BMJ Open
123456789101112131415161718192021222324252627282930313233343536373839404142434445464748495051525354555657585960
on March 11, 2020 by guest. P
rotected by copyright.http://bm
jopen.bmj.com
/B
MJ O
pen: first published as 10.1136/bmjopen-2014-005245 on 3 July 2014. D
ownloaded from

For peer review only
Lifetime alcohol use and overall and cause-specific mortality in the European
Prospective Investigation into Cancer and nutrition (EPIC) study.
Pietro FERRARI1, Idlir LICAJ1, David C MULLER1, Per Kragh ANDERSEN2, Mattias
JOHANSSON1, Heiner BOEING3, Elisabete WEIDERPASS4,5,6,7, Laure DOSSUS8,9,10,
Laureen DARTOIS8,9,10, Guy FAGHERAZZI8,9,10, Kathryn E BRADBURY11, Kay-Tee
KHAW12, Nick WAREHAM13, Eric J DUELL14, Aurelio BARRICARTE15,16, Esther
MOLINA-MONTES17,18, Carmen NAVARRO SANCHEZ18,19,20, Larraitz ARRIOLA16,21,
Peter WALLSTRÖM22, Anne TJØNNELAND23, Anja OLSEN23, Antonia
TRICHOPOULOU24,25, Vasiliki BENETOU24, Dimitrios TRICHOPOULOS25,26,27, Rosario
TUMINO28, Claudia AGNOLI29, Carlotta SACERDOTE30,31, Domenico PALLI32, Kuanrong
LI33, Rudolf KAAKS33, Petra PEETERS34, Joline WJ BEULENS34, Luciana NUNES1,35,
Marc GUNTER36, Teresa NORAT36, Kim OVERVAD37,38, Paul BRENNAN1, Elio
RIBOLI36, Isabelle ROMIEU1.
Author Affiliations:
1International Agency for Research on Cancer, Lyon, France. 2Department of Biostatistics, University of Copenhagen, Copenhagen, Denmark. 3German Institute of Human Nutrition, Potsdam-Rehbrücke Department of Epidemiology,
Nuthetal, Germany. 4Department of Community Medicine, Faculty of Health Sciences, University of Tromso,
The Arctic University of Norway, Tromsø, Norway. 5Department of Research, Cancer Registry of Norway, Oslo, Norway. 6Department of Medical Epidemiology and Biostatistics, Karolinska Institutet, Stockholm,
Sweden. 7Samfundet Folkhälsan, Helsinki, Finland. 8Inserm, Centre for research in Epidemiology and Population Health (CESP), U1018,
Nutrition, Hormones and Women’s Health team, F-94805, Villejuif, France. 9Université Paris Sud, UMRS 1018, F-94805, Villejuif, France. 10IGR, F-94805, Villejuif, France. 11Cancer Epidemiology Unit, Nuffield Department of Population Health, University of
Oxford, UK.
Page 2 of 38
For peer review only - http://bmjopen.bmj.com/site/about/guidelines.xhtml
BMJ Open
123456789101112131415161718192021222324252627282930313233343536373839404142434445464748495051525354555657585960
on March 11, 2020 by guest. P
rotected by copyright.http://bm
jopen.bmj.com
/B
MJ O
pen: first published as 10.1136/bmjopen-2014-005245 on 3 July 2014. D
ownloaded from

For peer review only
12the Department of Public Health and Primary Care, University of Cambridge
Addenbrooke’s Hospital, Cambridge, United Kingdom. 13the Medical Research Council Epidemiology Unit, Institute of Metabolic Science,
Addenbrooke’s Hospital, Cambridge, United Kingdom; 14Unit of Nutrition, Environment and Cancer, Cancer Epidemiology Research Program
Bellvitge Biomedical Research Institute (IDIBELL), Catalan Institute of Oncology (ICO),
Barcelona, Spain. 15Navarre Public Health Institute, Pamplona, Spain. 16Consortium for Biomedical Research in Epidemiology and Public Health (CIBER
Epidemiología y Salud Pública-CIBERESP), Spain. 17Escuela Andaluza de Salud Pública. Instituto de Investigación Biosanitaria de Granada,
Granada, Spain. 18CIBER Epidemiología y Salud Pública (CIBERESP), Spain. 19Department of Epidemiology, Murcia Regional Health Council, Murcia, Spain. 20Department of Health and Social Sciences, Universidad de Murcia, Spain. 21Public Health Division of Gipuzkoa, Instituto BIO-Donostia, Basque Government. Spain. 22Nutrition Epidemiology Research Group, Department of Clinical Sciences, Lund University,
Malmö, Sweden. 23Danish Cancer Society Research Center, Copenhagen, Denmark. 24WHO Collaborating Center for Food and Nutrition Policies, Department of Hygiene,
Epidemiology and Medical Statistics, University of Athens Medical School, Athens, Greece. 25Hellenic Health Foundation, Athens, Greece. 26Department of Epidemiology, Harvard School of Public Health, Boston, MA, USA. 27Bureau of Epidemiologic Research, Academy of Athens, Athens, Greece. 28Cancer Registry and Histopathology Unit, "Civic- M.P.Arezzo" Hospital, ASP Ragusa,
Italy. 29Epidemiology and Prevention Unit, Fondazione IRCCS Istituto Nazionale dei Tumori,
Milan, Via Venezian, 1, 20133 Milan, Italy. 30Unit of Cancer Epidemiology, AO Citta' della Salute e della Scienza-University of Turin
and Center for Cancer Prevention (CPO-Piemonte), Via Santena 7, 10126 Turin, Italy. 31Human Genetics Foundation (HuGeF), Via Nizza 52, 10126 Turin, Italy. 32Molecular and Nutritional Epidemiology Unit, Cancer Research and Prevention Institute –
ISPO, Florence, Italy.
Page 3 of 38
For peer review only - http://bmjopen.bmj.com/site/about/guidelines.xhtml
BMJ Open
123456789101112131415161718192021222324252627282930313233343536373839404142434445464748495051525354555657585960
on March 11, 2020 by guest. P
rotected by copyright.http://bm
jopen.bmj.com
/B
MJ O
pen: first published as 10.1136/bmjopen-2014-005245 on 3 July 2014. D
ownloaded from

For peer review only
33the Department of Cancer Epidemiology, German Cancer Research Centre, Heidelberg,
Germany. 34Department of Epidemiology, Julius Center for Health Sciences and Primary Care,
University Medical Center, Utrecht, The Netherlands. 35Department of Statistics, Federal University of Rio Grande do Sul, Porto Alegre, Brazil. 36Department of Epidemiology & Biostatistics, School of Public Health, Imperial College
London, London, United Kingdom. 37Department of Public Health, Section for Epidemiology, Aarhus University, Aarhus,
Denmark. 38Department of Cardiology, Aalborg University Hospital, Aalborg, Denmark.
Corresponding Author:
Pietro Ferrari, PhD
Nutrition and Metabolism Section
International Agency for Research on Cancer
150, cours Albert Thomas, Lyon, France
Tel +33 472728031
Email: [email protected]
Abbreviations:
ARC: alcohol related cancers
CVD: cardiovascular diseases
CHD: coronary heart disease
HR: Hazard ratio
CI: Confidence Intervals
EPIC: European Prospective Investigation into Cancer and nutrition
Keywords: lifetime alcohol, smoking status, overall mortality.
Page 4 of 38
For peer review only - http://bmjopen.bmj.com/site/about/guidelines.xhtml
BMJ Open
123456789101112131415161718192021222324252627282930313233343536373839404142434445464748495051525354555657585960
on March 11, 2020 by guest. P
rotected by copyright.http://bm
jopen.bmj.com
/B
MJ O
pen: first published as 10.1136/bmjopen-2014-005245 on 3 July 2014. D
ownloaded from

For peer review only
Abstract (300 words)
Objectives. To investigate the role of factors that modulate the association between alcohol
and mortality, and to provide estimates of absolute risk of death.
Design. The European Prospective Investigation into Cancer and Nutrition (EPIC).
Setting. 23 centres in 10 countries.
Participants. 380,395 men and women, free of cancer, diabetes, heart attack or stroke at
enrolment, followed up for 12.6 years on average.
Main outcome measures. 20,453 fatal events, of which 2,053 alcohol related cancers (ARC,
including cancers of upper aero-digestive tract, liver, colorectal and female breast), 4,187
cardiovascular diseases (CVD/CHD), 856 violent deaths and injuries. Lifetime alcohol use
was assessed at recruitment.
Results. Hazard ratios comparing extreme drinkers (≥30 g/day in women and ≥60 g/day in
men) to moderate drinkers (0.1-4.9 g/day) were 1.27 (95%CI: 1.13,1.43) in women and 1.53
(1.39,1.68) in men. Strong associations were observed for ARC mortality, in men particularly,
and to violent deaths and injuries, in men only. No associations were observed for CVD/CHD
mortality among drinkers, whereby hazard ratios were higher in never compared to moderate
drinkers. Overall mortality seemed to be more strongly related to beer than wine use,
particularly in men. The 10-year risks of overall death for women aged 60 years drinking
more than 30 g/day was 5% and 7%, for never and current smokers, respectively.
Corresponding figures in men consuming more than 60 g/day were 11% and 18%, in never
and current smokers respectively. In competing risks analyses, mortality due to CVD/CHD
was more pronounced than ARC in men, while CVD/CHD and ARC mortality were of similar
magnitude in women.
Conclusions. In this large European cohort, alcohol use was positively associated with overall
mortality, ARC and violent death and injuries, but marginally to CVD/CHD. Absolute risks of
death observed in EPIC suggest that alcohol is an important determinant of total mortality.
Page 5 of 38
For peer review only - http://bmjopen.bmj.com/site/about/guidelines.xhtml
BMJ Open
123456789101112131415161718192021222324252627282930313233343536373839404142434445464748495051525354555657585960
on March 11, 2020 by guest. P
rotected by copyright.http://bm
jopen.bmj.com
/B
MJ O
pen: first published as 10.1136/bmjopen-2014-005245 on 3 July 2014. D
ownloaded from

For peer review only
Article summary
Strengths and limitations of this study
• This study was based on information on dietary and lifestyle exposure collected in a
large prospective investigation of European adults.
• Findings are based on 380,395 men and women (among whom 20,453 fatal events
occurred) for which iinformation on lifetime alcohol use was available, allowing
separate consideration of former drinkers and lifetime abstainers.
• Exclusion of study participants reporting a morbid condition at baseline, and
sensitivity analyses excluding the first three years of follow-up limited the chance that
reverse causality affected the findings.
• Although statistical models included many potentially relevant adjustment factors,
residual confounding might partially account for the observed associations.
• Average lifetime alcohol consumption was evaluated in this study, whereas it is
possible that specific drinking patterns in particular phases of life, as well as the effect
of binge drinking or drinking during meals, may also be of particular relevance for
mortality.
Page 6 of 38
For peer review only - http://bmjopen.bmj.com/site/about/guidelines.xhtml
BMJ Open
123456789101112131415161718192021222324252627282930313233343536373839404142434445464748495051525354555657585960
on March 11, 2020 by guest. P
rotected by copyright.http://bm
jopen.bmj.com
/B
MJ O
pen: first published as 10.1136/bmjopen-2014-005245 on 3 July 2014. D
ownloaded from

For peer review only
Introduction
Alcohol intake has been associated with an increased risk of death from a large list of morbid
conditions, including digestive tract conditions, liver cirrhosis, chronic pancreatitis,
hypertension, injuries and violence (1-3). In contrast, moderate alcohol drinking was
suggested to be associated with a reduction in cardiovascular disease (CVD) mortality (4;5).
As for cancer, the International Agency for Research on Cancer (IARC) and the World
Cancer Research Fund/American Institute for Cancer Research (WCRF/AICR) concluded that
alcohol use is associated with an increased risk to develop cancers of the upper aero-digestive
tract, liver, colorectal and female breast (6;7). It has been estimated that alcohol accounted for
about 2.7 million annual deaths and 3.8% of all deaths worldwide (8;9), but the impact of
alcohol on mortality is differential with respect to specific causes of diseases (3).
Within the European Prospective Investigation into Cancer and Nutrition (EPIC), a recent
work showed that heavy alcohol use was associated to a higher risk of death from alcohol-
related cancer, external causes and ‘other causes’, while no associations were observed for
coronary heart disease and other cardiovascular diseases (10).
In this work, associations between alcohol use and overall and cause-specific mortality were
further investigated. Notably, potential variability of the relationships with respect to smoking
habits, the type of alcoholic beverages, and country was explored. The cumulative
probabilities of death were estimated for overall mortality and, in a competing risks
framework, for specific mortality causes with respect to levels of alcohol, separately in men
and women. Further, the burden of alcohol use in relation to a broad group of causes of deaths
was evaluated by means of overall estimates of rate advancement periods, with respect to two
alternative scenarios.
Page 7 of 38
For peer review only - http://bmjopen.bmj.com/site/about/guidelines.xhtml
BMJ Open
123456789101112131415161718192021222324252627282930313233343536373839404142434445464748495051525354555657585960
on March 11, 2020 by guest. P
rotected by copyright.http://bm
jopen.bmj.com
/B
MJ O
pen: first published as 10.1136/bmjopen-2014-005245 on 3 July 2014. D
ownloaded from

For peer review only
Methods
Study Population. EPIC is an on-going multi-centre study that has been described in detail
previously (11). From 1992 to 2000, 521,448 individuals, aged 25 to 70 years were recruited
in the surroundings of 23 centres in 10 European countries. Most of the participants were
recruited from the general population residing in a given geographic area, a town, or a
province. Exceptions were the cohorts of France (female members of a health insurance for
school employees), Utrecht (breast cancer screening attendees), Ragusa (blood donors and
their spouses), and Oxford (mainly vegetarian and healthy eaters). Some characteristics of the
study population in the different participating countries are reported in Table 1. Study
participants provided informed consent and completed questionnaires on their diet, lifestyle,
and medical history. The study was approved by the relevant ethical review boards of each
centre and the International Agency of Research on Cancer in Lyon, France (11).
Dietary and lifestyle assessment. Diet was assessed at enrolment using validated country- or
center-specific dietary questionnaires (DQ) designed to capture habitual consumption over the
preceding year. Lifetime alcohol consumption was assessed based on self-reported weekly
consumption of wine, beer, and liquor at ages 20, 30, 40, 50 years in the lifestyle
questionnaire. Information on lifetime alcohol consumption was available for approximately
76% of EPIC participants (12). Information on smoking status and duration, physical activity
during leisure time, prevalent conditions at baseline, educational attainment, anthropometric
measures and reproductive history was obtained using lifestyle questionnaires.
Assessment of causes of death. Vital status and information on cause and date of death were
ascertained using record linkage with cancer registries, boards of health, and death registries
(Denmark, Italy, The Netherlands, Spain, the United Kingdom), or by active follow-up
(France Germany, Greece). Data were coded using the 10th revision of the International
Page 8 of 38
For peer review only - http://bmjopen.bmj.com/site/about/guidelines.xhtml
BMJ Open
123456789101112131415161718192021222324252627282930313233343536373839404142434445464748495051525354555657585960
on March 11, 2020 by guest. P
rotected by copyright.http://bm
jopen.bmj.com
/B
MJ O
pen: first published as 10.1136/bmjopen-2014-005245 on 3 July 2014. D
ownloaded from
For peer review only
Statistical Classification of Diseases, Injuries and Causes of Death (ICD-10) where the
underlying cause is the official cause of death.
In this work, six different causes of deaths were selected: cardiovascular disease (CVD) [I00-
I99 excluding I20-I25] and coronary heart disease (CHD) [I20-I25], alcohol related cancer
(ARC), including colorectal cancer [C18- C20], female breast cancer [C50], upper aero-
digestive cancers (UADT, including cancer of the mouth [C01 to C10 without C08=salivary
gland], larynx [C21], pharynx [C11 to C14], oesophagus [C15]), violent deaths and injuries
(Injury, poisoning and certain other consequences of external causes [S00-T98]; deaths due to
respiratory diseases [J00-J99]; a group for all other causes (including external causes of
morbidity and mortality [V01-Y98], unknown causes [R96-R99]).
Statistical analyses. Participants from Denmark (Aarhus, Copenhagen), France, Germany
(Heidelberg, Potsdam), Greece, Italy (Florence, Varese, Ragusa, Turin), the Netherlands
(Utrecht), Spain (Asturias, Granada, Murcia, Navarra, San Sebastian), and the United
Kingdom (Cambridge, Oxford), were eligible for this analysis. We excluded the entire cohorts
of Naples (Italy), Bilthoven (The Netherlands), Sweden and Norway because no information
on past alcohol use was collected (n=118,082). Further exclusions concerned participants with
incomplete vital status information (n=928), who had not filled out the dietary or lifestyle
questionnaires (n=11,411), and participants whose ratio of energy intake to estimated energy
requirement (n=7,592), calculated in terms of gender, body weight, height, and age, was in the
top or bottom 1% in order to partially reduce the impact of outlier values (13). Participants
that at recruitment reported a cancer (n=13,283), diabetes (n=11,240), myocardial infarction
or heart disease (n=5,266) or stroke (n=3,246) were excluded from the analyses (n= 30,665 in
total).
Cox proportional hazards models were used to compute mortality hazard ratios (HR), and
95% confidence intervals, for categories of average lifetime alcohol use; never drinkers, 1–4.9
Page 9 of 38
For peer review only - http://bmjopen.bmj.com/site/about/guidelines.xhtml
BMJ Open
123456789101112131415161718192021222324252627282930313233343536373839404142434445464748495051525354555657585960
on March 11, 2020 by guest. P
rotected by copyright.http://bm
jopen.bmj.com
/B
MJ O
pen: first published as 10.1136/bmjopen-2014-005245 on 3 July 2014. D
ownloaded from
For peer review only
g/day (reference category), 5–14.9, 15–29.9, 30–59.9, ≥60 g/day. In women, the last two
alcohol categories were collapsed into a ≥30 g/day group. Time in the study up to death, loss
or end of follow-up, whichever came first was the primary time variable. The Breslow method
was adopted for handling ties. Models were stratified by center to control for differences in
questionnaire design, follow-up procedures, and other center-specific effects (13). Systematic
adjustments were undertaken for age at recruitment, and other lifestyle factors Systematic
adjustments were undertaken for age at recruitment, BMI and height (continuous), an
indicator for participants that quitted alcohol drinking, time since alcohol quitting
(continuous), smoking (never, current with 1 to 15 cigarettes/day, current with more than 15
cigarettes/day, former smoker that quitted less than 10 years before recruitment, former
smoker that quitted more than 10 years before recruitment, current smoker of other than
cigarettes, unknown [n=8,819]), duration of smoking (continuous), age at start smoking (less
than 19 years, more than 19 years, unknown [n=39,041]), educational attainment (five
categories of level of schooling: none, primary, technical, or degree or more, unknown
[n=14,223]) as a proxy variable for socioeconomic status, physical activity (inactive,
moderately inactive, moderately active, active, unknown [n=328]), and energy intake
(continuous). In women the models were further adjusted for menopausal status
(dichotomized as natural postmenopausal or surgical versus pre- or peri-menopausal, as
assessed at baseline), ever use of replacement hormones, and number of full term pregnancies
(nulliparous, 1 or 2 children, more than three, unknown [n=6,482]). Indicator variables
specific to some of the confounding factors were used to model missing values, after checking
that the parameters associated with these indicators were not statistically significantly
associated with risk of death.
Models for overall and cause-specific mortality were fitted, separately for men and women.
An overall test of significance of HRs related to alcohol use was determined by computing p-
Page 10 of 38
For peer review only - http://bmjopen.bmj.com/site/about/guidelines.xhtml
BMJ Open
123456789101112131415161718192021222324252627282930313233343536373839404142434445464748495051525354555657585960
on March 11, 2020 by guest. P
rotected by copyright.http://bm
jopen.bmj.com
/B
MJ O
pen: first published as 10.1136/bmjopen-2014-005245 on 3 July 2014. D
ownloaded from

For peer review only
values (pWald) for Wald test statistics compared to a chi-square distribution with degrees of
freedom equal to the number of alcohol categories minus one. The proportional hazards
assumption in the Cox model was satisfied and evaluated via inclusion into the disease model
of interaction terms between lifetime alcohol and follow-up time. To reduce the chance of
reverse causality, sensitivity analyses were run excluding the first three years of follow-up. As
results were not different from those using the entire cohort, they were not shown. Analyses
excluding former drinkers (4% and 5% of the study populations, in men and women
respectively) provided very similar results (results not shown).
Evaluating heterogeneity. Effect modification in the relations between alcohol and mortality
by smoking status (never, ever), smoking status (never and current smokers), and recruitment
country was assessed. Models with main effects and interaction terms were fitted and
compared to models with main effects only. The difference in log-likelihood (likelihood ratio
test statistics) was compared to a chi-square distribution with degrees of freedom equal to the
number of interaction terms. HRs for alcohol categories across levels of interacting variables
were computed as linear combinations of main effects and interactions. Associations with
wine and beer uses (each grouped as never, 0.1-2.9 g/day (reference), 3-9.9, 10-19.9, 20-39.9,
≥40 g/day, ≥20 g/day in women) and total mortality were assessed in mutually adjusted
models. The difference of association for wine and beer use in relation to overall mortality
was assessed by inspecting the significance of the parameter related to the arithmetic
difference of wine and beer use (expressed on the log-scale plus 1 to deal with abstainers) in a
model that also included their arithmetic sum. When assessing the association for wine (beer)
intake, analyses were restricted to moderate lifetime drinkers of beer (wine) and spirits (below
3 g/day).
Flexible parametric survival models (14) with age as the time-scale were used to evaluate
whether the association between alcohol intake and mortality rate varied by attained age. The
Page 11 of 38
For peer review only - http://bmjopen.bmj.com/site/about/guidelines.xhtml
BMJ Open
123456789101112131415161718192021222324252627282930313233343536373839404142434445464748495051525354555657585960
on March 11, 2020 by guest. P
rotected by copyright.http://bm
jopen.bmj.com
/B
MJ O
pen: first published as 10.1136/bmjopen-2014-005245 on 3 July 2014. D
ownloaded from

For peer review only
origin of the time-scale was set to 30 years as the hazard of death is essentially zero prior to
that age. The baseline cumulative hazard was modeled using restricted cubic splines with
three internal knots placed at evenly spaced centiles of the uncensored log-survival times in
order to ensure that an equivalent number of deaths occurred between each knot (15).
Interactions between alcohol intake and the time scale were modeled using restricted cubic
splines with one knot placed at the median of uncensored log-survival times. HRs and
differences in survival functions were calculated from the fitted models and plotted against
attained age, along with confidence intervals calculated based on delta method variance
estimates.
Possible departures from linearity in the association between average lifetime alcohol use and
total mortality were assessed using fractional polynomials (16), a subset of generalized linear
models in which various powers (−2, −1, −0.5, 0, 0.5, 1, 2, 3) of the covariate(s) of interest
are entered into the linear predictor. Fractional polynomials of order two were consistently
used in this work for lifetime alcohol use (17). Non-linearity was tested comparing the
difference in log-likelihood of a model with the fractional polynomials with a model with a
linear term only to a chi-square distribution with three degrees of freedom (16).
Absolute risks. An extension of the Cox proportional hazards model was employed to fit
cause- specific associations between lifetime alcohol use and cause-specific mortality in a
competing risks framework (18). An augmented dataset was created where the initial dataset
is replicated a number of times equal to the different causes of death. In each replicated
dataset, competing causes of deaths were set to censored observations, and the analyses were
stratified by the event type (19). The relationship between each confounder variables and
cause-specific mortality was assumed homogenous across causes of death. In this way
competing risks was accounted for, and cumulative cause-specific and overall mortality
curves were estimated for heavy (greater than 30 and 60 g/day, in women and men
Page 12 of 38
For peer review only - http://bmjopen.bmj.com/site/about/guidelines.xhtml
BMJ Open
123456789101112131415161718192021222324252627282930313233343536373839404142434445464748495051525354555657585960
on March 11, 2020 by guest. P
rotected by copyright.http://bm
jopen.bmj.com
/B
MJ O
pen: first published as 10.1136/bmjopen-2014-005245 on 3 July 2014. D
ownloaded from

For peer review only
respectively) and moderate (0.1 to 4.9 g/day) drinkers, separately for never and current
smokers (20). Cumulative mortality curves were obtained for participants aged 60 years,
using mean values for continuous confounding factors, and average frequencies for
categorical confounders.
Quantifying the alcohol burden. The burden of alcohol on mortality was quantified with
estimates of the rate advancement period (RAP) (21), according to two scenarios with
threshold levels equal to 5 and 15 g/day. For overall and cause-specific risk of death, RAP
were computed, dividing the log(HR) estimate comparing alcohol users above and the
threshold with alcohol drinkers between 0.1 g/day and the threshold, by the log of the
parameter associated with age. Never alcohol users did not enter into the estimation.
Associated 95% confidence intervals were also determined. RAP estimates express the impact
of a given exposure on the risk of death, by determining the time (in years) by which the risk
of death is anticipated for exposed study participants compared to non-exposed.
Statistical tests were two-sided, and p-values <0.05 were considered statistically significant.
All analyses were performed using SAS 9.2 (22) and Stata 12.1 (23).
Results
Baseline characteristics. The current analysis was based on 247,795 female and 101,935 male
study participants. The median age at enrolment was 52 years for women and 53 years for
men. Study participants were foll owed on average 12.6 years, accumulating 4,800,585
person-years, during which a total of 20,453 fatal events were recorded (Table 1).
Drinking patterns differed substantially between men and women (Table 2). In women, 10%
(n=25,146) of participants were lifetime never drinkers, while 45% (n=112,281) and 2%
(n=6,042) were moderate (0.1 to 4.9 g/day) and heavy users (>30g/day), respectively.
Conversely, only 1.5% (n=1,600) of men reported having never consumed alcohol, 14%
Page 13 of 38
For peer review only - http://bmjopen.bmj.com/site/about/guidelines.xhtml
BMJ Open
123456789101112131415161718192021222324252627282930313233343536373839404142434445464748495051525354555657585960
on March 11, 2020 by guest. P
rotected by copyright.http://bm
jopen.bmj.com
/B
MJ O
pen: first published as 10.1136/bmjopen-2014-005245 on 3 July 2014. D
ownloaded from

For peer review only
(n=14,287) were moderate drinkers, whilst 29% (n=29,124) were heavy or extreme drinkers
(30 to 59.9 and ≥60 g/day). Furthermore, the vast majority of women who were regular
drinkers (total alcohol intake ≥10g/day) drank predominantly wine (91%), rather than beer
(9%), whilst regular drinkers in men drank beer (46%) and wine (54%) in similar proportion.
Compared to never and moderate drinkers, women with higher alcohol use had higher levels
of education and physical activity, and were more likely to be current smokers, or pre-/peri-
menopausal. Never alcohol users were less likely to have used hormonal replacement therapy
than alcohol drinkers. In men, the trends were somewhat less apparent. Heavy and extreme
alcohol users (≥30 g/day) were more often current smokers, attained lower educational level,
and had higher energy intake levels, compared to moderate drinkers. Never drinkers were
physically less active than alcohol drinkers.
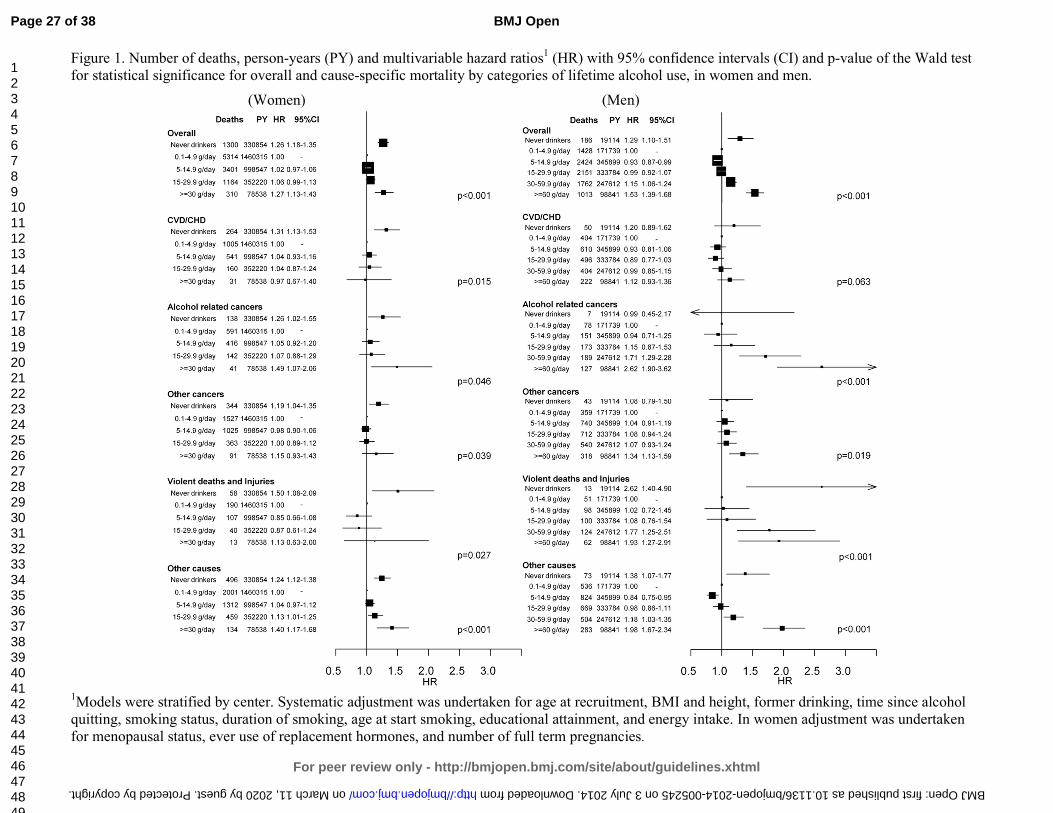
Lifetime alcohol and total mortality. Lifetime average alcohol use was strongly associated
with total mortality, in that both never and heavy drinkers (≥30 g/day) had notably higher
mortality rates than did light to moderate drinkers (0.1-4.9 g/day), a pattern that was
consistently apparent among female and male study participants (Figure 1). The HR
comparing never and heavy drinkers to moderate drinkers in women was 1.26 (95% CI: 1.18-
1.35) and 1.27 (1.13-1.43), respectively. The corresponding HRs among men were 1.29 (1.10-
1.51) for never drinkers, 1.15 (1.06-1.24) for heavy drinkers and 1.53 (1.39-1.68) for extreme
drinkers (≥60 g/day).
Lifetime alcohol and cause specific mortality. In men, extreme alcohol use was associated
with mortality due to alcohol related cancers (HR≥60 vs ref = 2.62: 1.90, 3.62), other cancers
(1.34: 1.13, 1.59), violent deaths and injuries (1.93: 1.27, 2.91), and other causes (1.98: 1.67,
2.34). With the exception of the category for never drinkers, alcohol intake was not associated
with CVD or CHD mortality, both in women and men. Among women, heavy drinkers
displayed HR≥30 vs ref equal to 1.49 (1.07, 2.06) for alcohol related cancers. Respiratory
Page 14 of 38
For peer review only - http://bmjopen.bmj.com/site/about/guidelines.xhtml
BMJ Open
123456789101112131415161718192021222324252627282930313233343536373839404142434445464748495051525354555657585960
on March 11, 2020 by guest. P
rotected by copyright.http://bm
jopen.bmj.com
/B
MJ O
pen: first published as 10.1136/bmjopen-2014-005245 on 3 July 2014. D
ownloaded from

For peer review only
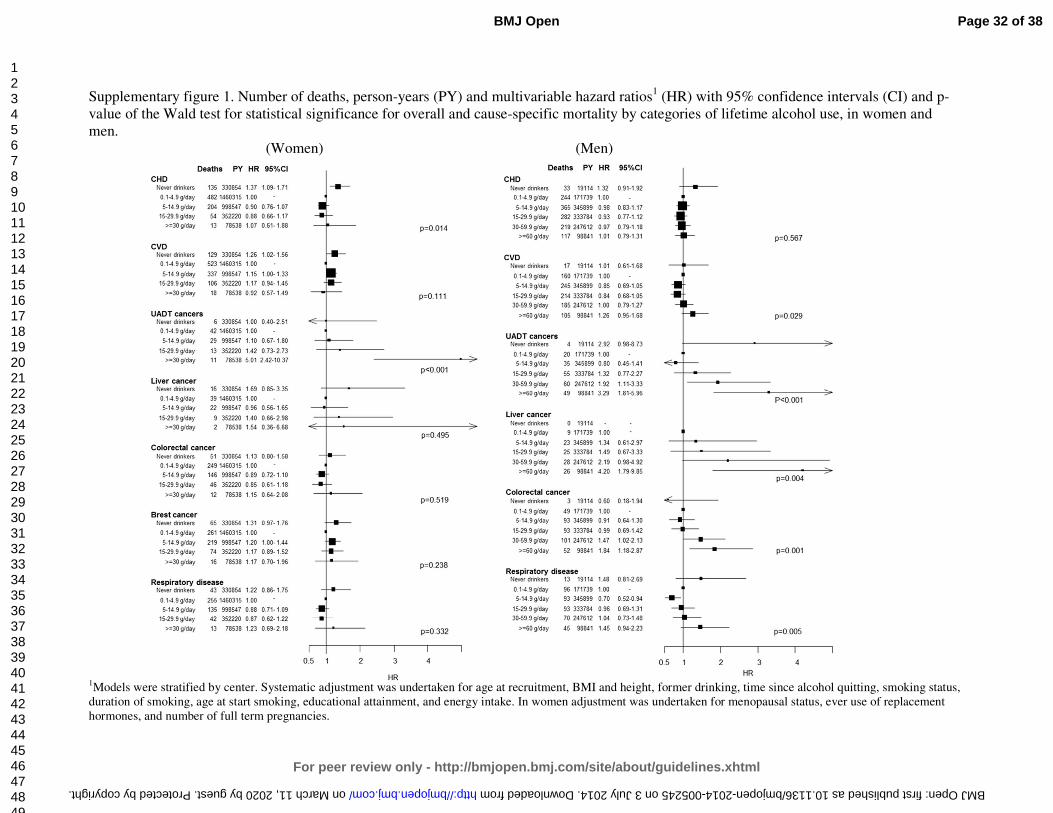
diseases were not associated with lifetime alcohol in women, while results were suggestive of
an increased risk in extreme alcohol users compared to moderate users in men
(Supplementary Figure 1). Dose–response relationships evaluated with fractional polynomials
are displayed in Supplementary Figures 2 and 3, for women and men respectively.
Evaluating heterogeneity. In both sexes, alcohol related HRs for overall mortality were of
similar magnitude in never and current smokers (Table 3). Analyses conducted by smoking
intensity (never vs. heavy smokers, i.e. more than 15 cigarettes/day) produced very similar
evidence (results not shown). Cause-specific analyses showed mostly homogeneous alcohol-
related HRs by smoking status (results not shown). In women, beer use was more strongly
related than wine to overall mortality for amount greater than 3g/day compared to the
reference category (0.1 to 2.9 g/day). Lifetime never wine and beer users displayed higher
risks than moderate drinkers. The associations between lifetime alcohol and overall risk of
mortality were differential across country of origin in men (pheterogeneity=0.012) but not in
women (pheterogeneity=0.511), as reported in Supplementary Figures 4 and 5, with stronger
relationships observed in Northern European countries compared to Southern European
countries.
The HR≥60 vs ref for men was more pronounced at earlier ages, and approached one as attained
age approached 90 years (plikelihood-ratio for age-varying versus age invariant
parameterization=0.003), however extreme male drinkers exhibited lower cumulative survival
probability than the reference group throughout the lifespan (Supplementary Figure 6). No
such age varying association was apparent for women (plikelihood-ratio=0.80).
Absolute risks. The 10-year risk of death at the age of 60 years for heavy drinkers was 5% and
7% in women (≥30 g/day), and 11% and 18% in men (≥60 g/day), for never and current
smokers, respectively (Figure 2). Corresponding figures in moderate drinkers (0.1 to 4.9
g/day) were 3% and 4% in women, and 5% and 8% in men. Based on a competing risks
Page 15 of 38
For peer review only - http://bmjopen.bmj.com/site/about/guidelines.xhtml
BMJ Open
123456789101112131415161718192021222324252627282930313233343536373839404142434445464748495051525354555657585960
on March 11, 2020 by guest. P
rotected by copyright.http://bm
jopen.bmj.com
/B
MJ O
pen: first published as 10.1136/bmjopen-2014-005245 on 3 July 2014. D
ownloaded from

For peer review only
analysis, it was estimated that, at the age of 60 years, a female lifetime heavy alcohol drinker
and smoker had a 10-years risk of death of 1.0% for ARC, 1.2% for CVD/CHD, and 0.2% for
violent death and injuries, as displayed in Figure 3. Corresponding figures for males (≥60
g/day) were 2.2% (ARC), 5.0% (CVD/CHD) and 1% (violent death and injuries). Risks for
moderate drinkers for ARC, CVD/CHD and violent death and injuries were 0.8%, 1.2%, 0.2%
and 0.9%, 4.0%, 0.3%, in women and men, respectively. Consistently lower risks were
observed for never smoker individuals, with estimates equal to 0.5%, 0.7% and 0.1% in
women, and 1%, 2.1% and 0.3% in men.
Rate advancement period. The impact of lifetime alcohol on overall and cause-specific
mortality was estimated with RAP values (Table 4). In women, RAP for overall mortality
were equal to 0.36 years (95%CI: -0.05, 0.76) and 0.83 (0.26, 1.39), for the 5 and 15 g/day
scenario, respectively. In men, RAP values were equal to 0.15 (-0.48, 0.76) and 1.42 (0.96,
1.89), for 5 and 15 g/day respectively. RAP values were sizeable for mortality due to alcohol
related cancer (5.03: 3.07, 7.00) and violent death and injuries (11.83: 3.92, 18.17) in the
second scenario.
Discussion
In this large European prospective study, the association between alcohol use and overall and
cause-specific risk of death was evaluated in eight European populations. When accounting
for potential confounding factors, average lifetime alcohol use was strongly associated with
overall mortality, whereas lifetime never alcohol users consistently displayed a higher risk of
death compared to moderate drinkers. These results are in agreement with a recent evaluation
of alcohol and cause-specific mortality in EPIC (10).
This study has several strengths. It was conducted using a large prospective cohort, where
dietary and lifestyle exposure information were collected on disease-free individuals.
Page 16 of 38
For peer review only - http://bmjopen.bmj.com/site/about/guidelines.xhtml
BMJ Open
123456789101112131415161718192021222324252627282930313233343536373839404142434445464748495051525354555657585960
on March 11, 2020 by guest. P
rotected by copyright.http://bm
jopen.bmj.com
/B
MJ O
pen: first published as 10.1136/bmjopen-2014-005245 on 3 July 2014. D
ownloaded from

For peer review only
Information on lifetime alcohol use was available on 76% of the cohort, allowing separate
consideration of former drinkers and lifetime abstainers. Further, exclusion of study
participants reporting a morbid condition at baseline, and sensitivity analyses excluding the
first three years of follow-up suggest that reverse causality is unlikely to have affected the
results. One potential weakness of this study is that, although statistical models included many
potentially relevant adjustment factors, residual confounding might partially account for the
observed associations. In addition, average lifetime alcohol consumption was used throughout
this study, whereby it is possible that specific drinking patterns in particular phases of life, as
well as the effect of binge drinking or drinking during meals may be of particular relevance
for mortality.
A recent Russian study found that a strong relationship between vodka and risk of death (24).
While an apparent J-shaped relationship between alcohol use and mortality has been reported
(25;26), the interpretation of this pattern is the subject of some controversy. It has been
suggested that alcohol abstinence does not truly entail greater risk of death than moderate use,
and that misclassification of alcohol quantity and lack of accuracy in reporting prevalent
morbid conditions at baseline in the group of never drinkers (27). This reasoning motivated
our choice of considering moderate alcohol drinkers, as the reference category throughout this
work. Moreover, residual and unmeasured confounding are plausible drivers of the
association (28). These suggestions are supported by our findings that never drinkers are at
increased risk of death due to violence and injury. This implausible association casts
considerable doubt on the veracity of the apparent increased risk of death among never
drinkers.
The overall mortality hazard ratio for men with extreme versus moderate alcohol use was
greater at earlier ages, and approached unity as age advances towards 90 years. This result
reflects the comparatively low incidence of death through middle age. Consideration of the
Page 17 of 38
For peer review only - http://bmjopen.bmj.com/site/about/guidelines.xhtml
BMJ Open
123456789101112131415161718192021222324252627282930313233343536373839404142434445464748495051525354555657585960
on March 11, 2020 by guest. P
rotected by copyright.http://bm
jopen.bmj.com
/B
MJ O
pen: first published as 10.1136/bmjopen-2014-005245 on 3 July 2014. D
ownloaded from

For peer review only
absolute risk of death, however, suggests that moderate drinkers have substantial cumulative
survival advantage over extreme drinkers throughout the adult lifespan. It has been suggested
that wine drinking could be more favourably associated than other alcoholic beverages to the
risk of CHD and some cancers (29-32). In this study beer use displayed more apparent risk
patterns than wine intake, particularly in men. Although we believe that this finding is
relevant, we call for cautious interpretations of these results, as the lifestyle profile of wine
and beer drinkers is profoundly different. The associations between alcohol and mortality
were heterogeneous across countries in men, but not in women. This could be due to the
larger amount of alcohol consumed in men than in women, naturally increasing the variability
of exposure and the statistical power to detect associations, and of the larger variability
characterizing drinking habits in men, such as binge drinking, drinking during meals and other
societal aspects. Although no heterogeneity was observed by smoking status, at all levels of
alcohol intake the mortality among smokers was higher than the mortality among non-
smokers, so the absolute increase in risk associated with alcohol intake is more extreme
among smokers. This differential increase in cumulative probability of death emphasises the
central role of tobacco as a risk factor for mortality, as well as the potential extra harm of
increased alcohol consumption.
In the EPIC study, although associations with alcohol were mostly apparent for ARC and
violent death and injuries, absolute risks were highest for CVD/CHD in men, while
CVD/CHD and ARC risks were of similar magnitude in women. In general, as individuals
reporting a prevalent condition at recruitment (either cancer, diabetes, heart attack or stroke)
were excluded from the analysis in an effort to minimize reverse causality, our estimates of
absolute risks of death are possibly underestimated. RAP values were estimated to appreciate
the risk benefit of alcohol drinkers if they were to modify their exposure, according to a
counterfactual scenario (21;33). Consistently in men and women, RAP values for overall
Page 18 of 38
For peer review only - http://bmjopen.bmj.com/site/about/guidelines.xhtml
BMJ Open
123456789101112131415161718192021222324252627282930313233343536373839404142434445464748495051525354555657585960
on March 11, 2020 by guest. P
rotected by copyright.http://bm
jopen.bmj.com
/B
MJ O
pen: first published as 10.1136/bmjopen-2014-005245 on 3 July 2014. D
ownloaded from

For peer review only
mortality were larger when the reference category was set to 0.1 to 15 g/day than when using
a threshold of 5 g/day, thus indicating that, based on the EPIC study, the benefit for drinkers
could be largest if they reduced their intake to levels below 15 g/day. These results are in line
with findings of a recent work in the UK population, where the reduction of overall mortality
was estimated to be optimized for alcohol reduction up to a median population level of 5
g/day (34).
In a large prospective study in Europe, lifetime alcohol intake was significantly associated
with both overall and ARC specific mortality. In men, positive associations were observed for
violent deaths and injuries, while CVD and CHD deaths were not associated with alcohol use
among drinkers. Our findings suggest that these associations do not differ between never and
current smokers, and were stronger for beer than for wine use.
Page 19 of 38
For peer review only - http://bmjopen.bmj.com/site/about/guidelines.xhtml
BMJ Open
123456789101112131415161718192021222324252627282930313233343536373839404142434445464748495051525354555657585960
on March 11, 2020 by guest. P
rotected by copyright.http://bm
jopen.bmj.com
/B
MJ O
pen: first published as 10.1136/bmjopen-2014-005245 on 3 July 2014. D
ownloaded from

For peer review only
Funding statement
This work was supported by la Direction Générale de la Santé (French Ministry of Health),
with contract (GR-IARC-2003-09-12-01), by the European Commission (Directorate General
for Health and Consumer Affairs) and the International Agency for Research on Cancer. The
national cohorts are supported by the Danish Cancer Society (Denmark); the Ligue Contre le
Cancer, the Institut Gustave Roussy, the Mutuelle Générale de l’Education Nationale, and the
Institut National de la Santé et de la Recherche Médicale (France); the Deutsche Krebshilfe,
the Deutsches Krebsforschungszentrum, and the Federal Ministry of Education and Research
(Germany); the Hellenic Health Foundation, the Stavros Niarchos Foundation, and the
Hellenic Ministry of Health and Social Solidarity (Greece); the Italian Association for
Research on Cancer and the National Research Council (Italy); the Dutch Ministry of Public
Health, Welfare and Sports, the Netherlands Cancer Registry, LK Research Funds, Dutch
Prevention Funds, the Dutch Zorg Onderzoek Nederland, the World Cancer Research Fund,
and Statistics Netherlands (Netherlands); European Research Council-2009-AdG 232997 and
the Nordforsk, Nordic Centre of Excellence program on Food, Nutrition and Health
(Norway); the Health Research Fund, Regional Governments of Andalucýa, Asturias, Basque
Country, Murcia (project 6236) and Navarra, Instituto de Salud Carlos III, Redes de
Investigacion Cooperativa (RD06/0020) (Spain); the Swedish Cancer Society, the Swedish
Scientific Council, and the Regional Government of Skåne (Sweden); Cancer Research UK,
the Medical Research Council, the Stroke Association, the British Heart Foundation, the
Department of Health, the Food Standards Agency, and the Wellcome Trust (United
Kingdom). The work undertaken by David C Muller was done during the tenure of an IARC,
Australia postdoctoral fellowship, supported by the Cancer Council Australia.
Contributorship statement
Pietro FERRARI, Idlir LICAJ, Isabelle ROMIEU, Paul BRENNAN, Heiner BOEING
conceptualized the study and defined the analytical strategy. Pietro FERRARI and Idlir
LICAJ had full access to all the data in the study and take responsibility for the integrity of
the data and the accuracy of the data analysis. Pietro FERRARI, Idlir LICAJ, David C
MULLER, Per Kragh ANDERSEN, Luciana NUNES performed statistical analyses and
provided preliminary interpretation of findings. Pietro FERRARI, David C MULLER,
Mattias JOHANSSON, Idlir LICAJ, Paul BRENNAN contributed to draft the manuscript.
Elisabete WEIDERPASS, Laure DOSSUS, Laureen DARTOIS, Guy FAGHERAZZI,
Page 20 of 38
For peer review only - http://bmjopen.bmj.com/site/about/guidelines.xhtml
BMJ Open
123456789101112131415161718192021222324252627282930313233343536373839404142434445464748495051525354555657585960
on March 11, 2020 by guest. P
rotected by copyright.http://bm
jopen.bmj.com
/B
MJ O
pen: first published as 10.1136/bmjopen-2014-005245 on 3 July 2014. D
ownloaded from

For peer review only
Kathryn Erica BRADBURY, Kay-Tee KHAW, Eric Jeffrey DUELL, Aurelio
BARRICARTE, Esther MOLINA-MONTES, Carmen NAVARRO SANCHEZ, Larraitz
ARRIOLA, Peter WALLSTRÖM, Anne TJØNNELAND, Anja OLSEN, Antonia
TRICHOPOULOU, Vasiliki BENETOU, Dimitrios TRICHOPOULOS, Rosario TUMINO,
Claudia AGNOLI, Carlotta SACERDOTE, Domenico PALLI, Kuanrong LI, Rudolf KAAKS,
Petra PEETERS, Joline Wilhelma Johanna BEULENE, Marc GUNTER, Teresa NORAT,
Kim OVERVAD, Paul BRENNAN, Elio RIBOLI, Isabelle ROMIEU critically revised the
manuscript and provided relevant intellectual input.
Competing Interest Declaration
All authors have completed the Unified Competing Interest form at
www.icmje.org/coi_disclosure.pdf (available on request from the corresponding author). Dr.
Kathryn E BRADBURY reports grants from Cancer Research UK, during the conduct of the
study. The rest of the authors declared no support from any organisation for the submitted
work, no financial relationships with any organisations that might have an interest in the
submitted work in the previous three years, no other relationships or activities that could
appear to have influenced the submitted work.
Sharing statement
Statistical code is available from the corresponding author by emailing [email protected].
Page 21 of 38
For peer review only - http://bmjopen.bmj.com/site/about/guidelines.xhtml
BMJ Open
123456789101112131415161718192021222324252627282930313233343536373839404142434445464748495051525354555657585960
on March 11, 2020 by guest. P
rotected by copyright.http://bm
jopen.bmj.com
/B
MJ O
pen: first published as 10.1136/bmjopen-2014-005245 on 3 July 2014. D
ownloaded from

For peer review only
Reference List
(1) Thun MJ, Peto R, Lopez AD, Monaco JH, Henley SJ, Heath CW, Jr., et al. Alcohol consumption and mortality among middle-aged and elderly U.S. adults. N Engl J Med 1997 Dec 11;337(24):1705-14.
(2) Bagnardi V, Blangiardo M, La Vecchia C., Corrao G. A meta-analysis of alcohol drinking and cancer risk. Br J Cancer 2001 Nov 30;85(11):1700-5.
(3) Rehm J, Baliunas D, Borges GL, Graham K, Irving H, Kehoe T, et al. The relation between different dimensions of alcohol consumption and burden of disease: an overview. Addiction 2010 May;105(5):817-43.
(4) Corrao G, Bagnardi V, Zambon A, La VC. A meta-analysis of alcohol consumption and the risk of 15 diseases. Prev Med 2004 May;38(5):613-9.
(5) Ronksley PE, Brien SE, Turner BJ, Mukamal KJ, Ghali WA. Association of alcohol consumption with selected cardiovascular disease outcomes: a systematic review and meta-analysis. BMJ 2011;342:d671.
(6) IARC. Alcohol consumption and ethyl carbamate. 96 ed. IARC; 2010.
(7) WCRF/AICR. Food, nutrition, physical activity and the prevention of cancer: a global perspective. Washington DC: AICR; 2007.
(8) Rehm J, Mathers C, Popova S, Thavorncharoensap M, Teerawattananon Y, Patra J. Global burden of disease and injury and economic cost attributable to alcohol use and alcohol-use disorders. Lancet 2009 Jun 27;373(9682):2223-33.
(9) Lim SS, Vos T, Flaxman AD, Danaei G, Shibuya K, Adair-Rohani H, et al. A comparative risk assessment of burden of disease and injury attributable to 67 risk factors and risk factor clusters in 21 regions, 1990-2010: a systematic analysis for the Global Burden of Disease Study 2010. Lancet 2012 Dec 15;380(9859):2224-60.
(10) Bergmann MM, Rehm J, Klipstein-Grobusch K, Boeing H, Schutze M, Drogan D, et al. The association of pattern of lifetime alcohol use and cause of death in the European Prospective Investigation into Cancer and Nutrition (EPIC) study. Int J Epidemiol 2013 Dec;42(6):1772-90.
(11) Riboli E, Hunt KJ, Slimani N, Ferrari P, Norat T, Fahey M, et al. European Prospective Investigation into Cancer and Nutrition (EPIC): study populations and data collection. Public Health Nutr 2002 Dec;5(6B):1113-24.
(12) Ferrari P, Jenab M, Norat T, Moskal A, Slimani N, Olsen A, et al. Lifetime and baseline alcohol intake and risk of colon and rectal cancers in the European prospective investigation into cancer and nutrition (EPIC). Int J Cancer 2007 Nov 1;121(9):2065-72.
(13) Ferrari P, Day NE, Boshuizen HC, Roddam A, Hoffmann K, Thiebaut A, et al. The evaluation of the diet/disease relation in the EPIC study: considerations for the calibration and the disease models. Int J Epidemiol 2008 Apr;37(2):368-78.
Page 22 of 38
For peer review only - http://bmjopen.bmj.com/site/about/guidelines.xhtml
BMJ Open
123456789101112131415161718192021222324252627282930313233343536373839404142434445464748495051525354555657585960
on March 11, 2020 by guest. P
rotected by copyright.http://bm
jopen.bmj.com
/B
MJ O
pen: first published as 10.1136/bmjopen-2014-005245 on 3 July 2014. D
ownloaded from

For peer review only
(14) Royston P, Parmar MK. The use of restricted mean survival time to estimate the treatment effect in randomized clinical trials when the proportional hazards assumption is in doubt. Stat Med 2011 Aug 30;30(19):2409-21.
(15) Heinzl H, Kaider A. Gaining more flexibility in Cox proportional hazards regression models with cubic spline functions. Comput Methods Programs Biomed 1997 Nov;54(3):201-8.
(16) Sauerbrei W, Royston P. Building multivariable prognostic and diagnostic models: Transformation of the predictors by using fractional polynomials. Journal ofthe Royal Statistical Society, Series A 1999;62:71-94.
(17) Royston P, Ambler G, Sauerbrei W. The use of fractional polynomials to model continuous risk variables in epidemiology. Int J Epidemiol 1999 Oct;28(5):964-74.
(18) Andersen PK, Geskus RB, de WT, Putter H. Competing risks in epidemiology: possibilities and pitfalls. Int J Epidemiol 2012 Jun;41(3):861-70.
(19) Putter H, Fiocco M, Geskus RB. Tutorial in biostatistics: competing risks and multi-state models. Stat Med 2007 May 20;26(11):2389-430.
(20) Rosthoj S, Andersen PK, Abildstrom SZ. SAS macros for estimation of the cumulative incidence functions based on a Cox regression model for competing risks survival data. Comput Methods Programs Biomed 2004 Apr;74(1):69-75.
(21) Brenner H, Gefeller O, Greenland S. Risk and rate advancement periods as measures of exposure impact on the occurrence of chronic diseases. Epidemiology 1993 May;4(3):229-36.
(22) SAS Institute Inc. 2002. NC, USA, Cary.
(23) Stata Statistical Software: Release 12. Version StataCorp. College Station, TX: StataCorp LP.: 2011.
(24) Zaridze D, Lewington S, Boroda A, Scelo G, Karpov R, Lazarev A, et al. Alcohol and mortality in Russia: prospective observational study of 151 000 adults. Lancet 2014 Jan 30;(13):10-6736.
(25) Thun MJ, Peto R, Lopez AD, Monaco JH, Henley SJ, Heath CW, Jr., et al. Alcohol consumption and mortality among middle-aged and elderly U.S. adults. N Engl J Med 1997 Dec 11;337(24):1705-14.
(26) Lin Y, Kikuchi S, Tamakoshi A, Wakai K, Kawamura T, Iso H, et al. Alcohol consumption and mortality among middle-aged and elderly Japanese men and women. Ann Epidemiol 2005 Sep;15(8):590-7.
(27) Fillmore KM, Stockwell T, Chikritzhs T, Bostrom A, Kerr W. Moderate alcohol use and reduced mortality risk: systematic error in prospective studies and new hypotheses. Ann Epidemiol 2007 May;17(5 Suppl):S16-S23.
Page 23 of 38
For peer review only - http://bmjopen.bmj.com/site/about/guidelines.xhtml
BMJ Open
123456789101112131415161718192021222324252627282930313233343536373839404142434445464748495051525354555657585960
on March 11, 2020 by guest. P
rotected by copyright.http://bm
jopen.bmj.com
/B
MJ O
pen: first published as 10.1136/bmjopen-2014-005245 on 3 July 2014. D
ownloaded from

For peer review only
(28) Naimi TS, Brown DW, Brewer RD, Giles WH, Mensah G, Serdula MK, et al. Cardiovascular risk factors and confounders among nondrinking and moderate-drinking U.S. adults. Am J Prev Med 2005 May;28(4):369-73.
(29) Klatsky AL, Friedman GD, Armstrong MA, Kipp H. Wine, liquor, beer, and mortality. Am J Epidemiol 2003 Sep 15;158(6):585-95.
(30) Maskarinec G, Meng L, Kolonel LN. Alcohol intake, body weight, and mortality in a multiethnic prospective cohort. Epidemiology 1998 Nov;9(6):654-61.
(31) Gronbaek M, Becker U, Johansen D, Gottschau A, Schnohr P, Hein HO, et al. Type of alcohol consumed and mortality from all causes, coronary heart disease, and cancer. Ann Intern Med 2000 Sep;19;133(6):411-9.
(32) Renaud SC, Gueguen R, Siest G, Salamon R. Wine, beer, and mortality in middle-aged men from eastern France. Arch Intern Med 1999 Sep 13;159(16):1865-70.
(33) Gellert C, Schottker B, Holleczek B, Stegmaier C, Muller H, Brenner H. Using rate advancement periods for communicating the benefits of quitting smoking to older smokers. Tob Control 2013 Jul;22(4):227-30.
(34) Nichols M, Scarborough P, Allender S, Rayner M. What is the optimal level of population alcohol consumption for chronic disease prevention in England? Modelling the impact of changes in average consumption levels. BMJ Open 2012 May 30;2(3):e000957.
Page 24 of 38
For peer review only - http://bmjopen.bmj.com/site/about/guidelines.xhtml
BMJ Open
123456789101112131415161718192021222324252627282930313233343536373839404142434445464748495051525354555657585960
on March 11, 2020 by guest. P
rotected by copyright.http://bm
jopen.bmj.com
/B
MJ O
pen: first published as 10.1136/bmjopen-2014-005245 on 3 July 2014. D
ownloaded from

For peer review only
Table 1. Country and sex-specific number of participants (N), person-years (PY), cause-specific and overall number of deaths.
Cancers
Country N PY CHD1 CVD2 Breast UADT3 Liver Colon-rectum Total4 Other
cancers5 Violent
& Injuries6 Resp7 Other causes8 Total
Women
France 65,127 971,127 45 202 62 8 4 27 101 678 115 73 1,619 2,833
Italy 24,956 306,244 26 87 71 6 12 53 142 293 30 12 120 710
Spain 23,616 323,027 41 50 51 6 9 47 113 243 46 9 119 621
UK 50,251 651,640 387 320 160 30 15 127 332 716 85 161 1,091 3,092
Netherlands 14,583 189,531 110 137 58 14 7 78 157 370 20 65 209 1,068
Greece 14,391 143,150 139 100 41 2 10 18 71 146 26 27 94 603
Germany 27,098 307,380 56 74 64 12 14 44 134 256 35 25 114 694
Denmark 27,773 328,375 84 143 128 23 17 110 278 648 51 116 548 1,868
All 247,795 3,220,474 888 1,113 635 101 88 504 1,328 3,335 408 488 3,848 11,489
Men
France - - - - - - - - - - - - - -
Italy 13,471 168,992 53 59 - 8 10 39 57 240 35 13 131 588
Spain 14,089 189,942 136 88 - 34 14 62 110 351 81 42 151 959
UK 20,452 262,720 438 229 - 41 11 68 120 567 88 171 1,040 2,653
Netherlands - - - - - - - - - - - - - -
Greece 9,726 90,989 193 141 - 12 20 31 63 279 49 54 99 878
Germany 19,743 221,724 167 138 - 37 25 65 127 437 84 35 264 1,253
Denmark 24,454 282,622 273 271 - 91 31 126 248 838 111 95 794 2,633
All 101,935 1,216,988 1,260 926 - 223 111 391 725 2,712 448 410 2,479 8,964
1CHD: Coronary heart disease [I20-I25] deaths; 2CVD: Cardiovascular disease [I00-I99 except I20-I25] deaths; 3UADT: deaths from upper aero-
digestive cancers (including cancer of the mouth [C01 to C10 without C08=salivary gland]), larynx [C21], pharynx [C11 to C14], oesophagus [C15]); 4Total frequency of alcohol related cancers; 5Other cancers: deaths from all other cancers; 6Violent deaths and injuries, including injury, poisoning and
certain other consequences of external causes [S00-T98], and external causes of morbidity and mortality [V01-Y98]; 7Resp=respiratory diseases [J00-
J99].
Page 25 of 38
For peer review only - http://bmjopen.bmj.com/site/about/guidelines.xhtml
BMJ Open
123456789101112131415161718192021222324252627282930313233343536373839404142434445464748495051525354555657585960
on March 11, 2020 by guest. Protected by copyright. http://bmjopen.bmj.com/ BMJ Open: first published as 10.1136/bmjopen-2014-005245 on 3 July 2014. Downloaded from

For peer review only
Table 2. Characteristics of the study population at recruitment, according to amount and type of alcohol intake (g/day) in the EPIC study1.
Lifetime drinkers
Characteristics Unit Never
drinkers 0.1-4.9 5-14.9 15-29.9 30-59.92 >602 Total3 Wine
consumers4 Beer
consumers4
Women
Number of participants n 25,146 112,281 77,147 27,179 6,042 - 247,795 85,965 8,748
Person-Years - 330,854 1,460,315 998,547 352,220 78,538 - 3,220,474 1,124,546 110,761
Age at recruitment Years 52 (9) 52 (10) 51 (10) 49 (11) 47 (11) - 51 (38-63) 52 (9) 46 (12)
Lifetime alcohol intake g/day 0 (-) 2 (2) 9 (3) 20 (4) 43 (21) - 7 (0-17) 12 (9) 11 (9)
Educational attainment5 % 14 22 27 33 37 - 25 28 28
Current smokers % 13 14 18 24 31 - 17 17 28
Body mass index kg/m2 27 (5) 25 (5) 25 (4) 24 (4) 24 (4) - 25 (20-31) 24 (4) 25 (4)
Height cm 158 (6) 161 (6) 162 (6) 163 (7) 164 (6) - 162 (153-170) 162 (6) 163 (7)
(Moderately) Active % 26 39 44 44 43 - 40 42 42
Ever use of HRT6 % 16 25 29 28 25 - 25 50 34
Post-menopausal status7 % 50 49 49 44 38 - 48 29 20
Energy intake kcal/day 1,848 (537) 1,943 (537) 2,015 (536) 2,090 (552) 2,195 (602) - 1978 (542) 2,046 (544) 1,976 (545)
Men
Number of participants n 1,600 14,287 28,875 28,049 20,788 8,336 101,935 26,137 22,136
Person-Years - 19,114 171,739 345,899 333,784 247,612 98,841 1,216,989 317,937 259,934
Age at recruitment Years 53 (11) 53 (11) 53 (9) 52 (9) 52 (9) 52 (9) 53 (41-64) 53 (9) 52 (10)
Lifetime alcohol intake g/day 0 (-) 2 (2) 10 (3) 22 (4) 42 (8) 94 (45) 25 (3-45) 30 (27) 22 (25)
Educational attainment5 % 21 30 31 32 26 14 29 22 27
Current smokers % 28 22 25 30 36 49 30 31 33
Body mass index kg/m2 27 (4) 26 (4) 26 (3) 27 (3) 27 (4) 28 (4) 27 (22-31) 27 (4) 27 (4)
Height cm 171 (7) 174 (7) 175 (7) 175 (7) 174 (7) 172 (7) 174 (165-183) 172 (7) 175 (7)
(Moderately) Active % 42 46 50 52 52 50 50 48 52
Energy intake kcal/day 2,284 (675) 2,267 (650) 2,315 (618) 2,417 (622) 2,569 (646) 2,789 (716) 2,427 (656) 2,487 (652) 2,369 (651)
1Means ± SDs are presented for continuous variables, frequencies for categorical variables; 2In women the last alcohol category is ≥30g/day; 3For continuous variables (with exception of energy intake), mean (10th-90th percentile) values are reported; 4Study subjects consuming more than 10 g/day of wine (or beer), and consuming less than 3 g/day of beer (or wine); 5Subjects with a university degree or more; 6HRT=hormonal replacement therapy; 7Post-menopausal women plus women who underwent an ovariectomy.
Page 26 of 38
For peer review only - http://bmjopen.bmj.com/site/about/guidelines.xhtml
BMJ Open
123456789101112131415161718192021222324252627282930313233343536373839404142434445464748495051525354555657585960
on March 11, 2020 by guest. Protected by copyright. http://bmjopen.bmj.com/ BMJ Open: first published as 10.1136/bmjopen-2014-005245 on 3 July 2014. Downloaded from
For peer review only
Figure 1. Number of deaths, person-years (PY) and multivariable hazard ratios1 (HR) with 95% confidence intervals (CI) and p-value of the Wald test for statistical significance for overall and cause-specific mortality by categories of lifetime alcohol use, in women and men.
(Women) (Men)
1Models were stratified by center. Systematic adjustment was undertaken for age at recruitment, BMI and height, former drinking, time since alcohol quitting, smoking status, duration of smoking, age at start smoking, educational attainment, and energy intake. In women adjustment was undertaken for menopausal status, ever use of replacement hormones, and number of full term pregnancies.
Page 27 of 38
For peer review only - http://bmjopen.bmj.com/site/about/guidelines.xhtml
BMJ Open
123456789101112131415161718192021222324252627282930313233343536373839404142434445464748495051525354555657585960
on March 11, 2020 by guest. Protected by copyright. http://bmjopen.bmj.com/ BMJ Open: first published as 10.1136/bmjopen-2014-005245 on 3 July 2014. Downloaded from

For peer review only
Table 3. Sex-specific number of deaths, hazard ratios (HR)1 and 95%CI for overall mortality by categories of lifetime alcohol use (g/day), by smoking status (never
and current smokers), and type of alcoholic beverage.
Women Men
Never smokers Current smokers Never smokers Current smokers
deaths HR2 (95% CI) deaths HR2 (95% CI) pheterog3 deaths HR2 (95% CI) deaths HR2 (95% CI) pheterog
3
Overall Overall Never 1,009 1.34 (1.24, 1.45) 154 1.72 (1.32, 2.23) Never 84 1.50 (1.19, 1.21) 58 2.09 (1.26, 3.47)
0.1-4.9 3,046 1 Ref 1,021 1.53 (1.23, 1.90) 0.1-4.9 457 1 Ref 367 1.62 (1.04, 2.53) 5-14.9 1,550 1.04 (0.98, 1.11) 874 1.51 (1.21, 1.88) 5-14.9 538 0.93 (0.82, 1.06) 799 1.45 (0.93, 2.25) 15-29.9 397 1.04 (0.94, 1.16) 435 1.74 (1.38, 2.19) 15-29.9 369 1.00 (0.87, 1.16) 927 1.66 (1.06, 2.58) ≥ 30 82 1.29 (1.03, 1.61) 140 2.08 (1.59, 2.73) 30-59.9 254 1.22 (1.23, 1.43) 857 1.83 (1.17, 2.84) pWald
4 <0.001 <0.001 0.150 ≥ 60 107 1.56 (1.25, 1.95) 590 2.43 (1.55, 3.80)
pWald4 <0.001 <0.001 0.864
Wine use Beer use Wine use Beer use
deaths HR5 (95% CI) deaths HR5 (95% CI) pdifference6 deaths HR5 (95% CI) deaths HR5 (95% CI) pdifference
6
Overall Overall Never 2,156 1.15 (1.09, 1.22) 5,041 1.06 (1.02, 1.12) Never 1,064 1.21 (1.12, 1.30) 975 1.07 (0.98, 1.16) 0.1-2.9 5,109 1 Ref 5,477 1 Ref 0.1-2.9 3,266 1 Ref 2,959 1 Ref 3-9.9 2,813 0.96 (0.92, 1.01) 787 1.15 (1.07, 1.24) 3-9.9 2,139 0.92 (0.87, 0.97) 2,486 1.04 (0.98, 1.10) 10-19.9 1,057 1.00 (0.93, 1.07) 147 1.50 (1.27, 1.77) 10-19.9 1,040 0.96 (0.89, 1.03) 1,248 1.12 (1.04, 1.20) ≥ 20 354 1.14 (1.02, 1.27) 37 1.47 (1.06, 2.04) 20-39.9 814 1.03 (0.95, 1.13) 877 1.41 (1.30, 1.54) pWald
4 <0.001 <0.001 <0.001 ≥ 40 641 1.22 (1.10, 1.35) 419 1.86 (1.66, 2.09) pWald
4 <0.001 <0.001 <0.001
1Models were stratified by center. Systematic adjustment was undertaken for age at recruitment, BMI and height, former drinking, time since alcohol
quitting, smoking status, duration of smoking, age at start smoking, educational attainment, and energy intake. In women adjustment was undertaken
for menopausal status, ever use of replacement hormones, and number of full term pregnancies; 2Models included interaction terms between lifetime
alcohol use and a smoking indicator (0=never smokers; 1=current smokers), whereas former smokers and subjects with unknown smoking status were
excluded; 3pheterogeneity: difference in HRs assessed comparing the log-likelihood of models with and without interaction terms between alcohol and
smoking status to a 4 and 5 degrees of freedom (dof) chi-square distribution, in women and men respectively; 4pWald: determined using a Wald test for
contrasts according to a chi-square distribution with 4 and 5 dof, in women and men respectively; 5Models on wine and beer uses were mutually
adjusted, and also included spirits/liquors use; 6pdifference expresses the difference of associations between wine and beer use, determined evaluating the
significance of the parameter estimate γ2 in a model that included, other than the list of confounders, the terms γ1·(X1+X2)/2 + γ2·(X1-X2)/2, with
X1=log(wine use+1) and X2=log(beer use+1).
Page 28 of 38
For peer review only - http://bmjopen.bmj.com/site/about/guidelines.xhtml
BMJ Open
123456789101112131415161718192021222324252627282930313233343536373839404142434445464748495051525354555657585960
on March 11, 2020 by guest. Protected by copyright. http://bmjopen.bmj.com/ BMJ Open: first published as 10.1136/bmjopen-2014-005245 on 3 July 2014. Downloaded from

For peer review only
Figure 2. Sex-specific plots displaying cumulative probabilities of death due to overall mortality, for heavy
(≥30 g/day in women and ≥60 g/day in men, continuous line) and moderate lifetime use (0.1-4.9 g/day) (dotted
line), in smokers (black line) and never smokers (grey line), for study subjects aged 60 years.
Women
Men
Heavy drinker, smoker
Light drinker, never smoker
Heavy drinker, never smoker
Light drinker, smoker
Heavy drinker, smoker
Light drinker, never smoker
Heavy drinker, never smoker
Light drinker, smoker
Page 29 of 38
For peer review only - http://bmjopen.bmj.com/site/about/guidelines.xhtml
BMJ Open
123456789101112131415161718192021222324252627282930313233343536373839404142434445464748495051525354555657585960
on March 11, 2020 by guest. P
rotected by copyright.http://bm
jopen.bmj.com
/B
MJ O
pen: first published as 10.1136/bmjopen-2014-005245 on 3 July 2014. D
ownloaded from

For peer review only
Figure 3. In competing risks analyses, sex-specific plots displaying cumulative probabilities of death due to
CVD/CHD (red), alcohol related cancers (blue), and violent death and injuries (green), for study subjects aged
60 years according to heavy (≥30 g/day in women and ≥60 g/day in men, continuous line) and moderate (0.1-
4.9 g/day, dotted lines) lifetime alcohol use in current and never smokers in the EPIC study.
Women
Smokers Never smoker Men Smokers Never smoker
Page 30 of 38
For peer review only - http://bmjopen.bmj.com/site/about/guidelines.xhtml
BMJ Open
123456789101112131415161718192021222324252627282930313233343536373839404142434445464748495051525354555657585960
on March 11, 2020 by guest. P
rotected by copyright.http://bm
jopen.bmj.com
/B
MJ O
pen: first published as 10.1136/bmjopen-2014-005245 on 3 July 2014. D
ownloaded from

For peer review only
Table 4. Sex-specific estimates of rate advancement period (RAP) and associated 95%CI for overall and
mortality due to ARCs, CVD/CHD and injuries and violent deaths, related to two scenarios of lifetime
alcohol use. RAP estimates express the impact of a given exposure on the risk of death, by determining the
time (in years) by which the risk of death is anticipated for study subjects exposed, e.g. all drinkers more
than the threshold (5 or 15 g/day in Scenario I and II, respectively), compared to non-exposed, i.e.
individuals drinking between 0.1 g/day and the threshold.
Scenario I Scenario II
Threshold: 5 g/day Threshold: 15 g/day
RAP (years)
95%CI RAP (years)
95%CI
Women Overall 0.36 -0.05, 0.76 0.83 0.26, 1.39
CVD/CHD 0.23 -0.46, 0.92 0.08 -0.96, 1.14 Alcohol related cancers 1.28 -0.86, 3.41 1.90 -1.00, 4.81 Injuries and violent deaths -2.69 -6.85, 1.47 -0.20 -5.85, 5.46
Men Overall 0.15 -0.48, 0.76 1.42 0.96, 1.89
CVD/CHD -0.53 -1.57, 0.50 -0.01 -0.82, 0.81 Alcohol related cancers 2.59 -0.30, 5.49 5.03 3.07, 7.00 Injuries and violent deaths 7.59 -2.82, 18.02 11.83 3.92, 18.17
1Never lifetime alcohol users did not enter into the estimation process.
Page 31 of 38
For peer review only - http://bmjopen.bmj.com/site/about/guidelines.xhtml
BMJ Open
123456789101112131415161718192021222324252627282930313233343536373839404142434445464748495051525354555657585960
on March 11, 2020 by guest. P
rotected by copyright.http://bm
jopen.bmj.com
/B
MJ O
pen: first published as 10.1136/bmjopen-2014-005245 on 3 July 2014. D
ownloaded from
For peer review only
Supplementary figure 1. Number of deaths, person-years (PY) and multivariable hazard ratios1 (HR) with 95% confidence intervals (CI) and p-
value of the Wald test for statistical significance for overall and cause-specific mortality by categories of lifetime alcohol use, in women and
men.
(Women) (Men)
1Models were stratified by center. Systematic adjustment was undertaken for age at recruitment, BMI and height, former drinking, time since alcohol quitting, smoking status,
duration of smoking, age at start smoking, educational attainment, and energy intake. In women adjustment was undertaken for menopausal status, ever use of replacement
hormones, and number of full term pregnancies.
Page 32 of 38
For peer review only - http://bmjopen.bmj.com/site/about/guidelines.xhtml
BMJ Open
123456789101112131415161718192021222324252627282930313233343536373839404142434445464748495051525354555657585960
on March 11, 2020 by guest. Protected by copyright. http://bmjopen.bmj.com/ BMJ Open: first published as 10.1136/bmjopen-2014-005245 on 3 July 2014. Downloaded from

For peer review only
Supplementary figure 2. Relationship between lifetime alcohol use (g/day) and overall and cause specific risk of death (and associated 95% CI)
obtained by using fractional polynomials of order two. P-linearity was obtained by comparing the log-likelihood difference of models with
fractional polynomials and a linear term to a chi-square distribution with 3 degrees of freedom. Women.
Page 33 of 38
For peer review only - http://bmjopen.bmj.com/site/about/guidelines.xhtml
BMJ Open
123456789101112131415161718192021222324252627282930313233343536373839404142434445464748495051525354555657585960
on March 11, 2020 by guest. Protected by copyright. http://bmjopen.bmj.com/ BMJ Open: first published as 10.1136/bmjopen-2014-005245 on 3 July 2014. Downloaded from

For peer review only
Supplementary figure 3. Relationship between lifetime alcohol use (g/day) and overall and cause specific risk of death (and associated 95% CI)
obtained by using fractional polynomials of order two. P-linearity was obtained by comparing the log-likelihood difference of models with
fractional polynomials and a linear term to a chi-square distribution with 3 degrees of freedom. Men.
Page 34 of 38
For peer review only - http://bmjopen.bmj.com/site/about/guidelines.xhtml
BMJ Open
123456789101112131415161718192021222324252627282930313233343536373839404142434445464748495051525354555657585960
on March 11, 2020 by guest. Protected by copyright. http://bmjopen.bmj.com/ BMJ Open: first published as 10.1136/bmjopen-2014-005245 on 3 July 2014. Downloaded from

For peer review only
Supplementary figure 4. Associations between average alcohol use (g/day) and overall mortality (and associated
95% CI) by country of origin. Pheterogeneity was equal to 0.511, and was obtained by comparing the log-likelihood
difference of models with and without interaction terms to a chi-square statistics with 32 degrees of freedom (dof).
For each country, pWald was obtained comparing the Wald test statistics to a chi-square distribution with 4 dof.
Country-specific geometric means for total and subtypes of alcohol use (W=wine, B=beer, Sp=spirits/liquors in
g/day) are also displayed. Women.
Page 35 of 38
For peer review only - http://bmjopen.bmj.com/site/about/guidelines.xhtml
BMJ Open
123456789101112131415161718192021222324252627282930313233343536373839404142434445464748495051525354555657585960
on March 11, 2020 by guest. P
rotected by copyright.http://bm
jopen.bmj.com
/B
MJ O
pen: first published as 10.1136/bmjopen-2014-005245 on 3 July 2014. D
ownloaded from
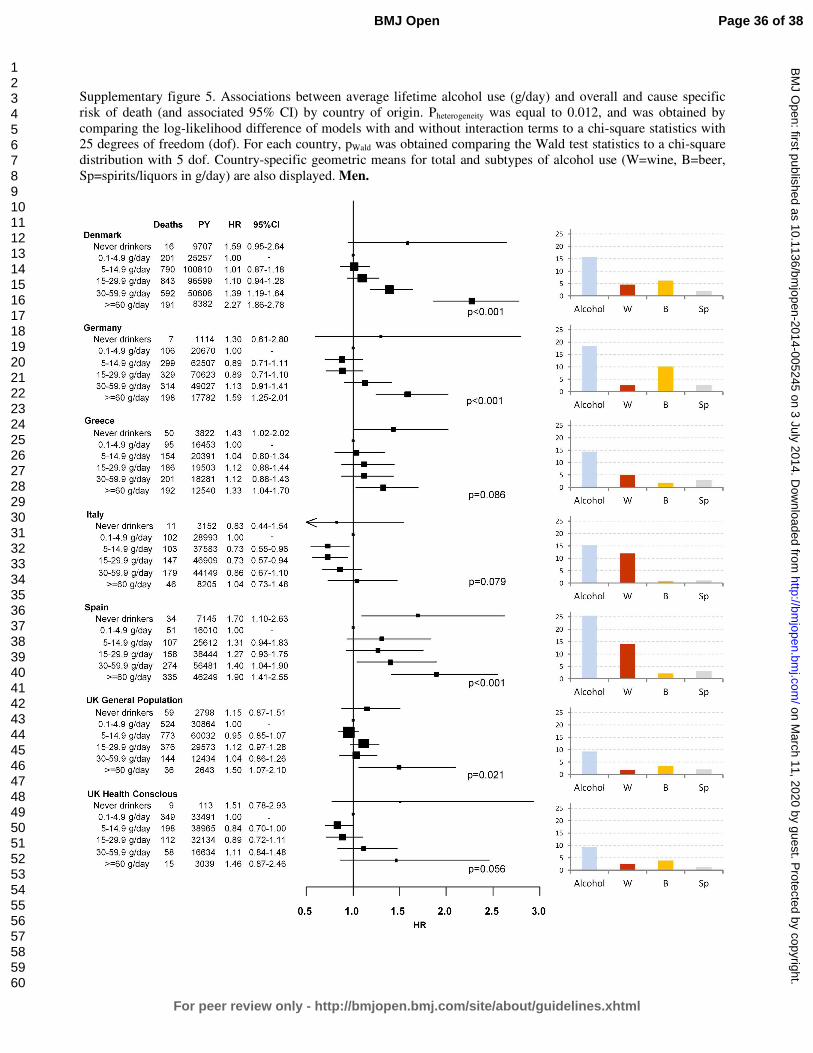
For peer review only
Supplementary figure 5. Associations between average lifetime alcohol use (g/day) and overall and cause specific
risk of death (and associated 95% CI) by country of origin. Pheterogeneity was equal to 0.012, and was obtained by
comparing the log-likelihood difference of models with and without interaction terms to a chi-square statistics with
25 degrees of freedom (dof). For each country, pWald was obtained comparing the Wald test statistics to a chi-square
distribution with 5 dof. Country-specific geometric means for total and subtypes of alcohol use (W=wine, B=beer,
Sp=spirits/liquors in g/day) are also displayed. Men.
Page 36 of 38
For peer review only - http://bmjopen.bmj.com/site/about/guidelines.xhtml
BMJ Open
123456789101112131415161718192021222324252627282930313233343536373839404142434445464748495051525354555657585960
on March 11, 2020 by guest. P
rotected by copyright.http://bm
jopen.bmj.com
/B
MJ O
pen: first published as 10.1136/bmjopen-2014-005245 on 3 July 2014. D
ownloaded from

For peer review only
Supplementary figure 6. HRs and survival differences for heavy versus moderate drinkers as a function of attained age (40 - 90 years). Solid lines
represent predictions from the model and shaded areas depict delta-method 95% CIs for the predictions. Estimates are derived from flexible
parametric survival models with age as the time-scale, with the origin of the time-scale set to 30 years. Interactions between alcohol intake and
the time-scale were fitted to allow for age-varying HR.
Page 37 of 38
For peer review only - http://bmjopen.bmj.com/site/about/guidelines.xhtml
BMJ Open
123456789101112131415161718192021222324252627282930313233343536373839404142434445464748495051525354555657585960
on March 11, 2020 by guest. Protected by copyright. http://bmjopen.bmj.com/ BMJ Open: first published as 10.1136/bmjopen-2014-005245 on 3 July 2014. Downloaded from

For peer review only
1
MS: “Lifetime alcohol use and overall and cause-specific mortality in the European
Prospective Investigation into Cancer and nutrition (EPIC) study” by Ferrari et al.
STROBE statement checklist
(Pages of the submitted manuscript where each point of the checklist is addressed are indicated)
Item
No Recommendation
Title and abstract 1 (a) Indicate the study’s design with a commonly used term in the title or the abstract
(Pages 1, 4)
(b) Provide in the abstract an informative and balanced summary of what was done
and what was found (Page 4)
Introduction
Background/rationale 2 Explain the scientific background and rationale for the investigation being reported
(Page 6)
Objectives 3 State specific objectives, including any prespecified hypotheses (Page 6)
Methods
Study design 4 Present key elements of study design early in the paper (Pages 7, 8)
Setting 5 Describe the setting, locations, and relevant dates, including periods of recruitment,
exposure, follow-up, and data collection (Pages 7, 8)
Participants 6 (a) Give the eligibility criteria, and the sources and methods of selection of
participants. Describe methods of follow-up (Pages 7, 8)
(b) For matched studies, give matching criteria and number of exposed and
unexposed (NA)
Variables 7 Clearly define all outcomes, exposures, predictors, potential confounders, and effect
modifiers. Give diagnostic criteria, if applicable (Pages 8,9)
Data sources/
measurement
8* For each variable of interest, give sources of data and details of methods of
assessment (measurement). Describe comparability of assessment methods if there is
more than one group (Pages 8, 9)
Bias 9 Describe any efforts to address potential sources of bias (Pages 10,11)
Study size 10 Explain how the study size was arrived at (Page 8)
Quantitative variables 11 Explain how quantitative variables were handled in the analyses. If applicable,
describe which groupings were chosen and why (Pages 8,9)
Statistical methods 12 (a) Describe all statistical methods, including those used to control for confounding
(Pages 8, 9, 10, 11)
(b) Describe any methods used to examine subgroups and interactions (Pages 10,11)
(c) Explain how missing data were addressed (Page 9)
(d) If applicable, explain how loss to follow-up was addressed (Page 9)
(e) Describe any sensitivity analyses (Page 10)
Results
Participants 13* (a) Report numbers of individuals at each stage of study—eg numbers potentially
eligible, examined for eligibility, confirmed eligible, included in the study,
completing follow-up, and analysed (Pages 7, 8, 12)
(b) Give reasons for non-participation at each stage (8. For the EPIC study, details
are included in Reference 11, Riboli et al, PHN, 2002)
(c) Consider use of a flow diagram NO FLOW DIAGRAM
Descriptive data 14* (a) Give characteristics of study participants (eg demographic, clinical, social) and
information on exposures and potential confounders (Pages 12, 13, Table 2)
(b) Indicate number of participants with missing data for each variable of interest
Page 38 of 38
For peer review only - http://bmjopen.bmj.com/site/about/guidelines.xhtml
BMJ Open
123456789101112131415161718192021222324252627282930313233343536373839404142434445464748495051525354555657585960
on March 11, 2020 by guest. P
rotected by copyright.http://bm
jopen.bmj.com
/B
MJ O
pen: first published as 10.1136/bmjopen-2014-005245 on 3 July 2014. D
ownloaded from

For peer review only
2
(Page 9)
(c) Summarise follow-up time (eg, average and total amount) (Page 12, Tables 1
and 2)
Outcome data 15* Report numbers of outcome events or summary measures over time (Page 12, Table
1)
Main results 16 (a) Give unadjusted estimates and, if applicable, confounder-adjusted estimates and
their precision (eg, 95% confidence interval). Make clear which confounders were
adjusted for and why they were included (Page 13)
(b) Report category boundaries when continuous variables were categorized (Pages
13, 14)
(c) If relevant, consider translating estimates of relative risk into absolute risk for a
meaningful time period (Pages 14, 15)
Other analyses 17 Report other analyses done—eg analyses of subgroups and interactions, and
sensitivity analyses (Pages 13, 14, 15)
Discussion
Key results 18 Summarise key results with reference to study objectives (Page 15)
Limitations 19 Discuss limitations of the study, taking into account sources of potential bias or
imprecision. Discuss both direction and magnitude of any potential bias (Page 16)
Interpretation 20 Give a cautious overall interpretation of results considering objectives, limitations,
multiplicity of analyses, results from similar studies, and other relevant evidence
(Pages 16, 17)
Generalisability 21 Discuss the generalisability (external validity) of the study results (Pages 17, 18)
Other information
Funding 22 Give the source of funding and the role of the funders for the present study and, if
applicable, for the original study on which the present article is based (Pages 19, 20)
*Give information separately for exposed and unexposed groups.
Note: An Explanation and Elaboration article discusses each checklist item and gives methodological background and
published examples of transparent reporting. The STROBE checklist is best used in conjunction with this article (freely
available on the Web sites of PLoS Medicine at http://www.plosmedicine.org/, Annals of Internal Medicine at
http://www.annals.org/, and Epidemiology at http://www.epidem.com/). Information on the STROBE Initiative is
available at http://www.strobe-statement.org.
Page 39 of 38
For peer review only - http://bmjopen.bmj.com/site/about/guidelines.xhtml
BMJ Open
123456789101112131415161718192021222324252627282930313233343536373839404142434445464748495051525354555657585960
on March 11, 2020 by guest. P
rotected by copyright.http://bm
jopen.bmj.com
/B
MJ O
pen: first published as 10.1136/bmjopen-2014-005245 on 3 July 2014. D
ownloaded from

For peer review only
Lifetime alcohol use and overall and cause-specific mortality in the European Prospective Investigation into Cancer and
nutrition (EPIC) study.
Journal: BMJ Open
Manuscript ID: bmjopen-2014-005245.R1
Article Type: Research
Date Submitted by the Author: 23-Apr-2014
Complete List of Authors: Ferrari, Pietro; International Agency for Research on Cancer, Nutrition and Metabolism Licaj, Idlir; International Agency for Research on Cancer,
Muller, David; International Agency for Research on Cancer, Kragh-Andersen, Per; University of Copenhagen, Department of Biostatistics Johansson, Mattias; International Agency for Research on Cancer, Boeing, Heiner; German Institute of Human Nutrition Potsdam-Rehbruecke, Weiderpass, Elisabete; University of Tromso, Department of Community Medicine, Faculty of Health Sciences Dossus, Laure; INSERM, Nutrition, Hormones and Women's Health, U1018 Dartois, Laureen; Inserm, Center for Research in Epidemiology and Population Health Fagherazzi, Guy; Inserm, U1018 Team 9 Bradbury, Kathryn; University of Oxford, Cancer Epidemiology Unit,
Nuffield Department of Population Health Khaw, Kay-Tee; University of Cambridge, Public Health and Primary Care Wareham, Nicholas; Institute of Metabolic Science, Addenbrooke’s Hospital, the Medical Research Council Epidemiology Unit Duell, Eric; Catalan Institute of Oncology (ICO-IDIBELL), Unit of Nutrition, Environment and Cancer Gurrea, Aurelio; Navarra Public Health Institute, MOLINA-MONTES, Esther; Andalusian School of Public Health, Navarro, Carmen; Murcia Regional Health Authority, Murcia, Arriola, Larraitz; ublic Health Department of Gipuzkoa, Basque government,
Wallström, Peter; Lund University, Clinical Sciences, Malmö Tjønneland, Anne; The Institute of cancer epidemiology, Danish Cancer society, Olsen, Anja; Danish Cancer Society, Institute of Cancer Epidemiology Trichopoulou, Antonia; Hellenic Health Foundation,, Benetou, Vasiliki; University of Athens, Medical School, clinical neurophysiology Trichopoulos, Dimitrios; Hellenic Health Foundation,, ; Harvard School of Public Health, Department of Epidemiology Tumino, Rosario; "Civic- M.P.Arezzo" Hospital, Cancer Registry and Histopathology Unit Agnoli, Claudia; Fondazione IRCCS Istituto Nazionale dei Tumori,
Sacerdote, Carlotta; CPO-Piemonte, ; HuGeF Foundation, Palli, Domenico; CSPO-Scientific Institute of Tuscany, Molecular and
For peer review only - http://bmjopen.bmj.com/site/about/guidelines.xhtml
BMJ Open on M
arch 11, 2020 by guest. Protected by copyright.
http://bmjopen.bm
j.com/
BM
J Open: first published as 10.1136/bm
jopen-2014-005245 on 3 July 2014. Dow
nloaded from

For peer review only
Nutritional Epidemiology Unit Li, Kuanrong; Division of Clinical Epidemiology, German Cancer Research Center, Kaaks, Rudolf; Deutsches Krebsforschungszentrum Peeters, Petra; University Medical Center Utrecht, Department of Epidemiology Beulens, Joline; University Medical Center Utrecht, Julius Center Nunes, Luciana; International Agency for Research on Cancer, Nutrition and Metabolism
Gunter, Marc; Imperial College, London, School of Public Health Norat, Teresa; Imperial College London Overvad, Kim; Aarhus University, Department of Public Health Brennan, Paul; International Agency for Research on Cancer, Riboli, Elio; Imperial College London, Department of Epidemiology and Biostatistics, School of Public Health Romieu, Isabelle; IARC,
<b>Primary Subject Heading</b>:
Epidemiology
Secondary Subject Heading: Public health
Keywords: NUTRITION & DIETETICS, Epidemiology < ONCOLOGY, CARDIOLOGY
Page 1 of 71
For peer review only - http://bmjopen.bmj.com/site/about/guidelines.xhtml
BMJ Open
123456789101112131415161718192021222324252627282930313233343536373839404142434445464748495051525354555657585960
on March 11, 2020 by guest. P
rotected by copyright.http://bm
jopen.bmj.com
/B
MJ O
pen: first published as 10.1136/bmjopen-2014-005245 on 3 July 2014. D
ownloaded from
For peer review only
Lifetime alcohol use and overall and cause-specific mortality in the European
Prospective Investigation into Cancer and nutrition (EPIC) study.
Pietro FERRARI1, Idlir LICAJ1, David C MULLER1, Per Kragh ANDERSEN2, Mattias
JOHANSSON1, Heiner BOEING3, Elisabete WEIDERPASS4,5,6,7, Laure DOSSUS8,9,10,
Laureen DARTOIS8,9,10, Guy FAGHERAZZI8,9,10, Kathryn E BRADBURY11, Kay-Tee
KHAW12, Nick WAREHAM13, Eric J DUELL14, Aurelio BARRICARTE15,16, Esther
MOLINA-MONTES17,18, Carmen NAVARRO SANCHEZ18,19,20, Larraitz ARRIOLA16,21,
Peter WALLSTRÖM22, Anne TJØNNELAND23, Anja OLSEN23, Antonia
TRICHOPOULOU24,25, Vasiliki BENETOU24, Dimitrios TRICHOPOULOS25,26,27, Rosario
TUMINO28, Claudia AGNOLI29, Carlotta SACERDOTE30,31, Domenico PALLI32, Kuanrong
LI33, Rudolf KAAKS33, Petra PEETERS34, Joline WJ BEULENS34, Luciana NUNES1,35,
Marc GUNTER36, Teresa NORAT36, Kim OVERVAD37,38, Paul BRENNAN1, Elio
RIBOLI36, Isabelle ROMIEU1.
Author Affiliations:
1International Agency for Research on Cancer, Lyon, France. 2Department of Biostatistics, University of Copenhagen, Copenhagen, Denmark. 3German Institute of Human Nutrition, Potsdam-Rehbrücke Department of Epidemiology,
Nuthetal, Germany. 4Department of Community Medicine, Faculty of Health Sciences, University of Tromso,
The Arctic University of Norway, Tromsø, Norway. 5Department of Research, Cancer Registry of Norway, Oslo, Norway. 6Department of Medical Epidemiology and Biostatistics, Karolinska Institutet, Stockholm,
Sweden. 7Samfundet Folkhälsan, Helsinki, Finland. 8Inserm, Centre for research in Epidemiology and Population Health (CESP), U1018,
Nutrition, Hormones and Women’s Health team, F-94805, Villejuif, France. 9Université Paris Sud, UMRS 1018, F-94805, Villejuif, France. 10IGR, F-94805, Villejuif, France. 11Cancer Epidemiology Unit, Nuffield Department of Population Health, University of
Oxford, UK.
Page 2 of 71
For peer review only - http://bmjopen.bmj.com/site/about/guidelines.xhtml
BMJ Open
123456789101112131415161718192021222324252627282930313233343536373839404142434445464748495051525354555657585960
on March 11, 2020 by guest. P
rotected by copyright.http://bm
jopen.bmj.com
/B
MJ O
pen: first published as 10.1136/bmjopen-2014-005245 on 3 July 2014. D
ownloaded from

For peer review only
12the Department of Public Health and Primary Care, University of Cambridge
Addenbrooke’s Hospital, Cambridge, United Kingdom. 13the Medical Research Council Epidemiology Unit, Institute of Metabolic Science,
Addenbrooke’s Hospital, Cambridge, United Kingdom; 14Unit of Nutrition, Environment and Cancer, Cancer Epidemiology Research Program
Bellvitge Biomedical Research Institute (IDIBELL), Catalan Institute of Oncology (ICO),
Barcelona, Spain. 15Navarre Public Health Institute, Pamplona, Spain. 16Consortium for Biomedical Research in Epidemiology and Public Health (CIBER
Epidemiología y Salud Pública-CIBERESP), Spain. 17Escuela Andaluza de Salud Pública. Instituto de Investigación Biosanitaria de Granada,
Granada, Spain. 18CIBER Epidemiología y Salud Pública (CIBERESP), Spain. 19Department of Epidemiology, Murcia Regional Health Council, Murcia, Spain. 20Department of Health and Social Sciences, Universidad de Murcia, Spain. 21Public Health Division of Gipuzkoa, Instituto BIO-Donostia, Basque Government. Spain. 22Nutrition Epidemiology Research Group, Department of Clinical Sciences, Lund University,
Malmö, Sweden. 23Danish Cancer Society Research Center, Copenhagen, Denmark. 24WHO Collaborating Center for Food and Nutrition Policies, Department of Hygiene,
Epidemiology and Medical Statistics, University of Athens Medical School, Athens, Greece. 25Hellenic Health Foundation, Athens, Greece. 26Department of Epidemiology, Harvard School of Public Health, Boston, MA, USA. 27Bureau of Epidemiologic Research, Academy of Athens, Athens, Greece. 28Cancer Registry and Histopathology Unit, "Civic- M.P.Arezzo" Hospital, ASP Ragusa,
Italy. 29Epidemiology and Prevention Unit, Fondazione IRCCS Istituto Nazionale dei Tumori,
Milan, Via Venezian, 1, 20133 Milan, Italy. 30Unit of Cancer Epidemiology, AO Citta' della Salute e della Scienza-University of Turin
and Center for Cancer Prevention (CPO-Piemonte), Via Santena 7, 10126 Turin, Italy. 31Human Genetics Foundation (HuGeF), Via Nizza 52, 10126 Turin, Italy. 32Molecular and Nutritional Epidemiology Unit, Cancer Research and Prevention Institute –
ISPO, Florence, Italy.
Page 3 of 71
For peer review only - http://bmjopen.bmj.com/site/about/guidelines.xhtml
BMJ Open
123456789101112131415161718192021222324252627282930313233343536373839404142434445464748495051525354555657585960
on March 11, 2020 by guest. P
rotected by copyright.http://bm
jopen.bmj.com
/B
MJ O
pen: first published as 10.1136/bmjopen-2014-005245 on 3 July 2014. D
ownloaded from
For peer review only
33the Department of Cancer Epidemiology, German Cancer Research Centre, Heidelberg,
Germany. 34Department of Epidemiology, Julius Center for Health Sciences and Primary Care,
University Medical Center, Utrecht, The Netherlands. 35Department of Statistics, Federal University of Rio Grande do Sul, Porto Alegre, Brazil. 36Department of Epidemiology & Biostatistics, School of Public Health, Imperial College
London, London, United Kingdom. 37Department of Public Health, Section for Epidemiology, Aarhus University, Aarhus,
Denmark. 38Department of Cardiology, Aalborg University Hospital, Aalborg, Denmark.
Corresponding Author:
Pietro Ferrari, PhD
Nutrition and Metabolism Section
International Agency for Research on Cancer
150, cours Albert Thomas, Lyon, France
Tel +33 472728031
Email: [email protected]
Abbreviations:
ARC: alcohol related cancers
CVD: cardiovascular diseases
CHD: coronary heart disease
HR: Hazard ratio
CI: Confidence Intervals
EPIC: European Prospective Investigation into Cancer and nutrition
Keywords: lifetime alcohol, smoking status, overall mortality.
Page 4 of 71
For peer review only - http://bmjopen.bmj.com/site/about/guidelines.xhtml
BMJ Open
123456789101112131415161718192021222324252627282930313233343536373839404142434445464748495051525354555657585960
on March 11, 2020 by guest. P
rotected by copyright.http://bm
jopen.bmj.com
/B
MJ O
pen: first published as 10.1136/bmjopen-2014-005245 on 3 July 2014. D
ownloaded from

For peer review only
Abstract (300 words)
Objectives. To investigate the role of factors that modulate the association between alcohol
and mortality, and to provide estimates of absolute risk of death.
Design. The European Prospective Investigation into Cancer and Nutrition (EPIC).
Setting. 23 centres in 10 countries.
Participants. 380,395 men and women, free of cancer, diabetes, heart attack or stroke at
enrolment, followed up for 12.6 years on average.
Main outcome measures. 20,453 fatal events, of which 2,053 alcohol related cancers (ARC,
including cancers of upper aero-digestive tract, liver, colorectal and female breast), 4,187
cardiovascular diseases (CVD/CHD), 856 violent deaths and injuries. Lifetime alcohol use
was assessed at recruitment.
Results. Hazard ratios comparing extreme drinkers (≥30 g/day in women and ≥60 g/day in
men) to moderate drinkers (0.1-4.9 g/day) were 1.27 (95%CI: 1.13,1.43) in women and 1.53
(1.39,1.68) in men. Strong associations were observed for ARC mortality, in men particularly,
and for violent deaths and injuries, in men only. No associations were observed for
CVD/CHD mortality among drinkers, whereby hazard ratios were higher in never compared
to moderate drinkers. Overall mortality seemed to be more strongly related to beer than wine
use, particularly in men. The 10-year risks of overall death for women aged 60 years, drinking
more than 30 g/day was 5% and 7%, for never and current smokers, respectively.
Corresponding figures in men consuming more than 60 g/day were 11% and 18%, in never
and current smokers respectively. In competing risks analyses, mortality due to CVD/CHD
was more pronounced than ARC in men, while CVD/CHD and ARC mortality were of similar
magnitude in women.
Conclusions. In this large European cohort, alcohol use was positively associated with overall
mortality, ARC and violent death and injuries, but marginally to CVD/CHD. Absolute risks of
death observed in EPIC suggest that alcohol is an important determinant of total mortality.
Page 5 of 71
For peer review only - http://bmjopen.bmj.com/site/about/guidelines.xhtml
BMJ Open
123456789101112131415161718192021222324252627282930313233343536373839404142434445464748495051525354555657585960
on March 11, 2020 by guest. P
rotected by copyright.http://bm
jopen.bmj.com
/B
MJ O
pen: first published as 10.1136/bmjopen-2014-005245 on 3 July 2014. D
ownloaded from

For peer review only
Article summary
Strengths and limitations of this study
• This study was based on information on dietary and lifestyle exposure collected in a
large prospective investigation of European adults.
• Findings are based on 380,395 men and women (among whom 20,453 fatal events
occurred) for which information on lifetime alcohol use was available, allowing
separate consideration of former drinkers from lifetime abstainers.
• Exclusion of study participants reporting a morbid condition at baseline, and
sensitivity analyses excluding the first three years of follow-up limited the chance that
reverse causality affected the findings.
• Although statistical models included many potentially relevant adjustment factors,
residual confounding might partially account for the observed associations.
• Average lifetime alcohol consumption was evaluated in this study, whereas it is
possible that specific drinking patterns in particular phases of life, as well as the effect
of binge drinking or drinking during meals, may also be of particular relevance for
mortality.
Page 6 of 71
For peer review only - http://bmjopen.bmj.com/site/about/guidelines.xhtml
BMJ Open
123456789101112131415161718192021222324252627282930313233343536373839404142434445464748495051525354555657585960
on March 11, 2020 by guest. P
rotected by copyright.http://bm
jopen.bmj.com
/B
MJ O
pen: first published as 10.1136/bmjopen-2014-005245 on 3 July 2014. D
ownloaded from

For peer review only
Introduction
Alcohol intake has been associated with an increased risk of death from a large list of morbid
conditions, including digestive tract conditions, liver cirrhosis, chronic pancreatitis,
hypertension, injuries and violence (1-3). In contrast, moderate alcohol drinking was
suggested to be associated with a reduction in cardiovascular disease (CVD) mortality (4;5).
As for cancer, the International Agency for Research on Cancer (IARC) and the World
Cancer Research Fund/American Institute for Cancer Research (WCRF/AICR) concluded that
alcohol use is associated with an increased risk to develop cancers of the upper aero-digestive
tract, liver, colorectal and female breast (6;7). It has been estimated that alcohol accounted for
about 2.7 million annual deaths and 3.8% of all deaths worldwide (8;9), but the impact of
alcohol on mortality is differential with respect to specific causes of diseases (3).
Within the European Prospective Investigation into Cancer and Nutrition (EPIC), a recent
work showed that heavy alcohol use was associated to a higher risk of death from alcohol-
related cancer, external causes and ‘other causes’, while no associations were observed for
coronary heart disease and other cardiovascular diseases (10).
In this work, we further investigated associations between alcohol use and overall and cause-
specific mortality. Notably, potential variability of the relationships with respect to smoking
habits, the type of alcoholic beverages, and country was explored. The cumulative
probabilities of death were estimated for overall mortality and, in a competing risks
framework, for specific mortality causes with respect to levels of alcohol, separately in men
and women. Further, the burden of alcohol use in relation to a broad group of causes of deaths
was evaluated by means of overall estimates of rate advancement periods, with respect to two
alternative scenarios.
Page 7 of 71
For peer review only - http://bmjopen.bmj.com/site/about/guidelines.xhtml
BMJ Open
123456789101112131415161718192021222324252627282930313233343536373839404142434445464748495051525354555657585960
on March 11, 2020 by guest. P
rotected by copyright.http://bm
jopen.bmj.com
/B
MJ O
pen: first published as 10.1136/bmjopen-2014-005245 on 3 July 2014. D
ownloaded from

For peer review only
Methods
Study Population. EPIC is an on-going multi-centre study that has been described in detail
previously (11). From 1992 to 2000, 521,448 individuals, aged 25 to 70 years were recruited
in the surroundings of 23 centres in 10 European countries. Most of the participants were
recruited from the general population residing in a given geographic area, a town, or a
province. Exceptions were the cohorts of France (female members of a health insurance for
school employees), Utrecht (breast cancer screening attendees), Ragusa (blood donors and
their spouses), and Oxford (mainly vegetarian and healthy eaters). Some characteristics of the
study population in the different participating countries are reported in Table 1. Study
participants provided informed consent and completed questionnaires on their diet, lifestyle,
and medical history. The study was approved by the relevant ethical review boards of each
centre and the International Agency of Research on Cancer in Lyon, France (11).
Dietary and lifestyle assessment. Diet was assessed at enrolment using validated country- or
center-specific dietary questionnaires (DQ) designed to capture habitual consumption over the
preceding year. Lifetime alcohol consumption was assessed based on self-reported weekly
consumption of wine, beer, and liquor at ages 20, 30, 40, 50 years in the lifestyle
questionnaire. Information on lifetime alcohol consumption was available for approximately
76% of EPIC participants (12). Information on smoking status and duration, physical activity
during leisure time, prevalent conditions at baseline, educational attainment, anthropometric
measures and reproductive history was obtained using lifestyle questionnaires.
Assessment of causes of death. Vital status and information on cause and date of death were
ascertained using record linkage with cancer registries, boards of health, and death registries
(Denmark, Italy, The Netherlands, Spain, the United Kingdom), or by active follow-up
(France Germany, Greece). Data were coded using the 10th revision of the International
Page 8 of 71
For peer review only - http://bmjopen.bmj.com/site/about/guidelines.xhtml
BMJ Open
123456789101112131415161718192021222324252627282930313233343536373839404142434445464748495051525354555657585960
on March 11, 2020 by guest. P
rotected by copyright.http://bm
jopen.bmj.com
/B
MJ O
pen: first published as 10.1136/bmjopen-2014-005245 on 3 July 2014. D
ownloaded from

For peer review only
Statistical Classification of Diseases, Injuries and Causes of Death (ICD-10) where the
underlying cause is the official cause of death.
In this work, six different causes of deaths were selected: cardiovascular disease (CVD) [I00-
I99 excluding I20-I25] and coronary heart disease (CHD) [I20-I25], alcohol related cancer
(ARC), including colorectal cancer [C18- C20], female breast cancer [C50], upper aero-
digestive cancers (UADT, including cancer of the mouth [C01 to C10 without C08=salivary
gland], larynx [C21], pharynx [C11 to C14], oesophagus [C15]), violent deaths and injuries
(Injury, poisoning and certain other consequences of external causes [S00-T98]; deaths due to
respiratory diseases [J00-J99]; a group for all other causes (including external causes of
morbidity and mortality [V01-Y98], unknown causes [R96-R99]).
Statistical analyses. Participants from Denmark (Aarhus, Copenhagen), France, Germany
(Heidelberg, Potsdam), Greece, Italy (Florence, Varese, Ragusa, Turin), the Netherlands
(Utrecht), Spain (Asturias, Granada, Murcia, Navarra, San Sebastian), and the United
Kingdom (Cambridge, Oxford), were eligible for this analysis. We excluded the entire cohorts
of Naples (Italy), Bilthoven (The Netherlands), Sweden and Norway because no information
on past alcohol use was collected (n=118,082). Further exclusions concerned participants with
incomplete vital status information (n=928), who had not filled out the dietary or lifestyle
questionnaires (n=11,411), and participants whose ratio of energy intake to estimated energy
requirement (n=7,592), calculated in terms of gender, body weight, height, and age, was in the
top or bottom 1% in order to partially reduce the impact of outlier values (13). Participants
that at recruitment reported a cancer (n=13,283), diabetes (n=11,240), myocardial infarction
or heart disease (n=5,266) or stroke (n=3,246) were excluded from the analyses (n= 30,665 in
total).
Cox proportional hazard models were used to compute mortality hazard ratios (HR), and 95%
confidence intervals, for categories of average lifetime alcohol use; never drinkers, 1–4.9
Page 9 of 71
For peer review only - http://bmjopen.bmj.com/site/about/guidelines.xhtml
BMJ Open
123456789101112131415161718192021222324252627282930313233343536373839404142434445464748495051525354555657585960
on March 11, 2020 by guest. P
rotected by copyright.http://bm
jopen.bmj.com
/B
MJ O
pen: first published as 10.1136/bmjopen-2014-005245 on 3 July 2014. D
ownloaded from

For peer review only
g/day (reference category), 5–14.9, 15–29.9, 30–59.9, ≥60 g/day. In women, the last two
alcohol categories were collapsed into a ≥30 g/day group. Time in the study up to death, loss
or end of follow-up, whichever came first was the primary time variable. The Breslow method
was adopted for handling ties. Models were stratified by center to control for differences in
questionnaire design, follow-up procedures, and other center-specific effects (13). Systematic
adjustments were undertaken for age at recruitment, BMI and height (continuous), an
indicator for participants that quitted alcohol drinking, time since alcohol quitting
(continuous), smoking (never, current with 1 to 15 cigarettes/day, current with more than 15
cigarettes/day, former smoker that quitted less than 10 years before recruitment, former
smoker that quitted more than 10 years before recruitment, current smoker of other than
cigarettes, unknown [n=8,819]), duration of smoking (continuous), age at start smoking (less
than 19 years, more than 19 years, unknown [n=39,041]), educational attainment (five
categories of level of schooling: none, primary, technical, or degree or more, unknown
[n=14,223]) as a proxy variable for socioeconomic status, physical activity (inactive,
moderately inactive, moderately active, active, unknown [n=328]), and energy intake
(continuous). In women the models were further adjusted for menopausal status
(dichotomized as natural postmenopausal or surgical versus pre- or peri-menopausal, as
assessed at baseline), ever use of replacement hormones, and number of full term pregnancies
(nulliparous, 1 or 2 children, more than three, unknown [n=6,482]). Indicator variables
specific to some of the confounding factors were used to model missing values, after checking
that the parameters associated with these indicators were not statistically significantly
associated with risk of death.
Models for overall and cause-specific mortality were fitted, separately for men and women.
An overall test of significance of HRs related to alcohol use was determined by computing p-
values (pWald) for Wald test statistics compared to a chi-square distribution with degrees of
Page 10 of 71
For peer review only - http://bmjopen.bmj.com/site/about/guidelines.xhtml
BMJ Open
123456789101112131415161718192021222324252627282930313233343536373839404142434445464748495051525354555657585960
on March 11, 2020 by guest. P
rotected by copyright.http://bm
jopen.bmj.com
/B
MJ O
pen: first published as 10.1136/bmjopen-2014-005245 on 3 July 2014. D
ownloaded from

For peer review only
freedom equal to the number of alcohol categories minus one. The proportional hazards
assumption in the Cox model was satisfied and evaluated via inclusion into the disease model
of interaction terms between lifetime alcohol and follow-up time. To reduce the chance of
reverse causality, sensitivity analyses were run excluding the first three years of follow-up. As
results were not different from those using the entire cohort, they were not shown. Analyses
excluding former drinkers (4% and 5% of the study populations, in men and women
respectively) provided very similar results (results not shown).
Evaluating heterogeneity. Effect modification in the relation between alcohol and mortality
by, in turn, smoking status (never, ever), smoking status (never and current smokers), and
recruitment country was assessed. Models with main effects and interaction terms were fitted
and compared to models with main effects only. The difference in log-likelihood (likelihood
ratio test statistics) was compared to a chi-square distribution with degrees of freedom equal
to the number of interaction terms. HRs for alcohol categories across levels of interacting
variables were computed as linear combinations of main effects and interactions. Associations
with wine and beer use (each grouped as never, 0.1-2.9 g/day (reference), 3-9.9, 10-19.9, 20-
39.9, ≥40 g/day, ≥20 g/day in women) and total mortality were assessed in mutually adjusted
models. The difference of association for wine and beer use in relation to overall mortality
was assessed by inspecting the significance of the parameter related to the arithmetic
difference of wine and beer use (expressed on the log-scale plus 1 to deal with abstainers) in a
model that also included their arithmetic sum. When assessing the association for wine (beer)
intake, analyses were restricted to moderate lifetime drinkers of beer (wine) and spirits (below
3 g/day).
Flexible parametric survival models (14) with age as the time-scale were used to evaluate
whether the association between alcohol intake and mortality rate varied by attained age. The
origin of the time-scale was set to 30 years as the hazard of death is essentially zero prior to
Page 11 of 71
For peer review only - http://bmjopen.bmj.com/site/about/guidelines.xhtml
BMJ Open
123456789101112131415161718192021222324252627282930313233343536373839404142434445464748495051525354555657585960
on March 11, 2020 by guest. P
rotected by copyright.http://bm
jopen.bmj.com
/B
MJ O
pen: first published as 10.1136/bmjopen-2014-005245 on 3 July 2014. D
ownloaded from

For peer review only
that age. The baseline cumulative hazard was modeled using restricted cubic splines with
three internal knots placed at evenly spaced centiles of the uncensored log-survival times in
order to ensure that an equivalent number of deaths occurred between each knot (15).
Interactions between alcohol intake and the time scale were modeled using restricted cubic
splines with one knot placed at the median of uncensored log-survival times. HRs and
differences in survival functions were calculated from the fitted models and plotted against
attained age, along with confidence intervals calculated based on delta method variance
estimates.
Possible departures from linearity in the association between average lifetime alcohol use and
total mortality were assessed using fractional polynomials (16), a subset of generalized linear
models in which various powers (−2, −1, −0.5, 0, 0.5, 1, 2, 3) of the covariate(s) of interest
are entered into the linear predictor. Fractional polynomials of order two were consistently
used in this work for lifetime alcohol use (17). Non-linearity was tested comparing the
difference in log-likelihood of a model with the fractional polynomials with a model with a
linear term only to a chi-square distribution with three degrees of freedom (16).
Absolute risks. An extension of the Cox proportional hazards model was employed to fit
cause- specific associations between lifetime alcohol use and cause-specific mortality in a
competing risks framework (18). An augmented dataset was created where the initial dataset
is replicated a number of times equal to the different causes of death. In each replicated
dataset, competing causes of death were set to censored observations, and the analyses were
stratified by the event type (19). The relationship between each confounder variables and
cause-specific mortality was assumed homogenous across causes of death. In this way
competing risks was accounted for, and cumulative cause-specific and overall mortality
curves were estimated for heavy (greater than 30 and 60 g/day, in women and men
respectively) and moderate (0.1 to 4.9 g/day) drinkers, separately for never and current
Page 12 of 71
For peer review only - http://bmjopen.bmj.com/site/about/guidelines.xhtml
BMJ Open
123456789101112131415161718192021222324252627282930313233343536373839404142434445464748495051525354555657585960
on March 11, 2020 by guest. P
rotected by copyright.http://bm
jopen.bmj.com
/B
MJ O
pen: first published as 10.1136/bmjopen-2014-005245 on 3 July 2014. D
ownloaded from
For peer review only
smokers (20). Cumulative mortality curves were obtained for participants aged 60 years,
using mean values for continuous confounding factors, and average frequencies for
categorical confounders.
Quantifying the alcohol burden. The burden of alcohol on mortality was quantified with
estimates of the rate advancement period (RAP) (21), according to two scenarios with
threshold levels equal to 5 and 15 g/day. For overall and cause-specific risk of death, RAP
were computed, dividing the log(HR) estimate comparing alcohol users above and the
threshold with alcohol drinkers between 0.1 g/day and the threshold, by the log of the
parameter associated with age. Never alcohol users were not included in the estimation.
Associated 95% confidence intervals were also determined. RAP estimates express the impact
of a given exposure on the risk of death, by determining the time (in years) by which the risk
of death is anticipated for exposed study participants compared to non-exposed.
Statistical tests were two-sided, and p-values <0.05 were considered statistically significant.
All analyses were performed using SAS 9.2 (22) and Stata 12.1 (23).
Results
Baseline characteristics. The current analysis was based on 247,795 female and 101,935 male
study participants. The median age at enrolment was 52 years for women and 53 years for
men. Study participants were followed on average 12.6 years, accumulating 4,800,585
person-years, during which a total of 20,453 fatal events were recorded (Table 1).
Drinking patterns differed substantially between men and women (Table 2). In women, 10%
(n=25,146) of participants were lifetime never drinkers, while 45% (n=112,281) and 2%
(n=6,042) were moderate (0.1 to 4.9 g/day) and heavy users (>30g/day), respectively.
Conversely, only 1.5% (n=1,600) of men reported having never consumed alcohol, 14%
(n=14,287) were moderate drinkers, whilst 29% (n=29,124) were heavy or extreme drinkers
Page 13 of 71
For peer review only - http://bmjopen.bmj.com/site/about/guidelines.xhtml
BMJ Open
123456789101112131415161718192021222324252627282930313233343536373839404142434445464748495051525354555657585960
on March 11, 2020 by guest. P
rotected by copyright.http://bm
jopen.bmj.com
/B
MJ O
pen: first published as 10.1136/bmjopen-2014-005245 on 3 July 2014. D
ownloaded from

For peer review only
(30 to 59.9 and ≥60 g/day). Furthermore, the vast majority of women who were regular
drinkers (total alcohol intake ≥10g/day) drank predominantly wine (91%), rather than beer
(9%), whilst regular drinkers in men drank beer (46%) and wine (54%) in similar proportion.
Compared to never and moderate drinkers, women with higher alcohol use had higher levels
of education and physical activity, and were more likely to be current smokers, or pre-/peri-
menopausal. Never alcohol users were less likely to have used hormonal replacement therapy
than alcohol drinkers. In men, the trends were somewhat less apparent. Heavy and extreme
alcohol users (≥30 g/day) were more often current smokers, attained lower educational level,
and had higher energy intake levels, compared to moderate drinkers. Never drinkers were
physically less active than alcohol drinkers.
Lifetime alcohol and total mortality. Lifetime average alcohol use was strongly associated
with total mortality, in that both never and heavy drinkers (≥30 g/day) had notably higher
mortality rates than did light to moderate drinkers (0.1-4.9 g/day), a pattern that was
consistently apparent among female and male study participants (Figure 1). The HR
comparing never and heavy drinkers to moderate drinkers in women was 1.26 (95% CI: 1.18-
1.35) and 1.27 (1.13-1.43), respectively. The corresponding HRs among men were 1.29 (1.10-
1.51) for never drinkers, 1.15 (1.06-1.24) for heavy drinkers and 1.53 (1.39-1.68) for extreme
drinkers (≥60 g/day).
Lifetime alcohol and cause specific mortality. In men, extreme alcohol use was associated
with mortality due to alcohol related cancers (HR≥60 vs ref = 2.62: 1.90, 3.62), other cancers
(1.34: 1.13, 1.59), violent deaths and injuries (1.93: 1.27, 2.91), and other causes (1.98: 1.67,
2.34). With the exception of the category for never drinkers, alcohol intake was not associated
with CVD or CHD mortality, both in women and men. Among women, heavy drinkers
displayed HR≥30 vs ref equal to 1.49 (1.07, 2.06) for alcohol related cancers. Respiratory
diseases were not associated with lifetime alcohol in women, while results were suggestive of
Page 14 of 71
For peer review only - http://bmjopen.bmj.com/site/about/guidelines.xhtml
BMJ Open
123456789101112131415161718192021222324252627282930313233343536373839404142434445464748495051525354555657585960
on March 11, 2020 by guest. P
rotected by copyright.http://bm
jopen.bmj.com
/B
MJ O
pen: first published as 10.1136/bmjopen-2014-005245 on 3 July 2014. D
ownloaded from

For peer review only
an increased risk in extreme alcohol users compared to moderate users in men
(Supplementary Figure 1). Dose–response relationships evaluated with fractional polynomials
are displayed in Supplementary Figures 2 and 3, for women and men respectively.
Evaluating heterogeneity. In both sexes, alcohol related HRs for overall mortality were of
similar magnitude in never and current smokers (Table 3). Analyses conducted by smoking
intensity (never vs. heavy smokers, i.e. more than 15 cigarettes/day) produced very similar
evidence (results not shown). Cause-specific analyses showed mostly homogeneous alcohol-
related HRs by smoking status (results not shown). In women, beer use was more strongly
related than wine to overall mortality for amounts greater than 3g/day compared to the
reference category (0.1 to 2.9 g/day). Lifetime never wine and beer users displayed higher
risks than moderate drinkers. The associations between lifetime alcohol and overall risk of
mortality were differential across country of origin in men (pheterogeneity=0.012) but not in
women (pheterogeneity=0.511), as reported in Supplementary Figures 4 and 5, with stronger
relationships observed in Northern European countries compared to Southern European
countries.
The HR≥60 vs ref for men was more pronounced at earlier ages, and were close to one as attained
age approached 90 years (plikelihood-ratio for age-varying versus age invariant
parameterization=0.003), however extreme male drinkers exhibited lower cumulative survival
probability than the reference group throughout the lifespan (Supplementary Figure 6). No
such age varying association was apparent for women (plikelihood-ratio=0.80).
Absolute risks. The 10-year risk of death at the age of 60 years for heavy drinkers was 5% and
7% in women (≥30 g/day), and 11% and 18% in men (≥60 g/day), for never and current
smokers, respectively (Figure 2). Corresponding figures in moderate drinkers (0.1 to 4.9
g/day) were 3% and 4% in women, and 5% and 8% in men. Based on a competing risks
analysis, it was estimated that, at the age of 60 years, a female lifetime heavy alcohol drinker
Page 15 of 71
For peer review only - http://bmjopen.bmj.com/site/about/guidelines.xhtml
BMJ Open
123456789101112131415161718192021222324252627282930313233343536373839404142434445464748495051525354555657585960
on March 11, 2020 by guest. P
rotected by copyright.http://bm
jopen.bmj.com
/B
MJ O
pen: first published as 10.1136/bmjopen-2014-005245 on 3 July 2014. D
ownloaded from

For peer review only
and smoker had a 10-year risk of death of 1.0% for ARC, 1.2% for CVD/CHD, and 0.2% for
violent death and injuries, as displayed in Figure 3. Corresponding figures for males (≥60
g/day) were 2.2% (ARC), 5.0% (CVD/CHD) and 1% (violent death and injuries). Risks for
moderate drinkers for ARC, CVD/CHD and violent death and injuries were 0.8%, 1.2%, 0.2%
and 0.9%, 4.0%, 0.3%, in women and men, respectively. Consistently lower risks were
observed for never smoker individuals, with estimates equal to 0.5%, 0.7% and 0.1% in
women, and 1%, 2.1% and 0.3% in men.
Rate advancement period. The impact of lifetime alcohol on overall and cause-specific
mortality was estimated with RAP values (Table 4). In women, RAP for overall mortality
were equal to 0.36 years (95%CI: -0.05, 0.76) and 0.83 (0.26, 1.39), for the 5 and 15 g/day
scenario, respectively. In men, RAP values were equal to 0.15 (-0.48, 0.76) and 1.42 (0.96,
1.89), for 5 and 15 g/day respectively. RAP values were sizeable for mortality due to alcohol
related cancer (5.03: 3.07, 7.00) and violent death and injuries (11.83: 3.92, 18.17) in the
second scenario.
Discussion
In this large European prospective study, the association between alcohol use and overall and
cause-specific risk of death was evaluated in eight European populations. When accounting
for potential confounding factors, average lifetime alcohol use was strongly associated with
overall mortality, whereas lifetime never alcohol users consistently displayed a higher risk of
death compared to moderate drinkers. These results are in agreement with a recent evaluation
of alcohol and cause-specific mortality in EPIC (10). With respect to this recent study (10),
further analyses were conducted to deeply investigate the role of factors that modulate the
association between alcohol use and the risk of death, notably smoking and types of alcohol
beverage. Estimates of 10-year risk of death in relation to levels of alcohol use were provided.
Page 16 of 71
For peer review only - http://bmjopen.bmj.com/site/about/guidelines.xhtml
BMJ Open
123456789101112131415161718192021222324252627282930313233343536373839404142434445464748495051525354555657585960
on March 11, 2020 by guest. P
rotected by copyright.http://bm
jopen.bmj.com
/B
MJ O
pen: first published as 10.1136/bmjopen-2014-005245 on 3 July 2014. D
ownloaded from

For peer review only
This study has several strengths. It was conducted using a large prospective cohort, where
dietary and lifestyle exposure information were collected on disease-free individuals.
Information on lifetime alcohol use was available on 76% of the cohort, allowing separate
consideration of former drinkers and lifetime abstainers. Further, exclusion of study
participants reporting a morbid condition at baseline, and sensitivity analyses excluding the
first three years of follow-up suggest that reverse causality is unlikely to have affected the
results. One potential weakness of this study is that, although statistical models included many
potentially relevant adjustment factors, residual confounding might partially account for the
observed associations. In addition, average lifetime alcohol consumption was used throughout
this study, whereby it is possible that specific drinking patterns in particular phases of life
(10), as well as the effect of binge drinking or drinking during meals may be of particular
relevance for mortality.
A recent Russian study found a strong relationship between vodka and risk of death (24).
While an apparent J-shaped relationship between alcohol use and mortality has been reported
(25;26), the interpretation of this pattern is the subject of some controversy. It has been
suggested that alcohol abstinence does not truly entail greater risk of death than moderate use,
and that misclassification of alcohol quantity and lack of accuracy in reporting prevalent
morbid conditions at baseline in the group of never drinkers (27) could explain the excess
risks observed. This reasoning motivated our choice of considering moderate alcohol drinkers,
as the reference category throughout this work. Moreover, residual and unmeasured
confounding are plausible drivers of the association (28). These suggestions are supported by
our findings that never drinkers are at increased risk of death due to violence and injury. This
implausible association casts considerable doubt on the veracity of the apparent increased risk
of death among never drinkers.
Page 17 of 71
For peer review only - http://bmjopen.bmj.com/site/about/guidelines.xhtml
BMJ Open
123456789101112131415161718192021222324252627282930313233343536373839404142434445464748495051525354555657585960
on March 11, 2020 by guest. P
rotected by copyright.http://bm
jopen.bmj.com
/B
MJ O
pen: first published as 10.1136/bmjopen-2014-005245 on 3 July 2014. D
ownloaded from

For peer review only
The overall mortality hazard ratio for men with extreme versus moderate alcohol use was
greater at younger ages, and approached one as age increased towards 90 years. This result
reflects the comparatively low incidence of death through middle age. Consideration of the
absolute risk of death, however, suggests that moderate drinkers have a substantial cumulative
survival advantage over extreme drinkers throughout the adult lifespan. It has been suggested
that wine drinking could be more favourably associated than other alcoholic beverages to the
risk of CHD and some cancers (29-32). In this study beer use displayed more apparent risk
patterns than wine consumption, particularly in men. Although we believe that this finding is
relevant, we call for cautious interpretations of these results, as the lifestyle profile of wine
and beer drinkers is profoundly different. The associations between alcohol and mortality
were heterogeneous across countries in men, but not in women. This could be due to the
larger amount of alcohol consumed in men than in women, naturally increasing the variability
of exposure and the statistical power to detect associations, and of the larger variability
characterizing drinking habits in men, such as binge drinking, drinking during meals and other
societal aspects. Although no heterogeneity was observed by smoking status, mortality among
smokers was higher than the mortality among non-smokers , so the absolute increase in risk
associated with alcohol intake is more extreme among smokers. This differential increase in
cumulative probability of death emphasises the central role of tobacco as a risk factor for
mortality, as well as the potential extra harm of increased alcohol consumption.
In the EPIC study, although associations with alcohol were mostly apparent for ARC and
violent death and injuries, absolute risks were highest for CVD/CHD in men, while
CVD/CHD and ARC risks were of similar magnitude in women. In general, as individuals
reporting a prevalent condition at recruitment (either cancer, diabetes, heart attack or stroke)
were excluded from the analysis in an effort to minimize reverse causality, our estimates of
absolute risks of death are possibly underestimated. RAP values were estimated to appreciate
Page 18 of 71
For peer review only - http://bmjopen.bmj.com/site/about/guidelines.xhtml
BMJ Open
123456789101112131415161718192021222324252627282930313233343536373839404142434445464748495051525354555657585960
on March 11, 2020 by guest. P
rotected by copyright.http://bm
jopen.bmj.com
/B
MJ O
pen: first published as 10.1136/bmjopen-2014-005245 on 3 July 2014. D
ownloaded from

For peer review only
the risk benefit of alcohol drinkers if they were to modify their exposure, according to a
counterfactual scenario (21;33). Consistently in men and women, RAP values for overall
mortality were larger when the reference category was set to 0.1 to 15 g/day than when using
a threshold of 5 g/day, thus indicating that, based on the EPIC study, the benefit for drinkers
could be largest if their intake is reduced to levels below 15 g/day. These results are in line
with findings of a recent work in the UK population, where the reduction of overall mortality
was estimated to be optimized for alcohol reduction up to a median population level of 5
g/day (34).
In a large prospective study in Europe, lifetime alcohol intake was significantly associated
with both overall and ARC specific mortality. In men, positive associations were observed for
violent deaths and injuries, while CVD and CHD deaths were not associated with alcohol use
among drinkers. Our findings suggest that these associations do not differ between never and
current smokers, and were stronger for beer than for wine drinkers.
Page 19 of 71
For peer review only - http://bmjopen.bmj.com/site/about/guidelines.xhtml
BMJ Open
123456789101112131415161718192021222324252627282930313233343536373839404142434445464748495051525354555657585960
on March 11, 2020 by guest. P
rotected by copyright.http://bm
jopen.bmj.com
/B
MJ O
pen: first published as 10.1136/bmjopen-2014-005245 on 3 July 2014. D
ownloaded from

For peer review only
Funding statement
This work was supported by the Direction Générale de la Santé (French Ministry of Health)
(Grant GR-IARC-2003-09-12-01), by the European Commission (Directorate General for
Health and Consumer Affairs) and the International Agency for Research on Cancer. The
national cohorts are supported by the Danish Cancer Society (Denmark); the Ligue Contre le
Cancer, the Institut Gustave Roussy, the Mutuelle Générale de l’Education Nationale, and the
Institut National de la Santé et de la Recherche Médicale (France); the Deutsche Krebshilfe,
the Deutsches Krebsforschungszentrum, and the Federal Ministry of Education and Research
(Germany); the Hellenic Health Foundation, the Stavros Niarchos Foundation, and the
Hellenic Ministry of Health and Social Solidarity (Greece); the Italian Association for
Research on Cancer and the National Research Council (Italy); the Dutch Ministry of Public
Health, Welfare and Sports, the Netherlands Cancer Registry, LK Research Funds, Dutch
Prevention Funds, the Dutch Zorg Onderzoek Nederland, the World Cancer Research Fund,
and Statistics Netherlands (Netherlands); European Research Council-2009-AdG 232997 and
the Nordforsk, Nordic Centre of Excellence program on Food, Nutrition and Health
(Norway); the Health Research Fund, Regional Governments of Andalucýa, Asturias, Basque
Country, Murcia (project 6236) and Navarra, Instituto de Salud Carlos III, Redes de
Investigacion Cooperativa (RD06/0020) (Spain); the Swedish Cancer Society, the Swedish
Scientific Council, and the Regional Government of Skåne (Sweden); Cancer Research UK,
the Medical Research Council, the Stroke Association, the British Heart Foundation, the
Department of Health, the Food Standards Agency, and the Wellcome Trust (United
Kingdom). The work undertaken by David C Muller was done during the tenure of an IARC,
Australia postdoctoral fellowship, supported by the Cancer Council Australia.
Contributorship statement
Pietro FERRARI, Idlir LICAJ, Isabelle ROMIEU, Paul BRENNAN, Heiner BOEING
conceptualized the study and defined the analytical strategy. Pietro FERRARI and Idlir
LICAJ had full access to all the data in the study and take responsibility for the integrity of
the data and the accuracy of the data analysis. Pietro FERRARI, Idlir LICAJ, David C
MULLER, Per Kragh ANDERSEN, Luciana NUNES performed statistical analyses and
provided preliminary interpretation of findings. Pietro FERRARI, David C MULLER,
Mattias JOHANSSON, Idlir LICAJ, Paul BRENNAN contributed to draft the manuscript.
Elisabete WEIDERPASS, Laure DOSSUS, Laureen DARTOIS, Guy FAGHERAZZI,
Page 20 of 71
For peer review only - http://bmjopen.bmj.com/site/about/guidelines.xhtml
BMJ Open
123456789101112131415161718192021222324252627282930313233343536373839404142434445464748495051525354555657585960
on March 11, 2020 by guest. P
rotected by copyright.http://bm
jopen.bmj.com
/B
MJ O
pen: first published as 10.1136/bmjopen-2014-005245 on 3 July 2014. D
ownloaded from

For peer review only
Kathryn Erica BRADBURY, Kay-Tee KHAW, Eric Jeffrey DUELL, Aurelio
BARRICARTE, Esther MOLINA-MONTES, Carmen NAVARRO SANCHEZ, Larraitz
ARRIOLA, Peter WALLSTRÖM, Anne TJØNNELAND, Anja OLSEN, Antonia
TRICHOPOULOU, Vasiliki BENETOU, Dimitrios TRICHOPOULOS, Rosario TUMINO,
Claudia AGNOLI, Carlotta SACERDOTE, Domenico PALLI, Kuanrong LI, Rudolf KAAKS,
Petra PEETERS, Joline Wilhelma Johanna BEULENE, Marc GUNTER, Teresa NORAT,
Kim OVERVAD, Elio RIBOLI, Paul BRENNAN, and Isabelle ROMIEU played a key role in
the acquisition of the data, and were active in searching for funding to continue the study.
With respect to this work, they all critically helped in the interpretation of results, revised the
manuscript and provided relevant intellectual input.
Competing Interest Declaration
All authors have completed the Unified Competing Interest form at
www.icmje.org/coi_disclosure.pdf (available on request from the corresponding author). Dr
Kathryn E BRADBURY reports grants from Cancer Research UK, during the conduct of the
study. The rest of the authors declared no support from any organisation for the submitted
work, no financial relationships with any organisations that might have an interest in the
submitted work in the previous three years, no other relationships or activities that could
appear to have influenced the submitted work.
Sharing statement
Statistical code is available from the corresponding author by emailing [email protected].
Page 21 of 71
For peer review only - http://bmjopen.bmj.com/site/about/guidelines.xhtml
BMJ Open
123456789101112131415161718192021222324252627282930313233343536373839404142434445464748495051525354555657585960
on March 11, 2020 by guest. P
rotected by copyright.http://bm
jopen.bmj.com
/B
MJ O
pen: first published as 10.1136/bmjopen-2014-005245 on 3 July 2014. D
ownloaded from

For peer review only
Reference List
(1) Thun MJ, Peto R, Lopez AD, et al. Alcohol consumption and mortality among middle-aged and elderly U.S. adults. N Engl J Med 1997 Dec 11;337(24):1705-14.
(2) Bagnardi V, Blangiardo M, La Vecchia C., et al. A meta-analysis of alcohol drinking and cancer risk. Br J Cancer 2001 Nov 30;85(11):1700-5.
(3) Rehm J, Baliunas D, Borges GL, et al. The relation between different dimensions of alcohol consumption and burden of disease: an overview. Addiction 2010 May;105(5):817-43.
(4) Corrao G, Bagnardi V, Zambon A, et al. A meta-analysis of alcohol consumption and the risk of 15 diseases. Prev Med 2004 May;38(5):613-9.
(5) Ronksley PE, Brien SE, Turner BJ, et al. Association of alcohol consumption with selected cardiovascular disease outcomes: a systematic review and meta-analysis. BMJ 2011;342:d671.
(6) IARC. Alcohol consumption and ethyl carbamate. 96 ed. IARC; 2010.
(7) WCRF/AICR. Food, nutrition, physical activity and the prevention of cancer: a global perspective. Washington DC: AICR; 2007.
(8) Rehm J, Mathers C, Popova S, et al. Global burden of disease and injury and economic cost attributable to alcohol use and alcohol-use disorders. Lancet 2009 Jun 27;373(9682):2223-33.
(9) Lim SS, Vos T, Flaxman AD, et al. A comparative risk assessment of burden of disease and injury attributable to 67 risk factors and risk factor clusters in 21 regions, 1990-2010: a systematic analysis for the Global Burden of Disease Study 2010. Lancet 2012 Dec 15;380(9859):2224-60.
(10) Bergmann MM, Rehm J, Klipstein-Grobusch K, et al. The association of pattern of lifetime alcohol use and cause of death in the European Prospective Investigation into Cancer and Nutrition (EPIC) study. Int J Epidemiol 2013 Dec;42(6):1772-90.
(11) Riboli E, Hunt KJ, Slimani N, et al. European Prospective Investigation into Cancer and Nutrition (EPIC): study populations and data collection. Public Health Nutr 2002 Dec;5(6B):1113-24.
(12) Ferrari P, Jenab M, Norat T, et al. Lifetime and baseline alcohol intake and risk of colon and rectal cancers in the European prospective investigation into cancer and nutrition (EPIC). Int J Cancer 2007 Nov 1;121(9):2065-72.
(13) Ferrari P, Day NE, Boshuizen HC, et al. The evaluation of the diet/disease relation in the EPIC study: considerations for the calibration and the disease models. Int J Epidemiol 2008 Apr;37(2):368-78.
(14) Royston P, Parmar MK. The use of restricted mean survival time to estimate the treatment effect in randomized clinical trials when the proportional hazards assumption is in doubt. Stat Med 2011 Aug 30;30(19):2409-21.
Page 22 of 71
For peer review only - http://bmjopen.bmj.com/site/about/guidelines.xhtml
BMJ Open
123456789101112131415161718192021222324252627282930313233343536373839404142434445464748495051525354555657585960
on March 11, 2020 by guest. P
rotected by copyright.http://bm
jopen.bmj.com
/B
MJ O
pen: first published as 10.1136/bmjopen-2014-005245 on 3 July 2014. D
ownloaded from

For peer review only
(15) Heinzl H, Kaider A. Gaining more flexibility in Cox proportional hazards regression models with cubic spline functions. Comput Methods Programs Biomed 1997 Nov;54(3):201-8.
(16) Sauerbrei W, Royston P. Building multivariable prognostic and diagnostic models: Transformation of the predictors by using fractional polynomials. Journal ofthe Royal Statistical Society, Series A 1999;62:71-94.
(17) Royston P, Ambler G, Sauerbrei W. The use of fractional polynomials to model continuous risk variables in epidemiology. Int J Epidemiol 1999 Oct;28(5):964-74.
(18) Andersen PK, Geskus RB, de WT, et al. Competing risks in epidemiology: possibilities and pitfalls. Int J Epidemiol 2012 Jun;41(3):861-70.
(19) Putter H, Fiocco M, Geskus RB. Tutorial in biostatistics: competing risks and multi-state models. Stat Med 2007 May 20;26(11):2389-430.
(20) Rosthoj S, Andersen PK, Abildstrom SZ. SAS macros for estimation of the cumulative incidence functions based on a Cox regression model for competing risks survival data. Comput Methods Programs Biomed 2004 Apr;74(1):69-75.
(21) Brenner H, Gefeller O, Greenland S. Risk and rate advancement periods as measures of exposure impact on the occurrence of chronic diseases. Epidemiology 1993 May;4(3):229-36.
(22) SAS Institute Inc. 2002. NC, USA, Cary.
(23) Stata Statistical Software: Release 12. Version StataCorp. College Station, TX: StataCorp LP.: 2011.
(24) Zaridze D, Lewington S, Boroda A, et al. Alcohol and mortality in Russia: prospective observational study of 151 000 adults. Lancet 2014 Jan 30;(13):10-6736.
(25) Thun MJ, Peto R, Lopez AD, et al. Alcohol consumption and mortality among middle-aged and elderly U.S. adults. N Engl J Med 1997 Dec 11;337(24):1705-14.
(26) Lin Y, Kikuchi S, Tamakoshi A, et al. Alcohol consumption and mortality among middle-aged and elderly Japanese men and women. Ann Epidemiol 2005 Sep;15(8):590-7.
(27) Fillmore KM, Stockwell T, Chikritzhs T, et al. Moderate alcohol use and reduced mortality risk: systematic error in prospective studies and new hypotheses. Ann Epidemiol 2007 May;17(5 Suppl):S16-S23.
(28) Naimi TS, Brown DW, Brewer RD, et al. Cardiovascular risk factors and confounders among nondrinking and moderate-drinking U.S. adults. Am J Prev Med 2005 May;28(4):369-73.
(29) Klatsky AL, Friedman GD, Armstrong MA, et al. Wine, liquor, beer, and mortality. Am J Epidemiol 2003 Sep 15;158(6):585-95.
Page 23 of 71
For peer review only - http://bmjopen.bmj.com/site/about/guidelines.xhtml
BMJ Open
123456789101112131415161718192021222324252627282930313233343536373839404142434445464748495051525354555657585960
on March 11, 2020 by guest. P
rotected by copyright.http://bm
jopen.bmj.com
/B
MJ O
pen: first published as 10.1136/bmjopen-2014-005245 on 3 July 2014. D
ownloaded from

For peer review only
(30) Maskarinec G, Meng L, Kolonel LN. Alcohol intake, body weight, and mortality in a multiethnic prospective cohort. Epidemiology 1998 Nov;9(6):654-61.
(31) Gronbaek M, Becker U, Johansen D, et al. Type of alcohol consumed and mortality from all causes, coronary heart disease, and cancer. Ann Intern Med 2000 Sep;19;133(6):411-9.
(32) Renaud SC, Gueguen R, Siest G, et al. Wine, beer, and mortality in middle-aged men from eastern France. Arch Intern Med 1999 Sep 13;159(16):1865-70.
(33) Gellert C, Schottker B, Holleczek B, et al. Using rate advancement periods for communicating the benefits of quitting smoking to older smokers. Tob Control 2013 Jul;22(4):227-30.
(34) Nichols M, Scarborough P, Allender S, et al. What is the optimal level of population alcohol consumption for chronic disease prevention in England? Modelling the impact of changes in average consumption levels. BMJ Open 2012 May 30;2(3):e000957.
Page 24 of 71
For peer review only - http://bmjopen.bmj.com/site/about/guidelines.xhtml
BMJ Open
123456789101112131415161718192021222324252627282930313233343536373839404142434445464748495051525354555657585960
on March 11, 2020 by guest. P
rotected by copyright.http://bm
jopen.bmj.com
/B
MJ O
pen: first published as 10.1136/bmjopen-2014-005245 on 3 July 2014. D
ownloaded from

For peer review only
Table 1. Country and sex-specific number of participants (N), person-years (PY), cause-specific and overall number of deaths.
Cancers
Country N PY CHD1 CVD2 Breast UADT3 Liver Colon-rectum Total4 Other
cancers5 Violent
& Injuries6 Resp7 Other causes8 Total
Women
France 65,127 971,127 45 202 62 8 4 27 101 678 115 73 1,619 2,833
Italy 24,956 306,244 26 87 71 6 12 53 142 293 30 12 120 710
Spain 23,616 323,027 41 50 51 6 9 47 113 243 46 9 119 621
UK 50,251 651,640 387 320 160 30 15 127 332 716 85 161 1,091 3,092
Netherlands 14,583 189,531 110 137 58 14 7 78 157 370 20 65 209 1,068
Greece 14,391 143,150 139 100 41 2 10 18 71 146 26 27 94 603
Germany 27,098 307,380 56 74 64 12 14 44 134 256 35 25 114 694
Denmark 27,773 328,375 84 143 128 23 17 110 278 648 51 116 548 1,868
All 247,795 3,220,474 888 1,113 635 101 88 504 1,328 3,335 408 488 3,848 11,489
Men
France - - - - - - - - - - - - - -
Italy 13,471 168,992 53 59 - 8 10 39 57 240 35 13 131 588
Spain 14,089 189,942 136 88 - 34 14 62 110 351 81 42 151 959
UK 20,452 262,720 438 229 - 41 11 68 120 567 88 171 1,040 2,653
Netherlands - - - - - - - - - - - - - -
Greece 9,726 90,989 193 141 - 12 20 31 63 279 49 54 99 878
Germany 19,743 221,724 167 138 - 37 25 65 127 437 84 35 264 1,253
Denmark 24,454 282,622 273 271 - 91 31 126 248 838 111 95 794 2,633
All 101,935 1,216,988 1,260 926 - 223 111 391 725 2,712 448 410 2,479 8,964
1CHD: Coronary heart disease [I20-I25] deaths; 2CVD: Cardiovascular disease [I00-I99 except I20-I25] deaths; 3UADT: deaths from upper aero-
digestive cancers (including cancer of the mouth [C01 to C10 without C08=salivary gland]), larynx [C21], pharynx [C11 to C14], oesophagus [C15]); 4Total frequency of alcohol related cancers; 5Other cancers: deaths from all other cancers; 6Violent deaths and injuries, including injury, poisoning and
certain other consequences of external causes [S00-T98], and external causes of morbidity and mortality [V01-Y98]; 7Resp=respiratory diseases [J00-
J99].
Page 25 of 71
For peer review only - http://bmjopen.bmj.com/site/about/guidelines.xhtml
BMJ Open
123456789101112131415161718192021222324252627282930313233343536373839404142434445464748495051525354555657585960
on March 11, 2020 by guest. Protected by copyright. http://bmjopen.bmj.com/ BMJ Open: first published as 10.1136/bmjopen-2014-005245 on 3 July 2014. Downloaded from

For peer review only
Table 2. Characteristics of the study population at recruitment, according to amount and type of alcohol intake (g/day) in the EPIC study1.
Lifetime drinkers
Characteristics Unit Never
drinkers 0.1-4.9 5-14.9 15-29.9 30-59.92 >602 Total3 Wine
consumers4 Beer
consumers4
Women
Number of participants n 25,146 112,281 77,147 27,179 6,042 - 247,795 85,965 8,748
Person-Years - 330,854 1,460,315 998,547 352,220 78,538 - 3,220,474 1,124,546 110,761
Age at recruitment Years 52 (9) 52 (10) 51 (10) 49 (11) 47 (11) - 51 (38-63) 52 (9) 46 (12)
Lifetime alcohol intake g/day 0 (-) 2 (2) 9 (3) 20 (4) 43 (21) - 7 (0-17) 12 (9) 11 (9)
Educational attainment5 % 14 22 27 33 37 - 25 28 28
Current smokers % 13 14 18 24 31 - 17 17 28
Body mass index kg/m2 27 (5) 25 (5) 25 (4) 24 (4) 24 (4) - 25 (20-31) 24 (4) 25 (4)
Height cm 158 (6) 161 (6) 162 (6) 163 (7) 164 (6) - 162 (153-170) 162 (6) 163 (7)
(Moderately) Active % 26 39 44 44 43 - 40 42 42
Ever use of HRT6 % 16 25 29 28 25 - 25 50 34
Post-menopausal status7 % 50 49 49 44 38 - 48 29 20
Energy intake kcal/day 1,848 (537) 1,943 (537) 2,015 (536) 2,090 (552) 2,195 (602) - 1978 (542) 2,046 (544) 1,976 (545)
Men
Number of participants n 1,600 14,287 28,875 28,049 20,788 8,336 101,935 26,137 22,136
Person-Years - 19,114 171,739 345,899 333,784 247,612 98,841 1,216,989 317,937 259,934
Age at recruitment Years 53 (11) 53 (11) 53 (9) 52 (9) 52 (9) 52 (9) 53 (41-64) 53 (9) 52 (10)
Lifetime alcohol intake g/day 0 (-) 2 (2) 10 (3) 22 (4) 42 (8) 94 (45) 25 (3-45) 30 (27) 22 (25)
Educational attainment5 % 21 30 31 32 26 14 29 22 27
Current smokers % 28 22 25 30 36 49 30 31 33
Body mass index kg/m2 27 (4) 26 (4) 26 (3) 27 (3) 27 (4) 28 (4) 27 (22-31) 27 (4) 27 (4)
Height cm 171 (7) 174 (7) 175 (7) 175 (7) 174 (7) 172 (7) 174 (165-183) 172 (7) 175 (7)
(Moderately) Active % 42 46 50 52 52 50 50 48 52
Energy intake kcal/day 2,284 (675) 2,267 (650) 2,315 (618) 2,417 (622) 2,569 (646) 2,789 (716) 2,427 (656) 2,487 (652) 2,369 (651)
1Means ± SDs are presented for continuous variables, frequencies for categorical variables; 2In women the last alcohol category is ≥30g/day; 3For continuous variables (with exception of energy intake), mean (10th-90th percentile) values are reported; 4Study subjects consuming more than 10 g/day of wine (or beer), and consuming less than 3 g/day of beer (or wine); 5Subjects with a university degree or more; 6HRT=hormonal replacement therapy; 7Post-menopausal women plus women who underwent an ovariectomy.
Page 26 of 71
For peer review only - http://bmjopen.bmj.com/site/about/guidelines.xhtml
BMJ Open
123456789101112131415161718192021222324252627282930313233343536373839404142434445464748495051525354555657585960
on March 11, 2020 by guest. Protected by copyright. http://bmjopen.bmj.com/ BMJ Open: first published as 10.1136/bmjopen-2014-005245 on 3 July 2014. Downloaded from

For peer review only
Figure 1. Number of deaths, person-years (PY) and multivariable hazard ratios1 (HR) with 95% confidence intervals (CI) and p-value of the Wald test for statistical significance for overall and cause-specific mortality by categories of lifetime alcohol use, in women and men.
(Women) (Men)
1Models were stratified by center. Systematic adjustment was undertaken for age at recruitment, BMI and height, former drinking, time since alcohol quitting, smoking status, duration of smoking, age at start smoking, educational attainment, and energy intake. In women adjustment was undertaken for menopausal status, ever use of replacement hormones, and number of full term pregnancies.
Page 27 of 71
For peer review only - http://bmjopen.bmj.com/site/about/guidelines.xhtml
BMJ Open
123456789101112131415161718192021222324252627282930313233343536373839404142434445464748495051525354555657585960
on March 11, 2020 by guest. Protected by copyright. http://bmjopen.bmj.com/ BMJ Open: first published as 10.1136/bmjopen-2014-005245 on 3 July 2014. Downloaded from

For peer review only
Table 3. Sex-specific number of deaths, hazard ratios (HR)1 and 95%CI for overall mortality by categories of lifetime alcohol use (g/day), by smoking status (never
and current smokers), and type of alcoholic beverage.
Women Men
Never smokers Current smokers Never smokers Current smokers
deaths HR2 (95% CI) deaths HR2 (95% CI) pheterog3 deaths HR2 (95% CI) deaths HR2 (95% CI) pheterog
3
Overall Overall Never 1,009 1.34 (1.24, 1.45) 154 1.72 (1.32, 2.23) Never 84 1.50 (1.19, 1.21) 58 2.09 (1.26, 3.47)
0.1-4.9 3,046 1 Ref 1,021 1.53 (1.23, 1.90) 0.1-4.9 457 1 Ref 367 1.62 (1.04, 2.53) 5-14.9 1,550 1.04 (0.98, 1.11) 874 1.51 (1.21, 1.88) 5-14.9 538 0.93 (0.82, 1.06) 799 1.45 (0.93, 2.25) 15-29.9 397 1.04 (0.94, 1.16) 435 1.74 (1.38, 2.19) 15-29.9 369 1.00 (0.87, 1.16) 927 1.66 (1.06, 2.58) ≥ 30 82 1.29 (1.03, 1.61) 140 2.08 (1.59, 2.73) 30-59.9 254 1.22 (1.23, 1.43) 857 1.83 (1.17, 2.84) pWald
4 <0.001 <0.001 0.150 ≥ 60 107 1.56 (1.25, 1.95) 590 2.43 (1.55, 3.80)
pWald4 <0.001 <0.001 0.864
Wine use Beer use Wine use Beer use
deaths HR5 (95% CI) deaths HR5 (95% CI) pdifference6 deaths HR5 (95% CI) deaths HR5 (95% CI) pdifference
6
Overall Overall Never 2,156 1.15 (1.09, 1.22) 5,041 1.06 (1.02, 1.12) Never 1,064 1.21 (1.12, 1.30) 975 1.07 (0.98, 1.16) 0.1-2.9 5,109 1 Ref 5,477 1 Ref 0.1-2.9 3,266 1 Ref 2,959 1 Ref 3-9.9 2,813 0.96 (0.92, 1.01) 787 1.15 (1.07, 1.24) 3-9.9 2,139 0.92 (0.87, 0.97) 2,486 1.04 (0.98, 1.10) 10-19.9 1,057 1.00 (0.93, 1.07) 147 1.50 (1.27, 1.77) 10-19.9 1,040 0.96 (0.89, 1.03) 1,248 1.12 (1.04, 1.20) ≥ 20 354 1.14 (1.02, 1.27) 37 1.47 (1.06, 2.04) 20-39.9 814 1.03 (0.95, 1.13) 877 1.41 (1.30, 1.54) pWald
4 <0.001 <0.001 <0.001 ≥ 40 641 1.22 (1.10, 1.35) 419 1.86 (1.66, 2.09) pWald
4 <0.001 <0.001 <0.001
1Models were stratified by center. Systematic adjustment was undertaken for age at recruitment, BMI and height, former drinking, time since alcohol
quitting, smoking status, duration of smoking, age at start smoking, educational attainment, and energy intake. In women adjustment was undertaken
for menopausal status, ever use of replacement hormones, and number of full term pregnancies; 2Models included interaction terms between lifetime
alcohol use and a smoking indicator (0=never smokers; 1=current smokers), keeping the reference category the group of moderate alcohol users (0.1-
4.9 g/day) among never smokers, whereas former smokers and subjects with unknown smoking status were excluded; 3pheterogeneity: difference in HRs
assessed comparing the log-likelihood of models with and without interaction terms between alcohol and smoking status to a 4 and 5 degrees of
freedom (dof) chi-square distribution, in women and men respectively; 4pWald: determined using a Wald test for contrasts according to a chi-square
distribution with 4 and 5 dof, in women and men respectively; 5Models on wine and beer uses were mutually adjusted, and also included spirits/liquors
use; 6pdifference expresses the difference of associations between wine and beer use, determined evaluating the significance of the parameter estimate γ2
in a model that included, other than the list of confounders, the terms γ1·(X1+X2)/2 + γ2·(X1-X2)/2, with X1=log(wine use+1) and X2=log(beer use+1).
Page 28 of 71
For peer review only - http://bmjopen.bmj.com/site/about/guidelines.xhtml
BMJ Open
123456789101112131415161718192021222324252627282930313233343536373839404142434445464748495051525354555657585960
on March 11, 2020 by guest. Protected by copyright. http://bmjopen.bmj.com/ BMJ Open: first published as 10.1136/bmjopen-2014-005245 on 3 July 2014. Downloaded from
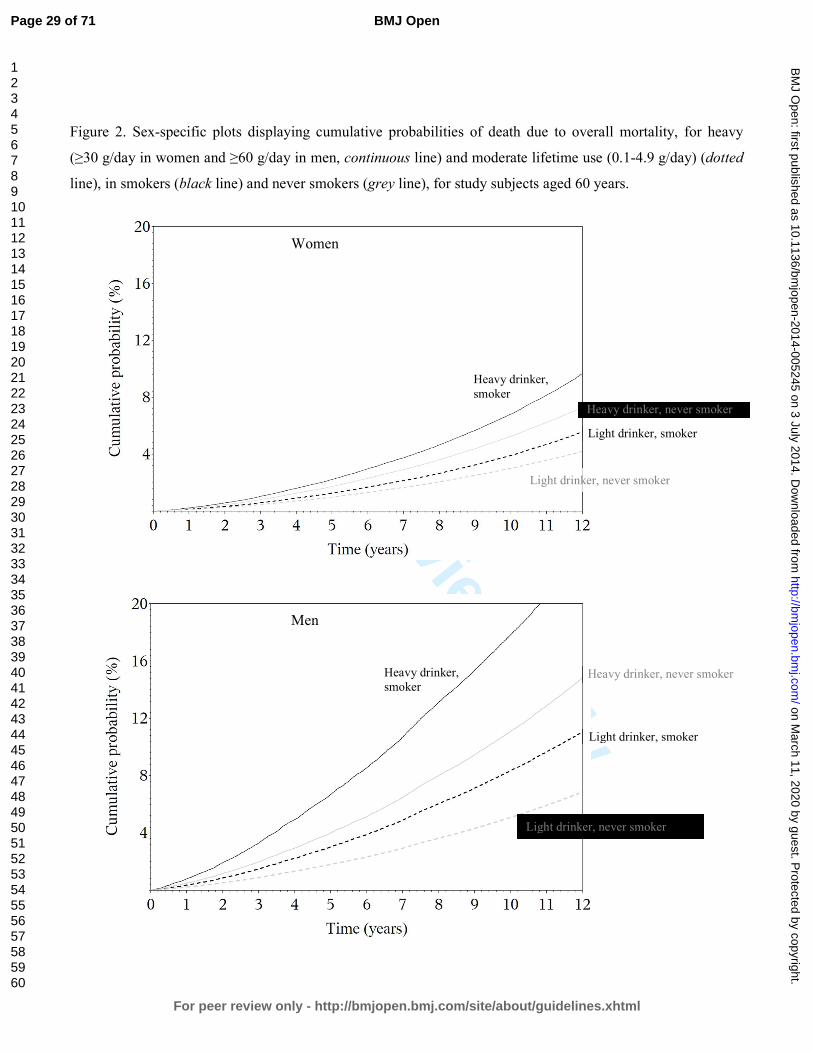
For peer review only
Figure 2. Sex-specific plots displaying cumulative probabilities of death due to overall mortality, for heavy
(≥30 g/day in women and ≥60 g/day in men, continuous line) and moderate lifetime use (0.1-4.9 g/day) (dotted
line), in smokers (black line) and never smokers (grey line), for study subjects aged 60 years.
Women
Men
Heavy drinker, smoker
Light drinker, never smoker
Heavy drinker, never smoker
Light drinker, smoker
Heavy drinker, smoker
Light drinker, never smoker
Heavy drinker, never smoker
Light drinker, smoker
Page 29 of 71
For peer review only - http://bmjopen.bmj.com/site/about/guidelines.xhtml
BMJ Open
123456789101112131415161718192021222324252627282930313233343536373839404142434445464748495051525354555657585960
on March 11, 2020 by guest. P
rotected by copyright.http://bm
jopen.bmj.com
/B
MJ O
pen: first published as 10.1136/bmjopen-2014-005245 on 3 July 2014. D
ownloaded from

For peer review only
Figure 3. In competing risks analyses, sex-specific plots displaying cumulative probabilities of death due to
CVD/CHD (red), alcohol related cancers (blue), and violent death and injuries (green), for study subjects aged
60 years according to heavy (≥30 g/day in women and ≥60 g/day in men, continuous line) and moderate (0.1-
4.9 g/day, dotted lines) lifetime alcohol use in current and never smokers in the EPIC study.
Women
Smokers Never smoker Men Smokers Never smoker
Page 30 of 71
For peer review only - http://bmjopen.bmj.com/site/about/guidelines.xhtml
BMJ Open
123456789101112131415161718192021222324252627282930313233343536373839404142434445464748495051525354555657585960
on March 11, 2020 by guest. P
rotected by copyright.http://bm
jopen.bmj.com
/B
MJ O
pen: first published as 10.1136/bmjopen-2014-005245 on 3 July 2014. D
ownloaded from

For peer review only
Table 4. Sex-specific estimates of rate advancement period (RAP) and associated 95%CI for overall and
mortality due to ARCs, CVD/CHD and injuries and violent deaths, related to two scenarios of lifetime
alcohol use. RAP estimates express the impact of a given exposure on the risk of death, by determining the
time (in years) by which the risk of death is anticipated for study subjects exposed, e.g. all drinkers more
than the threshold (5 or 15 g/day in Scenario I and II, respectively), compared to non-exposed, i.e.
individuals drinking between 0.1 g/day and the threshold.
Scenario I Scenario II
Threshold: 5 g/day Threshold: 15 g/day
RAP (years)
95%CI RAP (years)
95%CI
Women Overall 0.36 -0.05, 0.76 0.83 0.26, 1.39
CVD/CHD 0.23 -0.46, 0.92 0.08 -0.96, 1.14 Alcohol related cancers 1.28 -0.86, 3.41 1.90 -1.00, 4.81 Injuries and violent deaths -2.69 -6.85, 1.47 -0.20 -5.85, 5.46
Men Overall 0.15 -0.48, 0.76 1.42 0.96, 1.89
CVD/CHD -0.53 -1.57, 0.50 -0.01 -0.82, 0.81 Alcohol related cancers 2.59 -0.30, 5.49 5.03 3.07, 7.00 Injuries and violent deaths 7.59 -2.82, 18.02 11.83 3.92, 18.17
1Never lifetime alcohol users did not enter into the estimation process.
Page 31 of 71
For peer review only - http://bmjopen.bmj.com/site/about/guidelines.xhtml
BMJ Open
123456789101112131415161718192021222324252627282930313233343536373839404142434445464748495051525354555657585960
on March 11, 2020 by guest. P
rotected by copyright.http://bm
jopen.bmj.com
/B
MJ O
pen: first published as 10.1136/bmjopen-2014-005245 on 3 July 2014. D
ownloaded from

For peer review only
Lifetime alcohol use and overall and cause-specific mortality in the European
Prospective Investigation into Cancer and nutrition (EPIC) study.
Pietro FERRARI1, Idlir LICAJ1, David C MULLER1, Per Kragh ANDERSEN2, Mattias
JOHANSSON1, Heiner BOEING3, Elisabete WEIDERPASS4,5,6,7, Laure DOSSUS8,9,10,
Laureen DARTOIS8,9,10, Guy FAGHERAZZI8,9,10, Kathryn E BRADBURY11, Kay-Tee
KHAW12, Nick WAREHAM13, Eric J DUELL14, Aurelio BARRICARTE15,16, Esther
MOLINA-MONTES17,18, Carmen NAVARRO SANCHEZ18,19,20, Larraitz ARRIOLA16,21,
Peter WALLSTRÖM22, Anne TJØNNELAND23, Anja OLSEN23, Antonia
TRICHOPOULOU24,25, Vasiliki BENETOU24, Dimitrios TRICHOPOULOS25,26,27, Rosario
TUMINO28, Claudia AGNOLI29, Carlotta SACERDOTE30,31, Domenico PALLI32, Kuanrong
LI33, Rudolf KAAKS33, Petra PEETERS34, Joline WJ BEULENS34, Luciana NUNES1,35,
Marc GUNTER36, Teresa NORAT36, Kim OVERVAD37,38, Paul BRENNAN1, Elio
RIBOLI36, Isabelle ROMIEU1.
Author Affiliations:
1International Agency for Research on Cancer, Lyon, France. 2Department of Biostatistics, University of Copenhagen, Copenhagen, Denmark. 3German Institute of Human Nutrition, Potsdam-Rehbrücke Department of Epidemiology,
Nuthetal, Germany. 4Department of Community Medicine, Faculty of Health Sciences, University of Tromso,
The Arctic University of Norway, Tromsø, Norway. 5Department of Research, Cancer Registry of Norway, Oslo, Norway. 6Department of Medical Epidemiology and Biostatistics, Karolinska Institutet, Stockholm,
Sweden. 7Samfundet Folkhälsan, Helsinki, Finland. 8Inserm, Centre for research in Epidemiology and Population Health (CESP), U1018,
Nutrition, Hormones and Women’s Health team, F-94805, Villejuif, France. 9Université Paris Sud, UMRS 1018, F-94805, Villejuif, France. 10IGR, F-94805, Villejuif, France. 11Cancer Epidemiology Unit, Nuffield Department of Population Health, University of
Oxford, UK.
Page 32 of 71
For peer review only - http://bmjopen.bmj.com/site/about/guidelines.xhtml
BMJ Open
123456789101112131415161718192021222324252627282930313233343536373839404142434445464748495051525354555657585960
on March 11, 2020 by guest. P
rotected by copyright.http://bm
jopen.bmj.com
/B
MJ O
pen: first published as 10.1136/bmjopen-2014-005245 on 3 July 2014. D
ownloaded from

For peer review only
12the Department of Public Health and Primary Care, University of Cambridge
Addenbrooke’s Hospital, Cambridge, United Kingdom. 13the Medical Research Council Epidemiology Unit, Institute of Metabolic Science,
Addenbrooke’s Hospital, Cambridge, United Kingdom; 14Unit of Nutrition, Environment and Cancer, Cancer Epidemiology Research Program
Bellvitge Biomedical Research Institute (IDIBELL), Catalan Institute of Oncology (ICO),
Barcelona, Spain. 15Navarre Public Health Institute, Pamplona, Spain. 16Consortium for Biomedical Research in Epidemiology and Public Health (CIBER
Epidemiología y Salud Pública-CIBERESP), Spain. 17Escuela Andaluza de Salud Pública. Instituto de Investigación Biosanitaria de Granada,
Granada, Spain. 18CIBER Epidemiología y Salud Pública (CIBERESP), Spain. 19Department of Epidemiology, Murcia Regional Health Council, Murcia, Spain. 20Department of Health and Social Sciences, Universidad de Murcia, Spain. 21Public Health Division of Gipuzkoa, Instituto BIO-Donostia, Basque Government. Spain. 22Nutrition Epidemiology Research Group, Department of Clinical Sciences, Lund University,
Malmö, Sweden. 23Danish Cancer Society Research Center, Copenhagen, Denmark. 24WHO Collaborating Center for Food and Nutrition Policies, Department of Hygiene,
Epidemiology and Medical Statistics, University of Athens Medical School, Athens, Greece. 25Hellenic Health Foundation, Athens, Greece. 26Department of Epidemiology, Harvard School of Public Health, Boston, MA, USA. 27Bureau of Epidemiologic Research, Academy of Athens, Athens, Greece. 28Cancer Registry and Histopathology Unit, "Civic- M.P.Arezzo" Hospital, ASP Ragusa,
Italy. 29Epidemiology and Prevention Unit, Fondazione IRCCS Istituto Nazionale dei Tumori,
Milan, Via Venezian, 1, 20133 Milan, Italy. 30Unit of Cancer Epidemiology, AO Citta' della Salute e della Scienza-University of Turin
and Center for Cancer Prevention (CPO-Piemonte), Via Santena 7, 10126 Turin, Italy. 31Human Genetics Foundation (HuGeF), Via Nizza 52, 10126 Turin, Italy. 32Molecular and Nutritional Epidemiology Unit, Cancer Research and Prevention Institute –
ISPO, Florence, Italy.
Page 33 of 71
For peer review only - http://bmjopen.bmj.com/site/about/guidelines.xhtml
BMJ Open
123456789101112131415161718192021222324252627282930313233343536373839404142434445464748495051525354555657585960
on March 11, 2020 by guest. P
rotected by copyright.http://bm
jopen.bmj.com
/B
MJ O
pen: first published as 10.1136/bmjopen-2014-005245 on 3 July 2014. D
ownloaded from

For peer review only
33the Department of Cancer Epidemiology, German Cancer Research Centre, Heidelberg,
Germany. 34Department of Epidemiology, Julius Center for Health Sciences and Primary Care,
University Medical Center, Utrecht, The Netherlands. 35Department of Statistics, Federal University of Rio Grande do Sul, Porto Alegre, Brazil. 36Department of Epidemiology & Biostatistics, School of Public Health, Imperial College
London, London, United Kingdom. 37Department of Public Health, Section for Epidemiology, Aarhus University, Aarhus,
Denmark. 38Department of Cardiology, Aalborg University Hospital, Aalborg, Denmark.
Corresponding Author:
Pietro Ferrari, PhD
Nutrition and Metabolism Section
International Agency for Research on Cancer
150, cours Albert Thomas, Lyon, France
Tel +33 472728031
Email: [email protected]
Abbreviations:
ARC: alcohol related cancers
CVD: cardiovascular diseases
CHD: coronary heart disease
HR: Hazard ratio
CI: Confidence Intervals
EPIC: European Prospective Investigation into Cancer and nutrition
Keywords: lifetime alcohol, smoking status, overall mortality.
Page 34 of 71
For peer review only - http://bmjopen.bmj.com/site/about/guidelines.xhtml
BMJ Open
123456789101112131415161718192021222324252627282930313233343536373839404142434445464748495051525354555657585960
on March 11, 2020 by guest. P
rotected by copyright.http://bm
jopen.bmj.com
/B
MJ O
pen: first published as 10.1136/bmjopen-2014-005245 on 3 July 2014. D
ownloaded from
For peer review only
Abstract (300 words)
Objectives. To investigate the role of factors that modulate the association between alcohol
and mortality, and to provide estimates of absolute risk of death.
Design. The European Prospective Investigation into Cancer and Nutrition (EPIC).
Setting. 23 centres in 10 countries.
Participants. 380,395 men and women, free of cancer, diabetes, heart attack or stroke at
enrolment, followed up for 12.6 years on average.
Main outcome measures. 20,453 fatal events, of which 2,053 alcohol related cancers (ARC,
including cancers of upper aero-digestive tract, liver, colorectal and female breast), 4,187
cardiovascular diseases (CVD/CHD), 856 violent deaths and injuries. Lifetime alcohol use
was assessed at recruitment.
Results. Hazard ratios comparing extreme drinkers (≥30 g/day in women and ≥60 g/day in
men) to moderate drinkers (0.1-4.9 g/day) were 1.27 (95%CI: 1.13,1.43) in women and 1.53
(1.39,1.68) in men. Strong associations were observed for ARC mortality, in men particularly,
and to for violent deaths and injuries, in men only. No associations were observed for
CVD/CHD mortality among drinkers, whereby hazard ratios were higher in never compared
to moderate drinkers. Overall mortality seemed to be more strongly related to beer than wine
use, particularly in men. The 10-year risks of overall death for women aged 60 years, drinking
more than 30 g/day was 5% and 7%, for never and current smokers, respectively.
Corresponding figures in men consuming more than 60 g/day were 11% and 18%, in never
and current smokers respectively. In competing risks analyses, mortality due to CVD/CHD
was more pronounced than ARC in men, while CVD/CHD and ARC mortality were of similar
magnitude in women.
Conclusions. In this large European cohort, alcohol use was positively associated with overall
mortality, ARC and violent death and injuries, but marginally to CVD/CHD. Absolute risks of
death observed in EPIC suggest that alcohol is an important determinant of total mortality.
Page 35 of 71
For peer review only - http://bmjopen.bmj.com/site/about/guidelines.xhtml
BMJ Open
123456789101112131415161718192021222324252627282930313233343536373839404142434445464748495051525354555657585960
on March 11, 2020 by guest. P
rotected by copyright.http://bm
jopen.bmj.com
/B
MJ O
pen: first published as 10.1136/bmjopen-2014-005245 on 3 July 2014. D
ownloaded from

For peer review only
Article summary
Strengths and limitations of this study
• This study was based on information on dietary and lifestyle exposure collected in a
large prospective investigation of European adults.
• Findings are based on 380,395 men and women (among whom 20,453 fatal events
occurred) for which information on lifetime alcohol use was available, allowing
separate consideration of former drinkers from and lifetime abstainers.
• Exclusion of study participants reporting a morbid condition at baseline, and
sensitivity analyses excluding the first three years of follow-up limited the chance that
reverse causality affected the findings.
• Although statistical models included many potentially relevant adjustment factors,
residual confounding might partially account for the observed associations.
• Average lifetime alcohol consumption was evaluated in this study, whereas it is
possible that specific drinking patterns in particular phases of life, as well as the effect
of binge drinking or drinking during meals, may also be of particular relevance for
mortality.
Page 36 of 71
For peer review only - http://bmjopen.bmj.com/site/about/guidelines.xhtml
BMJ Open
123456789101112131415161718192021222324252627282930313233343536373839404142434445464748495051525354555657585960
on March 11, 2020 by guest. P
rotected by copyright.http://bm
jopen.bmj.com
/B
MJ O
pen: first published as 10.1136/bmjopen-2014-005245 on 3 July 2014. D
ownloaded from

For peer review only
Introduction
Alcohol intake has been associated with an increased risk of death from a large list of morbid
conditions, including digestive tract conditions, liver cirrhosis, chronic pancreatitis,
hypertension, injuries and violence (1-3). In contrast, moderate alcohol drinking was
suggested to be associated with a reduction in cardiovascular disease (CVD) mortality (4;5).
As for cancer, the International Agency for Research on Cancer (IARC) and the World
Cancer Research Fund/American Institute for Cancer Research (WCRF/AICR) concluded that
alcohol use is associated with an increased risk to develop cancers of the upper aero-digestive
tract, liver, colorectal and female breast (6;7). It has been estimated that alcohol accounted for
about 2.7 million annual deaths and 3.8% of all deaths worldwide (8;9), but the impact of
alcohol on mortality is differential with respect to specific causes of diseases (3).
Within the European Prospective Investigation into Cancer and Nutrition (EPIC), a recent
work showed that heavy alcohol use was associated to a higher risk of death from alcohol-
related cancer, external causes and ‘other causes’, while no associations were observed for
coronary heart disease and other cardiovascular diseases (10).
In this work, we further investigated associations between alcohol use and overall and cause-
specific mortality were further investigated. Notably, potential variability of the relationships
with respect to smoking habits, the type of alcoholic beverages, and country was explored.
The cumulative probabilities of death were estimated for overall mortality and, in a competing
risks framework, for specific mortality causes with respect to levels of alcohol, separately in
men and women. Further, the burden of alcohol use in relation to a broad group of causes of
deaths was evaluated by means of overall estimates of rate advancement periods, with respect
to two alternative scenarios.
Page 37 of 71
For peer review only - http://bmjopen.bmj.com/site/about/guidelines.xhtml
BMJ Open
123456789101112131415161718192021222324252627282930313233343536373839404142434445464748495051525354555657585960
on March 11, 2020 by guest. P
rotected by copyright.http://bm
jopen.bmj.com
/B
MJ O
pen: first published as 10.1136/bmjopen-2014-005245 on 3 July 2014. D
ownloaded from

For peer review only
Methods
Study Population. EPIC is an on-going multi-centre study that has been described in detail
previously (11). From 1992 to 2000, 521,448 individuals, aged 25 to 70 years were recruited
in the surroundings of 23 centres in 10 European countries. Most of the participants were
recruited from the general population residing in a given geographic area, a town, or a
province. Exceptions were the cohorts of France (female members of a health insurance for
school employees), Utrecht (breast cancer screening attendees), Ragusa (blood donors and
their spouses), and Oxford (mainly vegetarian and healthy eaters). Some characteristics of the
study population in the different participating countries are reported in Table 1. Study
participants provided informed consent and completed questionnaires on their diet, lifestyle,
and medical history. The study was approved by the relevant ethical review boards of each
centre and the International Agency of Research on Cancer in Lyon, France (11).
Dietary and lifestyle assessment. Diet was assessed at enrolment using validated country- or
center-specific dietary questionnaires (DQ) designed to capture habitual consumption over the
preceding year. Lifetime alcohol consumption was assessed based on self-reported weekly
consumption of wine, beer, and liquor at ages 20, 30, 40, 50 years in the lifestyle
questionnaire. Information on lifetime alcohol consumption was available for approximately
76% of EPIC participants (12). Information on smoking status and duration, physical activity
during leisure time, prevalent conditions at baseline, educational attainment, anthropometric
measures and reproductive history was obtained using lifestyle questionnaires.
Assessment of causes of death. Vital status and information on cause and date of death were
ascertained using record linkage with cancer registries, boards of health, and death registries
(Denmark, Italy, The Netherlands, Spain, the United Kingdom), or by active follow-up
(France Germany, Greece). Data were coded using the 10th revision of the International
Page 38 of 71
For peer review only - http://bmjopen.bmj.com/site/about/guidelines.xhtml
BMJ Open
123456789101112131415161718192021222324252627282930313233343536373839404142434445464748495051525354555657585960
on March 11, 2020 by guest. P
rotected by copyright.http://bm
jopen.bmj.com
/B
MJ O
pen: first published as 10.1136/bmjopen-2014-005245 on 3 July 2014. D
ownloaded from

For peer review only
Statistical Classification of Diseases, Injuries and Causes of Death (ICD-10) where the
underlying cause is the official cause of death.
In this work, six different causes of deaths were selected: cardiovascular disease (CVD) [I00-
I99 excluding I20-I25] and coronary heart disease (CHD) [I20-I25], alcohol related cancer
(ARC), including colorectal cancer [C18- C20], female breast cancer [C50], upper aero-
digestive cancers (UADT, including cancer of the mouth [C01 to C10 without C08=salivary
gland], larynx [C21], pharynx [C11 to C14], oesophagus [C15]), violent deaths and injuries
(Injury, poisoning and certain other consequences of external causes [S00-T98]; deaths due to
respiratory diseases [J00-J99]; a group for all other causes (including external causes of
morbidity and mortality [V01-Y98], unknown causes [R96-R99]).
Statistical analyses. Participants from Denmark (Aarhus, Copenhagen), France, Germany
(Heidelberg, Potsdam), Greece, Italy (Florence, Varese, Ragusa, Turin), the Netherlands
(Utrecht), Spain (Asturias, Granada, Murcia, Navarra, San Sebastian), and the United
Kingdom (Cambridge, Oxford), were eligible for this analysis. We excluded the entire cohorts
of Naples (Italy), Bilthoven (The Netherlands), Sweden and Norway because no information
on past alcohol use was collected (n=118,082). Further exclusions concerned participants with
incomplete vital status information (n=928), who had not filled out the dietary or lifestyle
questionnaires (n=11,411), and participants whose ratio of energy intake to estimated energy
requirement (n=7,592), calculated in terms of gender, body weight, height, and age, was in the
top or bottom 1% in order to partially reduce the impact of outlier values (13). Participants
that at recruitment reported a cancer (n=13,283), diabetes (n=11,240), myocardial infarction
or heart disease (n=5,266) or stroke (n=3,246) were excluded from the analyses (n= 30,665 in
total).
Cox proportional hazards models were used to compute mortality hazard ratios (HR), and
95% confidence intervals, for categories of average lifetime alcohol use; never drinkers, 1–4.9
Page 39 of 71
For peer review only - http://bmjopen.bmj.com/site/about/guidelines.xhtml
BMJ Open
123456789101112131415161718192021222324252627282930313233343536373839404142434445464748495051525354555657585960
on March 11, 2020 by guest. P
rotected by copyright.http://bm
jopen.bmj.com
/B
MJ O
pen: first published as 10.1136/bmjopen-2014-005245 on 3 July 2014. D
ownloaded from

For peer review only
g/day (reference category), 5–14.9, 15–29.9, 30–59.9, ≥60 g/day. In women, the last two
alcohol categories were collapsed into a ≥30 g/day group. Time in the study up to death, loss
or end of follow-up, whichever came first was the primary time variable. The Breslow method
was adopted for handling ties. Models were stratified by center to control for differences in
questionnaire design, follow-up procedures, and other center-specific effects (13). Systematic
adjustments were undertaken for age at recruitment, and other lifestyle factors Systematic
adjustments were undertaken for age at recruitment, BMI and height (continuous), an
indicator for participants that quitted alcohol drinking, time since alcohol quitting
(continuous), smoking (never, current with 1 to 15 cigarettes/day, current with more than 15
cigarettes/day, former smoker that quitted less than 10 years before recruitment, former
smoker that quitted more than 10 years before recruitment, current smoker of other than
cigarettes, unknown [n=8,819]), duration of smoking (continuous), age at start smoking (less
than 19 years, more than 19 years, unknown [n=39,041]), educational attainment (five
categories of level of schooling: none, primary, technical, or degree or more, unknown
[n=14,223]) as a proxy variable for socioeconomic status, physical activity (inactive,
moderately inactive, moderately active, active, unknown [n=328]), and energy intake
(continuous). In women the models were further adjusted for menopausal status
(dichotomized as natural postmenopausal or surgical versus pre- or peri-menopausal, as
assessed at baseline), ever use of replacement hormones, and number of full term pregnancies
(nulliparous, 1 or 2 children, more than three, unknown [n=6,482]). Indicator variables
specific to some of the confounding factors were used to model missing values, after checking
that the parameters associated with these indicators were not statistically significantly
associated with risk of death.
Models for overall and cause-specific mortality were fitted, separately for men and women.
An overall test of significance of HRs related to alcohol use was determined by computing p-
Page 40 of 71
For peer review only - http://bmjopen.bmj.com/site/about/guidelines.xhtml
BMJ Open
123456789101112131415161718192021222324252627282930313233343536373839404142434445464748495051525354555657585960
on March 11, 2020 by guest. P
rotected by copyright.http://bm
jopen.bmj.com
/B
MJ O
pen: first published as 10.1136/bmjopen-2014-005245 on 3 July 2014. D
ownloaded from

For peer review only
values (pWald) for Wald test statistics compared to a chi-square distribution with degrees of
freedom equal to the number of alcohol categories minus one. The proportional hazards
assumption in the Cox model was satisfied and evaluated via inclusion into the disease model
of interaction terms between lifetime alcohol and follow-up time. To reduce the chance of
reverse causality, sensitivity analyses were run excluding the first three years of follow-up. As
results were not different from those using the entire cohort, they were not shown. Analyses
excluding former drinkers (4% and 5% of the study populations, in men and women
respectively) provided very similar results (results not shown).
Evaluating heterogeneity. Effect modification in the relations between alcohol and mortality
by, in turn, smoking status (never, ever), smoking status (never and current smokers), and
recruitment country was assessed. Models with main effects and interaction terms were fitted
and compared to models with main effects only. The difference in log-likelihood (likelihood
ratio test statistics) was compared to a chi-square distribution with degrees of freedom equal
to the number of interaction terms. HRs for alcohol categories across levels of interacting
variables were computed as linear combinations of main effects and interactions. Associations
with wine and beer uses (each grouped as never, 0.1-2.9 g/day (reference), 3-9.9, 10-19.9, 20-
39.9, ≥40 g/day, ≥20 g/day in women) and total mortality were assessed in mutually adjusted
models. The difference of association for wine and beer use in relation to overall mortality
was assessed by inspecting the significance of the parameter related to the arithmetic
difference of wine and beer use (expressed on the log-scale plus 1 to deal with abstainers) in a
model that also included their arithmetic sum. When assessing the association for wine (beer)
intake, analyses were restricted to moderate lifetime drinkers of beer (wine) and spirits (below
3 g/day).
Flexible parametric survival models (14) with age as the time-scale were used to evaluate
whether the association between alcohol intake and mortality rate varied by attained age. The
Page 41 of 71
For peer review only - http://bmjopen.bmj.com/site/about/guidelines.xhtml
BMJ Open
123456789101112131415161718192021222324252627282930313233343536373839404142434445464748495051525354555657585960
on March 11, 2020 by guest. P
rotected by copyright.http://bm
jopen.bmj.com
/B
MJ O
pen: first published as 10.1136/bmjopen-2014-005245 on 3 July 2014. D
ownloaded from

For peer review only
origin of the time-scale was set to 30 years as the hazard of death is essentially zero prior to
that age. The baseline cumulative hazard was modeled using restricted cubic splines with
three internal knots placed at evenly spaced centiles of the uncensored log-survival times in
order to ensure that an equivalent number of deaths occurred between each knot (15).
Interactions between alcohol intake and the time scale were modeled using restricted cubic
splines with one knot placed at the median of uncensored log-survival times. HRs and
differences in survival functions were calculated from the fitted models and plotted against
attained age, along with confidence intervals calculated based on delta method variance
estimates.
Possible departures from linearity in the association between average lifetime alcohol use and
total mortality were assessed using fractional polynomials (16), a subset of generalized linear
models in which various powers (−2, −1, −0.5, 0, 0.5, 1, 2, 3) of the covariate(s) of interest
are entered into the linear predictor. Fractional polynomials of order two were consistently
used in this work for lifetime alcohol use (17). Non-linearity was tested comparing the
difference in log-likelihood of a model with the fractional polynomials with a model with a
linear term only to a chi-square distribution with three degrees of freedom (16).
Absolute risks. An extension of the Cox proportional hazards model was employed to fit
cause- specific associations between lifetime alcohol use and cause-specific mortality in a
competing risks framework (18). An augmented dataset was created where the initial dataset
is replicated a number of times equal to the different causes of death. In each replicated
dataset, competing causes of death were set to censored observations, and the analyses were
stratified by the event type (19). The relationship between each confounder variables and
cause-specific mortality was assumed homogenous across causes of death. In this way
competing risks was accounted for, and cumulative cause-specific and overall mortality
curves were estimated for heavy (greater than 30 and 60 g/day, in women and men
Page 42 of 71
For peer review only - http://bmjopen.bmj.com/site/about/guidelines.xhtml
BMJ Open
123456789101112131415161718192021222324252627282930313233343536373839404142434445464748495051525354555657585960
on March 11, 2020 by guest. P
rotected by copyright.http://bm
jopen.bmj.com
/B
MJ O
pen: first published as 10.1136/bmjopen-2014-005245 on 3 July 2014. D
ownloaded from

For peer review only
respectively) and moderate (0.1 to 4.9 g/day) drinkers, separately for never and current
smokers (20). Cumulative mortality curves were obtained for participants aged 60 years,
using mean values for continuous confounding factors, and average frequencies for
categorical confounders.
Quantifying the alcohol burden. The burden of alcohol on mortality was quantified with
estimates of the rate advancement period (RAP) (21), according to two scenarios with
threshold levels equal to 5 and 15 g/day. For overall and cause-specific risk of death, RAP
were computed, dividing the log(HR) estimate comparing alcohol users above and the
threshold with alcohol drinkers between 0.1 g/day and the threshold, by the log of the
parameter associated with age. Never alcohol users were not included in the estimation.
Associated 95% confidence intervals were also determined. RAP estimates express the impact
of a given exposure on the risk of death, by determining the time (in years) by which the risk
of death is anticipated for exposed study participants compared to non-exposed.
Statistical tests were two-sided, and p-values <0.05 were considered statistically significant.
All analyses were performed using SAS 9.2 (22) and Stata 12.1 (23).
Results
Baseline characteristics. The current analysis was based on 247,795 female and 101,935 male
study participants. The median age at enrolment was 52 years for women and 53 years for
men. Study participants were foll owed on average 12.6 years, accumulating 4,800,585
person-years, during which a total of 20,453 fatal events were recorded (Table 1).
Drinking patterns differed substantially between men and women (Table 2). In women, 10%
(n=25,146) of participants were lifetime never drinkers, while 45% (n=112,281) and 2%
(n=6,042) were moderate (0.1 to 4.9 g/day) and heavy users (>30g/day), respectively.
Conversely, only 1.5% (n=1,600) of men reported having never consumed alcohol, 14%
Page 43 of 71
For peer review only - http://bmjopen.bmj.com/site/about/guidelines.xhtml
BMJ Open
123456789101112131415161718192021222324252627282930313233343536373839404142434445464748495051525354555657585960
on March 11, 2020 by guest. P
rotected by copyright.http://bm
jopen.bmj.com
/B
MJ O
pen: first published as 10.1136/bmjopen-2014-005245 on 3 July 2014. D
ownloaded from

For peer review only
(n=14,287) were moderate drinkers, whilst 29% (n=29,124) were heavy or extreme drinkers
(30 to 59.9 and ≥60 g/day). Furthermore, the vast majority of women who were regular
drinkers (total alcohol intake ≥10g/day) drank predominantly wine (91%), rather than beer
(9%), whilst regular drinkers in men drank beer (46%) and wine (54%) in similar proportion.
Compared to never and moderate drinkers, women with higher alcohol use had higher levels
of education and physical activity, and were more likely to be current smokers, or pre-/peri-
menopausal. Never alcohol users were less likely to have used hormonal replacement therapy
than alcohol drinkers. In men, the trends were somewhat less apparent. Heavy and extreme
alcohol users (≥30 g/day) were more often current smokers, attained lower educational level,
and had higher energy intake levels, compared to moderate drinkers. Never drinkers were
physically less active than alcohol drinkers.
Lifetime alcohol and total mortality. Lifetime average alcohol use was strongly associated
with total mortality, in that both never and heavy drinkers (≥30 g/day) had notably higher
mortality rates than did light to moderate drinkers (0.1-4.9 g/day), a pattern that was
consistently apparent among female and male study participants (Figure 1). The HR
comparing never and heavy drinkers to moderate drinkers in women was 1.26 (95% CI: 1.18-
1.35) and 1.27 (1.13-1.43), respectively. The corresponding HRs among men were 1.29 (1.10-
1.51) for never drinkers, 1.15 (1.06-1.24) for heavy drinkers and 1.53 (1.39-1.68) for extreme
drinkers (≥60 g/day).
Lifetime alcohol and cause specific mortality. In men, extreme alcohol use was associated
with mortality due to alcohol related cancers (HR≥60 vs ref = 2.62: 1.90, 3.62), other cancers
(1.34: 1.13, 1.59), violent deaths and injuries (1.93: 1.27, 2.91), and other causes (1.98: 1.67,
2.34). With the exception of the category for never drinkers, alcohol intake was not associated
with CVD or CHD mortality, both in women and men. Among women, heavy drinkers
displayed HR≥30 vs ref equal to 1.49 (1.07, 2.06) for alcohol related cancers. Respiratory
Page 44 of 71
For peer review only - http://bmjopen.bmj.com/site/about/guidelines.xhtml
BMJ Open
123456789101112131415161718192021222324252627282930313233343536373839404142434445464748495051525354555657585960
on March 11, 2020 by guest. P
rotected by copyright.http://bm
jopen.bmj.com
/B
MJ O
pen: first published as 10.1136/bmjopen-2014-005245 on 3 July 2014. D
ownloaded from
For peer review only
diseases were not associated with lifetime alcohol in women, while results were suggestive of
an increased risk in extreme alcohol users compared to moderate users in men
(Supplementary Figure 1). Dose–response relationships evaluated with fractional polynomials
are displayed in Supplementary Figures 2 and 3, for women and men respectively.
Evaluating heterogeneity. In both sexes, alcohol related HRs for overall mortality were of
similar magnitude in never and current smokers (Table 3). Analyses conducted by smoking
intensity (never vs. heavy smokers, i.e. more than 15 cigarettes/day) produced very similar
evidence (results not shown). Cause-specific analyses showed mostly homogeneous alcohol-
related HRs by smoking status (results not shown). In women, beer use was more strongly
related than wine to overall mortality for amounts greater than 3g/day compared to the
reference category (0.1 to 2.9 g/day). Lifetime never wine and beer users displayed higher
risks than moderate drinkers. The associations between lifetime alcohol and overall risk of
mortality were differential across country of origin in men (pheterogeneity=0.012) but not in
women (pheterogeneity=0.511), as reported in Supplementary Figures 4 and 5, with stronger
relationships observed in Northern European countries compared to Southern European
countries.
The HR≥60 vs ref for men was more pronounced at earlier ages, and were close to approached
one as attained age approached 90 years (plikelihood-ratio for age-varying versus age invariant
parameterization=0.003), however extreme male drinkers exhibited lower cumulative survival
probability than the reference group throughout the lifespan (Supplementary Figure 6). No
such age varying association was apparent for women (plikelihood-ratio=0.80).
Absolute risks. The 10-year risk of death at the age of 60 years for heavy drinkers was 5% and
7% in women (≥30 g/day), and 11% and 18% in men (≥60 g/day), for never and current
smokers, respectively (Figure 2). Corresponding figures in moderate drinkers (0.1 to 4.9
g/day) were 3% and 4% in women, and 5% and 8% in men. Based on a competing risks
Page 45 of 71
For peer review only - http://bmjopen.bmj.com/site/about/guidelines.xhtml
BMJ Open
123456789101112131415161718192021222324252627282930313233343536373839404142434445464748495051525354555657585960
on March 11, 2020 by guest. P
rotected by copyright.http://bm
jopen.bmj.com
/B
MJ O
pen: first published as 10.1136/bmjopen-2014-005245 on 3 July 2014. D
ownloaded from

For peer review only
analysis, it was estimated that, at the age of 60 years, a female lifetime heavy alcohol drinker
and smoker had a 10-years risk of death of 1.0% for ARC, 1.2% for CVD/CHD, and 0.2% for
violent death and injuries, as displayed in Figure 3. Corresponding figures for males (≥60
g/day) were 2.2% (ARC), 5.0% (CVD/CHD) and 1% (violent death and injuries). Risks for
moderate drinkers for ARC, CVD/CHD and violent death and injuries were 0.8%, 1.2%, 0.2%
and 0.9%, 4.0%, 0.3%, in women and men, respectively. Consistently lower risks were
observed for never smoker individuals, with estimates equal to 0.5%, 0.7% and 0.1% in
women, and 1%, 2.1% and 0.3% in men.
Rate advancement period. The impact of lifetime alcohol on overall and cause-specific
mortality was estimated with RAP values (Table 4). In women, RAP for overall mortality
were equal to 0.36 years (95%CI: -0.05, 0.76) and 0.83 (0.26, 1.39), for the 5 and 15 g/day
scenario, respectively. In men, RAP values were equal to 0.15 (-0.48, 0.76) and 1.42 (0.96,
1.89), for 5 and 15 g/day respectively. RAP values were sizeable for mortality due to alcohol
related cancer (5.03: 3.07, 7.00) and violent death and injuries (11.83: 3.92, 18.17) in the
second scenario.
Discussion
In this large European prospective study, the association between alcohol use and overall and
cause-specific risk of death was evaluated in eight European populations. When accounting
for potential confounding factors, average lifetime alcohol use was strongly associated with
overall mortality, whereas lifetime never alcohol users consistently displayed a higher risk of
death compared to moderate drinkers. These results are in agreement with a recent evaluation
of alcohol and cause-specific mortality in EPIC (10). With respect to this recent study (10),
further analyses were conducted to deeply investigate the role of factors that modulate the
Page 46 of 71
For peer review only - http://bmjopen.bmj.com/site/about/guidelines.xhtml
BMJ Open
123456789101112131415161718192021222324252627282930313233343536373839404142434445464748495051525354555657585960
on March 11, 2020 by guest. P
rotected by copyright.http://bm
jopen.bmj.com
/B
MJ O
pen: first published as 10.1136/bmjopen-2014-005245 on 3 July 2014. D
ownloaded from

For peer review only
association between alcohol use and the risk of death, notably smoking and types of alcohol
beverage. Estimates of 10-year risk of death in relation to levels of alcohol use were provided.
This study has several strengths. It was conducted using a large prospective cohort, where
dietary and lifestyle exposure information were collected on disease-free individuals.
Information on lifetime alcohol use was available on 76% of the cohort, allowing separate
consideration of former drinkers and lifetime abstainers. Further, exclusion of study
participants reporting a morbid condition at baseline, and sensitivity analyses excluding the
first three years of follow-up suggest that reverse causality is unlikely to have affected the
results. One potential weakness of this study is that, although statistical models included many
potentially relevant adjustment factors, residual confounding might partially account for the
observed associations. In addition, average lifetime alcohol consumption was used throughout
this study, whereby it is possible that specific drinking patterns in particular phases of life
(10), as well as the effect of binge drinking or drinking during meals may be of particular
relevance for mortality.
A recent Russian study found that a strong relationship between vodka and risk of death (24).
While an apparent J-shaped relationship between alcohol use and mortality has been reported
(25;26), the interpretation of this pattern is the subject of some controversy. It has been
suggested that alcohol abstinence does not truly entail greater risk of death than moderate use,
and that misclassification of alcohol quantity and lack of accuracy in reporting prevalent
morbid conditions at baseline in the group of never drinkers (27) could explain the excess
risks observed. This reasoning motivated our choice of considering moderate alcohol drinkers,
as the reference category throughout this work. Moreover, residual and unmeasured
confounding are plausible drivers of the association (28). These suggestions are supported by
our findings that never drinkers are at increased risk of death due to violence and injury. This
Page 47 of 71
For peer review only - http://bmjopen.bmj.com/site/about/guidelines.xhtml
BMJ Open
123456789101112131415161718192021222324252627282930313233343536373839404142434445464748495051525354555657585960
on March 11, 2020 by guest. P
rotected by copyright.http://bm
jopen.bmj.com
/B
MJ O
pen: first published as 10.1136/bmjopen-2014-005245 on 3 July 2014. D
ownloaded from

For peer review only
implausible association casts considerable doubt on the veracity of the apparent increased risk
of death among never drinkers.
The overall mortality hazard ratio for men with extreme versus moderate alcohol use was
greater at younger earlier ages, and approached one unity as age advances increased towards
90 years. This result reflects the comparatively low incidence of death through middle age.
Consideration of the absolute risk of death, however, suggests that moderate drinkers have a
substantial cumulative survival advantage over extreme drinkers throughout the adult lifespan.
It has been suggested that wine drinking could be more favourably associated than other
alcoholic beverages to the risk of CHD and some cancers (29-32). In this study beer use
displayed more apparent risk patterns than wine intakeconsumption, particularly in men.
Although we believe that this finding is relevant, we call for cautious interpretations of these
results, as the lifestyle profile of wine and beer drinkers is profoundly different. The
associations between alcohol and mortality were heterogeneous across countries in men, but
not in women. This could be due to the larger amount of alcohol consumed in men than in
women, naturally increasing the variability of exposure and the statistical power to detect
associations, and of the larger variability characterizing drinking habits in men, such as binge
drinking, drinking during meals and other societal aspects. Although no heterogeneity was
observed by smoking status, at all levels of alcohol intake the mortality among smokers was
higher than the mortality among non-smokers , so the absolute increase in risk associated with
alcohol intake is more extreme among smokers. This differential increase in cumulative
probability of death emphasises the central role of tobacco as a risk factor for mortality, as
well as the potential extra harm of increased alcohol consumption.
In the EPIC study, although associations with alcohol were mostly apparent for ARC and
violent death and injuries, absolute risks were highest for CVD/CHD in men, while
CVD/CHD and ARC risks were of similar magnitude in women. In general, as individuals
Page 48 of 71
For peer review only - http://bmjopen.bmj.com/site/about/guidelines.xhtml
BMJ Open
123456789101112131415161718192021222324252627282930313233343536373839404142434445464748495051525354555657585960
on March 11, 2020 by guest. P
rotected by copyright.http://bm
jopen.bmj.com
/B
MJ O
pen: first published as 10.1136/bmjopen-2014-005245 on 3 July 2014. D
ownloaded from

For peer review only
reporting a prevalent condition at recruitment (either cancer, diabetes, heart attack or stroke)
were excluded from the analysis in an effort to minimize reverse causality, our estimates of
absolute risks of death are possibly underestimated. RAP values were estimated to appreciate
the risk benefit of alcohol drinkers if they were to modify their exposure, according to a
counterfactual scenario (21;33). Consistently in men and women, RAP values for overall
mortality were larger when the reference category was set to 0.1 to 15 g/day than when using
a threshold of 5 g/day, thus indicating that, based on the EPIC study, the benefit for drinkers
could be largest if they reduced their intake is reduced to levels below 15 g/day. These results
are in line with findings of a recent work in the UK population, where the reduction of overall
mortality was estimated to be optimized for alcohol reduction up to a median population level
of 5 g/day (34).
In a large prospective study in Europe, lifetime alcohol intake was significantly associated
with both overall and ARC specific mortality. In men, positive associations were observed for
violent deaths and injuries, while CVD and CHD deaths were not associated with alcohol use
among drinkers. Our findings suggest that these associations do not differ between never and
current smokers, and were stronger for beer than for wine usedrinkers.
Page 49 of 71
For peer review only - http://bmjopen.bmj.com/site/about/guidelines.xhtml
BMJ Open
123456789101112131415161718192021222324252627282930313233343536373839404142434445464748495051525354555657585960
on March 11, 2020 by guest. P
rotected by copyright.http://bm
jopen.bmj.com
/B
MJ O
pen: first published as 10.1136/bmjopen-2014-005245 on 3 July 2014. D
ownloaded from

For peer review only
Funding statement
This work was supported by la the Direction Générale de la Santé (French Ministry of
Health), with contract (Grant GR-IARC-2003-09-12-01), by the European Commission
(Directorate General for Health and Consumer Affairs) and the International Agency for
Research on Cancer. The national cohorts are supported by the Danish Cancer Society
(Denmark); the Ligue Contre le Cancer, the Institut Gustave Roussy, the Mutuelle Générale
de l’Education Nationale, and the Institut National de la Santé et de la Recherche Médicale
(France); the Deutsche Krebshilfe, the Deutsches Krebsforschungszentrum, and the Federal
Ministry of Education and Research (Germany); the Hellenic Health Foundation, the Stavros
Niarchos Foundation, and the Hellenic Ministry of Health and Social Solidarity (Greece); the
Italian Association for Research on Cancer and the National Research Council (Italy); the
Dutch Ministry of Public Health, Welfare and Sports, the Netherlands Cancer Registry, LK
Research Funds, Dutch Prevention Funds, the Dutch Zorg Onderzoek Nederland, the World
Cancer Research Fund, and Statistics Netherlands (Netherlands); European Research Council-
2009-AdG 232997 and the Nordforsk, Nordic Centre of Excellence program on Food,
Nutrition and Health (Norway); the Health Research Fund, Regional Governments of
Andalucýa, Asturias, Basque Country, Murcia (project 6236) and Navarra, Instituto de Salud
Carlos III, Redes de Investigacion Cooperativa (RD06/0020) (Spain); the Swedish Cancer
Society, the Swedish Scientific Council, and the Regional Government of Skåne (Sweden);
Cancer Research UK, the Medical Research Council, the Stroke Association, the British Heart
Foundation, the Department of Health, the Food Standards Agency, and the Wellcome Trust
(United Kingdom). The work undertaken by David C Muller was done during the tenure of an
IARC, Australia postdoctoral fellowship, supported by the Cancer Council Australia.
Contributorship statement
Pietro FERRARI, Idlir LICAJ, Isabelle ROMIEU, Paul BRENNAN, Heiner BOEING
conceptualized the study and defined the analytical strategy. Pietro FERRARI and Idlir
LICAJ had full access to all the data in the study and take responsibility for the integrity of
the data and the accuracy of the data analysis. Pietro FERRARI, Idlir LICAJ, David C
MULLER, Per Kragh ANDERSEN, Luciana NUNES performed statistical analyses and
provided preliminary interpretation of findings. Pietro FERRARI, David C MULLER,
Mattias JOHANSSON, Idlir LICAJ, Paul BRENNAN contributed to draft the manuscript.
Elisabete WEIDERPASS, Laure DOSSUS, Laureen DARTOIS, Guy FAGHERAZZI,
Page 50 of 71
For peer review only - http://bmjopen.bmj.com/site/about/guidelines.xhtml
BMJ Open
123456789101112131415161718192021222324252627282930313233343536373839404142434445464748495051525354555657585960
on March 11, 2020 by guest. P
rotected by copyright.http://bm
jopen.bmj.com
/B
MJ O
pen: first published as 10.1136/bmjopen-2014-005245 on 3 July 2014. D
ownloaded from

For peer review only
Kathryn Erica BRADBURY, Kay-Tee KHAW, Eric Jeffrey DUELL, Aurelio
BARRICARTE, Esther MOLINA-MONTES, Carmen NAVARRO SANCHEZ, Larraitz
ARRIOLA, Peter WALLSTRÖM, Anne TJØNNELAND, Anja OLSEN, Antonia
TRICHOPOULOU, Vasiliki BENETOU, Dimitrios TRICHOPOULOS, Rosario TUMINO,
Claudia AGNOLI, Carlotta SACERDOTE, Domenico PALLI, Kuanrong LI, Rudolf KAAKS,
Petra PEETERS, Joline Wilhelma Johanna BEULENE, Marc GUNTER, Teresa NORAT,
Kim OVERVAD, Elio RIBOLI, Paul BRENNAN, and Isabelle ROMIEU played a key role in
the acquisition of the data, and were active in searching for funding to continue the study.
With respect to this work, they all critically helped in the interpretation of results, revised the
manuscript and provided relevant intellectual input.
Competing Interest Declaration
All authors have completed the Unified Competing Interest form at
www.icmje.org/coi_disclosure.pdf (available on request from the corresponding author). Dr.
Kathryn E BRADBURY reports grants from Cancer Research UK, during the conduct of the
study. The rest of the authors declared no support from any organisation for the submitted
work, no financial relationships with any organisations that might have an interest in the
submitted work in the previous three years, no other relationships or activities that could
appear to have influenced the submitted work.
Sharing statement
Statistical code is available from the corresponding author by emailing [email protected].
Page 51 of 71
For peer review only - http://bmjopen.bmj.com/site/about/guidelines.xhtml
BMJ Open
123456789101112131415161718192021222324252627282930313233343536373839404142434445464748495051525354555657585960
on March 11, 2020 by guest. P
rotected by copyright.http://bm
jopen.bmj.com
/B
MJ O
pen: first published as 10.1136/bmjopen-2014-005245 on 3 July 2014. D
ownloaded from

For peer review only
Reference List
(1) Thun MJ, Peto R, Lopez AD, Monaco JH, Henley SJ, Heath CW, Jr., et al. Alcohol consumption and mortality among middle-aged and elderly U.S. adults. N Engl J Med 1997 Dec 11;337(24):1705-14.
(2) Bagnardi V, Blangiardo M, La Vecchia C., Corrao G. A meta-analysis of alcohol drinking and cancer risk. Br J Cancer 2001 Nov 30;85(11):1700-5.
(3) Rehm J, Baliunas D, Borges GL, Graham K, Irving H, Kehoe T, et al. The relation between different dimensions of alcohol consumption and burden of disease: an overview. Addiction 2010 May;105(5):817-43.
(4) Corrao G, Bagnardi V, Zambon A, La VC. A meta-analysis of alcohol consumption and the risk of 15 diseases. Prev Med 2004 May;38(5):613-9.
(5) Ronksley PE, Brien SE, Turner BJ, Mukamal KJ, Ghali WA. Association of alcohol consumption with selected cardiovascular disease outcomes: a systematic review and meta-analysis. BMJ 2011;342:d671.
(6) IARC. Alcohol consumption and ethyl carbamate. 96 ed. IARC; 2010.
(7) WCRF/AICR. Food, nutrition, physical activity and the prevention of cancer: a global perspective. Washington DC: AICR; 2007.
(8) Rehm J, Mathers C, Popova S, Thavorncharoensap M, Teerawattananon Y, Patra J. Global burden of disease and injury and economic cost attributable to alcohol use and alcohol-use disorders. Lancet 2009 Jun 27;373(9682):2223-33.
(9) Lim SS, Vos T, Flaxman AD, Danaei G, Shibuya K, Adair-Rohani H, et al. A comparative risk assessment of burden of disease and injury attributable to 67 risk factors and risk factor clusters in 21 regions, 1990-2010: a systematic analysis for the Global Burden of Disease Study 2010. Lancet 2012 Dec 15;380(9859):2224-60.
(10) Bergmann MM, Rehm J, Klipstein-Grobusch K, Boeing H, Schutze M, Drogan D, et al. The association of pattern of lifetime alcohol use and cause of death in the European Prospective Investigation into Cancer and Nutrition (EPIC) study. Int J Epidemiol 2013 Dec;42(6):1772-90.
(11) Riboli E, Hunt KJ, Slimani N, Ferrari P, Norat T, Fahey M, et al. European Prospective Investigation into Cancer and Nutrition (EPIC): study populations and data collection. Public Health Nutr 2002 Dec;5(6B):1113-24.
(12) Ferrari P, Jenab M, Norat T, Moskal A, Slimani N, Olsen A, et al. Lifetime and baseline alcohol intake and risk of colon and rectal cancers in the European prospective investigation into cancer and nutrition (EPIC). Int J Cancer 2007 Nov 1;121(9):2065-72.
(13) Ferrari P, Day NE, Boshuizen HC, Roddam A, Hoffmann K, Thiebaut A, et al. The evaluation of the diet/disease relation in the EPIC study: considerations for the calibration and the disease models. Int J Epidemiol 2008 Apr;37(2):368-78.
Page 52 of 71
For peer review only - http://bmjopen.bmj.com/site/about/guidelines.xhtml
BMJ Open
123456789101112131415161718192021222324252627282930313233343536373839404142434445464748495051525354555657585960
on March 11, 2020 by guest. P
rotected by copyright.http://bm
jopen.bmj.com
/B
MJ O
pen: first published as 10.1136/bmjopen-2014-005245 on 3 July 2014. D
ownloaded from

For peer review only
(14) Royston P, Parmar MK. The use of restricted mean survival time to estimate the treatment effect in randomized clinical trials when the proportional hazards assumption is in doubt. Stat Med 2011 Aug 30;30(19):2409-21.
(15) Heinzl H, Kaider A. Gaining more flexibility in Cox proportional hazards regression models with cubic spline functions. Comput Methods Programs Biomed 1997 Nov;54(3):201-8.
(16) Sauerbrei W, Royston P. Building multivariable prognostic and diagnostic models: Transformation of the predictors by using fractional polynomials. Journal ofthe Royal Statistical Society, Series A 1999;62:71-94.
(17) Royston P, Ambler G, Sauerbrei W. The use of fractional polynomials to model continuous risk variables in epidemiology. Int J Epidemiol 1999 Oct;28(5):964-74.
(18) Andersen PK, Geskus RB, de WT, Putter H. Competing risks in epidemiology: possibilities and pitfalls. Int J Epidemiol 2012 Jun;41(3):861-70.
(19) Putter H, Fiocco M, Geskus RB. Tutorial in biostatistics: competing risks and multi-state models. Stat Med 2007 May 20;26(11):2389-430.
(20) Rosthoj S, Andersen PK, Abildstrom SZ. SAS macros for estimation of the cumulative incidence functions based on a Cox regression model for competing risks survival data. Comput Methods Programs Biomed 2004 Apr;74(1):69-75.
(21) Brenner H, Gefeller O, Greenland S. Risk and rate advancement periods as measures of exposure impact on the occurrence of chronic diseases. Epidemiology 1993 May;4(3):229-36.
(22) SAS Institute Inc. 2002. NC, USA, Cary.
(23) Stata Statistical Software: Release 12. Version StataCorp. College Station, TX: StataCorp LP.: 2011.
(24) Zaridze D, Lewington S, Boroda A, Scelo G, Karpov R, Lazarev A, et al. Alcohol and mortality in Russia: prospective observational study of 151 000 adults. Lancet 2014 Jan 30;(13):10-6736.
(25) Thun MJ, Peto R, Lopez AD, Monaco JH, Henley SJ, Heath CW, Jr., et al. Alcohol consumption and mortality among middle-aged and elderly U.S. adults. N Engl J Med 1997 Dec 11;337(24):1705-14.
(26) Lin Y, Kikuchi S, Tamakoshi A, Wakai K, Kawamura T, Iso H, et al. Alcohol consumption and mortality among middle-aged and elderly Japanese men and women. Ann Epidemiol 2005 Sep;15(8):590-7.
(27) Fillmore KM, Stockwell T, Chikritzhs T, Bostrom A, Kerr W. Moderate alcohol use and reduced mortality risk: systematic error in prospective studies and new hypotheses. Ann Epidemiol 2007 May;17(5 Suppl):S16-S23.
Page 53 of 71
For peer review only - http://bmjopen.bmj.com/site/about/guidelines.xhtml
BMJ Open
123456789101112131415161718192021222324252627282930313233343536373839404142434445464748495051525354555657585960
on March 11, 2020 by guest. P
rotected by copyright.http://bm
jopen.bmj.com
/B
MJ O
pen: first published as 10.1136/bmjopen-2014-005245 on 3 July 2014. D
ownloaded from

For peer review only
(28) Naimi TS, Brown DW, Brewer RD, Giles WH, Mensah G, Serdula MK, et al. Cardiovascular risk factors and confounders among nondrinking and moderate-drinking U.S. adults. Am J Prev Med 2005 May;28(4):369-73.
(29) Klatsky AL, Friedman GD, Armstrong MA, Kipp H. Wine, liquor, beer, and mortality. Am J Epidemiol 2003 Sep 15;158(6):585-95.
(30) Maskarinec G, Meng L, Kolonel LN. Alcohol intake, body weight, and mortality in a multiethnic prospective cohort. Epidemiology 1998 Nov;9(6):654-61.
(31) Gronbaek M, Becker U, Johansen D, Gottschau A, Schnohr P, Hein HO, et al. Type of alcohol consumed and mortality from all causes, coronary heart disease, and cancer. Ann Intern Med 2000 Sep;19;133(6):411-9.
(32) Renaud SC, Gueguen R, Siest G, Salamon R. Wine, beer, and mortality in middle-aged men from eastern France. Arch Intern Med 1999 Sep 13;159(16):1865-70.
(33) Gellert C, Schottker B, Holleczek B, Stegmaier C, Muller H, Brenner H. Using rate advancement periods for communicating the benefits of quitting smoking to older smokers. Tob Control 2013 Jul;22(4):227-30.
(34) Nichols M, Scarborough P, Allender S, Rayner M. What is the optimal level of population alcohol consumption for chronic disease prevention in England? Modelling the impact of changes in average consumption levels. BMJ Open 2012 May 30;2(3):e000957.
Page 54 of 71
For peer review only - http://bmjopen.bmj.com/site/about/guidelines.xhtml
BMJ Open
123456789101112131415161718192021222324252627282930313233343536373839404142434445464748495051525354555657585960
on March 11, 2020 by guest. P
rotected by copyright.http://bm
jopen.bmj.com
/B
MJ O
pen: first published as 10.1136/bmjopen-2014-005245 on 3 July 2014. D
ownloaded from

For peer review only
Table 1. Country and sex-specific number of participants (N), person-years (PY), cause-specific and overall number of deaths.
Cancers
Country N PY CHD1 CVD2 Breast UADT3 Liver Colon-rectum Total4 Other
cancers5 Violent
& Injuries6 Resp7 Other causes8 Total
Women
France 65,127 971,127 45 202 62 8 4 27 101 678 115 73 1,619 2,833
Italy 24,956 306,244 26 87 71 6 12 53 142 293 30 12 120 710
Spain 23,616 323,027 41 50 51 6 9 47 113 243 46 9 119 621
UK 50,251 651,640 387 320 160 30 15 127 332 716 85 161 1,091 3,092
Netherlands 14,583 189,531 110 137 58 14 7 78 157 370 20 65 209 1,068
Greece 14,391 143,150 139 100 41 2 10 18 71 146 26 27 94 603
Germany 27,098 307,380 56 74 64 12 14 44 134 256 35 25 114 694
Denmark 27,773 328,375 84 143 128 23 17 110 278 648 51 116 548 1,868
All 247,795 3,220,474 888 1,113 635 101 88 504 1,328 3,335 408 488 3,848 11,489
Men
France - - - - - - - - - - - - - -
Italy 13,471 168,992 53 59 - 8 10 39 57 240 35 13 131 588
Spain 14,089 189,942 136 88 - 34 14 62 110 351 81 42 151 959
UK 20,452 262,720 438 229 - 41 11 68 120 567 88 171 1,040 2,653
Netherlands - - - - - - - - - - - - - -
Greece 9,726 90,989 193 141 - 12 20 31 63 279 49 54 99 878
Germany 19,743 221,724 167 138 - 37 25 65 127 437 84 35 264 1,253
Denmark 24,454 282,622 273 271 - 91 31 126 248 838 111 95 794 2,633
All 101,935 1,216,988 1,260 926 - 223 111 391 725 2,712 448 410 2,479 8,964
1CHD: Coronary heart disease [I20-I25] deaths; 2CVD: Cardiovascular disease [I00-I99 except I20-I25] deaths; 3UADT: deaths from upper aero-
digestive cancers (including cancer of the mouth [C01 to C10 without C08=salivary gland]), larynx [C21], pharynx [C11 to C14], oesophagus [C15]); 4Total frequency of alcohol related cancers; 5Other cancers: deaths from all other cancers; 6Violent deaths and injuries, including injury, poisoning and
certain other consequences of external causes [S00-T98], and external causes of morbidity and mortality [V01-Y98]; 7Resp=respiratory diseases [J00-
J99].
Page 55 of 71
For peer review only - http://bmjopen.bmj.com/site/about/guidelines.xhtml
BMJ Open
123456789101112131415161718192021222324252627282930313233343536373839404142434445464748495051525354555657585960
on March 11, 2020 by guest. Protected by copyright. http://bmjopen.bmj.com/ BMJ Open: first published as 10.1136/bmjopen-2014-005245 on 3 July 2014. Downloaded from

For peer review only
Table 2. Characteristics of the study population at recruitment, according to amount and type of alcohol intake (g/day) in the EPIC study1.
Lifetime drinkers
Characteristics Unit Never
drinkers 0.1-4.9 5-14.9 15-29.9 30-59.92 >602 Total3 Wine
consumers4 Beer
consumers4
Women
Number of participants n 25,146 112,281 77,147 27,179 6,042 - 247,795 85,965 8,748
Person-Years - 330,854 1,460,315 998,547 352,220 78,538 - 3,220,474 1,124,546 110,761
Age at recruitment Years 52 (9) 52 (10) 51 (10) 49 (11) 47 (11) - 51 (38-63) 52 (9) 46 (12)
Lifetime alcohol intake g/day 0 (-) 2 (2) 9 (3) 20 (4) 43 (21) - 7 (0-17) 12 (9) 11 (9)
Educational attainment5 % 14 22 27 33 37 - 25 28 28
Current smokers % 13 14 18 24 31 - 17 17 28
Body mass index kg/m2 27 (5) 25 (5) 25 (4) 24 (4) 24 (4) - 25 (20-31) 24 (4) 25 (4)
Height cm 158 (6) 161 (6) 162 (6) 163 (7) 164 (6) - 162 (153-170) 162 (6) 163 (7)
(Moderately) Active % 26 39 44 44 43 - 40 42 42
Ever use of HRT6 % 16 25 29 28 25 - 25 50 34
Post-menopausal status7 % 50 49 49 44 38 - 48 29 20
Energy intake kcal/day 1,848 (537) 1,943 (537) 2,015 (536) 2,090 (552) 2,195 (602) - 1978 (542) 2,046 (544) 1,976 (545)
Men
Number of participants n 1,600 14,287 28,875 28,049 20,788 8,336 101,935 26,137 22,136
Person-Years - 19,114 171,739 345,899 333,784 247,612 98,841 1,216,989 317,937 259,934
Age at recruitment Years 53 (11) 53 (11) 53 (9) 52 (9) 52 (9) 52 (9) 53 (41-64) 53 (9) 52 (10)
Lifetime alcohol intake g/day 0 (-) 2 (2) 10 (3) 22 (4) 42 (8) 94 (45) 25 (3-45) 30 (27) 22 (25)
Educational attainment5 % 21 30 31 32 26 14 29 22 27
Current smokers % 28 22 25 30 36 49 30 31 33
Body mass index kg/m2 27 (4) 26 (4) 26 (3) 27 (3) 27 (4) 28 (4) 27 (22-31) 27 (4) 27 (4)
Height cm 171 (7) 174 (7) 175 (7) 175 (7) 174 (7) 172 (7) 174 (165-183) 172 (7) 175 (7)
(Moderately) Active % 42 46 50 52 52 50 50 48 52
Energy intake kcal/day 2,284 (675) 2,267 (650) 2,315 (618) 2,417 (622) 2,569 (646) 2,789 (716) 2,427 (656) 2,487 (652) 2,369 (651)
1Means ± SDs are presented for continuous variables, frequencies for categorical variables; 2In women the last alcohol category is ≥30g/day; 3For continuous variables (with exception of energy intake), mean (10th-90th percentile) values are reported; 4Study subjects consuming more than 10 g/day of wine (or beer), and consuming less than 3 g/day of beer (or wine); 5Subjects with a university degree or more; 6HRT=hormonal replacement therapy; 7Post-menopausal women plus women who underwent an ovariectomy.
Page 56 of 71
For peer review only - http://bmjopen.bmj.com/site/about/guidelines.xhtml
BMJ Open
123456789101112131415161718192021222324252627282930313233343536373839404142434445464748495051525354555657585960
on March 11, 2020 by guest. Protected by copyright. http://bmjopen.bmj.com/ BMJ Open: first published as 10.1136/bmjopen-2014-005245 on 3 July 2014. Downloaded from

For peer review only
Figure 1. Number of deaths, person-years (PY) and multivariable hazard ratios1 (HR) with 95% confidence intervals (CI) and p-value of the Wald test for statistical significance for overall and cause-specific mortality by categories of lifetime alcohol use, in women and men.
(Women) (Men)
1Models were stratified by center. Systematic adjustment was undertaken for age at recruitment, BMI and height, former drinking, time since alcohol quitting, smoking status, duration of smoking, age at start smoking, educational attainment, and energy intake. In women adjustment was undertaken for menopausal status, ever use of replacement hormones, and number of full term pregnancies.
Page 57 of 71
For peer review only - http://bmjopen.bmj.com/site/about/guidelines.xhtml
BMJ Open
123456789101112131415161718192021222324252627282930313233343536373839404142434445464748495051525354555657585960
on March 11, 2020 by guest. Protected by copyright. http://bmjopen.bmj.com/ BMJ Open: first published as 10.1136/bmjopen-2014-005245 on 3 July 2014. Downloaded from

For peer review only
Table 3. Sex-specific number of deaths, hazard ratios (HR)1 and 95%CI for overall mortality by categories of lifetime alcohol use (g/day), by smoking status (never
and current smokers), and type of alcoholic beverage.
Women Men
Never smokers Current smokers Never smokers Current smokers
deaths HR2 (95% CI) deaths HR2 (95% CI) pheterog3 deaths HR2 (95% CI) deaths HR2 (95% CI) pheterog
3
Overall Overall Never 1,009 1.34 (1.24, 1.45) 154 1.72 (1.32, 2.23) Never 84 1.50 (1.19, 1.21) 58 2.09 (1.26, 3.47)
0.1-4.9 3,046 1 Ref 1,021 1.53 (1.23, 1.90) 0.1-4.9 457 1 Ref 367 1.62 (1.04, 2.53) 5-14.9 1,550 1.04 (0.98, 1.11) 874 1.51 (1.21, 1.88) 5-14.9 538 0.93 (0.82, 1.06) 799 1.45 (0.93, 2.25) 15-29.9 397 1.04 (0.94, 1.16) 435 1.74 (1.38, 2.19) 15-29.9 369 1.00 (0.87, 1.16) 927 1.66 (1.06, 2.58) ≥ 30 82 1.29 (1.03, 1.61) 140 2.08 (1.59, 2.73) 30-59.9 254 1.22 (1.23, 1.43) 857 1.83 (1.17, 2.84) pWald
4 <0.001 <0.001 0.150 ≥ 60 107 1.56 (1.25, 1.95) 590 2.43 (1.55, 3.80)
pWald4 <0.001 <0.001 0.864
Wine use Beer use Wine use Beer use
deaths HR5 (95% CI) deaths HR5 (95% CI) pdifference6 deaths HR5 (95% CI) deaths HR5 (95% CI) pdifference
6
Overall Overall Never 2,156 1.15 (1.09, 1.22) 5,041 1.06 (1.02, 1.12) Never 1,064 1.21 (1.12, 1.30) 975 1.07 (0.98, 1.16) 0.1-2.9 5,109 1 Ref 5,477 1 Ref 0.1-2.9 3,266 1 Ref 2,959 1 Ref 3-9.9 2,813 0.96 (0.92, 1.01) 787 1.15 (1.07, 1.24) 3-9.9 2,139 0.92 (0.87, 0.97) 2,486 1.04 (0.98, 1.10) 10-19.9 1,057 1.00 (0.93, 1.07) 147 1.50 (1.27, 1.77) 10-19.9 1,040 0.96 (0.89, 1.03) 1,248 1.12 (1.04, 1.20) ≥ 20 354 1.14 (1.02, 1.27) 37 1.47 (1.06, 2.04) 20-39.9 814 1.03 (0.95, 1.13) 877 1.41 (1.30, 1.54) pWald
4 <0.001 <0.001 <0.001 ≥ 40 641 1.22 (1.10, 1.35) 419 1.86 (1.66, 2.09) pWald
4 <0.001 <0.001 <0.001
1Models were stratified by center. Systematic adjustment was undertaken for age at recruitment, BMI and height, former drinking, time since alcohol
quitting, smoking status, duration of smoking, age at start smoking, educational attainment, and energy intake. In women adjustment was undertaken
for menopausal status, ever use of replacement hormones, and number of full term pregnancies; 2Models included interaction terms between lifetime
alcohol use and a smoking indicator (0=never smokers; 1=current smokers), keeping the reference category the group of moderate alcohol users (0.1-
4.9 g/day) among never smokers, whereas former smokers and subjects with unknown smoking status were excluded; 3pheterogeneity: difference in HRs
assessed comparing the log-likelihood of models with and without interaction terms between alcohol and smoking status to a 4 and 5 degrees of
freedom (dof) chi-square distribution, in women and men respectively; 4pWald: determined using a Wald test for contrasts according to a chi-square
distribution with 4 and 5 dof, in women and men respectively; 5Models on wine and beer uses were mutually adjusted, and also included spirits/liquors
use; 6pdifference expresses the difference of associations between wine and beer use, determined evaluating the significance of the parameter estimate γ2
in a model that included, other than the list of confounders, the terms γ1·(X1+X2)/2 + γ2·(X1-X2)/2, with X1=log(wine use+1) and X2=log(beer use+1).
Page 58 of 71
For peer review only - http://bmjopen.bmj.com/site/about/guidelines.xhtml
BMJ Open
123456789101112131415161718192021222324252627282930313233343536373839404142434445464748495051525354555657585960
on March 11, 2020 by guest. Protected by copyright. http://bmjopen.bmj.com/ BMJ Open: first published as 10.1136/bmjopen-2014-005245 on 3 July 2014. Downloaded from

For peer review only
Figure 2. Sex-specific plots displaying cumulative probabilities of death due to overall mortality, for heavy
(≥30 g/day in women and ≥60 g/day in men, continuous line) and moderate lifetime use (0.1-4.9 g/day) (dotted
line), in smokers (black line) and never smokers (grey line), for study subjects aged 60 years.
Women
Men
Heavy drinker, smoker
Light drinker, never smoker
Heavy drinker, never smoker
Light drinker, smoker
Heavy drinker, smoker
Light drinker, never smoker
Heavy drinker, never smoker
Light drinker, smoker
Page 59 of 71
For peer review only - http://bmjopen.bmj.com/site/about/guidelines.xhtml
BMJ Open
123456789101112131415161718192021222324252627282930313233343536373839404142434445464748495051525354555657585960
on March 11, 2020 by guest. P
rotected by copyright.http://bm
jopen.bmj.com
/B
MJ O
pen: first published as 10.1136/bmjopen-2014-005245 on 3 July 2014. D
ownloaded from

For peer review only
Figure 3. In competing risks analyses, sex-specific plots displaying cumulative probabilities of death due to
CVD/CHD (red), alcohol related cancers (blue), and violent death and injuries (green), for study subjects aged
60 years according to heavy (≥30 g/day in women and ≥60 g/day in men, continuous line) and moderate (0.1-
4.9 g/day, dotted lines) lifetime alcohol use in current and never smokers in the EPIC study.
Women
Smokers Never smoker Men Smokers Never smoker
Page 60 of 71
For peer review only - http://bmjopen.bmj.com/site/about/guidelines.xhtml
BMJ Open
123456789101112131415161718192021222324252627282930313233343536373839404142434445464748495051525354555657585960
on March 11, 2020 by guest. P
rotected by copyright.http://bm
jopen.bmj.com
/B
MJ O
pen: first published as 10.1136/bmjopen-2014-005245 on 3 July 2014. D
ownloaded from

For peer review only
Table 4. Sex-specific estimates of rate advancement period (RAP) and associated 95%CI for overall and
mortality due to ARCs, CVD/CHD and injuries and violent deaths, related to two scenarios of lifetime
alcohol use. RAP estimates express the impact of a given exposure on the risk of death, by determining the
time (in years) by which the risk of death is anticipated for study subjects exposed, e.g. all drinkers more
than the threshold (5 or 15 g/day in Scenario I and II, respectively), compared to non-exposed, i.e.
individuals drinking between 0.1 g/day and the threshold.
Scenario I Scenario II
Threshold: 5 g/day Threshold: 15 g/day
RAP (years)
95%CI RAP (years)
95%CI
Women Overall 0.36 -0.05, 0.76 0.83 0.26, 1.39
CVD/CHD 0.23 -0.46, 0.92 0.08 -0.96, 1.14 Alcohol related cancers 1.28 -0.86, 3.41 1.90 -1.00, 4.81 Injuries and violent deaths -2.69 -6.85, 1.47 -0.20 -5.85, 5.46
Men Overall 0.15 -0.48, 0.76 1.42 0.96, 1.89
CVD/CHD -0.53 -1.57, 0.50 -0.01 -0.82, 0.81 Alcohol related cancers 2.59 -0.30, 5.49 5.03 3.07, 7.00 Injuries and violent deaths 7.59 -2.82, 18.02 11.83 3.92, 18.17
1Never lifetime alcohol users did not enter into the estimation process.
Page 61 of 71
For peer review only - http://bmjopen.bmj.com/site/about/guidelines.xhtml
BMJ Open
123456789101112131415161718192021222324252627282930313233343536373839404142434445464748495051525354555657585960
on March 11, 2020 by guest. P
rotected by copyright.http://bm
jopen.bmj.com
/B
MJ O
pen: first published as 10.1136/bmjopen-2014-005245 on 3 July 2014. D
ownloaded from

For peer review only
1
MS: “Lifetime alcohol use and overall and cause-specific mortality in the European
Prospective Investigation into Cancer and nutrition (EPIC) study” by Ferrari et al.
STROBE statement checklist
(Pages of the submitted manuscript where each point of the checklist is addressed are indicated)
Item
No Recommendation
Title and abstract 1 (a) Indicate the study’s design with a commonly used term in the title or the abstract
(Pages 1, 4)
(b) Provide in the abstract an informative and balanced summary of what was done
and what was found (Page 4)
Introduction
Background/rationale 2 Explain the scientific background and rationale for the investigation being reported
(Page 6)
Objectives 3 State specific objectives, including any prespecified hypotheses (Page 6)
Methods
Study design 4 Present key elements of study design early in the paper (Pages 7, 8)
Setting 5 Describe the setting, locations, and relevant dates, including periods of recruitment,
exposure, follow-up, and data collection (Pages 7, 8)
Participants 6 (a) Give the eligibility criteria, and the sources and methods of selection of
participants. Describe methods of follow-up (Pages 7, 8)
(b) For matched studies, give matching criteria and number of exposed and
unexposed (NA)
Variables 7 Clearly define all outcomes, exposures, predictors, potential confounders, and effect
modifiers. Give diagnostic criteria, if applicable (Pages 8,9)
Data sources/
measurement
8* For each variable of interest, give sources of data and details of methods of
assessment (measurement). Describe comparability of assessment methods if there is
more than one group (Pages 8, 9)
Bias 9 Describe any efforts to address potential sources of bias (Pages 10,11)
Study size 10 Explain how the study size was arrived at (Page 8)
Quantitative variables 11 Explain how quantitative variables were handled in the analyses. If applicable,
describe which groupings were chosen and why (Pages 8,9)
Statistical methods 12 (a) Describe all statistical methods, including those used to control for confounding
(Pages 8, 9, 10, 11)
(b) Describe any methods used to examine subgroups and interactions (Pages 10,11)
(c) Explain how missing data were addressed (Page 9)
(d) If applicable, explain how loss to follow-up was addressed (Page 9)
(e) Describe any sensitivity analyses (Page 10)
Results
Participants 13* (a) Report numbers of individuals at each stage of study—eg numbers potentially
eligible, examined for eligibility, confirmed eligible, included in the study,
completing follow-up, and analysed (Pages 7, 8, 12)
(b) Give reasons for non-participation at each stage (8. For the EPIC study, details
are included in Reference 11, Riboli et al, PHN, 2002)
(c) Consider use of a flow diagram NO FLOW DIAGRAM
Descriptive data 14* (a) Give characteristics of study participants (eg demographic, clinical, social) and
information on exposures and potential confounders (Pages 12, 13, Table 2)
(b) Indicate number of participants with missing data for each variable of interest
Page 62 of 71
For peer review only - http://bmjopen.bmj.com/site/about/guidelines.xhtml
BMJ Open
123456789101112131415161718192021222324252627282930313233343536373839404142434445464748495051525354555657585960
on March 11, 2020 by guest. P
rotected by copyright.http://bm
jopen.bmj.com
/B
MJ O
pen: first published as 10.1136/bmjopen-2014-005245 on 3 July 2014. D
ownloaded from

For peer review only
2
(Page 9)
(c) Summarise follow-up time (eg, average and total amount) (Page 12, Tables 1
and 2)
Outcome data 15* Report numbers of outcome events or summary measures over time (Page 12, Table
1)
Main results 16 (a) Give unadjusted estimates and, if applicable, confounder-adjusted estimates and
their precision (eg, 95% confidence interval). Make clear which confounders were
adjusted for and why they were included (Page 13)
(b) Report category boundaries when continuous variables were categorized (Pages
13, 14)
(c) If relevant, consider translating estimates of relative risk into absolute risk for a
meaningful time period (Pages 14, 15)
Other analyses 17 Report other analyses done—eg analyses of subgroups and interactions, and
sensitivity analyses (Pages 13, 14, 15)
Discussion
Key results 18 Summarise key results with reference to study objectives (Page 15)
Limitations 19 Discuss limitations of the study, taking into account sources of potential bias or
imprecision. Discuss both direction and magnitude of any potential bias (Page 16)
Interpretation 20 Give a cautious overall interpretation of results considering objectives, limitations,
multiplicity of analyses, results from similar studies, and other relevant evidence
(Pages 16, 17)
Generalisability 21 Discuss the generalisability (external validity) of the study results (Pages 17, 18)
Other information
Funding 22 Give the source of funding and the role of the funders for the present study and, if
applicable, for the original study on which the present article is based (Pages 19, 20)
*Give information separately for exposed and unexposed groups.
Note: An Explanation and Elaboration article discusses each checklist item and gives methodological background and
published examples of transparent reporting. The STROBE checklist is best used in conjunction with this article (freely
available on the Web sites of PLoS Medicine at http://www.plosmedicine.org/, Annals of Internal Medicine at
http://www.annals.org/, and Epidemiology at http://www.epidem.com/). Information on the STROBE Initiative is
available at http://www.strobe-statement.org.
Page 63 of 71
For peer review only - http://bmjopen.bmj.com/site/about/guidelines.xhtml
BMJ Open
123456789101112131415161718192021222324252627282930313233343536373839404142434445464748495051525354555657585960
on March 11, 2020 by guest. P
rotected by copyright.http://bm
jopen.bmj.com
/B
MJ O
pen: first published as 10.1136/bmjopen-2014-005245 on 3 July 2014. D
ownloaded from
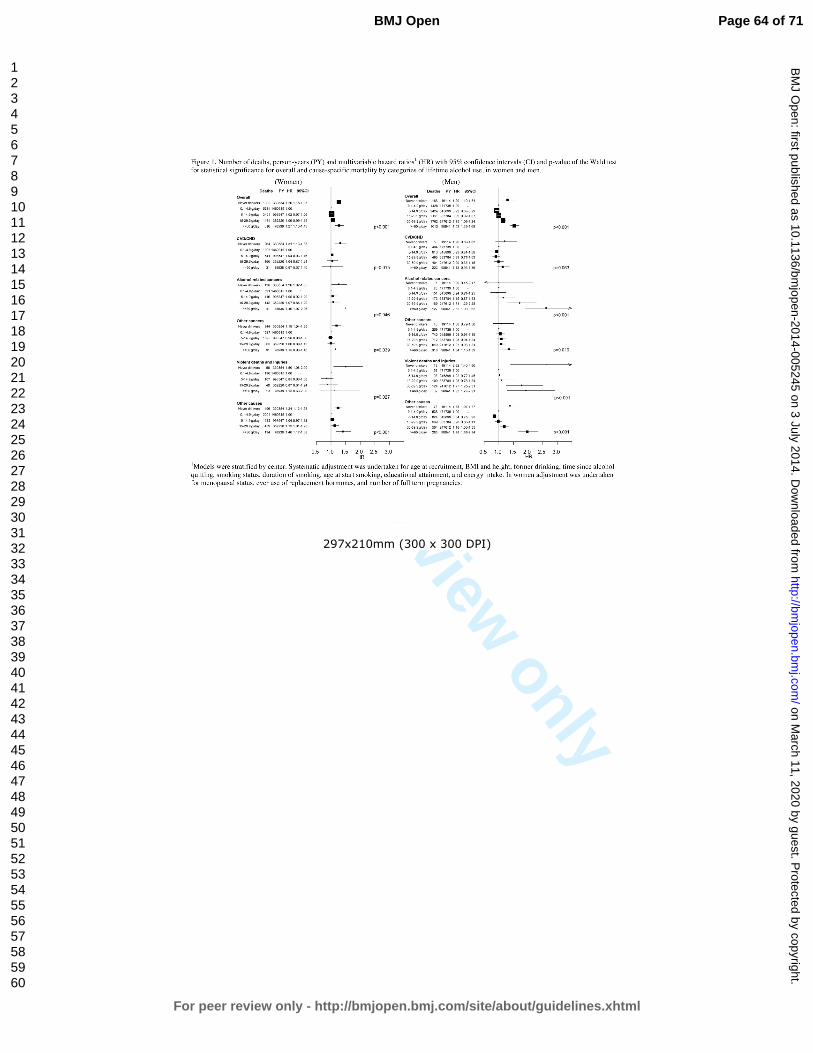
For peer review only
297x210mm (300 x 300 DPI)
Page 64 of 71
For peer review only - http://bmjopen.bmj.com/site/about/guidelines.xhtml
BMJ Open
123456789101112131415161718192021222324252627282930313233343536373839404142434445464748495051525354555657585960
on March 11, 2020 by guest. P
rotected by copyright.http://bm
jopen.bmj.com
/B
MJ O
pen: first published as 10.1136/bmjopen-2014-005245 on 3 July 2014. D
ownloaded from

For peer review only
210x297mm (300 x 300 DPI)
Page 65 of 71
For peer review only - http://bmjopen.bmj.com/site/about/guidelines.xhtml
BMJ Open
123456789101112131415161718192021222324252627282930313233343536373839404142434445464748495051525354555657585960
on March 11, 2020 by guest. P
rotected by copyright.http://bm
jopen.bmj.com
/B
MJ O
pen: first published as 10.1136/bmjopen-2014-005245 on 3 July 2014. D
ownloaded from

For peer review only
210x297mm (300 x 300 DPI)
Page 66 of 71
For peer review only - http://bmjopen.bmj.com/site/about/guidelines.xhtml
BMJ Open
123456789101112131415161718192021222324252627282930313233343536373839404142434445464748495051525354555657585960
on March 11, 2020 by guest. P
rotected by copyright.http://bm
jopen.bmj.com
/B
MJ O
pen: first published as 10.1136/bmjopen-2014-005245 on 3 July 2014. D
ownloaded from

For peer review only
297x210mm (300 x 300 DPI)
Page 67 of 71
For peer review only - http://bmjopen.bmj.com/site/about/guidelines.xhtml
BMJ Open
123456789101112131415161718192021222324252627282930313233343536373839404142434445464748495051525354555657585960
on March 11, 2020 by guest. P
rotected by copyright.http://bm
jopen.bmj.com
/B
MJ O
pen: first published as 10.1136/bmjopen-2014-005245 on 3 July 2014. D
ownloaded from

For peer review only
297x210mm (300 x 300 DPI)
Page 68 of 71
For peer review only - http://bmjopen.bmj.com/site/about/guidelines.xhtml
BMJ Open
123456789101112131415161718192021222324252627282930313233343536373839404142434445464748495051525354555657585960
on March 11, 2020 by guest. P
rotected by copyright.http://bm
jopen.bmj.com
/B
MJ O
pen: first published as 10.1136/bmjopen-2014-005245 on 3 July 2014. D
ownloaded from

For peer review only
297x210mm (300 x 300 DPI)
Page 69 of 71
For peer review only - http://bmjopen.bmj.com/site/about/guidelines.xhtml
BMJ Open
123456789101112131415161718192021222324252627282930313233343536373839404142434445464748495051525354555657585960
on March 11, 2020 by guest. P
rotected by copyright.http://bm
jopen.bmj.com
/B
MJ O
pen: first published as 10.1136/bmjopen-2014-005245 on 3 July 2014. D
ownloaded from

For peer review only
210x297mm (300 x 300 DPI)
Page 70 of 71
For peer review only - http://bmjopen.bmj.com/site/about/guidelines.xhtml
BMJ Open
123456789101112131415161718192021222324252627282930313233343536373839404142434445464748495051525354555657585960
on March 11, 2020 by guest. P
rotected by copyright.http://bm
jopen.bmj.com
/B
MJ O
pen: first published as 10.1136/bmjopen-2014-005245 on 3 July 2014. D
ownloaded from

For peer review only
210x297mm (300 x 300 DPI)
Page 71 of 71
For peer review only - http://bmjopen.bmj.com/site/about/guidelines.xhtml
BMJ Open
123456789101112131415161718192021222324252627282930313233343536373839404142434445464748495051525354555657585960
on March 11, 2020 by guest. P
rotected by copyright.http://bm
jopen.bmj.com
/B
MJ O
pen: first published as 10.1136/bmjopen-2014-005245 on 3 July 2014. D
ownloaded from

For peer review only
297x210mm (300 x 300 DPI)
Page 72 of 71
For peer review only - http://bmjopen.bmj.com/site/about/guidelines.xhtml
BMJ Open
123456789101112131415161718192021222324252627282930313233343536373839404142434445464748495051525354555657585960
on March 11, 2020 by guest. P
rotected by copyright.http://bm
jopen.bmj.com
/B
MJ O
pen: first published as 10.1136/bmjopen-2014-005245 on 3 July 2014. D
ownloaded from