Embed Size (px)
Citation preview

BioMed CentralBMC Bioinformatics
ss
Open AcceSoftwareGEVALT: An integrated software tool for genotype analysisOfir Davidovich*, Gad Kimmel and Ron ShamirAddress: School of Computer Science, Tel-Aviv University, Tel-Aviv, Israel
Email: Ofir Davidovich* - [email protected]; Gad Kimmel - [email protected]; Ron Shamir - [email protected]
* Corresponding author
AbstractBackground: Genotype information generated by individual and international efforts carries thepromise of revolutionizing disease studies and the association of phenotypes with alleles andhaplotypes. Given the enormous amounts of public genotype data, tools for analyzing, interpretingand visualizing these data sets are of critical importance to researchers. In past works we havedeveloped algorithms for genotypes phasing and tag SNP selection, which were shown to be quickand accurate. Both algorithms were available until now only as batch executables.
Results: Here we present GEVALT (GEnotype Visualization and ALgorithmic Tool), a softwarepackage designed to simplify and expedite the process of genotype analysis, by providing a commoninterface to several tasks relating to such analysis. GEVALT combines the strong visual abilities ofHaploview with our quick and powerful algorithms for genotypes phasing (GERBIL), tag SNPselection (STAMPA) and permutation testing for evaluating significance of association. All of theabove are provided in a visually appealing and interactive interface.
Conclusion: GEVALT is an integrated viewer that uses state of the art phasing and tag SNPselection algorithms. By streamlining the application of GERBIL and STAMPA together with strongvisualization for assessment of the results, GEVALT makes the algorithms accessible to the broadcommunity of researchers in genetics.
BackgroundGenotype information generated by individual and inter-national efforts carries the promise of revolutionizing dis-ease studies and the association of phenotypes with allelesand haplotypes. Given the enormous amounts of publicgenotype data, tools for analyzing, interpreting and visu-alizing these data sets are of critical importance toresearchers.
In past works we have developed the following analysisalgorithms:
1. GERBIL [1,2] – an algorithm for simultaneously phas-ing genotypes into haplotypes and block partitioning. Thealgorithm is based on a stochastic model for recombina-tion-poor regions ("blocks"), in which haplotypes aregenerated from a small number of core haplotypes, allow-ing for mutations, rare recombinations and errors. Thegenotype phasing and block partitioning is solved by anexpectation-maximization algorithm. Gerbil accepts gen-otype data as input and outputs the phased genotypes foreach individual, the block structure of the entire popula-tion and the common haplotypes in each block. As part ofthe algorithm, Gerbil also accurately completes missingdata according to the common haplotypes found. Gerbil
Published: 1 February 2007
BMC Bioinformatics 2007, 8:36 doi:10.1186/1471-2105-8-36
Received: 3 November 2006Accepted: 1 February 2007
This article is available from: http://www.biomedcentral.com/1471-2105/8/36
© 2007 Davidovich et al; licensee BioMed Central Ltd. This is an Open Access article distributed under the terms of the Creative Commons Attribution License (http://creativecommons.org/licenses/by/2.0), which permits unrestricted use, distribution, and reproduction in any medium, provided the original work is properly cited.
Page 1 of 8(page number not for citation purposes)

BMC Bioinformatics 2007, 8:36 http://www.biomedcentral.com/1471-2105/8/36
was shown to be quick and accurate even for many hun-dreds of individuals [1].
2. STAMPA [3] – an algorithm for tag SNP selection. Thealgorithm finds a set of tag SNPs with maximal predictionaccuracy. The prediction accuracy of a set of tag SNPs is theexpected accuracy of predicting untyped SNPs, given thetag SNPs. Dynamic programming is used in order to effi-ciently find the set of tag SNPs. Halperin et. al testedStampa on many different genotype datasets from differ-ent sources, and showed that it finds tag SNPs with con-siderably better prediction ability than two other state-of-the-art tag SNP selection algorithms [3].
Both GERBIL and STAMPA were available until now onlyas batch executables. In this work we introduce GEVALT(GEnotype Visualization and ALgorithmic Tool). GEVALT(Version 1.1) is an integrated software providing easyaccess to the GERBIL and STAMPA algorithms as well as tosome other tools for genotype analysis. GEVALT is basedon Haploview version 3.2 [4] and it maintains the user-friendly interface and strong visualization capabilities ofHaploview, as well as its other functionalities, includingcomputation of marker quality statistics and LD informa-tion.
ImplementationGEVALT is implemented in JAVA based on the opensource code of Haploview version 3.2. The analysis algo-rithms (GERBIL, STAMPA and permutation testing) areimplemented in C++. Both Linux and Windows versionsof GEVALT are available for download, as well as the JAVAsource code.
Results and DiscussionGEVALT accepts input in a variety of formats. Genotypedata can be loaded as unphased genotypes in the standardlinkage format, or as either partially or fully phased chro-mosomes. Genotype data dumps from the HapMap web-site [5] can also be loaded. When using the standardlinkage format, the user can specify family structure aswell as disease status. The user can also specify markerinformation, including name and location. Upon loadinga dataset, GEVALT first phases the genotypes in the follow-ing manner: For data consisting of unrelated individuals,GEVALT uses Gerbil to phase the genotypes. For data con-sisting of two-generation pedigrees, GEVALT first creates aset of trios, one per family, where each trio contains thechild with least missing data. In each trio phasing is done,if possible, according to Mendelian rules. Then only thechildren's genotypes are phased using Gerbil and eachparent's haplotypes are deduced from its child's haplo-types. Gerbil is then run again on the set of the parents'genotypes only to complete the missing data. The haplo-
types of the children that were not included in the trios arededuced from their parents' haplotypes.
After phasing is completed, GEVALT generates several dis-plays and option menus including the following:
• Phased genotypes: The phased genotypes of each indi-vidual are displayed. Different colors are used to indicatealleles phased by GERBIL, missing data and Mendelianerrors (Figure 1). For data consisting of pedigrees, thephased genotypes are divided into two groups, parentsand children, and each group is displayed separately.
• Stampa: Select tag SNPs using the Stampa algorithm(Figure 2). The user can specify the desired number of tagSNPs, and the algorithm finds an optimal set of tag SNPsand reports its prediction accuracy. The user can add orremove tag SNPs from the set manually and GEVALTrecalculates the prediction accuracy of the new set.
• Individual Stats: Summary statistics for each individualare displayed (Figure 3). These include the percentage ofmissing genotypes, the percentage of heterozygous mark-ers, the percentage of minor alleles and a tally of Mende-lian inheritance errors.
All of Haploview's displays and option menus are availa-ble. See [4] for a full description of these features. In addi-tion, the following changes and extensions areintroduced:
• Association: GEVALT contains a faster implementationof the permutation test in C++ instead of JAVA. The newimplementation runs about 20 times faster than the JAVAimplementation in Haploview. In the haplotype associa-tions tab, a p-value is calculated for each block and foreach haplotype (Figure 4).
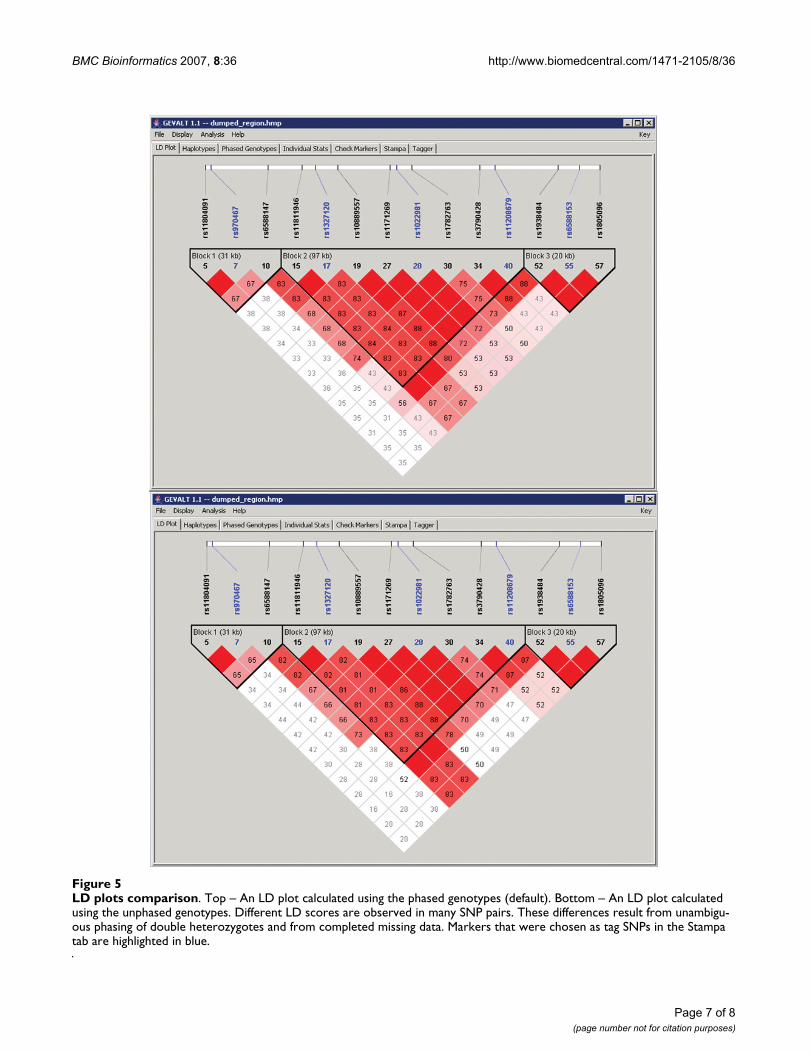
• LD Plot: The LD between each pair of SNPs can be cal-culated using either the phased or the unphased geno-types (Figure 5). The block structure displayed by defaultis that found by GERBIL. The user can still employ any ofHaploview's block identification methods or select blocksmanually. Markers that were chosen as tag SNPs in theStampa tab are highlighted in this display.
• Haplotypes: The common haplotypes in each block arecomputed based on the Gerbil solution.
• Check markers: Phasing by Gerbil is done only for theset of picked markers. Whenever the set of picked markerschanges, GEVALT recalculates the phasing, and all dis-plays are updated accordingly.
Page 2 of 8(page number not for citation purposes)

BMC Bioinformatics 2007, 8:36 http://www.biomedcentral.com/1471-2105/8/36
Each of these displays and option menus is shown on aseparate tab, allowing the user to move from one to thenext. Interactive modifications made by the user in anypanel are reflected in all the others. The information oneach panel can also be exported to a PNG image file or toa text file. Additionally, the program has a command-linemode, which allows the user to run all the analyses with-out opening the GUI on one or more files at once.
The running time of GEVALT is dominated primarily bythat of Gerbil and Stampa (see the references for detailedreports on the running times of these programs). All otheroperations, such as parameter adjustments and displaychanges, are done with no noticeable delay even for datasets with hundreds of markers and hundreds of individu-
als. Gerbil can currently handle up to 300 markers, whileStampa can handle thousands of markers. Both algo-rithms can handle thousands of individuals.
To the best of our knowledge, only two extant programsoffer both algorithmic and visualization tools for geno-type analysis: Haploview [4] and HapScope [6]. Asdescribed above, GEVALT maintains the popular, user-friendly interface of Haploview, but replaces its standardEM algorithm for phasing with the Gerbil algorithm. Thisallows a more accurate estimation of the phased haplo-types and a visualization of each individual's inferred hap-lotypes (and not just common haplotypes as inHaploview). Besides the Tagger algorithm for tag SNPsselection implemented in Haploview (and also in
The Phased Genotypes displayFigure 1The Phased Genotypes display. The phased genotypes display is divided into two tabs – parents and children. In this image the parents tab is displayed. For each parent, its two chromosomes are displayed, with an indication which of them was trans-mitted to the child that was included in the trio. Different colors are used to indicate alleles phased by GERBIL, missing data that were completed by GERBIL, and Mendelian errors.
Page 3 of 8(page number not for citation purposes)

BMC Bioinformatics 2007, 8:36 http://www.biomedcentral.com/1471-2105/8/36
GEVALT), GEVALT also offers STAMPA, which is not onlyvery efficient, but also allows the user to choose theamount of tag SNPs. Other advantages and improvementsover Haploview are listed above. A current limitation ofGerbil is allowing at most 300 markers. We intend toremove this limitation in the future (see below). The Hap-Scope software includes analysis programs and a visuali-zation tool. Most of the analyses are done separately usingthe command line and the results are then loaded into thevisualization tool. In contrast, in GEVALT all the analysesare done within the graphical user interface, which makesit more user friendly and easy to use. HapScope usesPHASE [7] or SNPHAP [8] as its phasing algorithm.PHASE was shown to be slightly more accurate than Ger-
bil but much slower [1]. In contrast to HapScope, GEVALTfacilitates association tests and can handle family struc-tures. On the other hand, only HapScope includes mod-ules for reference sequence annotation, SNP mapping andSNP classification.
We intend to continue the development of GEVALT. Inparticular, we shall extend Gerbil to handle more SNPs,and improve Stampa so that it incorporates into its solu-tion predefined tag SNPs. We also intend to incorporate anew algorithm for evaluating the significance of diseaseassociation, which is dramatically faster than the standardpermutation test [9].
The Stampa displayFigure 2The Stampa display. Left – The Stampa configuration menu. After running Stampa, a table is displayed, showing for every number of tag SNPs, the prediction accuracy of the best set of tag SNPs of that size. The user can choose the number of tags to display according to the required prediction accuracy. Right – The Stampa results menu. The selected tag SNPs are marked. The user can add or remove tag SNPs manually and recalculate the prediction accuracy of the new set.
Page 4 of 8(page number not for citation purposes)

BMC Bioinformatics 2007, 8:36 http://www.biomedcentral.com/1471-2105/8/36
ConclusionGEVALT is an integrated viewer that uses state of the artphasing and tag SNP selection algorithms. It streamlinesthe application of GERBIL and STAMPA, which wereavailable until now only as batch executables, and allowsusing them together with the strong visualizations of Hap-loview for assessment of the results. Both running thealgorithms and visualizing the results are done within thegraphical user interface, unlike, e.g., the HapScope soft-ware [6], which only enables the latter. This makes the
algorithms accessible to the broad community ofresearchers in genetics.
Availability and requirements• Project name: GEVALT
• Project home page: http://www.cs.tau.ac.il/~rshamir/gevalt
• Operating systems: Windows and Linux.
The Individual Stats displayFigure 3The Individual Stats display. This table summarizes statistics for each individual. These include the percentage of missing genotypes, the percentage of heterozygous markers, the percentage of minor alleles, and a tally of Mendelian inheritance errors and of phasing errors.
Page 5 of 8(page number not for citation purposes)

BMC Bioinformatics 2007, 8:36 http://www.biomedcentral.com/1471-2105/8/36
• Programming language: Java and C++
• Other requirements: Java 1.3 or higher.
• License: free non-commercial research use license.
• Any restrictions to use by non-academics: licenseneeded for commercial use.
The Haplotypes and Single Markers Associations displaysFigure 4The Haplotypes and Single Markers Associations displays. The Association tab contains three displays: Single Marker, Haplotypes, Permutation Tests. Top – The Haplotypes Association tab. For each block and each haplotype in a block a chi-square score is calculated (TDT test for pedigrees, case/control test for unrelated individuals) and a p-value is derived. Only haplotypes above a certain frequency threshold are considered and displayed (the threshold is set by the user in the Haplo-types tab). Bottom – The Single Marker tab for the same set of markers. In this example more significant associations are detected when testing for haplotype associations than when testing individual SNPs.
Page 6 of 8(page number not for citation purposes)
BMC Bioinformatics 2007, 8:36 http://www.biomedcentral.com/1471-2105/8/36
Page 7 of 8(page number not for citation purposes)
LD plots comparisonFigure 5LD plots comparison. Top – An LD plot calculated using the phased genotypes (default). Bottom – An LD plot calculated using the unphased genotypes. Different LD scores are observed in many SNP pairs. These differences result from unambigu-ous phasing of double heterozygotes and from completed missing data. Markers that were chosen as tag SNPs in the Stampa tab are highlighted in blue.

BMC Bioinformatics 2007, 8:36 http://www.biomedcentral.com/1471-2105/8/36
Publish with BioMed Central and every scientist can read your work free of charge
"BioMed Central will be the most significant development for disseminating the results of biomedical research in our lifetime."
Sir Paul Nurse, Cancer Research UK
Your research papers will be:
available free of charge to the entire biomedical community
peer reviewed and published immediately upon acceptance
cited in PubMed and archived on PubMed Central
yours — you keep the copyright
Submit your manuscript here:http://www.biomedcentral.com/info/publishing_adv.asp
BioMedcentral
Authors' contributionsOD and GK contributed to the design of GEVALT. ODimplemented GEVALT and GK implemented the analysisalgorithms. RS supervised the project. All authors partici-pated in the drafting and revising of the manuscript, andread and approved the final manuscript.
AcknowledgementsThis work is supported in part by a grant from the German-Israel Founda-tion (grant 237/2005). We are grateful to the Haploview Team for making their software and source code available to us, and to Eran Halperin who codeveloped Stampa.
References1. Kimmel G, Shamir R: GERBIL: Genotype Resolution and Block
Identification Using Likelihood. Proc Natl Acad Sci U S A 2005,102:158-162.
2. Kimmel G, Shamir R: Maximum likelihood resolution of multi-block genotypes. In Proceedings of the Eighth Annual InternationalConference on Research in Computational Molecular Biology (RECOMB 04)The Association for Computing Machinery; 2004:2-9.
3. Halperin E, Kimmel G, Shamir R: Tag SNP Selection in GenotypeData for Maximizing SNP Prediction Accuracy. Bioinformatics2005, 21(Suppl 1):i195-i203.
4. Barrett JC, Fry B, Maller J, Daly MJ: Haploview: analysis and visu-alization of LD and haplotype maps. Bioinformatics 2005,21(2):263-265.
5. International HapMap Project [http://www.hapmap.org]6. Zhang J, Rowe WL, Struewing JP, Buetow KH: HapScope: a soft-
ware system for automated and visual analysis of function-ally annotated haplotypes. Nucl Acids Res 2002,30(23):5213-5221.
7. Stephens M, Smith NJ, Donnelly P: A new statistical method forhaplotype reconstruction from population data. Am J HumGenet 2001, 68(4):978-989.
8. SNPHAP software [http://www-gene.cimr.cam.ac.uk/clayton/software/]
9. Kimmel G, Shamir R: A Fast Method for Computing High Sig-nificance Disease Association in Large Population-BasedStudies. Am J Hum Genet 2006, 79:481-492.
Page 8 of 8(page number not for citation purposes)