Embed Size (px)
Citation preview

Blue Star Limited
Investor Update
(With Opening Remarks)
Q4FY21 & FY21

2 | P a g e
Good morning ladies and gentlemen, this is Neeraj Basur. I will be providing you an overview of the
results for Blue Star Limited for the quarter and year ended March 2021.
I. FINANCIAL HIGHLIGHTS
With an improvement in the general business sentiments and the early onset of summer in some parts
of the country, all business segments witnessed growth as compared to Q4 levels last year. The overall
business recovery for the year was satisfactory and better than expectations at the year beginning.
Several cost rationalization and capital preservation measures coupled with prudent working capital
management resulted in healthy generation of cash from operations. These measures enabled the
Company to close FY21 with a strong Balance Sheet and a healthy liquidity position.
Financial highlights for the quarter ended March 31, 2021 on a consolidated basis, are summarized below:
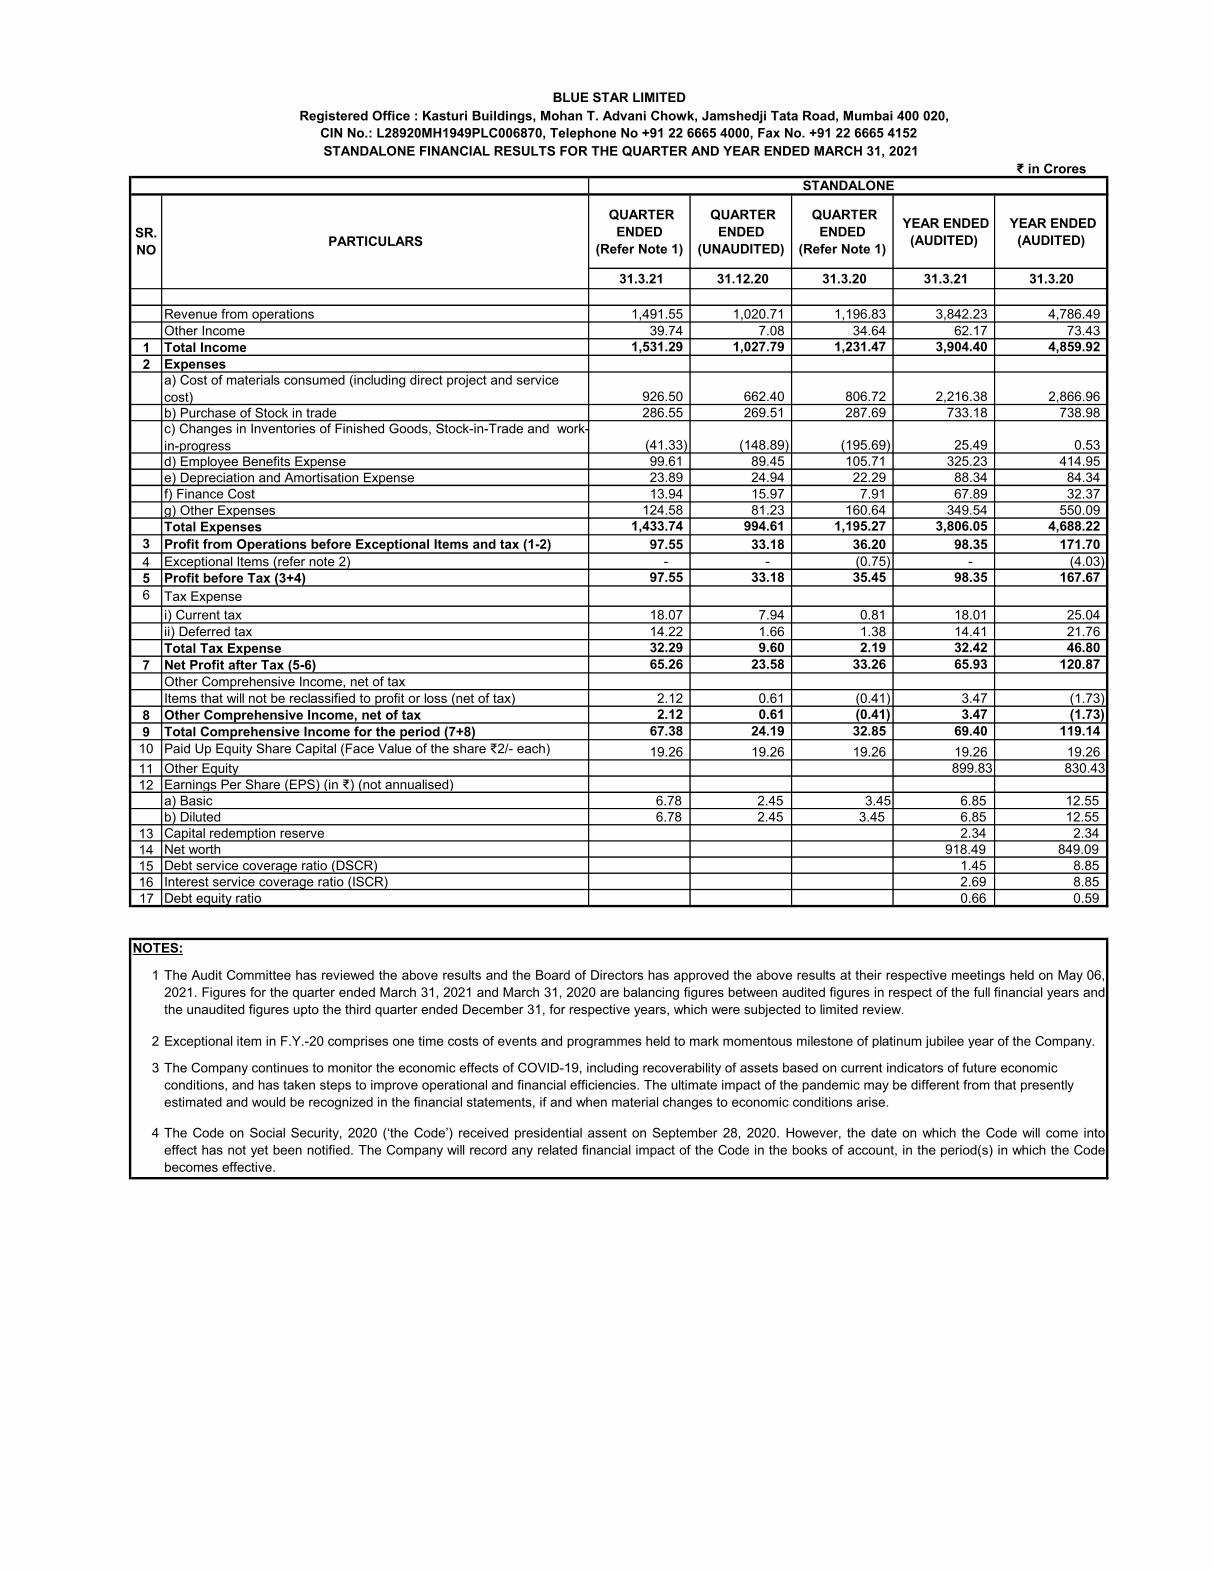
Revenue from operations for Q4FY21 recovered 124.0% to Rs 1611.56 cr as compared to Rs
1299.36 cr in Q4FY20.
EBIDTA (excluding other income and finance income) for Q4FY21 was Rs 101.81 cr (EBITDA
margin 6.3% of revenue) as compared to Rs 37.33 cr (EBITDA margin 2.9% of revenue) in
Q4FY20.
Other income in Q4FY21 includes a profit of Rs 32 cr from the sale of an office property in Mumbai
PBT before exceptional items was Rs 103.34 cr in Q4FY21 as compared to Rs 13.08 cr in Q4FY20.
Healthy cash from operations and improvement in working capital efficiencies enabled a reduction
of Rs 282.46 cr in net borrowings in Q4FY21
Financial highlights for the year ended March 31, 2021 on a consolidated basis, are summarized below:
Revenue from operations for FY21 recovered 79.5% to Rs 4263.59 cr as compared to Rs 5360.19
cr in FY20.
EBIDTA (excluding other income and finance income) for FY21 was Rs 239.81 cr (EBITDA margin
5.6% of revenue) as compared to Rs 282.78 cr (EBITDA margin 5.3% of revenue) in FY20.
Improvement in EBITDA margins was driven by improved profitability across businesses coupled
with cost rationalization measures.
PBT before exceptional items recovered 69.1% to Rs 145.15 cr in FY21 as compared to Rs 210.02
cr in FY20.
Tax expense for FY21 was Rs 47.09 cr as compared to Rs 65.32 cr in FY20.
Net profit for FY21 recovered 70.1% to Rs 100.35 cr as compared to Rs 143.25 cr in FY20.
Carried-forward order book as of March 31, 2021 remained almost flat at Rs 2952.42 cr as
compared to Rs 2946.59 cr as on March 31, 2020.

3 | P a g e
Capital Employed reduced to Rs 736.41 cr as on March 31, 2021 as compared to Rs 948.62 cr as
on December 31, 2020 and Rs 951.13 cr as on March 31, 2020, because of our continued focus
on working capital efficiencies.
We ended the year with a net positive cash balance of Rs 151.45 cr as of March 21 as compared
to a net borrowing of Rs 131.01 cr as of December 20. Net borrowing was Rs 155.00 cr as on
March 31, 2020 (debt equity ratio of 0.21).
II. BUSINESS HIGHLIGHTS FOR FY21
Segment I: Electro-Mechanical Projects & Commercial Air Conditioning Systems
Segment I revenue grew 18.1% to Rs 779.96 cr in Q4FY21 as compared to Rs 660.39 cr in Q4FY20.
Segment result was Rs 48.50 cr (6.2% of revenue) in Q4FY21 as against Rs 3.17 cr (0.5% of revenue)
in Q4FY20.
Segment revenue for the year recovered 78.5% to Rs 2218.72 cr as against Rs 2826.67 cr in FY20.
Segment result was Rs 106.49 cr (4.8% of revenue) in FY21 compared to Rs 120.26 cr (4.3% of revenue)
in FY20. Order inflow during the year was Rs 2244.84 cr as compared to Rs 3104.67 cr in FY20.
1. Electro-Mechanical Projects business
As expected, order inflows continued to be slow from the commercial buildings sector which is yet to
recover. Muted government expenditure also impacted order inflows in the infrastructure sector. Order
inflows from the factories and light industrial sector improved as compared to last year, driven by the
Make in India initiatives of the government.
We continued to moderate the pace of our execution, basis assessment of customer credit profile and
operating cash flow visibility for the ongoing jobs which enabled an improvement in margins for the
business.
We will continue to focus on the Infrastructure sector such as metro railways, electrical substations
and water distribution, which are expected to offer immediate growth opportunities. Factories, data
centers and warehousing sectors are also expected to throw up good opportunities in the upcoming
quarters.
Carried-forward order book of the Electro-Mechanical Projects business was Rs 2149 cr as on March
31, 2021 as compared to Rs 2039 cr as on March 31, 2020, a growth of 5.4%.

4 | P a g e
Segment-wise break-up of the carry forward order book of the Electro-Mechanical Projects business
is as follows:
Application Segment Share
Office (IT/Non-IT) 29%
Metro Rail 22%
Hospitals 9%
Industrial 9%
Power Generation & Distribution 6%
Malls 4%
Others (airports, hotels, educational institutions etc.) 21%
2. Commercial Air Conditioning Systems
Our Commercial Air Conditioning business registered a growth of 19% during the quarter. While order
inflows from key sectors such as IT, Offices, Marriage Halls and Auditoriums continued to be dormant,
we channelized our focus on the emerging sectors such as healthcare, pharma and light industrial.
We continue to maintain our number 1 position in Ducted Air Conditioning, number 2 in VRF and
number 3 in Chiller product categories.
We added new large capacity models and side-discharge system for residential use to our VRF product
range and have now completely indigenized this product category.
Major orders bagged in Q4FY21 were from Birla Cement (Nagpur), Avenue Supermart
(Vijaywada/Surat), ISRO (Bangalore), Flextronics (Chennai), Gujarat Biotechnology (Ahmedabad) and
West Coast Pharmaceuticals (Ahmedabad).
3. International Business
Normalization of business activities enabled a growth in revenue during the quarter. We witnessed
improved demand for both air conditioning and refrigeration products across SAARC and ASEAN
markets with channels stocking up for the upcoming summer sales.
The upcoming EXPO 2020 at Dubai and the FIFA tournament at Qatar are expected to offer growth
opportunities. The macro-economic environment in the region is expected to improve driven by the
establishment of trade relations between Israel and UAE and the thawing of ties between Qatar and
the GCC countries.
5 | P a g e
The projects businesses at Qatar and Malaysia continued to be impacted owing to Covid. While the
subsidiary at Qatar received some notable orders towards the end of the year that will get billed during
FY22, order inflow and the pace of execution in the joint venture at Malaysia continues to be slow due
to macro-economic instability.
We continue to focus on the expansion of the Blue Star product range and building brand awareness
and brand visibility in different markets that we are present in.
Segment II: Unitary Products
Segment II revenue which recovered 84.5% in Q2FY21 and 117.3% in Q3FY21 continued to improve its
recovery trajectory and grew 31.1% to Rs 781.81 cr in Q4FY21 as compared to Rs 596.28 cr in Q4FY20.
Segment result was Rs 62.06 cr (7.9% of revenue) in Q4FY21 as compared to Rs 43.75 cr (7.3% of
revenue) in Q4FY20.
Revenue for the year recovered 81.2% to Rs 1868.28 cr in FY21 as against Rs 2300.61 cr in FY20.
Segment result was Rs 108.82 cr (5.8% of revenue) in FY21 as compared with Rs 162.27 cr (7.1% of
revenue) in FY20.
Due to unprecedented increase in the raw material costs including steel, copper and ABS plastics as well
as ocean freight, the prices were increased between 5% and 8% for various SKUs with effect from
January 1, 2021.
1. Cooling and Purification Products business
Stocking of inventory by channels ahead of the peak selling season, improved share of billing from
the e-commerce channels and a general business sentiment improvement enabled a growth in revenue
for the room air conditioner business in Q4FY21 as compared to Q4FY20. The Room Air Conditioner
market grew by 27%. We grew by 33% and expect to have improved our market share to 13.25%
in Q4FY21.
Other products such as Water Purifiers, Air Purifiers and Air Coolers are performing well in line with
the plans and we continue to gain market share. We achieved a market share of 3% in water purifiers
with a major share of billing to e-commerce players. Having reached a break-even level, Water
Purifiers will be an e-commerce centric product portfolio going forward.
2. Commercial Refrigeration business
Our Commercial Refrigeration business witnessed good traction across all product categories during
the quarter. Improvement in demand across all customer segments coupled with aggressive stocking
by the channel enabled a growth in revenue during Q4FY21 as compared to Q4FY20. In addition to
continued demand from the healthcare, pharma and food processing and food delivery segments,
order inflows also improved from restaurants and the government sector.

6 | P a g e
With the launch of a new range of pharma cold rooms, medical freezers, ice lined refrigerators and
vaccine transporters, we offer end to end solution for vaccine distribution. Our products have been
well accepted by the government, vaccine manufacturers and private distributors. We continue to be
the market leader in the healthcare and pharmaceutical sector.
We continue to witness healthy growth for our supermarket refrigeration equipment driven by the
growth in the retail sector.
With the launch of our super coolers, we now also have a complete range of Visi Coolers, enabling us
to gain momentum in this segment as well.
Major orders were bagged in Q4FY21 from Dr Reddy’s Labs, Apollo, Aurobindo Pharma, Zydus Cadilla, Rebel Foods, Swiggy, Reliance Retail etc., to name a few.
Segment III: Professional Electronics and Industrial Systems
Segment III revenue grew by 16.6% to Rs 49.79 cr in Q4FY21 as compared to Rs 42.69 cr in Q4FY20.
Segment result was Rs 7.22 cr (14.5% of revenue) in Q4FY21 as compared to Rs 7.50 cr (17.6% of
revenue) in Q4FY20.
Segment revenue for the year recovered by 75.8% to Rs 176.59 cr as against Rs 232.91 cr in FY20.
Segment result was Rs 33.81 cr (19.1% of revenue) in FY21 as compared to Rs 54.34 cr (23.3% of
revenue) in FY20.
Revenue and profitability were higher in FY20 on account of few large value orders in the Data Security
Solutions business.
Revenue of this segment continues to be driven by opportunities from the BFSI sector for the Data
Security Solutions business, order inflows from the healthcare sector, and orders from the essential
services of the government sector.
Major orders were bagged in Q4FY21 from FIS Payment Solutions and Services, Navodaya Education
Trust, Jio Platforms Limited, IndusInd Bank Limited, ICICI Bank Limited, etc. to name a few.
With the wide portfolio of products and solutions forming part of our offerings, the prospects for this
business segment are positive.
7 | P a g e
III. BUSINESS OUTLOOK
Robust business recovery witnessed in the second half of the financial year enabled us to end the year
with a strong quarter. In the Electro-Mechanical projects business, we continue to prioritize our project
execution based on assessment of customer credit profile and operating cash flow visibility. The
government’s focus on localization under the Atmanirbhar Bharat Program has brought in good
opportunities for the company in the manufacturing sector.
We have strengthened our product portfolio under all categories in Room Air Conditioners and
Commercial Refrigeration. Digitization and Healthcare initiatives continue to offer good prospects for the
Professional Electronics and Industrial Systems segment.
However, the sustenance of this growth momentum has been challenged by the second wave of the
pandemic. Restrictions similar to lockdowns of varying degrees in many parts of the country since the
middle of April 2021 might impact the planned revenue growth for April and May. We are focused on
maximizing the revenue in the markets which are open and at the same time moderating the inventory
levels and operating costs. As on date, our factories at Himachal Pradesh, Dadra and Ahmedabad are
operational and the Wada plant is operational for executing export orders and domestic pharma and
healthcare contracts.
With the experience gained in the previous year, our focus continues to be on keeping our employees,
dealers and business associates safe, fulfilling emergency needs of our customers, building resiliency and
operating agility. As in the past, we are confident of sustaining this phase in a prudent and balanced
manner and continue our growth and expansion trajectory.
With that ladies and gentlemen, I am done with the opening remarks. I would like to now pass it back
to the moderator, who will open the floor to questions. I will try and answer as many questions as I can.
To the extent I am unable to, we will get back to you via e-mail.
With that, we are open for questions.
Ending remarks: Thank you very much, Ladies and Gentlemen. With this, we conclude this quarter’s earning call. Do feel free to revert to us in case any of your questions were not fully answered and we
will be happy to provide you additional details by email or in person.

8 | P a g e
For more information contact
Neeraj Basur
Blue Star Limited
Tel: 022-6654 4000
Sudhir Shetty
Adfactors PR Pvt. Limited
Tel: 022-6754 4444
SAFE HARBOUR
Certain statements in this release concerning our future growth prospects are forward-looking
statements which involve a number of risks and uncertainties that could cause actual results to differ
materially from those in such forward-looking statements. The risks and uncertainties relating to these
statements include, but are not limited to, risks and uncertainties regarding fiscal policy, competition,
inflationary pressures and general economic conditions affecting our industry. The Company does not
undertake to update any forward-looking statement that may be made from time to time by or on behalf
of the Company.
₹ in Crores
QUARTER
ENDED
(Refer Note 1)
QUARTER
ENDED
(UNAUDITED)
QUARTER
ENDED
(Refer Note 1)
YEAR ENDED
(AUDITED)
YEAR ENDED
(AUDITED)
31.3.21 31.12.20 31.3.20 31.3.21 31.3.20
Revenue from operations 1,491.55 1,020.71 1,196.83 3,842.23 4,786.49
Other Income 39.74 7.08 34.64 62.17 73.43
1 Total Income 1,531.29 1,027.79 1,231.47 3,904.40 4,859.92
2 Expenses
a) Cost of materials consumed (including direct project and service
cost) 926.50 662.40 806.72 2,216.38 2,866.96
b) Purchase of Stock in trade 286.55 269.51 287.69 733.18 738.98
c) Changes in Inventories of Finished Goods, Stock-in-Trade and work-
in-progress (41.33) (148.89) (195.69) 25.49 0.53
d) Employee Benefits Expense 99.61 89.45 105.71 325.23 414.95
e) Depreciation and Amortisation Expense 23.89 24.94 22.29 88.34 84.34
f) Finance Cost 13.94 15.97 7.91 67.89 32.37
g) Other Expenses 124.58 81.23 160.64 349.54 550.09
Total Expenses 1,433.74 994.61 1,195.27 3,806.05 4,688.22
3 Profit from Operations before Exceptional Items and tax (1-2) 97.55 33.18 36.20 98.35 171.70
4 Exceptional Items (refer note 2) - - (0.75) - (4.03)
5 Profit before Tax (3+4) 97.55 33.18 35.45 98.35 167.67
6 Tax Expense
i) Current tax 18.07 7.94 0.81 18.01 25.04
ii) Deferred tax 14.22 1.66 1.38 14.41 21.76
Total Tax Expense 32.29 9.60 2.19 32.42 46.80
7 Net Profit after Tax (5-6) 65.26 23.58 33.26 65.93 120.87
Other Comprehensive Income, net of tax
Items that will not be reclassified to profit or loss (net of tax) 2.12 0.61 (0.41) 3.47 (1.73)
8 Other Comprehensive Income, net of tax 2.12 0.61 (0.41) 3.47 (1.73)
9 Total Comprehensive Income for the period (7+8) 67.38 24.19 32.85 69.40 119.14
10 Paid Up Equity Share Capital (Face Value of the share ₹2/- each) 19.26 19.26 19.26 19.26 19.26
11 Other Equity 899.83 830.43
12 Earnings Per Share (EPS) (in ₹) (not annualised) a) Basic 6.78 2.45 3.45 6.85 12.55
b) Diluted 6.78 2.45 3.45 6.85 12.55
13 Capital redemption reserve 2.34 2.34
14 Net worth 918.49 849.09
15 Debt service coverage ratio (DSCR) 1.45 8.85
16 Interest service coverage ratio (ISCR) 2.69 8.85
17 Debt equity ratio 0.66 0.59
NOTES:
1
2
3
4
Exceptional item in F.Y.-20 comprises one time costs of events and programmes held to mark momentous milestone of platinum jubilee year of the Company.
The Company continues to monitor the economic effects of COVID-19, including recoverability of assets based on current indicators of future economic
conditions, and has taken steps to improve operational and financial efficiencies. The ultimate impact of the pandemic may be different from that presently
estimated and would be recognized in the financial statements, if and when material changes to economic conditions arise.
The Code on Social Security, 2020 (‘the Code’) received presidential assent on September 28, 2020. However, the date on which the Code will come into
effect has not yet been notified. The Company will record any related financial impact of the Code in the books of account, in the period(s) in which the Code
becomes effective.
SR.
NOPARTICULARS
The Audit Committee has reviewed the above results and the Board of Directors has approved the above results at their respective meetings held on May 06,
2021. Figures for the quarter ended March 31, 2021 and March 31, 2020 are balancing figures between audited figures in respect of the full financial years and
the unaudited figures upto the third quarter ended December 31, for respective years, which were subjected to limited review.
BLUE STAR LIMITED
Registered Office : Kasturi Buildings, Mohan T. Advani Chowk, Jamshedji Tata Road, Mumbai 400 020,
CIN No.: L28920MH1949PLC006870, Telephone No +91 22 6665 4000, Fax No. +91 22 6665 4152
STANDALONE FINANCIAL RESULTS FOR THE QUARTER AND YEAR ENDED MARCH 31, 2021
STANDALONE

5
i
ii Details of Non - Convertible Debentures are as follows : ₹ in Crores
Amount Date Amount Date
7.65% Non-Convertible Debenture (Series - I) - Principal - - 175.00 01-Jun-23
7.65% Non-Convertible Debenture (Series - I) - Interest - - 13.39 01-Jun-21
7.65% Non-Convertible Debenture (Series - II) - Principal - - 175.00 01-Jun-23
7.65% Non-Convertible Debenture (Series - II) - Interest - - 13.39 01-Jun-21
iii
iv Formula used for calculation of ratios :
6 Details of Commercial Papers are as follows : ₹ in Crores
March 31, 2021 - CARE A1+,
CRISIL A1+
March 31, 2020 50.00 CARE A1+,
CRISIL A1+
7
8
9 Previous period / year's figures have been regrouped / rearranged, wherever necessary.
Date : May 06, 2021
Place : Mumbai
www.bluestarindia.com B Thiagarajan
(DIN : 01790498)
For BLUE STAR LIMITED
Additional disclosure as per regulation 52(4) of SEBI (Listing Obligations and Disclosure Requirements), Regulation 2015.
The Company has alloted unsecured redeemable non-convertible debentures (NCDs) on June 1, 2020. Total Non-Convertible Debenture of the Company
outstanding as on March 31, 2021 are Rs. 350 crore. The asset cover in respect of the non-convertible debenture of the Company as on March 31, 2021
exceeds hundred percent of the principal amount of the said listed unsecured Non-Convertible Debentures.
PARTICULARSPrevious Due Date Next Due Date
The NCDs issued by the Company are rated by CARE AA+ (Outlook : Negative)
PeriodAmount
Outstanding
The Directors have recommended a dividend of ₹ 4 per equity share of ₹ 2 each for FY20-21 (FY19-20, Interim and Final Dividend of ₹ 10 per equity share).
Managing Director
Movement and repayment of Commercial Papers is given in "Annexure A".
Net worth as per section 2(57) of the Companies Act, 2013
DSCR = [Earnings before interest, Tax and Exceptional Items] / [Interest expenses + Principal repayments made during the period for long term loans]
ISCR = [Earnings before Interest, Tax and Exceptional Items] / Interest expenses
Debt / Equity Ratio = Total Debt / Equity
Rating
The Company is in compliance with the requirements of SEBI circular dated November 26, 2018 applicable to Large Corporate Borrowers (Refer Note 5).

₹ in Crores
AS AT
31.3.21
AS AT
31.3.20
(AUDITED) (AUDITED)
A ASSETS
1. Non-Current Assets
(a) Property Plant & Equipment 248.95 250.65
(b) Right-of-use assets 43.78 54.52
(c) Capital Work in Progress 54.31 56.75
(d) Investment Property - 49.81
(e) Intangible Assets 52.13 51.13
(f) Intangible Assets under development 3.42 11.01
(g) Financial Assets
- Investments 220.82 220.88
-Loans 23.79 21.13
-Other Financial Assets 6.01 4.58
(h) Income tax Asset (Net) 85.32 93.44
(i) Deferred Tax Assets (Net) 44.07 58.48
(j) Other Non Current Assets 55.90 60.56
Total - Non Current Assets 838.50 932.94
2. Current Assets
(a) Inventories 867.69 849.65
(b) Financial Assets
-Investments 279.05 -
-Loans 18.60 13.87
-Trade Receivables 712.19 745.83
-Cash and Cash Equivalents 296.19 218.18
-Other Bank Balances 4.22 7.79
-Other Financial Assets 0.38 2.30
(c) Other Current Assets 445.13 543.11
(d) Asset held for sale 17.70 0.08
Total Current Assets 2,641.15 2,380.81
TOTAL - ASSETS 3,479.65 3,313.75
B EQUITY AND LIABILITIES
1. Equity
(a) Equity Share Capital 19.26 19.26
(b) Other Equity 899.83 830.43
Total Equity 919.09 849.69
2. Non-Current Liabilities
(a) Financial Liabilities
- Borrowings 346.86 41.88
- Lease Liabilities 29.36 37.72
(b) Provisions 10.81 13.13
(c) Government Grants 8.83 9.38
Total - Non-current liabilities 395.86 102.11
3. Current Liabilities
(a) Financial Liabilities
-Borrowings 231.93 449.04
-Trade Payables
a. Total outstanding dues of Micro Enterprises & Small Enterprises 66.89 44.08
b. Total outstanding dues of creditors other than Micro Enterprises & Small
Enterprises1,388.96 1,394.49
- Lease Liabilities 22.86 21.42
-Other Financial Liabilities 33.72 30.18
(b) Provisions 37.66 53.19
(c) Government Grants 2.33 3.52
(d) Other Current Liabilities 380.35 366.03
Total - Current Liabilities 2,164.70 2,361.95
TOTAL - EQUITY AND LIABILITIES 3,479.65 3,313.75
Date : May 06, 2021
Place : Mumbai
BLUE STAR LIMITED
STATEMENT OF ASSETS AND LIABILITIES AS ON MARCH 31, 2021
SR.
NO
PARTICULARS
STANDALONE
For BLUE STAR LIMITED
B Thiagarajan
Managing Director
(DIN : 01790498)

₹ in Crores
March 31, 2021 March 31, 2020
AUDITED AUDITED
98.35 167.67
88.34 84.34
Amortisation of government grant (2.51) (20.29)
Fair Value (Gain) / loss on financial instruments 2.00 (5.65)
Loss on sale of property, plant & equipments - 0.40
Profit on sale of property, plant & equipments (32.33) -
30.45 45.91
(7.58) 11.77
Liabilities written back (15.17) (6.25)
67.89 32.37
Rental income (6.36) (6.32)
(8.94) (5.20)
Mutual fund income (5.13) -
Dividend (income) (2.40) (33.11)
206.61 265.64
39.23 10.80
(11.76) (10.94)
4.34 10.49
2.04 226.21
(18.04) 8.10
(7.39) (3.32)
Other assets 105.06 (41.61)
320.09 465.37
(11.74) (73.35)
308.35 392.02
(67.28) (85.09)
Payment for obligation towards guarantee for Joint Venture - (19.24)
Purchase of investments (279.05) -
80.87 2.14
Rent received 6.36 6.32
5.88 4.67
Income from mutual fund 5.13 -
Dividends received 2.40 33.11
(245.69) (58.09)
Proceeds / (repayment) from short term borrowings (net) (272.11) 39.63
Proceeds from long term borrowings 350.00 50.00
Repayment of long term borrowings (50.00) -
Inter Corporate Deposit Received from Subidiary 55.00 45.00
(23.71) (15.07)
(42.59) (33.00)
(1.24) (224.10)
15.35 (137.54)
78.01 196.39
218.18 21.79
296.19 218.18
- (0.00)
Date : May 06, 2021
Place : Mumbai
NET INCREASE/(DECREASE) IN CASH AND CASH EQUIVALENTS (A + B + C)
Cash and cash equivalents at the beginning of the year
CASH AND CASH EQUIVALENTS AT THE END OF THE YEAR
CASH FLOWS FROM INVESTING ACTIVITIES
Purchase of Property Plant and equipments, including capital work in progress and capital advances
Proceeds from sale of property, plant and equipment
Interest received
Net cash flow from/ (used in) investing activities (B)
CASH FLOWS FROM FINANCING ACTIVITIES
Repayment of Lease Liabilities
Interest and Bank charges paid
Dividend paid on equity shares (including dividend distribution tax)
Other current liabilities
Net cash flow from/ (used in) in financing activities (C)
Inventories
Loans
Cash generated from operations
Direct taxes paid (net of refunds)
Net cash flow from/ (used in) operating activities (A)
BLUE STAR LIMITED
Standalone Cash Flow Statement for year ended March 31, 2021
Year ended
CASH FLOW FROM OPERATING ACTIVITIES
Profit before Tax
Pariculars
For BLUE STAR LIMITED
B Thiagarajan
Managing Director
(DIN : 01790498)
Depreciation/ amortisation
Adjustments to reconcile profit before tax to net cash flows
Trade receivables
Bad debts written off and provision for doubtfull debts
Unrealized foreign exchange loss / (gain)
Finance Cost
Interest (income)
OPERATING PROFIT BEFORE WORKING CAPITAL CHANGES
Increase/ (Decrease) in working capital :
Trade Payables
Provisions
Sr.
No.ISIN Date of Issue Maturity Date
Principal Amount
(₹ in Crores)
Whether paid
on due date or
not
Outstanding
Amount as on
March 31, 2021 (₹ in Crores)
1 INE472A14LO4 24-03-2020 12-06-2020 50.00 Yes -
2 INE472A14LQ9 07-04-2020 29-06-2020 50.00 Yes -
3 INE472A14LQ9 08-04-2020 29-06-2020 25.00 Yes -
4 INE472A14LS5 09-04-2020 30-06-2020 25.00 Yes -
5 INE472A14LS5 13-04-2020 30-06-2020 50.00 Yes -
6 INE472A14LR7 09-04-2020 28-08-2020 25.00 Yes -
7 INE472A14LV9 17-06-2020 15-09-2020 50.00 Yes -
8 INE472A14LT3 29-04-2020 23-10-2020 50.00 Yes -
9 INE472A14LU1 10-06-2020 15-03-2021 100.00 Yes -
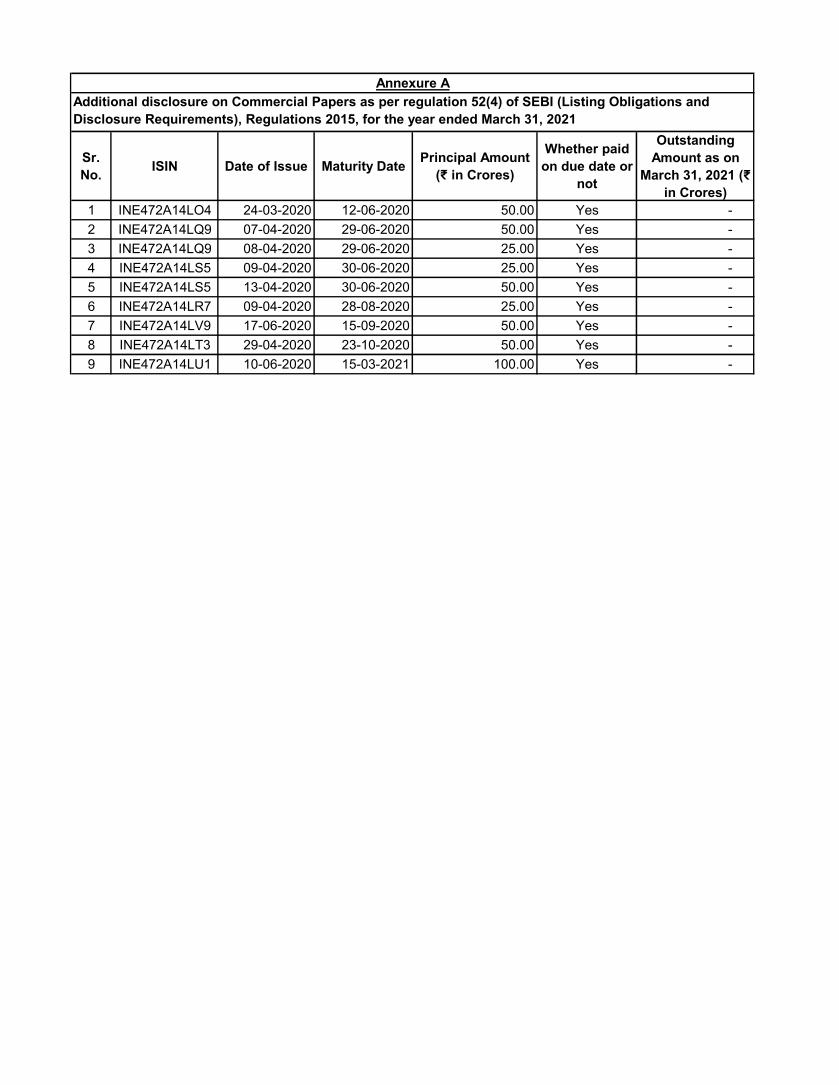
Annexure A
Additional disclosure on Commercial Papers as per regulation 52(4) of SEBI (Listing Obligations and
Disclosure Requirements), Regulations 2015, for the year ended March 31, 2021
₹ in Crores
QUARTER
ENDED
(Refer Note 1)
QUARTER
ENDED
(UNAUDITED)
QUARTER
ENDED
(Refer Note 1)
YEAR ENDED
(AUDITED)
YEAR ENDED
(AUDITED)
31.3.21 31.12.20 31.3.20 31.3.21 31.3.20
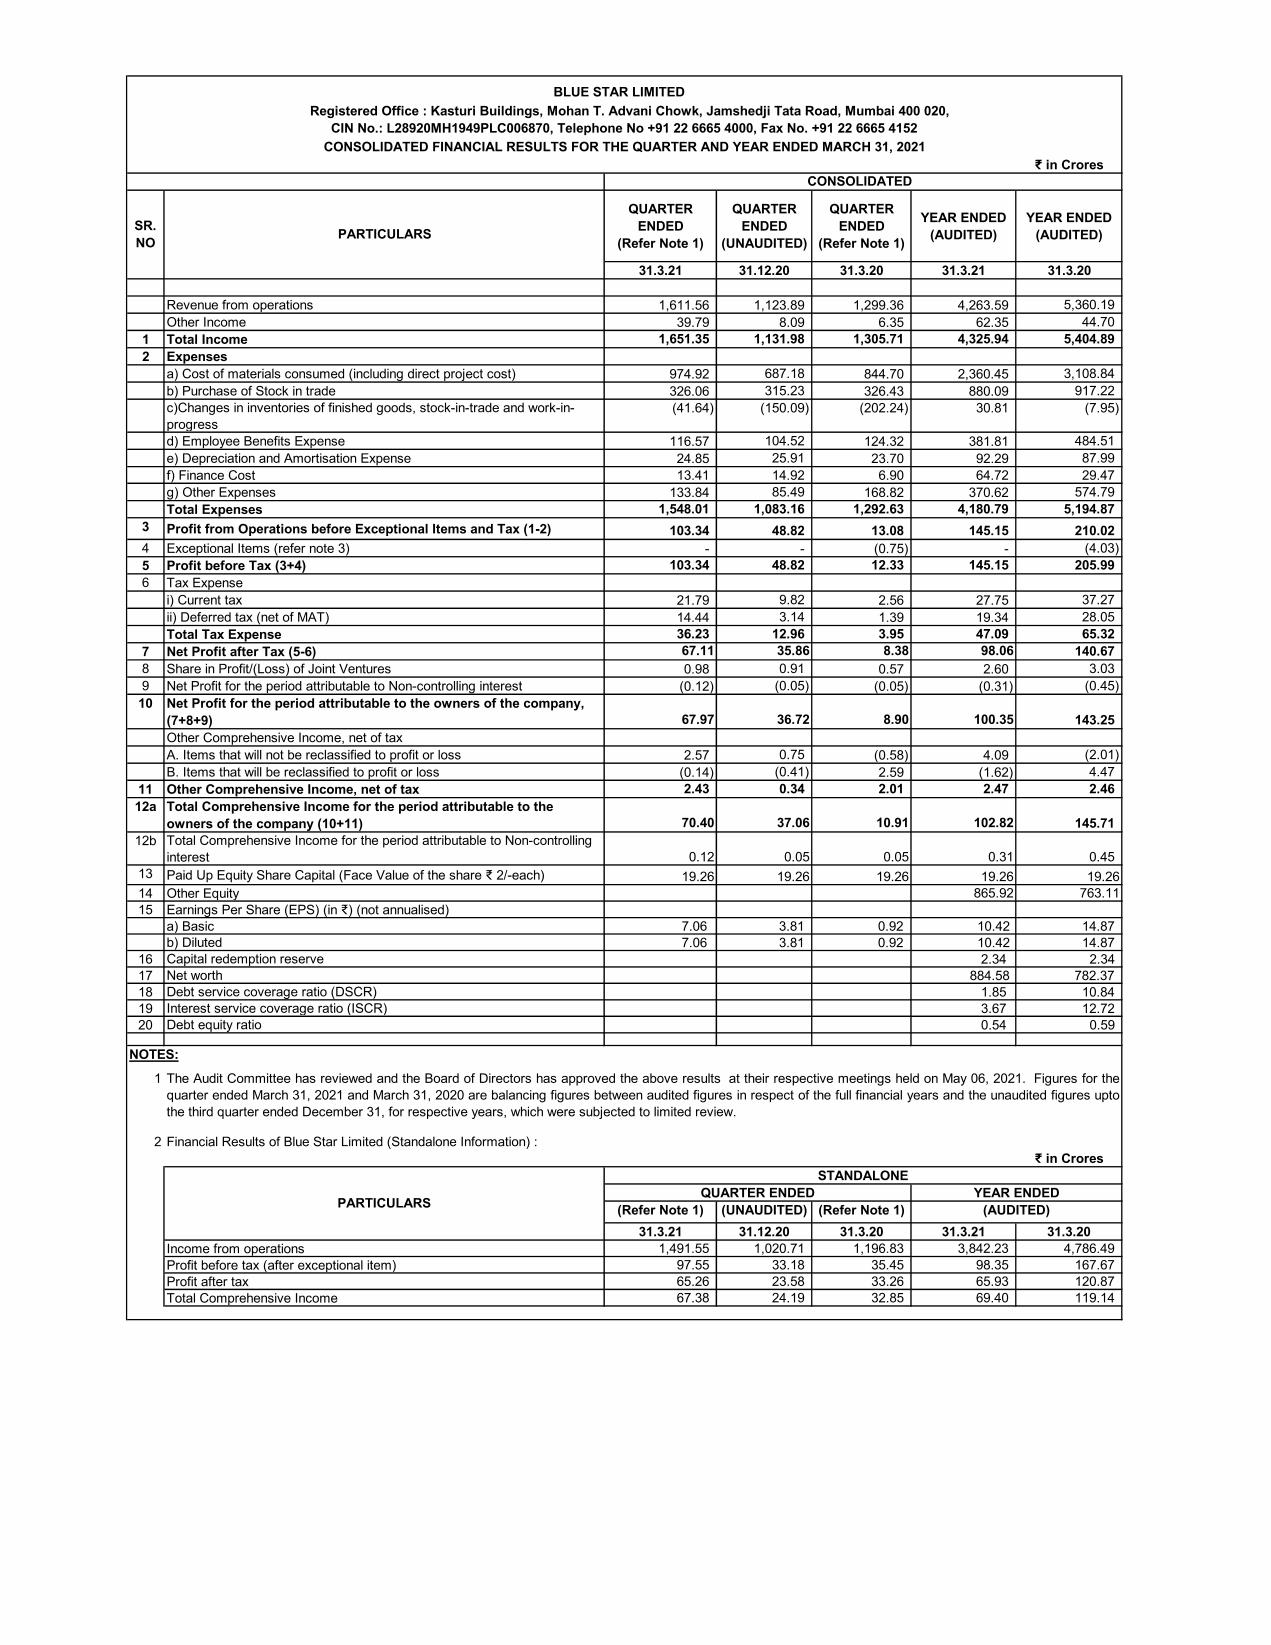
Revenue from operations 1,611.56 1,123.89 1,299.36 4,263.59 5,360.19
Other Income 39.79 8.09 6.35 62.35 44.70
1 Total Income 1,651.35 1,131.98 1,305.71 4,325.94 5,404.89
2 Expenses
a) Cost of materials consumed (including direct project cost) 974.92 687.18 844.70 2,360.45 3,108.84
b) Purchase of Stock in trade 326.06 315.23 326.43 880.09 917.22
c)Changes in inventories of finished goods, stock-in-trade and work-in-
progress
(41.64) (150.09) (202.24) 30.81 (7.95)
d) Employee Benefits Expense 116.57 104.52 124.32 381.81 484.51
e) Depreciation and Amortisation Expense 24.85 25.91 23.70 92.29 87.99
f) Finance Cost 13.41 14.92 6.90 64.72 29.47
g) Other Expenses 133.84 85.49 168.82 370.62 574.79
Total Expenses 1,548.01 1,083.16 1,292.63 4,180.79 5,194.87
3 Profit from Operations before Exceptional Items and Tax (1-2) 103.34 48.82 13.08 145.15 210.02
4 Exceptional Items (refer note 3) - - (0.75) - (4.03)
5 Profit before Tax (3+4) 103.34 48.82 12.33 145.15 205.99
6 Tax Expense
i) Current tax 21.79 9.82 2.56 27.75 37.27
ii) Deferred tax (net of MAT) 14.44 3.14 1.39 19.34 28.05
Total Tax Expense 36.23 12.96 3.95 47.09 65.32
7 Net Profit after Tax (5-6) 67.11 35.86 8.38 98.06 140.67
8 Share in Profit/(Loss) of Joint Ventures 0.98 0.91 0.57 2.60 3.03
9 Net Profit for the period attributable to Non-controlling interest (0.12) (0.05) (0.05) (0.31) (0.45)
10 Net Profit for the period attributable to the owners of the company,
(7+8+9) 67.97 36.72 8.90 100.35 143.25
Other Comprehensive Income, net of tax
A. Items that will not be reclassified to profit or loss 2.57 0.75 (0.58) 4.09 (2.01)
B. Items that will be reclassified to profit or loss (0.14) (0.41) 2.59 (1.62) 4.47
11 Other Comprehensive Income, net of tax 2.43 0.34 2.01 2.47 2.46
12a Total Comprehensive Income for the period attributable to the
owners of the company (10+11) 70.40 37.06 10.91 102.82 145.71
12b Total Comprehensive Income for the period attributable to Non-controlling
interest 0.12 0.05 0.05 0.31 0.45
13 Paid Up Equity Share Capital (Face Value of the share ₹ 2/-each) 19.26 19.26 19.26 19.26 19.26
14 Other Equity 865.92 763.11
15 Earnings Per Share (EPS) (in ₹) (not annualised) a) Basic 7.06 3.81 0.92 10.42 14.87
b) Diluted 7.06 3.81 0.92 10.42 14.87
16 Capital redemption reserve 2.34 2.34
17 Net worth 884.58 782.37
18 Debt service coverage ratio (DSCR) 1.85 10.84
19 Interest service coverage ratio (ISCR) 3.67 12.72
20 Debt equity ratio 0.54 0.59
NOTES:
1
2
₹ in Crores
(Refer Note 1) (UNAUDITED) (Refer Note 1)
31.3.21 31.12.20 31.3.20 31.3.21 31.3.20
Income from operations 1,491.55 1,020.71 1,196.83 3,842.23 4,786.49
Profit before tax (after exceptional item) 97.55 33.18 35.45 98.35 167.67
Profit after tax 65.26 23.58 33.26 65.93 120.87
Total Comprehensive Income 67.38 24.19 32.85 69.40 119.14
BLUE STAR LIMITED
Registered Office : Kasturi Buildings, Mohan T. Advani Chowk, Jamshedji Tata Road, Mumbai 400 020,
CIN No.: L28920MH1949PLC006870, Telephone No +91 22 6665 4000, Fax No. +91 22 6665 4152
CONSOLIDATED FINANCIAL RESULTS FOR THE QUARTER AND YEAR ENDED MARCH 31, 2021
CONSOLIDATED
SR.
NOPARTICULARS
Financial Results of Blue Star Limited (Standalone Information) :
PARTICULARS
STANDALONE
QUARTER ENDED
(AUDITED)
The Audit Committee has reviewed and the Board of Directors has approved the above results at their respective meetings held on May 06, 2021. Figures for the
quarter ended March 31, 2021 and March 31, 2020 are balancing figures between audited figures in respect of the full financial years and the unaudited figures upto
the third quarter ended December 31, for respective years, which were subjected to limited review.
YEAR ENDED

3
4
5
6 Additional disclosure as per regulation 52(4) of SEBI (Listing Obligations and Disclosure Requirements), Regulation 2015.
i
ii Details of Non - Convertible Debentures are as follows : ₹ in Crores
Amount Date Amount Date
7.65% Non Convertible Debentures (Series - I) - Principal - - 175.00 01-Jun-23
7.65% Non Convertible Debentures (Series - I) - Interest - - 13.39 01-Jun-21
7.65% Non Convertible Debentures (Series - II) - Principal - - 175.00 01-Jun-23
7.65% Non Convertible Debentures (Series - II) - Interest - - 13.39 01-Jun-21
iii The NCDs issued by the Company are rated by CARE AA+ (Outlook : Negative)
iv
7 Details of Commercial Papers are as follows :
₹ in CroresAmount
Outstanding
March 31, 2021 - CARE A1+,
CRISIL A1+
March 31, 2020 50.00 CARE A1+,
CRISIL A1+
8
9
10 Previous period / year's figures have been regrouped / rearranged, wherever necessary.
Date : May 06, 2021
Place : Mumbai For BLUE STAR LIMITED
www.bluestarindia.com B Thiagarajan
Managing Director
(DIN : 01790498)
The Company is in compliance with the requirements of SEBI circular dated November 26, 2018 applicable to Large Corporate Borrowers.(Refer Note 6)
Debt / Equity Ratio = Total Debt / Equity
The Group continues to monitor the economic effects of COVID-19, including recoverability of assets based on current indicators of future economic conditions, and
has taken steps to improve operational and financial efficiencies. The ultimate impact of the pandemic may be different from that presently estimated and would be
recognized in the financial statements, if and when material changes to economic conditions arise.
The Code on Social Security, 2020 (‘the Code’) received presidential assent on September 28, 2020. However, the date on which the Code will come into effect has not yet been notified. The Group will record any related financial impact of the Code in the books of account, in the period(s) in which the Code becomes effective.
The Company has alloted unsecured redeemable non-convertible debentures (NCDs) on June 1, 2020. Total Non-Convertible Debenture of the Company
outstanding as on March 31, 2021 are Rs. 350 crore. The asset cover in respect of the non-convertible debenture of the Company as on March 31, 2021 exceeds
hundred percent of the principal amount of the said listed unsecured Non-Convertible Debentures.
PARTICULARSPrevious Due Date Next Due Date
Period Rating
Movement and repayment of Commercial Papers is given in "Annexure A".
Net worth as per section 2(57) of the Companies Act, 2013
DSCR = [Earnings before interest, Tax and Exceptional Items] / [Interest expenses + Principal repayments made during the period for long term loans]
ISCR = [Earnings before Interest, Tax and Exceptional Items] / Interest expenses
The Directors have recommended a dividend of ₹ 4 per equity share of ₹ 2 each for FY20-21 (FY19-20, Interim and Final Dividend of ₹ 10 per equity share).
Exceptional item in F.Y-20 comprises one time costs of events and programmes held to mark momentous milestone of platinum jubilee year of the Company.

₹ in Crores
Sr.
No.Particulars
QUARTER
ENDED
(Refer Note 1)
QUARTER
ENDED
(UNAUDITED)
QUARTER
ENDED
(Refer Note 1)
YEAR ENDED
(AUDITED)
YEAR ENDED
(AUDITED)
31.3.21 31.12.20 31.3.20 31.3.21 31.3.20
I SEGMENT REVENUE
a. Electro- Mechanical Projects and Commercial Air Conditioning Systems 779.96 585.49 660.39 2,218.72 2,826.67
b. Unitary Products 781.81 492.97 596.28 1,868.28 2,300.61
c. Professional Electronics and Industrial Systems 49.79 45.43 42.69 176.59 232.91
TOTAL SEGMENT REVENUE 1,611.56 1,123.89 1,299.36 4,263.59 5,360.19
II SEGMENT RESULT - - - - -
PROFIT BEFORE INTEREST & TAX
a. Electro- Mechanical Projects and Commercial Air Conditioning Systems 48.50 34.11 3.17 106.49 120.26
b. Unitary Products 62.06 38.79 43.75 108.82 162.27
c. Professional Electronics and Industrial Systems 7.22 8.26 7.50 33.81 54.34
TOTAL SEGMENT RESULT 117.78 81.16 54.42 249.12 336.87
Less: i) Interest and Other Financial Charges 13.41 14.92 6.90 64.72 29.47
ii) Un-allocable Expenditure 1.03 17.42 34.44 39.25 97.38
TOTAL PROFIT BEFORE TAXATION AND EXCEPTIONAL ITEM 103.34 48.82 13.08 145.15 210.02
Exceptional items - - (0.75) - (4.03)
PROFIT BEFORE TAXATION 103.34 48.82 12.33 145.15 205.99
2,409.98 2,409.98 2,409.98 2,409.98
III SEGMENT ASSETS 0.19 0.19 0.19 0.19
a. Electro- Mechanical Projects and Commercial Air Conditioning Systems 1,664.85 1,574.93 1,737.05 1,664.85 1,737.05
b. Unitary Products 986.97 898.61 1,001.45 986.97 1,001.45
c. Professional Electronics and Industrial Systems 62.36 57.06 76.29 62.36 76.29
d. Un-allocable Corporate Assets 835.27 805.45 624.47 835.27 624.47
TOTAL SEGMENT ASSETS 3,549.45 3,336.05 3,439.26 3,549.45 3,439.26
IV SEGMENT LIABILITIES
a. Electro- Mechanical Projects and Commercial Air Conditioning Systems 1,240.69 1,113.74 1,288.63 1,240.69 1,288.63
b. Unitary Products 757.71 617.56 697.00 757.71 697.00
c. Professional Electronics and Industrial Systems 78.50 68.89 83.52 78.50 83.52
d. Un-allocable Corporate Liabilities 584.69 718.24 585.43 584.69 585.43
TOTAL SEGMENT LIABILITIES 2,661.59 2,518.43 2,654.58 2,661.59 2,654.58
V CAPITAL EMPLOYED
(Segment Assets - Segment Liabilities)
a. Electro- Mechanical Projects and Commercial Air Conditioning Systems 424.16 461.19 448.42 424.16 448.42
b. Unitary Products 229.26 281.05 304.45 229.26 304.45
c. Professional Electronics and Industrial Systems (16.14) (11.83) (7.23) (16.14) (7.23)
d. Un-allocable Corporate Assets less Liabilities 250.58 87.21 39.04 250.58 39.04
TOTAL CAPITAL EMPLOYED IN THE COMPANY 887.86 817.62 784.68 887.86 784.68
87,463 84,684 888 80,052
Notes : (0) (0) (0) (1)
1
2 Unitary Product segment is seasonal in nature.
3 Previous period / year's figures have been regrouped / rearranged wherever necessary.
For BLUE STAR LIMITED
Date : May 06, 2021
Place : Mumbai
(DIN : 01790498)
Managing Director
B Thiagarajan
BLUE STAR LIMITED
SEGMENT WISE REVENUE, RESULTS & CAPITAL EMPLOYED FOR THE QUARTER AND YEAR ENDED MARCH 31, 2021
CONSOLIDATED
Based on the "management approach" as defined in Ind AS 108-Operating Segments, the Chief Operating Decision Makers evaluate the Company's
performance and allocates resources based on an analysis of various performance indicators by business segments. Accordingly, information has been
presented along these business segments.

₹ in Crores
AS AT
31.3.21
AS AT
31.3.20
AUDITED AUDITED
A ASSETS
1. Non-Current Assets
(a) Property plant & equipment 269.23 274.24
(b) Right-of-use assets 50.07 55.45
(b) Capital work in progress 68.11 56.35
(c) Investment property 11.95 62.71
(d) Intangible assets 52.31 51.39
(e) Intangible assets under development 3.42 11.01
(f) Investment in joint ventures 15.91 16.87
(g) Financial assets
-Loans 22.42 19.28
-Other financial assets 6.01 4.62
(h) Income tax asset (net) 86.20 91.46
(i) Deferred tax assets (net) 47.49 81.75
(j) Other non current assets 56.77 62.92
Total - Non Current Assets 689.90 788.05
2. Current Assets
(a) Inventories 882.42 869.82
(b) Financial assets
-Investments 279.06 -
-Loans 20.12 14.63
-Trade receivables 810.98 837.67
-Cash & cash equivalents 327.93 286.15
-Other bank balances 4.23 7.79
-Other Financial Assets 0.26 -
(c) Other current assets 534.47 635.07
Asset held for sale 0.08 0.08
Total - Current Assets 2,859.55 2,651.21
TOTAL - ASSETS 3,549.45 3,439.26
B EQUITY AND LIABILITIES
1. Equity
(a) Equity share capital 19.26 19.26
(b) Other equity 865.92 763.11
Equity attributable to equity holders of the company 885.18 782.37
2. Non controlling interest 2.68 2.31
Total Equity 887.86 784.68
3. Non-Current Liabilities
(a) Financial liabilities
-Borrowings 349.26 47.71
-Lease liabilities 31.23 38.54
(b) Long term provisions 10.82 13.26
(c) Government grant 8.83 9.38
Total - Non-current liabilities 400.14 108.89
4. Current Liabilities
(a) Financial liabilities
-Borrowings 102.34 401.23
-Trade payables
a. Total outstanding dues of Micro Enterprises & Small Enterprises 66.97 44.08
b. Total outstanding dues of creditors other than Micro Enterprises &
Small Enterprises1,537.92 1,538.29
- Lease liabilities 24.10 21.24
- Other financial liabilities 36.81 33.37
(b) Provisions 48.37 64.98
(c) Government grants 2.33 3.52
(d) Income tax liabilities (net) 0.59 1.43
(d) Other current liabilities 442.02 437.56
Total - Current liabilities 2,261.45 2,545.69
TOTAL - EQUITY AND LIABILITIES 3,549.45 3,439.26
0.00 (0.01) 63,143
Date : May 06, 2021
Place : Mumbai
BLUE STAR LIMITED
STATEMENT OF ASSETS AND LIABILITIES AS ON MARCH 31, 2021
Sr.
No.
PARTICULARS
CONSOLIDATED
For BLUE STAR LIMITED
B Thiagarajan
Managing Director
(DIN : 01790498)

₹ in CroresParticulars
31st March, 2021 31st March, 2020
AUDITED AUDITED
CASH FLOW FROM OPERATING ACTIVITIES
Profit before Tax 145.15 205.99
Adjustments to reconcile profit before tax to net cash flows
Depreciation/ amortization 92.29 87.99
Amortisation of Government Grant (2.51) (20.29)
Fair Value (Gain) / loss on financial instruments 2.00 (5.69)
Loss/(Profit) on sale of Property, plant and equipment (32.17) 0.19
Bad debts written off and provision for doubtful debts 34.28 48.00
Unrealized foreign exchange loss / (gain) (7.66) 11.45
Liabilities written back (19.48) (11.65)
Rental income (6.36) (7.47)
Finance Cost 64.72 29.47
Interest (income) (10.22) (7.99)
Income form mutual fund (5.13) (1.81)
OPERATING PROFIT BEFORE WORKING CAPITAL CHANGES 254.91 328.20
Increase/ (Decrease) in working capital :
Trade payables 53.30 50.99
Provisions (14.26) (6.31)
Other current liabilities (4.35) (7.35)
Trade receivables (12.84) 229.38
Inventories (12.60) (0.50)
Loans (8.62) (2.75)
Other assets 104.50 (56.31)
Cash generated from operations 360.03 535.35
Direct taxes paid (net of refunds) (10.22) (85.39)
Net cash flow from/ (used in) operating activities (A) 349.81 449.95
CASH FLOWS FROM INVESTING ACTIVITIES
Purchase of Property Plant and equipments, including Capital work-in-progress and capital advances (63.52) (86.04)
Purchase of investments (279.06) -
Payment for obligation towards guarantee given for Joint Venture - (19.24)
Proceeds from of reedemption of preference share of Joint Venture 3.48 -
Proceeds from sale of Property, Plant and Equipment 80.88 4.63
Rent received 6.36 7.47
Interest received 7.16 7.44
Dividends received from Joint Venture - 3.17
Income from mutual fund 5.13 1.81
Net cash flow from/ (used in) investing activities (B) (239.57) (80.75)
CASH FLOWS FROM FINANCING ACTIVITIES
Proceeds / (repayment) from short term borrowings (298.89) 65.92
Proceeds from long term borrowings 350.00 50.00
Repayment of long term borrowings (53.24) (3.11)
Repayment of lease liabilities (26.68) (18.51)
Interest and bank charges (39.52) (31.06)
Dividend paid on equity shares (including Dividend Distribution Tax) (1.24) (230.14)
Net cash flow from/ (used in) in financing activities (C) (69.57) (166.90)
NET INCREASE/(DECREASE) IN CASH AND CASH EQUIVALENTS (A + B + C) 40.67 202.29
Cash and cash equivalents at the beginning of the year 286.15 83.86
Effects of Exchange Difference on restatement of Foreign Currency Cash & Cash Equivalent 1.11 -
CASH AND CASH EQUIVALENTS AT THE END OF THE YEAR 327.93 286.15
Date : May 06, 2021
Place : Mumbai
Managing Director
(DIN : 01790498)
Blue Star Limited
Consolidated Cash Flow Statement for year ended March 31, 2021
For the year ended
For BLUE STAR LIMITED
B Thiagarajan

Sr.
No.ISIN Date of Issue Maturity Date
Principal Amount
(₹ in Crores)
Whether paid
on due date or
not
Outstanding Amount
as on March 31, 2021
(₹ in Crores)
1 INE472A14LO4 24-03-2020 12-06-2020 50.00 Yes -
2 INE472A14LQ9 07-04-2020 29-06-2020 50.00 Yes -
3 INE472A14LQ9 08-04-2020 29-06-2020 25.00 Yes -
4 INE472A14LS5 09-04-2020 30-06-2020 25.00 Yes -
5 INE472A14LS5 13-04-2020 30-06-2020 50.00 Yes -
6 INE472A14LR7 09-04-2020 28-08-2020 25.00 Yes -
7 INE472A14LV9 17-06-2020 15-09-2020 50.00 Yes -
8 INE472A14LT3 29-04-2020 23-10-2020 50.00 Yes -
9 INE472A14LU1 10-06-2020 15-03-2021 100.00 Yes -
Annexure A
Additional disclosure on Commercial Papers as per regulation 52(4) of SEBI (Listing Obligations and Disclosure
Requirements), Regulations 2015, for the year ended March 31, 2021