Embed Size (px)
Citation preview

Black Box Machine Learning
David S. Rosenberg
Bloomberg ML EDU
September 20, 2017
David S. Rosenberg (Bloomberg ML EDU) September 20, 2017 1 / 67

Overview
David S. Rosenberg (Bloomberg ML EDU) September 20, 2017 2 / 67
Outline
What is machine learning for?What is machine learning?How do I do it? (e.g. properly use an ML library)What can go wrong?Case study
David S. Rosenberg (Bloomberg ML EDU) September 20, 2017 3 / 67

Machine Learning Problems
David S. Rosenberg (Bloomberg ML EDU) September 20, 2017 4 / 67
What is Machine Learning for?
Common theme is to solve a prediction problem:given an input x ,predict an “appropriate” output y .
We’ll start with a few canonical examples...
David S. Rosenberg (Bloomberg ML EDU) September 20, 2017 5 / 67

Example: Spam Detection
Input: Incoming email
Output: “SPAM” or “NOT SPAM”
A binary classification problem, because only 2 possible outputs.David S. Rosenberg (Bloomberg ML EDU) September 20, 2017 6 / 67

Example: Medical Diagnosis
Input: Symptoms (fever, cough, fast breathing, shaking, nausea,...)Output: Diagnosis (pneumonia, flu, common cold, bronchitis, ...)A multiclass classification problem: choosing one of several [discrete] outputs.
How to express uncertainty?
Probabilistic classification or soft classification:
P(pneumonia) = 0.7P(flu) = 0.2
......
David S. Rosenberg (Bloomberg ML EDU) September 20, 2017 7 / 67

Example: Predicting a Stock Price
Input: History of stock’s pricesOutput: Predict stock’s price at close of next day
A regression problem, because the output is a number.
(Regression is not just “linear regression” from basic statistics.)
David S. Rosenberg (Bloomberg ML EDU) September 20, 2017 8 / 67

The Prediction Function
A prediction function takes input x and produces an output y .
We’re looking for prediction functions that solve particular problems.
Machine learning helps find the best prediction function.
David S. Rosenberg (Bloomberg ML EDU) September 20, 2017 9 / 67
What is Machine Learning?
David S. Rosenberg (Bloomberg ML EDU) September 20, 2017 10 / 67
What is not ML: Rule-Based Approaches
Consider medical diagnosis.1 Consult textbooks and medical doctors (i.e. “experts”).2 Understand their diagnosis process.3 Implement this as an algorithm (a “rule-based system”)
Doesn’t sound too bad...
Very popular in the 1980s.
(To be fair, these “expert systems” could be much more sophisticated than they sound here.For example, through “inference” they could make new logical deductions from knowledgebases.)
David S. Rosenberg (Bloomberg ML EDU) September 20, 2017 11 / 67

Rule-Based Approach
Fig 1-1 from Hands-On Machine Learning with Scikit-Learn and TensorFlow by Aurelien Geron (2017).
David S. Rosenberg (Bloomberg ML EDU) September 20, 2017 12 / 67
Rule-Based Systems
Issues with rule-based systems:Very labor intensive to build.
Rules work very well for areas they coverBut cannot generalize to unanticipated input combinations.
Don’t naturally handle uncertainty.
Expert systems seen as “brittle”
Disappointment in expert systems (late 80s / early 90s) led to an “AI Winter”.
David S. Rosenberg (Bloomberg ML EDU) September 20, 2017 13 / 67
Modern AI: Machine Learning
Don’t reverse engineer an expert’s decision process.Machine “learns” on its own.We provide “training data”, i.e.
many examples of (input x , output y) pairs.
e.g. A set of videos, and whether or not each has a cat.e.g. A set of emails, and whether or not each is SPAM.
Learning from training data of this form is called supervised learning.
David S. Rosenberg (Bloomberg ML EDU) September 20, 2017 14 / 67

Machine Learning Algorithm
A machine learning algorithm:Input: Training Data
“Learns” from the training data.
Output: A “prediction function” that produces output y given input x .
David S. Rosenberg (Bloomberg ML EDU) September 20, 2017 15 / 67

Machine Learning Approach
Fig 1-2 from Hands-On Machine Learning with Scikit-Learn and TensorFlow by Aurelien Geron (2017).
David S. Rosenberg (Bloomberg ML EDU) September 20, 2017 16 / 67

Key Concepts
most common ML problem typesclassification (hard or soft/probabilistic)multiclass (hard or soft/probabilistic)regression
prediction functionpredicts output y given input x
training dataa set of (input x , output y) pairs
supervised learning algorithmtakes training data and produces a prediction function
David S. Rosenberg (Bloomberg ML EDU) September 20, 2017 17 / 67
Elements of the ML Pipeline
David S. Rosenberg (Bloomberg ML EDU) September 20, 2017 18 / 67

Feeding Inputs to ML Algorithms
Raw input types can beText documentsVariable-length time seriesImage filesSound recordingsDNA sequences
But most ML prediction functions like their input asfixed-length arrays of numbersdouble[d] – for the computer scientistsRd – for the mathematicians
David S. Rosenberg (Bloomberg ML EDU) September 20, 2017 19 / 67

Feature Extraction
Definition
Mapping raw input x to Rd is called feature extraction or featurization.
Better features =⇒ less “smart” ML needed (makes things easier)
Limiting case: a single feature is already the correct output
Feature vectors are often called input vectors.
David S. Rosenberg (Bloomberg ML EDU) September 20, 2017 20 / 67

Example: Detecting Email Addresses
Task: Predict whether a string is an email address
Could use domain knowledge and write down:
This was a bit ad-hoc. Could we be more systematic? Yes ...
From Percy Liang’s "Lecture 3" slides from Stanford’s CS221, Autumn 2014.
David S. Rosenberg (Bloomberg ML EDU) September 20, 2017 21 / 67
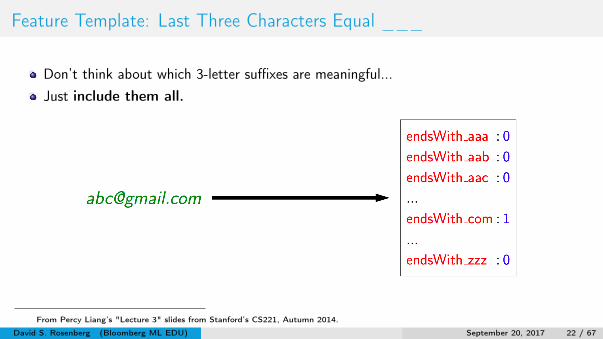
Feature Template: Last Three Characters Equal ___
Don’t think about which 3-letter suffixes are meaningful...Just include them all.
From Percy Liang’s "Lecture 3" slides from Stanford’s CS221, Autumn 2014.
David S. Rosenberg (Bloomberg ML EDU) September 20, 2017 22 / 67

Feature Template: One-Hot Encoding
one-hot encoding: a set of binary features that always has exactly one nonzero value.
categorical variable: a variable that takes one of several discrete possible values:
NYC Boroughs: “Brooklyn”, “Bronx”, “Queens”, “Manhattan”, “Staten Island”
Categorical variables can be encoded numerically using one-hot encoding.
In statistics, called a dummy variable encoding
Concept Check: How many features to one-hot encode the boroughs?
David S. Rosenberg (Bloomberg ML EDU) September 20, 2017 23 / 67
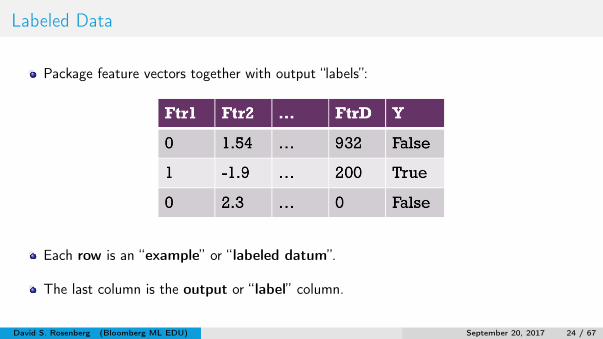
Labeled Data
Package feature vectors together with output “labels”:
Each row is an “example” or “ labeled datum”.
The last column is the output or “ label” column.
David S. Rosenberg (Bloomberg ML EDU) September 20, 2017 24 / 67

Unlabeled Data
Just the feature vectors:
We want to be able to predict the missing labels.
David S. Rosenberg (Bloomberg ML EDU) September 20, 2017 25 / 67

Prediction Functions
A prediction function hasinput: a feature vector (a.k.a. “input vector”)
output: a “label” (a.k.a. “prediction”, “response”, “action”, or “output”)
The prediction function is what gets deployed.
David S. Rosenberg (Bloomberg ML EDU) September 20, 2017 26 / 67

Learning Algorithm
A learning algorithm hasinput: labeled data (i.e. the training set)output: a prediction function
Today is about what’s outside the “purple box”. Rest of course is about the inside.
David S. Rosenberg (Bloomberg ML EDU) September 20, 2017 27 / 67
Key Concepts
feature extractionmaps raw inputs into arrays of numeric valuesideally, extracts essential features of the input
one-hot encoding for categorical variables
labeled data / unlabeled data
David S. Rosenberg (Bloomberg ML EDU) September 20, 2017 28 / 67
Evaluating a Prediction Function
David S. Rosenberg (Bloomberg ML EDU) September 20, 2017 29 / 67

Evaluating a Prediction Function
Brilliant data science intern gives you a prediction function.How do we evaluate performance?Very important part of machine learning.
It can be subtle.Evaluation should reflect business goals as closely as possible.
David S. Rosenberg (Bloomberg ML EDU) September 20, 2017 30 / 67

Evaluating a Single Prediction: The Loss Function
A loss function scores how far off a prediction is from the desired “target” output.
loss(prediction,target) returns a number called “the loss”Big Loss = Bad ErrorSmall Loss = Minor ErrorZero Loss = No Error
David S. Rosenberg (Bloomberg ML EDU) September 20, 2017 31 / 67
Classic Loss Functions
Classification loss or “0/1 Loss”Loss is 1 if prediction is wrong.Loss is 0 if prediction is correct.
Square loss for regressionloss = (predicted - target)2
David S. Rosenberg (Bloomberg ML EDU) September 20, 2017 32 / 67

Evaluating a Prediction Function
Data science intern gives you a prediction function f (x).“Average classification loss on training data was 0.01” (i.e. 1% error)
Product manager says “we can deploy if 6 2% error.”
Deploy this prediction function?
No!
Prediction function needs to do well on new inputs.
(Don’t test somebody with problems they’ve seen in advance.)
David S. Rosenberg (Bloomberg ML EDU) September 20, 2017 33 / 67

The Test Set
A “test set” is labeled data that is independent of training data.
e.g. Split labeled data randomly into 80% training and 20% test.
Training set: only for training prediction functions.Test set: only for for assessing performance.
Larger test set gives more accurate assessment of performance.How big? We can review “confidence intervals” from statistics.
David S. Rosenberg (Bloomberg ML EDU) September 20, 2017 34 / 67

Train/Test vs. Train/Deploy
Train/Test:Build model on training data (say 80% of all labeled data).Get performance estimate on test data (remaining 20%).
Train/Deploy:Build model on all labeled data.Deploy model into wild.Hope for the best.
A large part of real-world machine learning is ensuring thatTest performance is a good estimate of deployment performance.
How can we do this, and what can go wrong?
David S. Rosenberg (Bloomberg ML EDU) September 20, 2017 35 / 67
Main Principal of Train/Test Splitting
Train/Test setup should represent Train/Deploy scenario as closely as possible.
Random split of labeled data into train/test is usually the right approach.(why random?)
But consider time series prediction: 1000 days of historical data
Should we randomly split the days into training and test?
David S. Rosenberg (Bloomberg ML EDU) September 20, 2017 36 / 67
Train/Test Split for Time Series
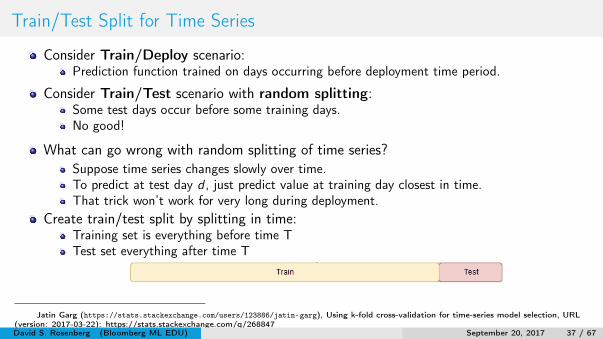
Consider Train/Deploy scenario:Prediction function trained on days occurring before deployment time period.
Consider Train/Test scenario with random splitting:Some test days occur before some training days.No good!
What can go wrong with random splitting of time series?Suppose time series changes slowly over time.To predict at test day d , just predict value at training day closest in time.That trick won’t work for very long during deployment.
Create train/test split by splitting in time:Training set is everything before time TTest set everything after time T
Jatin Garg (https://stats.stackexchange.com/users/123886/jatin-garg), Using k-fold cross-validation for time-series model selection, URL(version: 2017-03-22): https://stats.stackexchange.com/q/268847David S. Rosenberg (Bloomberg ML EDU) September 20, 2017 37 / 67

Summary: What to Give your Data Science Intern
Split data into train and test.Give training set to intern, you keep the test set.Intern gives you a prediction function.You evaluate prediction function on test set.No matter what intern did with training set,
test performance should give you good estimate of deployment performance.
David S. Rosenberg (Bloomberg ML EDU) September 20, 2017 38 / 67

What Should the Intern Do?
Intern wants to try many fancy ML models.Each gives a different prediction function.Intern needs her own test set to evaluate prediction functions.Intern should randomly split data again into
training set andvalidation set
This split could again be 80/20.Validation set is like test set, but used to choose best among many prediction functions.Test set is just used to evaluate the final chosen prediction function.
David S. Rosenberg (Bloomberg ML EDU) September 20, 2017 39 / 67

k-Fold Cross Validation
Suppose test set too small forgood performance estimate.Use k-fold cross validation:
1 Randomly partition data D
into k “folds” of equal size:D1, . . . ,Dk .
2 For i = 1, . . . ,k :1 Train model Mi on D−Di .2 Let Ti be Mi ’s performance
on Di .3 Report T̂ ±SE(T̂ ) where
T̂ = Mean(T1, . . . ,Tk)
SE(T̂ ) = SD(T1, . . . ,Tk)/√k .
Provost and Fawcett Data science for Business, Figure 5-9.
David S. Rosenberg (Bloomberg ML EDU) September 20, 2017 40 / 67

Forward Chaining (Cross Validation for Time Series)
Jatin Garg (https://stats.stackexchange.com/users/123886/jatin-garg), Using k-fold cross-validation for time-series model selection, URL(version: 2017-03-22): https://stats.stackexchange.com/q/268847
David S. Rosenberg (Bloomberg ML EDU) September 20, 2017 41 / 67

Key Concepts
loss functionse.g. 0/1 loss (for classification)e.g. square loss (for regression)
training set, validation set, test settrain/test should resemble train/deploy as closely as possiblerandom split often reasonablefor time series, split data in time, rather than randomlyvalidation and test sets are often called “hold-out data”
k-fold cross validation for small datasets
David S. Rosenberg (Bloomberg ML EDU) September 20, 2017 42 / 67

Other Sources of Test 6= Deployment
David S. Rosenberg (Bloomberg ML EDU) September 20, 2017 43 / 67

Leakage
Leakage: Information about labels sneaks into features.
Examples:identifying cat photos by using the title on the page
including sales commission as a feature when ranking sales leads
using star rating as feature when predicting sentiment of Yelp review
David S. Rosenberg (Bloomberg ML EDU) September 20, 2017 44 / 67
Sample Bias
Sample bias: Test inputs and deployment inputs have different distributions.
Examples:create a model to predict US voting patterns, but phone survey only dials landlines
building a stock forecasting model, but training using a random selection of companies thatexist today – what’s the issue?
US census slightly undercounts certain subpopulations in a way that’s somewhat predictablebased on demographic and geographic features.
If predictable, can it be corrected? Hotly debated topic ~2000 – some of the world’s topstatisticians couldn’t agree (Stephen Fienberg vs David Freedman).)
David S. Rosenberg (Bloomberg ML EDU) September 20, 2017 45 / 67
Nonstationarity
Nonstationarity: when the thing you’re modeling changes over time
Nonstationarity often takes one of two forms:Covariate shift: input distribution changed between training and deployment.
(covariate is another term for input feature)e.g. once popular search queries become less popular – new ones appearmathematically similar to sample bias
Concept drift: correct output for given input changes over timee.g. season changes, and given person no longer interested in winter coatse.g. last week I was looking for a new car, this week I’m not
David S. Rosenberg (Bloomberg ML EDU) September 20, 2017 46 / 67

Model Complexity & Overfitting
David S. Rosenberg (Bloomberg ML EDU) September 20, 2017 47 / 67

Toy Example
Green line is truth; Blue points are our noisy data
What’s the input? What’s the output?
From Bishop’s Pattern Recognition and Machine Learning, Ch 1.
David S. Rosenberg (Bloomberg ML EDU) September 20, 2017 48 / 67

Polynomial Curve Fitting (an ML algorithm)
Fit data with a polynomial.
f (x) = w0+w1x +w2x2+ · · ·+wMxM
Concept Check: What is f (x) in our ML vocabulary?
David S. Rosenberg (Bloomberg ML EDU) September 20, 2017 49 / 67

Polynomial Curve Fitting (an ML algorithm)
Fit with polynomial f (x) = w0+w1x +w2x2+ · · ·+wMxM
Imagine a learning function:
double[] fitPolynomial(Data data, int M)
This function does the “learning”.Returns array of parameters w0,w1, . . . ,wM .
With parameters and M we can create prediction function:
double predictPolynomial(double[] w, int M, double x)
David S. Rosenberg (Bloomberg ML EDU) September 20, 2017 50 / 67

Polynomial Curve Fitting (an ML algorithm)
A polynomial model f (x) = w0+w1x +w2x2+ · · ·+wMxM
Learning algorithms find the best parameters w0,w1, . . . ,wM .
A hyperparameter is a parameter of the ML algorithm itself.Here, M is a hyperparameter.
Generally, the data scientist adjusts the hyperparameters.Though it can also be chosen by an ML algorithm.
David S. Rosenberg (Bloomberg ML EDU) September 20, 2017 51 / 67

Example: Polynomial Curve Fitting
Green curve is truth
From Bishop’s Pattern Recognition and Machine Learning, Ch 1.
David S. Rosenberg (Bloomberg ML EDU) September 20, 2017 52 / 67

Example: Polynomial Curve Fitting
Fit with M = 0:
UNDERFIT (not fitting data well enough)
From Bishop’s Pattern Recognition and Machine Learning, Ch 1.
David S. Rosenberg (Bloomberg ML EDU) September 20, 2017 53 / 67

Example: Polynomial Curve Fitting
Fit with M = 1
UNDERFIT (not fitting data well enough)
From Bishop’s Pattern Recognition and Machine Learning, Ch 1.
David S. Rosenberg (Bloomberg ML EDU) September 20, 2017 54 / 67

Example: Polynomial Curve Fitting
Fit with M = 3
PRETTY GOOD!
From Bishop’s Pattern Recognition and Machine Learning, Ch 1.
David S. Rosenberg (Bloomberg ML EDU) September 20, 2017 55 / 67
Example: Polynomial Curve Fitting
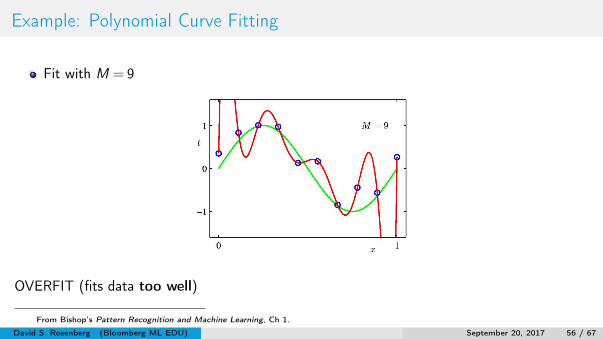
Fit with M = 9
OVERFIT (fits data too well)
From Bishop’s Pattern Recognition and Machine Learning, Ch 1.
David S. Rosenberg (Bloomberg ML EDU) September 20, 2017 56 / 67

Polynomial Model Complexity
M controls the model complexity.
Bigger M allows more “complex” prediction functions.i.e. more “squiggly” functions
Larger model complexity meansBetter fit to training dataNOT necessarily better performance on test data
David S. Rosenberg (Bloomberg ML EDU) September 20, 2017 57 / 67

Overfitting
Loosely speaking, we say a model overfits whentraining performance is good buttest/validation performance is poor.
Fix overfitting byReducing model complexityGetting more training data
David S. Rosenberg (Bloomberg ML EDU) September 20, 2017 58 / 67

Example: Polynomial Curve Fitting
Fit with M = 9 (more data)
Pretty good - slightly overfit?
From Bishop’s Pattern Recognition and Machine Learning, Ch 1.
David S. Rosenberg (Bloomberg ML EDU) September 20, 2017 59 / 67
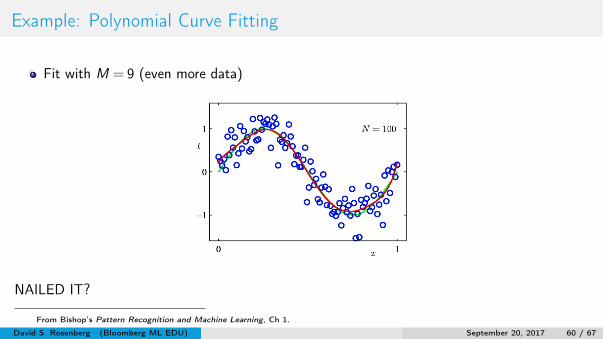
Example: Polynomial Curve Fitting
Fit with M = 9 (even more data)
NAILED IT?
From Bishop’s Pattern Recognition and Machine Learning, Ch 1.
David S. Rosenberg (Bloomberg ML EDU) September 20, 2017 60 / 67
Hyperparameters (or “Tuning Parameters”)
Almost every learning algorithm hasat least one “hyperparameter” or “tuning parameter”
You (the data scientist) must tune these values.
Hyperparameter control various thingsmodel complexity (e.g. polynomial order)type of model complexity control (e.g. L1 vs L2 regularization)optimization algorithm (e.g. learning rate)model type (e.g. loss function, kernel type,...)
David S. Rosenberg (Bloomberg ML EDU) September 20, 2017 61 / 67

Overall Machine Learning Workflow
David S. Rosenberg (Bloomberg ML EDU) September 20, 2017 62 / 67
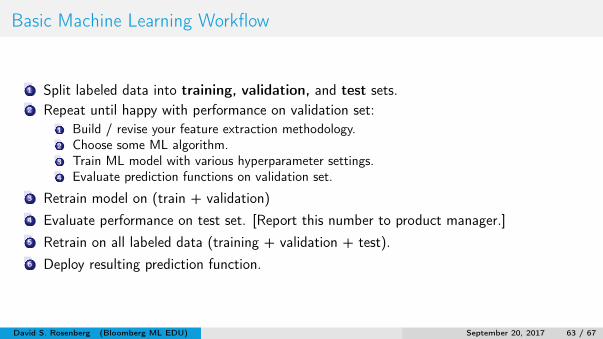
Basic Machine Learning Workflow
1 Split labeled data into training, validation, and test sets.2 Repeat until happy with performance on validation set:
1 Build / revise your feature extraction methodology.2 Choose some ML algorithm.3 Train ML model with various hyperparameter settings.4 Evaluate prediction functions on validation set.
3 Retrain model on (train + validation)4 Evaluate performance on test set. [Report this number to product manager.]5 Retrain on all labeled data (training + validation + test).6 Deploy resulting prediction function.
David S. Rosenberg (Bloomberg ML EDU) September 20, 2017 63 / 67
Case Study: Cell Phone Churn Prediction
David S. Rosenberg (Bloomberg ML EDU) September 20, 2017 64 / 67
The Cell Phone Churn Problem
Cell phone customers often switch carriers. Called “churn”.Often cheaper to retain a customer than to acquire a new one.You can try to retain a customer by giving a promotion, such as a discount.If you give a discount to somebody who was going to churn, you probably saved money.If you give a discount to somebody who was NOT going to churn, you wasted money.
David S. Rosenberg (Bloomberg ML EDU) September 20, 2017 65 / 67
The Cell Phone Churn Problem
Suppose you have 2 years of customer data.For each customer, you know whether they “churned” (i.e. changed service), and the dateof churn if they did churn.How can we use machine learning to find the most likely churners?
David S. Rosenberg (Bloomberg ML EDU) September 20, 2017 66 / 67

Lift Curves for Predicting Churners
David S. Rosenberg (Bloomberg ML EDU) September 20, 2017 67 / 67