Embed Size (px)
Citation preview
4825 Mark Center Drive • Alexandria, Virginia 22311-1850
CRM D0016910.A1 / FinalSeptember 2007
Black and Hispanic Marines: Their Accession, Representation, Success, and Retention in the Corps
Aline Quester • Anita Hattiangadi • Gary Lee Cathy Hiatt • Robert Shuford

This document represents the best opinion of CNA at the time of issue.It does not necessarily represent the opinion of the Department of the Navy.
Approved for Public Release; Distribution Unlimited. Specific authority: N00014-05-D-0500.Copies of this document can be obtained through the Defense Technical Information Center at www.dtic.milor contact CNA Document Control and Distribution Section at 703-824-2123.
Copyright © 2007 The CNA Corporation
Approved for distribution: September 2007
Aline O. Quester, DirectorMarine Corps ManpowerResource Analysis Division

Contents
Preface . . . . . . . . . . . . . . . . . . . . . . . . . . . . . . . 1
Enlisted Marines: Black and Hispanic accession shares and representation . . . . . . . . . . . . . . . . . . . . . . . . . . 3
Black accession shares . . . . . . . . . . . . . . . . . . . . 3Black representation . . . . . . . . . . . . . . . . . . . . . 3Hispanic accession shares . . . . . . . . . . . . . . . . . . 5Hispanic representation . . . . . . . . . . . . . . . . . . . 5
Occupational choice for black and Hispanic enlisted Marines . . . . . . . . . . . . . . . . . . . . . . . . . . . . . . 9
Occupational choice for black enlisted Marines . . . . . . 9Occupational choice for Hispanic enlisted Marines . . . . 11
Retention of black enlisted Marines . . . . . . . . . . . . . . . 13Background. . . . . . . . . . . . . . . . . . . . . . . . . . 13Job satisfaction and retention behavior . . . . . . . . . . . 13Marriage rates, family life, and financial security . . . . . . 14Concluding comments . . . . . . . . . . . . . . . . . . . . 16
Leadership opportunities and success of black and Hispanic enlisted Marines . . . . . . . . . . . . . . . . . . . . . . . . . 17
Black enlisted Marines . . . . . . . . . . . . . . . . . . . . 17Hispanic enlisted Marines . . . . . . . . . . . . . . . . . . 18
Marine officers: Black and Hispanic accession shares and representation . . . . . . . . . . . . . . . . . . . . . . . . . . 21
Accession . . . . . . . . . . . . . . . . . . . . . . . . . . . 21Representation . . . . . . . . . . . . . . . . . . . . . . . . 23
Occupational choice for black and Hispanic Marine officers . . . . . . . . . . . . . . . . . . . . . . . . . . . . . . 25
Occupational choice for black Marine officers . . . . . . . 25Occupational choice for Hispanic Marine officers . . . . . 25
i
Progression to leadership positions for black and Hispanic Marine officers . . . . . . . . . . . . . . . . . . . . . . . . . . 27
Cohort (or yeargroup) analyses . . . . . . . . . . . . . . . 27Conclusion . . . . . . . . . . . . . . . . . . . . . . . . . . 29
Appendix A: Black enlisted Marines by grade . . . . . . . . . . 31
Appendix B: Comparisons with other military Services . . . . . 35
Appendix C: Black enlisted Marines by occupational field . . . 37
Appendix D: Hispanic enlisted Marines by occupational field . . . . . . . . . . . . . . . . . . . . . . . . . . . . . . . . 39
Appendix E: Black Marine officers by occupational field . . . . 41
Appendix F: Hispanic Marine officers by occupational field . . . . . . . . . . . . . . . . . . . . . . . . . . . . . . . . 43
List of figures . . . . . . . . . . . . . . . . . . . . . . . . . . . 45
List of tables . . . . . . . . . . . . . . . . . . . . . . . . . . . . 47
ii

Preface
Recruiting and retaining a diverse force is vital to the Marine Corps’success both today and tomorrow. Because the Commandant of theMarine Corps wants to ensure that enlisted Marines and officersreflect the racial and ethnic characteristics of broader American soci-ety, he asked CNA to examine this issue. Our findings were originallypublished in a series of memoranda. In this document, we update andexpand the results of that work.
1

This page intentionally left blank.
2
Enlisted Marines: Black and Hispanic accession shares and representation
The racial and ethnic characteristics of enlisted accessions, or newenlistees, primarily determine the characteristics of the MarineCorps’ enlisted force. The first issue we examine is whether an ade-quate number of blacks and Hispanics are enlisting so that theirshares of accessions are comparable to their shares of the U.S. popu-lation. We then examine how these enlisted accessions have contrib-uted to the overall racial/ethnic distribution of the Marine Corps’enlisted force.
Black accession shares
Black recruits represented about 18 percent of all Marine Corpsenlisted accessions through the 1980s.1 In FY06, however, less than 8percent of the Marine Corps’ active-duty enlisted accessions wereblack; this percentage was well below the population percentage of12.2 percent. The two most recent declines in this percentage havebeen associated with wars (see figure 1 on the next page).
Black representation
High accession percentages in the 1980s and excellent retention overtime kept the percentages of blacks in the Marine Corps well abovepopulation percentages into the 1990s. These numbers, however, hida trend that was slowly undermining the Marine Corps’ ability tomirror the country’s racial/ethnic distribution (see figure 2 on thenext page).
1. In all this paper’s tabulations, we examine the active-duty (not Reserve)force.
3

As figure 2 shows, the percentage of Marines under age 25 who areblack began to fall in the early 1990s, even though the percentage ofMarines age 25 or older who are black was steady.
Figure 1. Black recruits as a percentage of all non-prior-service recruitsa
a. Data from CNA’s accession database.
Figure 2. Percentage of enlisted Marines who are black, by agea
a. CNA tabulations of data from March Headquarters Master File (HMF) files.
0
10
20
30
197919
8019
8119
8219
8319
8419
8519
8619
8719
8819
8919
9019
9119
9219
9319
9419
9519
9619
9719
9819
9920
0020
0120
0220
0320
0420
0520
06
Accession FY
Perc
enta
ge b
lack
Gulf War
OIF/OEF
0
5
10
15
20
25
30
35
40
1987
1988
1989
1990
1991
1992
1993
1994
1995
1996
1997
1998
1999
2000
2001
2002
2003
2004
2005
2006
2007
Perc
enta
ge b
lack
Under 25 years25 years plus
Due to falling accessions
Due to fallingaccessions
Don’tsee fallingrepresentation
yet
4

Currently, black Marines make up 32 percent of Sergeants Major/Master Gunnery Sergeants but less than 10 percent of Privates (seefigure 3). Appendix A shows how this distribution by grade haschanged in the Marine Corps over time. Appendix B compares thegrade distribution with those of other military Services.
Hispanic accession shares
Figure 4 (on the next page) shows, over time, the share of enlistedMarine accessions that are Hispanic. In recent years, these shareshave exceeded the overall representation of Hispanics in the U.S.population (13.9 percent). In FY06, Hispanic accessions were 15.7percent of accessions; through May of FY07, Hispanics representedalmost 17 percent of the Marine Corps’ non-prior-service enlistedaccessions.
Hispanic representation
High Hispanic representation among enlisted accessions has contrib-uted to a growing share of the enlisted force that is Hispanic.
Figure 3. Percentage of black Marines by grade, June 2007a
a. CNA tabulations of data from June 2007 HMF files.
0
10
20
30
40
Pvt
PFC
LCpl Cpl Sg
tSS
gt
GySgt
lstSg
y/MSg
t
SgtM
aj/M
GySgt
Perc
enta
ge b
lack
5

Figure 5 shows, over time, the share of enlisted Marines who are His-panic. This share has more than tripled since FY87—growing from5.3 percent to 18.0 percent in FY07. As was the case with Hispanicaccessions, this share exceeds the overall representation of Hispanicsin the U.S. population.
Figure 4. Hispanic recruits as a percentage of all non-prior-service recruitsa, b
a. Data from CNA’s accession database.b. The solid black line in the graph represents the current share of Hispanics in the target
population.
Figure 5. Percentage of enlisted Marines who are Hispanica
a. CNA tabulations of data from March HMF files.
0
5
10
15
20
FY96
FY97
FY98
FY99
FY00
FFY01
FY02
FY03
FY04
FY05
FY06
Perc
enta
ge
Representation
0
5
10
15
20
FY8
7
FY8
8
FY8
9FY
90
FY9
1
FY9
2FY
93
FY9
4
FY9
5FY
96
FY9
7
FY9
8FY
99
FY0
0
FY0
1FY
02
FY0
3
FY0
4FY
05
FY0
6
FY0
7
Fiscal Year
Per
cent
age
6

Figure 6 shows the current grade distribution of Hispanic enlistedMarines. We see that they make up 15 to 20 percent each of thegrades through E-7.
Figure 6. Percentage of Hispanic Marines by grade, June 2007a
a. Tabulations of CNA’s Marine Corps personnel files.
0
5
10
15
20
25
Pvt
PFC
LCpl Cpl Sg
tSS
gt
GySgt
MSg
t/1stS
gt
MGyS
gt/Sg
tMaj
Grade
Perc
enta
ge
7

This page intentionally left blank.
8

Occupational choice for black and Hispanic enlisted Marines
This section examines the occupational choices of black and His-panic enlisted Marines.
Occupational choice for black enlisted Marines
The distribution of black Marines across occupations is very differentfrom that of the overall population of enlisted Marines. Specifically,they are overrepresented in support occupational fields (occflds); thelargest percentages are in the Personnel Admin & Retention occfld(01) and the Supply Admin & Operations occfld (30).2 As of FY07,these two occflds had over 20 percent of all enlisted black Marines(see figure 7 on the next page). Conversely, black enlisted Marinesare significantly underrepresented in the Infantry (03) and severalAircraft Maintenance occflds. Appendix C shows the May 2007 occu-pational distribution of black enlisted Marines.
Not only is the percentage of black Marines falling, but young blackMarines also are increasingly less likely to pursue such military occu-pational specialties (MOSs) as the 0311 MOS (rifleman). Figure 8 (onthe next page) shows both the percentage of Marines under age 25who were black and the percentage of 0311s under age 25 who wereblack. Until FY92, the percentages were virtually the same, meaningthat young blacks became 0311s at rates that were in keeping withtheir share of the enlisted force.
2. Tom Ricks first commented on black overrepresentation in the supportoccupations in the Army in 1997. See Tom Ricks, “U.S. Infantry Sur-prise: It’s Now Mostly Whites; Blacks Hold Office Jobs, Wall Street Journal,6 January 1997.
9

By FY93, however, both percentages began to fall, but the percentageof young 0311s who were black fell much faster than the overall per-centage of black Marines. By May 2007, 8 percent of Marines underage 25 were black, whereas only 5 percent of young 0311s were black.Thus, we find that young black recruits are less likely to choose infan-try occupations and the smaller accession cohorts appear to beincreasingly choosing support occupations.
Figure 7. Black Marines in the support occflds (01 and 30) as a share of all black Marinesa
a. Data from March HMF files.
Figure 8. Marines under age 25: Overall percentage black and MOS 0311 percentage blacka
a. Data from March HMF files.
0
5
10
15
20
25
30
1987
1988
1989
1990
1991
1992
1993
1994
1995
1996
1997
1998
1999
2000
2001
2002
2003
2004
2005
2006
2007
Perc
enta
ge
01 occfld 30 occfld
0
5
10
15
20
25
30
35
40
1987
1988
1989
1990
1991
1992
1993
1994
1995
1996
1997
1998
1999
2000
2001
2002
2003
2004
2005
2006
2007
Perc
enta
ge b
lack
All Marines
0311 Marines
10

Occupational choice for Hispanic enlisted Marines
Hispanic and black enlisted Marines are overrepresented in many ofthe same occflds, although the degree of overrepresentation issmaller for Hispanics. Like black enlisted Marines, Hispanic enlistedMarines are very overrepresented in the Personnel Admin & Reten-tion (01), Supply Admin & Operations (30), Traffic Management(31), and Legal Services (44) occflds. Hispanic enlisted Marines arevery underrepresented in the Signals Intelligence/Ground Elec War-fare (26) and Misc (80) occflds.
11

This page intentionally left blank.
12

Retention of black enlisted Marines
Background
As we showed earlier, black youth have constituted an increasinglysmaller share of the Marine Corps’ enlisted accessions in recent years.Recent declines have corresponded with the Gulf War and Opera-tions Iraqi Freedom/Enduring Freedom (OIF/OEF). Polls suggestthat black youth and their influencers oppose the current conflictmore strongly than members of other racial/ethnic groups.
In this environment, it is perhaps more important than ever that theMarine Corps help black youth, parents, and influencers to under-stand the opportunities and successes that black youth have realizedas enlisted Marines. This section provides data that illustrate the suc-cess and quality of life that black youth have achieved through careersin the Corps. The data relate to black Marines’:
• Job satisfaction and retention behavior
• Marriage rates, family life, and financial security.
Job satisfaction and retention behavior
When people like their jobs, they stay in them. Black enlistedMarines’ retention behavior indicates that they have found satisfyingcareers in the Corps. Black Marines reenlist at substantially higherrates than other Marines; between 1980 and 2006, they reenlisted athigher average rates—at every reenlistment point—than members of anyother racial/ethnic group (figure 9 on the next page shows averagefirst-term reenlistment rates over the period).
13

Looking at reenlistment behavior in FY06, we see the following:
• First-term reenlistment rates were 40.4 percent for blacks,23.8 percent for whites, and 27.6 percent for Hispanics
• Second-term reenlistment rates were 75.2 percent for blacks,64.8 percent for whites, and 67.3 percent for Hispanics
• Third-term reenlistment rates were 86.7 percent for blacks,86.6 percent for whites, and 87.8 percent for Hispanics.
From the accession numbers reported earlier, it is not clear that blackyouth, parents, and influencers understand the high levels of job sat-isfaction that black Marines experience. This satisfaction is illustratedthrough retention rates that are almost double those of whites at thefirst reenlistment point.
Marriage rates, family life, and financial security
The quality of life for black men in the civilian sector is uneven.Although many black men succeed, extremely low marriage rates andrelatively high unemployment rates characterize the civilian experi-ence for some. In contrast, black male enlisted Marines have steady
Figure 9. First-term reenlistment rates by racial/ethnic group: FY80 through FY06a
a. Source: CNA’s reenlistment database.
0
10
20
30
40
50
White Black Hispanic Other
Perc
enta
ge r
eenl
istin
g
14

jobs and are just as likely to be married as their white counterparts(see figure 10).
Unlike civilian employers that rarely acknowledge their employees’families (e.g., have you ever heard of “Xerox families”?), the MarineCorps frequently recognizes Marines’ families, and it funds and main-tains an extensive network to support them. Black families—in fact,all Marine Corps families—benefit from this support.
Because black Marines reenlist at significantly higher rates than thoseof other racial/ethnic backgrounds, black Marines are more likely tostay in the Corps for a full career. Military retirement, with its guaran-teed cost-of-living increases, provides additional economic security.Pensions for the average retiree are now almost $2 million.3 Andmedical benefits are guaranteed for retirees and their families.
Figure 10. Percentage of enlisted male Marines who are married, by age: December 2006a
a. Source: CNA tabulations of data from December 2006 HMF files.
3. For someone who enlisted at age 18, retires in 2007 as an E-7 with 20years of service, and lives to age 79, the retirement benefits are about $2million if he or she selects High 3 and about $1.6 million if he or sheselects REDUX. (REDUX has a payout of $30,000 at 15 years of service.)
0
20
40
60
80
100
17 18 19 20 21 22 23 24 25 26 27 28 29 30 31 32 33 34 35 36 37 38 39 40 41 42 43 4445+
Per
cent
age
white black
Age
15
Marines also have access to several educational benefits, such astuition assistance and the Montgomery GI Bill, which can help themto achieve financial security even if they separate from the Corpsbefore retirement.4 This financial security should appeal to blackyouth, parents, and influencers.
Concluding comments
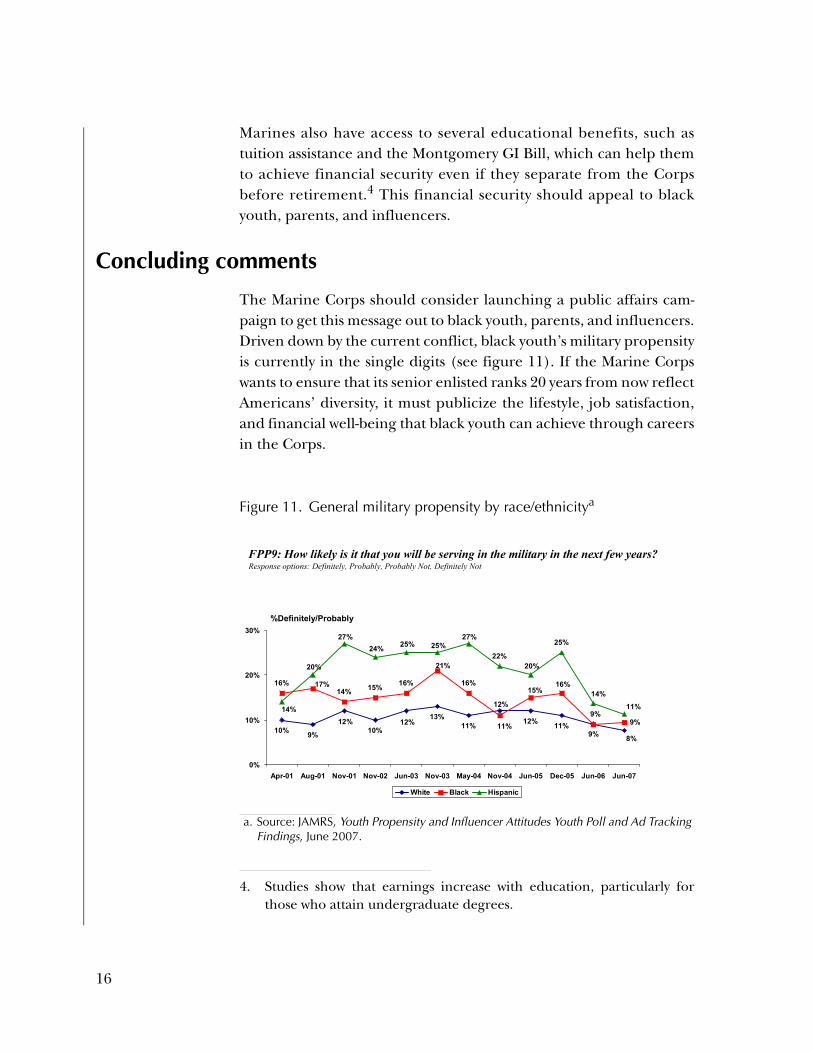
The Marine Corps should consider launching a public affairs cam-paign to get this message out to black youth, parents, and influencers.Driven down by the current conflict, black youth’s military propensityis currently in the single digits (see figure 11). If the Marine Corpswants to ensure that its senior enlisted ranks 20 years from now reflectAmericans’ diversity, it must publicize the lifestyle, job satisfaction,and financial well-being that black youth can achieve through careersin the Corps.
4. Studies show that earnings increase with education, particularly forthose who attain undergraduate degrees.
Figure 11. General military propensity by race/ethnicitya
a. Source: JAMRS, Youth Propensity and Influencer Attitudes Youth Poll and Ad Tracking Findings, June 2007.
FPP9: How likely is it that you will be serving in the military in the next few years?Response options: Definitely, Probably, Probably Not, Definitely Not
11%
16%14% 15% 16% 16%
22%
25%
8%9%
12%
12%
10%12%
13%11%
9%
12%10%
9%9%
16%15%
21%
11%
17%
11%
14%
20% 20%
24% 25% 25%
14%
27%27%
0%
10%
20%
30%
Apr-01 Aug-01 Nov-01 Nov-02 Jun-03 Nov-03 May-04 Nov-04 Jun-05 Dec-05 Jun-06 Jun-07
White Black Hispanic
%Definitely/Probably
16
Leadership opportunities and success of black and Hispanic enlisted Marines
Unlike in the civilian sector, every enlisted Marine starts at the entrylevel as a Private, and those who continue go through the same vet-ting process. The promotion process (which considers everyone) iswell defined and advances only those most qualified to higher ranks.Regardless of the job an enlisted Marine holds in the Corps, he or shehas the opportunity to advance to the highest leadership positions.This is in contrast to the civilian sector, where most entry-level jobs donot provide these types of advancement opportunities.
The Marine Corps offers black and Hispanic men and women manyopportunities to lead others. To determine the prevalence of theseopportunities, we examine the representation of black and HispanicMarines in the Corps’ top enlisted rank (E-9). Sergeants Major andMaster Gunnery Sergeants make up the E-9 rank and can constituteonly 1 percent of the enlisted population. As such, competition forthis rank is intense.
Black enlisted Marines
The Marine Corps has more black men and women in leadershippositions—both in absolute numbers and proportionally—than docivilian firms.5
For the accession years of today’s E-9s, the black percentage was 20.3percent. That is to say, if black enlisted Marines had reenlisted andpromoted at the same rates as other Marines, they would have repre-sented the same percentage of E-9s—20.3 percent—as they repre-sented of accessions. Instead, they represent 32.2 percent of E-9s
5. There are some exceptions, such as black-owned businesses.
17
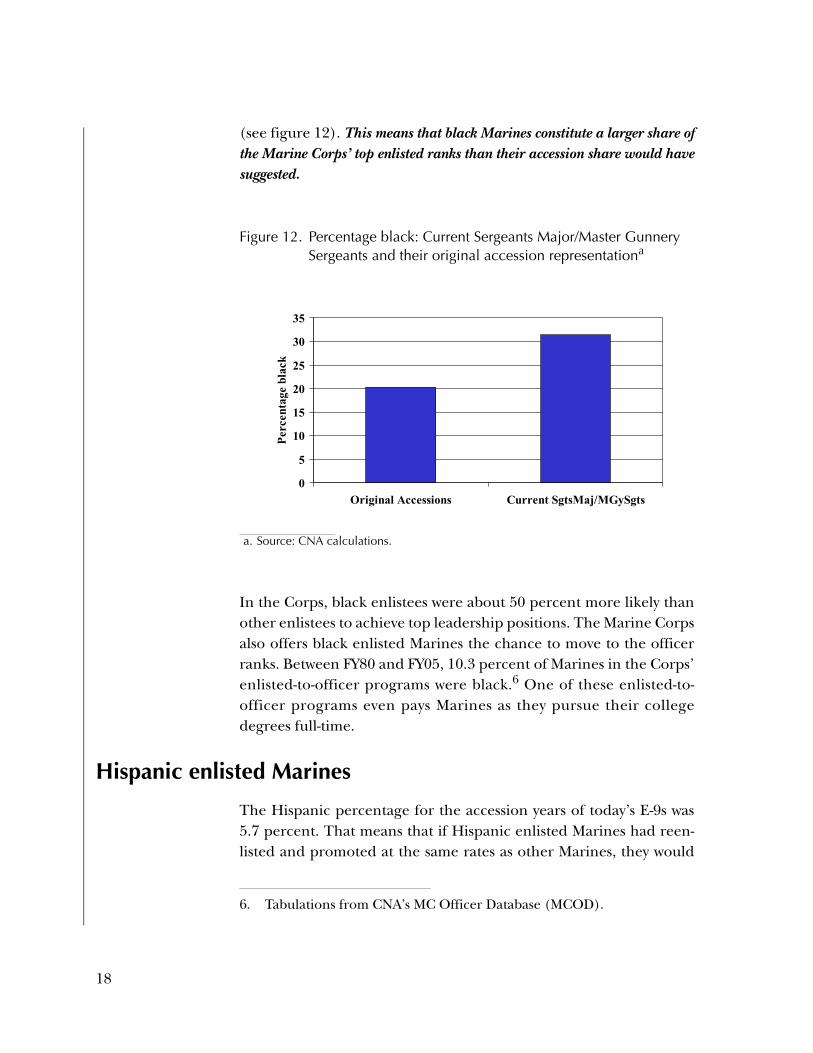
(see figure 12). This means that black Marines constitute a larger share ofthe Marine Corps’ top enlisted ranks than their accession share would havesuggested.
In the Corps, black enlistees were about 50 percent more likely thanother enlistees to achieve top leadership positions. The Marine Corpsalso offers black enlisted Marines the chance to move to the officerranks. Between FY80 and FY05, 10.3 percent of Marines in the Corps’enlisted-to-officer programs were black.6 One of these enlisted-to-officer programs even pays Marines as they pursue their collegedegrees full-time.
Hispanic enlisted Marines
The Hispanic percentage for the accession years of today’s E-9s was5.7 percent. That means that if Hispanic enlisted Marines had reen-listed and promoted at the same rates as other Marines, they would
Figure 12. Percentage black: Current Sergeants Major/Master Gunnery Sergeants and their original accession representationa
a. Source: CNA calculations.
6. Tabulations from CNA’s MC Officer Database (MCOD).
0
5
10
15
20
25
30
35
Original Accessions Current SgtsMaj/MGySgts
Perc
enta
ge b
lack
18

have represented the same percentage of E-9s as they represented ofaccessions. Instead, they represent 9.5 percent of E-9s (see figure 13).As we found in the case of black enlisted Marines, Hispanic Marines consti-tute a larger share of the Marine Corps’ top enlisted ranks than their acces-sion share would have suggested.
In addition to enlisted leadership opportunities, the Marine Corpsoffers Hispanic enlisted Marines the chance to move to the officerranks. Between FY80 and FY05, 7.6 percent of Marines in the Corps’enlisted-to-officer programs were Hispanic.7 In fact, the share (14.5percent in FY05) almost doubled over the entire period.
Figure 13. Percentage Hispanic: Current Sergeants Major/Master Gun-nery Sergeants and their original accession representationa
a. Source: CNA calculations.
7. Tabulations from CNA’s MC Officer Database (MCOD).
0123456789
10
Original Accessions Current SgtsMaj/MGySgts
Perc
enta
ge H
ispa
nic
19
This page intentionally left blank.
20

Marine officers: Black and Hispanic accession shares and representation
The racial and ethnic characteristics of the Marine Corps’ officeraccessions help to determine the characteristics of the Corps’ officercorps. In this section, we assess whether an adequate number ofblacks and Hispanics are entering the officer corps so that theirshares of accessions are comparable to their shares of the U.S. popu-lation. We then examine how these officer accessions have contrib-uted to the overall racial/ethnic distribution of the Marine Corps’officer corps.
Accession
Figure 14 (on the next page) shows the share of black and Hispanicofficer accessions over time. We see that the shares accessed increasedover much of the 1980s and 1990s. Since the late 1990s, however, theshare of black officers accessed generally has declined, whereas theshare of Hispanic officers accessed has remained relatively constant.
There is some debate as to which segment of the population shouldbe used to measure whether the racial/ethnic composition of theMarine Corps’ officer corps is representative. The left pie chart offigure 15 (also on the next page) shows the racial/ethnic distributionof the male civilian population of relevant age (21 to 35). One can seethat 12 percent of this population is black. When we further restrictthe population to those who have college degrees, however, we findthat the relevant share shrinks to 7 percent (right pie chart). Thatsaid, the current share of black officers accessed into the MarineCorps (about 4.7 percent) still falls short of this lower threshold. TheHispanic share (currently at 6.3 percent) is also slightly below therevised relevant share of about 7 percent.
21

Figure 14. Black and Hispanic officer candidates as a percentage of all Marine officer accessionsa
a. Source: Population Representation in the Military Services, FY1998, OASD (Force Management Policy) November 1999, Tables D-22 and D-23, CNA tabulations, and MCRC tabulations.
Figure 15. Educational attainment affects shares relevant for comparisona
a. Source: 2004 Census data.
0
5
10
15
20
FY74
FY76
FY78
FY80
FY82
FY84
FY86
FY88
FY90
FY92
FY94
FY96
FY98
FY00
FY02
FY04
FY05
FY06
Accession year
Perc
enta
geBlack Hispanic
2%
5%
20%
12%61%
White BlackHispanic AsianOther/Multiple
2%
11%
7%
7%
73%
21- to 35-yr-old male 21- to 35-yr-old male & college degree
22
Representation
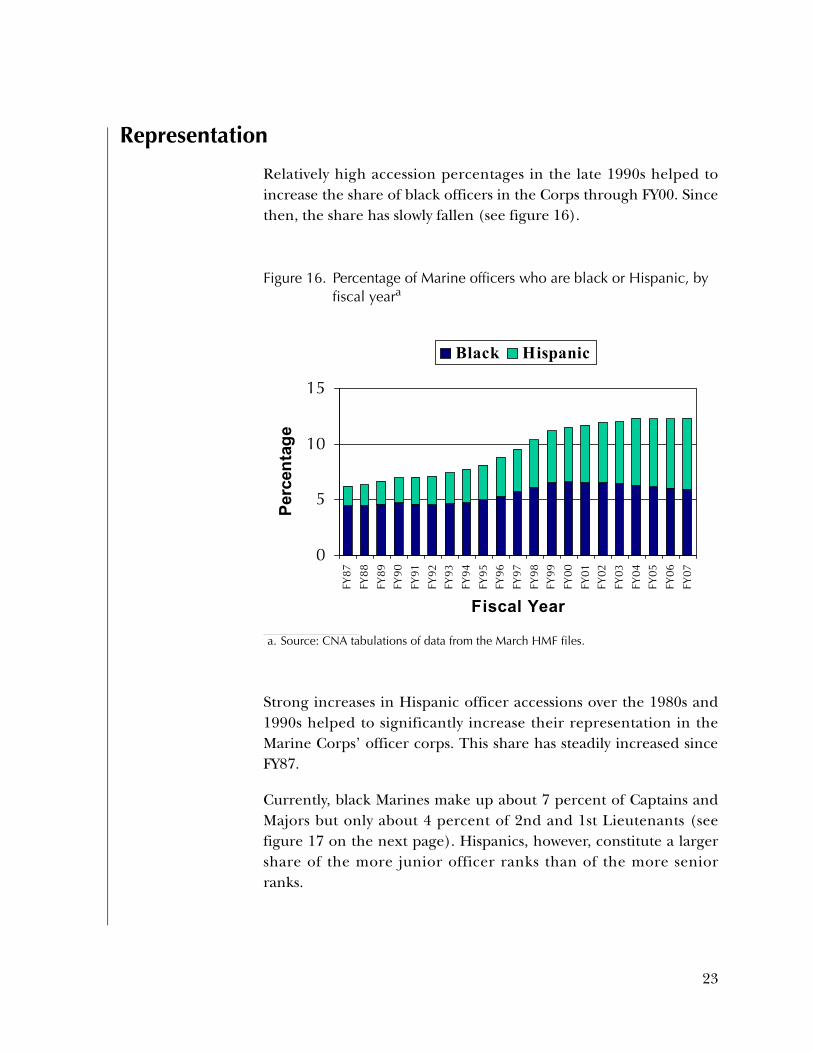
Relatively high accession percentages in the late 1990s helped toincrease the share of black officers in the Corps through FY00. Sincethen, the share has slowly fallen (see figure 16).
Strong increases in Hispanic officer accessions over the 1980s and1990s helped to significantly increase their representation in theMarine Corps’ officer corps. This share has steadily increased sinceFY87.
Currently, black Marines make up about 7 percent of Captains andMajors but only about 4 percent of 2nd and 1st Lieutenants (seefigure 17 on the next page). Hispanics, however, constitute a largershare of the more junior officer ranks than of the more seniorranks.
Figure 16. Percentage of Marine officers who are black or Hispanic, by fiscal yeara
a. Source: CNA tabulations of data from the March HMF files.
0
5
10
15
FY87
FY88
FY89
FY90
FY91
FY92
FY93
FY94
FY95
FY96
FY97
FY98
FY99
FY00
FY01
FY02
FY03
FY04
FY05
FY06
FY07
Fiscal Year
Perc
enta
ge
Black Hispanic
23
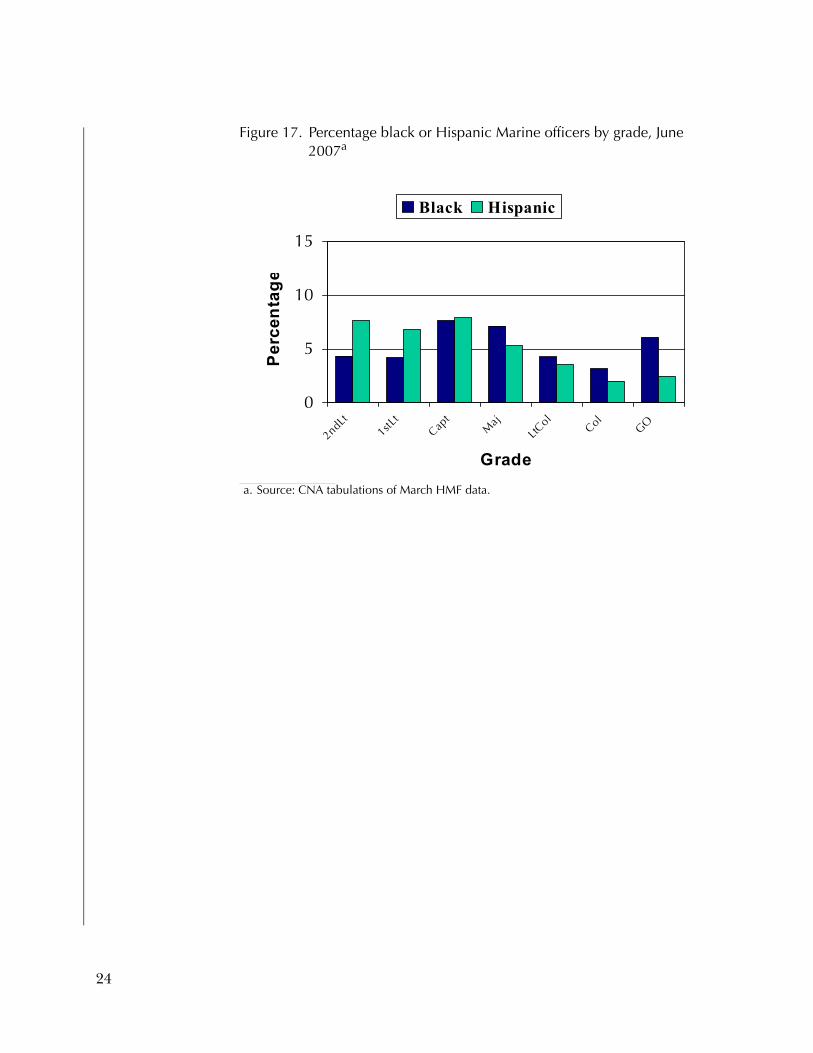
Figure 17. Percentage black or Hispanic Marine officers by grade, June 2007a
a. Source: CNA tabulations of March HMF data.
0
5
10
15
2ndLt1stL
tCap
tM
ajLtC
olCol
GO
Grade
Per
cent
age
Black Hispanic
24

Occupational choice for black and Hispanic Marine officers
Occupational choice for black Marine officers
As was the case for enlisted Marines, the distribution of black Marineofficers across occupations is somewhat different from that of theoverall population of Marine officers. We find that black officers areheavily represented in Food Service (33), Traffic Management (31),Supply Admin & Operations (30), and Personnel Admin & Retention(01)—some of the same occflds with very high concentrations ofblack enlisted Marines. Other occflds with very high concentrationsof black officers (ratios of 2.0 or higher) include Aviation Ordnance(65), Financial Management (34), Electronics Maintenance (59),and Ground Elec Maintenance (28). Finally, there are two occflds inwhich blacks were very underrepresented on the enlisted side butvery overrepresented on the officer side: Ground Ordnance Mainte-nance (21) and Military Police and Corrections (58).
Unlike in the case of enlisted Marines, however, blacks are under-represented in Legal Services (44). Black officers are very under-represented in the Tank & AAV (18) and Pilot/NFO (75) occflds.Appendix E shows the June 2007 occupational distribution of blackMarine officers.
Occupational choice for Hispanic Marine officers
Like Hispanic enlisted Marines, Hispanic Marine officers are veryoverrepresented in the Supply Admin & Operations (30) and Person-nel Admin & Retention (01) occflds. Other occflds with high concen-trations of Hispanic officers include Financial Management (34),Food Service (33), Aircraft Maintenance (60), and Aviation Logistics(66). Hispanic officers are very underrepresented in the Electronics
25

Maintenance (59), Ammo & EOD (23) and Aviation Ordnance (65)occflds. Appendix F shows the June 2007 occupational distribution ofblack Marine officers.
26

Progression to leadership positions for black and Hispanic Marine officers
Because the Marine Corps relies on an internal labor market, today’sblack and Hispanic distributions are directly dependent on the distri-bution of prior years’ accessions (what is sometimes called the “pipe-line” effect). For example, if few black officers entered the MarineCorps 20 years ago, there are unlikely to be many black LieutenantColonels or Colonels today. Table 1 shows the accession share of blackand Hispanic officers for a subset of years used in our analysis.
Cohort (or yeargroup) analyses
Cohort, or yeargroup, analysis follows an accession cohort through-out its members’ careers. For this analysis, we wanted to determine
Table 1. Black and Hispanic officer accession shares: Selected yearsa
a. Officer active-duty accession percentages are from Population Repre-sentation in the Military Services, FY1998, OASD (Force Management Policy) November 1999, Tables D-22 and D-23.
Commissioningfiscal year
Percentage of accessionsBlack Hispanic
1974 5.23 2.081976 5.26 1.331978 3.78 1.981980 3.42 0.591982 3.92 0.971984 5.90 2.521986 4.90 3.771988 5.18 4.371990 4.77 3.761992 5.45 4.50
27
whether black and Hispanic accessions continued to advance as didthe majority members of their cohort. In other words, we wanted tolook at the black and Hispanic shares of today’s senior leaders to seeif they reflect the black and Hispanic accession representation inyears past. There is a problem, however, since today’s senior leader-ship did not enter in a single accession year. For example, Colonels intoday’s Marine Corps did not enter in a single yeargroup; mostentered between 1978 and 1985, but a few entered earlier and somefast-trackers entered later.
To determine whether today’s black and Hispanic shares are reflec-tive of those entering in years past, we create what are known as “syn-thetic cohorts” or “synthetic yeargroups.” A synthetic cohort (oryeargroup) is a constructed cohort of officers whose date of entry intothe Marine Corps reflects the distribution of dates of entry for thegroup of interest. For example, a synthetic yeargroup for today’sMarine Corps Colonels would weight accession shares by the distribu-tion of commissioning dates for today’s O-6s.8 Then, we can comparethese shares with the black/Hispanic distribution of today’s officers.Tables 2 (on the next page) shows these results for field grade andgeneral officers.
From table 2, we see that the current share of black officers is largerthan that predicted by the respective accession shares for O-4s andO-7s through O-10s. For O-4s and O-5s, however, the black accessionshare is a little larger than the current black representation in thesefield grade ranks.
The yeargroups that make up the current field grade and generalofficer populations had very small Hispanic representation (less than2 percent for O-6s and only slightly more than 1 percent for general
8. Thus, for all O-6s in the Marine Corps in March 2007, we examinedtheir commissioning date and assigned it to its respective year. We thenmultiplied the black or Hispanic share in each accession year (examplesof which are reported in table 1) by the accession share for current O-6sfor that year to determine the composition of our “synthetic accessioncohort.” Summing these shares across all years and dividing by 100 givesus the accession share of any given group for our synthetic cohort.
28
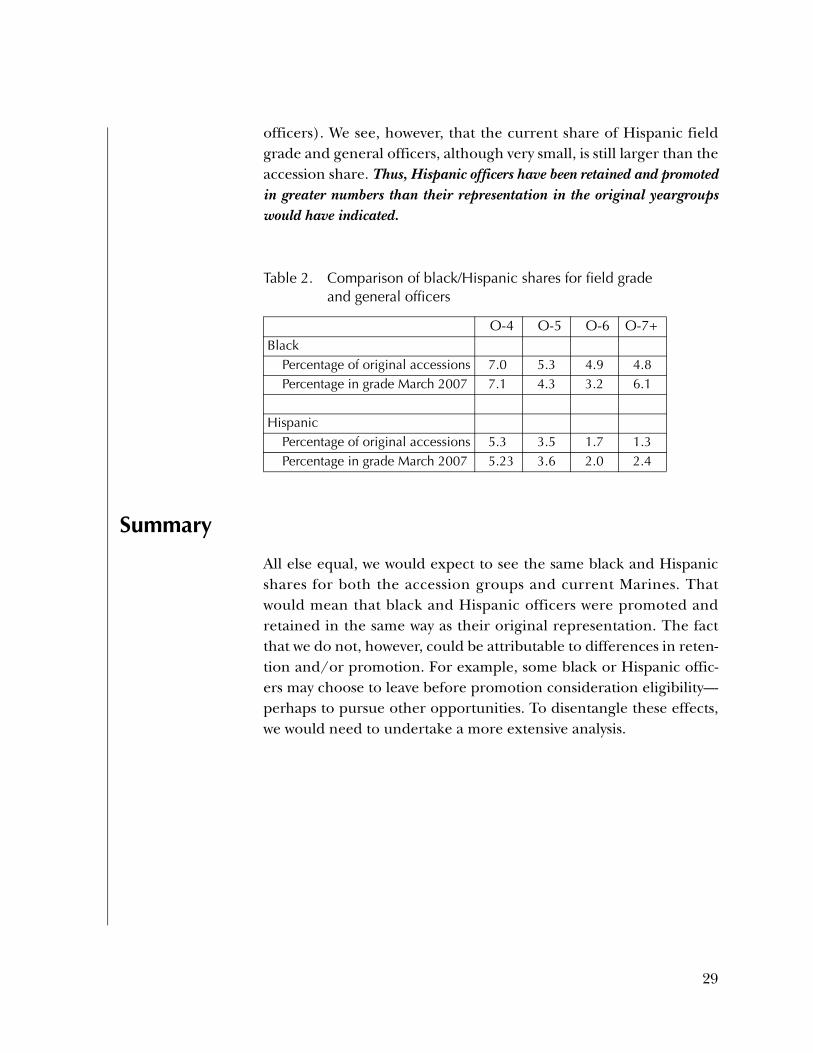
officers). We see, however, that the current share of Hispanic fieldgrade and general officers, although very small, is still larger than theaccession share. Thus, Hispanic officers have been retained and promotedin greater numbers than their representation in the original yeargroupswould have indicated.
Summary
All else equal, we would expect to see the same black and Hispanicshares for both the accession groups and current Marines. Thatwould mean that black and Hispanic officers were promoted andretained in the same way as their original representation. The factthat we do not, however, could be attributable to differences in reten-tion and/or promotion. For example, some black or Hispanic offic-ers may choose to leave before promotion consideration eligibility----perhaps to pursue other opportunities. To disentangle these effects,we would need to undertake a more extensive analysis.
Table 2. Comparison of black/Hispanic shares for field grade and general officers
O-4 O-5 O-6 O-7+Black
Percentage of original accessions 7.0 5.3 4.9 4.8Percentage in grade March 2007 7.1 4.3 3.2 6.1
HispanicPercentage of original accessions 5.3 3.5 1.7 1.3Percentage in grade March 2007 5.23 3.6 2.0 2.4
29

This page intentionally left blank.
30

Conclusion
The degree to which the Marine Corps can reflect the diversity of American society depends on its ability to access, retain, and promote qualified black and Hispanic individuals. This study has examined these trends.
Accession and Representation
We find that the share of black enlisted accessions has fallen overtime, and currently is below the black share of the U.S. population.The two most recent declines in the percentage of recruits accessedwho are black have been associated with wars. Correspondingly, therepresentation of blacks in the enlisted force also has fallen over time.Currently, black Marines make up 32 percent of Sergeants Major/Master Gunnery Sergeants but less than 10 percent of Privates.
For officers, we find that the share of black officers accessed generallyhas declined since the late 1990s. This has contributed to their fallingrepresentation in the officer corps. Both the accession and represen-tation shares currently fall below the relevant black share of the U.S.population. Today, black Marines make up about 7 percent of Cap-tains and Majors but only about 4 percent of 2nd and 1st Lieutenants.
In contrast, we find that the share of enlisted Marine accessions thatare Hispanic has generally increased over time. High Hispanic repre-sentation among enlisted accessions has contributed to a growingshare of the enlisted force that is Hispanic. In fact, both the accessionand representation shares currently exceed the Hispanic share of theU.S. population. Today, Hispanic Marines make up less than 10 per-cent of Sergeants Major/Master Gunnery Sergeants but over 15 per-cent of Privates.
The share of Hispanic officers accessed has remained relatively con-stant in recent years, but is slightly below the relevant Hispanic shareof the U.S. population. The representation of Hispanic officers in the
31

Corps has steadily increased since FY87. Currently, Hispanics consti-tute a larger share of the more junior officer ranks than of the moresenior ranks.
Occupational Distribution
Black Marines are distributed across occupations very differently thanthe overall population of enlisted Marines. Specifically, they are over-represented in support occupational fields. Black enlisted Marinesare significantly underrepresented in the Infantry (03) and severalAircraft Maintenance occflds.
Black officers are very heavily represented in some of the same occfldswith very high concentrations of black enlisted Marines. Otheroccflds with very high concentrations of black officers include Avia-tion Ordnance (65), Financial Management (34), Electronics Main-tenance (59), and Ground Elec Maintenance (28). There are twooccflds in which blacks were very underrepresented on the enlistedside but are very overrepresented on the officer side. These areGround Ordnance Maintenance (21) and Military Police and Correc-tions (58).
Unlike enlisted Marines, however, black officers are underrepre-sented in Legal Services (44). Black officers are very underrepre-sented in the Tank & AAV (18) and Pilot/NFO (75) occflds.
Hispanic enlisted Marines are overrepresented in many of the sameoccflds that black enlisted Marines were overrepresented in, althoughthe degree of overrepresentation is smaller.
Like Hispanic enlisted Marines, Hispanic Marine officers are veryoverrepresented in the support occupational fields. Other occfldswith high concentrations of Hispanic officers include Financial Man-agement (34), Food Service (33), Aircraft Maintenance (60), and Avi-ation Logistics (66). Hispanic officers are very underrepresented inthe Electronics Maintenance (59), Ammo & EOD (23) and AviationOrdnance (65) occflds.
32

Retention and Quality of Life for Black Enlisted Marines
Black enlisted Marines’ retention behavior indicates that they havefound satisfying careers in the Corps. Black Marines reenlist at sub-stantially higher rates than other Marines; over the 1980 to 2006period, they reenlisted at higher average rates—at every reenlistmentpoint—than members of any other race/ethnic group.
Because of their high reenlistment rates, black Marines are morelikely to stay in the Corps for a full career. Military retirement andmedical benefits provide additional economic security. Marines alsohave access to several educational benefits that can help them toachieve financial security even if they separate from the Corps beforeretirement. Finally, the Corps offers good quality of life. The Corpsoffers black Marines steady jobs and black male Marines are just aslikely to be married as their white counterparts.
Leadership and Promotion Opportunities
The Marine Corps offers black and Hispanic men and women manyopportunities to lead others. To determine the prevalence of theseopportunities, we examined the representation of black and HispanicMarines in the Corps’ top enlisted rank (E9). We found that blackand Hispanic Marines constitute a larger share of the Marine Corps’top enlisted ranks than their accession shares would have suggested.
To determine whether today’s black and Hispanic officer shares arereflective of those entering in years past, we created “syntheticcohorts” or “synthetic yeargroups.” Then, we compared these sharesto the black/Hispanic distribution of today’s officers.
We found that Black and Hispanic Marine officers have done verywell in officer promotions. Black Marine Corps officers haveexceeded their accession shares as Majors and as General Officers.For LtColonels and Colonels, black accession shares somewhatexceed current incumbent shares. Hispanic officers have exceededtheir accession shares at all field grade and general officer levels. Inshort, they have been promoted and retained better than others.
33

This page intentionally left blank.
34

Appendix A
Appendix A: Black enlisted Marines by grade
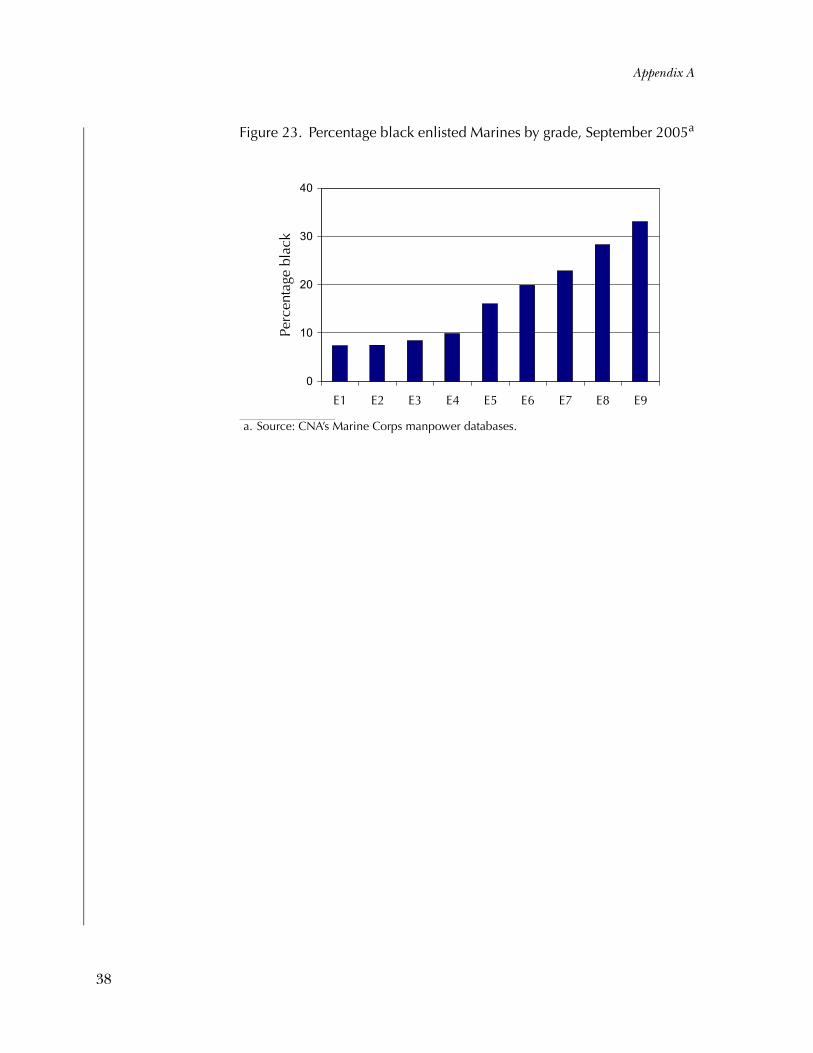
Figures 18 through 23 show the percentage of enlisted black Marines,by grade, in different years. Smaller accession shares over time havecontributed to a top-heavy grade distribution for black enlistedMarines.
Figure 18. Percentage black enlisted Marines by grade, December 1970a
a. Source: CNA’s Marine Corps manpower databases.
0
10
20
30
E1 E2 E3 E4 E5 E6 E7 E8 E9
Perc
enta
ge b
lack
35

Appendix A
Figure 19. Percentage black enlisted Marines by grade, September 1985a
a. Source: CNA’s Marine Corps manpower databases.
Figure 20. Percentage black enlisted Marines by grade, September 1990a
a. Source: CNA’s Marine Corps manpower databases.
0
10
20
30
40
E1 E2 E3 E4 E5 E6 E7 E8 E9
Perc
enta
ge b
lack
0
10
20
30
40
E1 E2 E3 E4 E5 E6 E7 E8 E9
Perc
enta
ge b
lack
36

Appendix A
Figure 21. Percentage black enlisted Marines by grade, September 1995a
a. Source: CNA’s Marine Corps manpower databases.
Figure 22. Percentage black enlisted Marines by grade, September 2000a
a. Source: CNA’s Marine Corps manpower databases.
0
10
20
30
40
E1 E2 E3 E4 E5 E6 E7 E8 E9
Perc
enta
ge b
lack
0
10
20
30
40
E1 E2 E3 E4 E5 E6 E7 E8 E9
Perc
enta
ge b
lack
37
Appendix A
Figure 23. Percentage black enlisted Marines by grade, September 2005a
a. Source: CNA’s Marine Corps manpower databases.
0
10
20
30
40
E1 E2 E3 E4 E5 E6 E7 E8 E9
Perc
enta
ge b
lack
38

Appendix B
Appendix B: Comparisons with other military Services
In general, black accessions have declined in all the Services in theyears since FY00. Table 3 shows these percentages, by fiscal year.
Figure 24 (on the next page) compares the percentage black, bygrade, in the Army and Marine Corps in March 2007. Although theArmy has a higher percentage of black accessions than the MarineCorps, the black accession percentages have fallen sharply in bothServices and both Services have top-heavy grade distributions fortheir black enlisted personnel.
Table 3. Accessions: Percentage black by fiscal yeara
a. Data from OSD, Accession Policy. Service and DOD totals include prior service accessions, which account for less than 1/2 of 1 percent of recruits.
2000 2001 2002 2003 2004 2005 2006b
b. Data for 2006 are preliminary.
Army 23.0% 22.4% 17.1% 15.9% 14.2% 12.0% 12.4%Navy 20.8% 20.9% 17.8% 19.0% 19.7% 18.8% 17.2%Marine Corps 12.8% 12.2% 10.0% 9.0% 8.3% 7.7% 7.6%Air Force 19.3% 18.2% 15.5% 13.8% 14.6% 14.4% 14.7%DOD total 20.0% 19.9% 15.7% 15.0% 14.5% 13.1% 12.9%
39

Appendix B
Figure 24. Percentage black, by grade, in the Army and Marine Corps: March 2007a
a. Source: Data from Defense Manpower Data Center’s (DMDC’s) Information Data System (IDS).
0
10
20
30
40
Pvt
PFC
LCpl Cpl Sg
tSS
gt
GySgt
lstSg
y/MSg
t
SgtM
aj/M
GySgt
Perc
enta
ge b
lack Marine Corps
Army
40

Appendix C
Appendix C: Black enlisted Marines by occupational field
Table 4 shows the representation of black enlisted Marines by occupa-tional field (occfld). Occflds are arranged from those with the largestproportion of black enlisted Marines to those with the smallest pro-portion of black enlisted Marines.
Table 4. Occupational distribution of black Marines, May 2007a
Occfld Occupation description
RepresentationBlack
MarinesbAll enlistedMarinesc Ratiod
31 Traffic Management 1.14% 0.40% 2.85 Very overrepresented33 Food Service 4.04% 1.44% 2.80 Very overrepresented30 Supply Admin & Operations 10.02% 4.23% 2.37 Very overrepresented01 Personnel Admin & Retention 10.99% 5.01% 2.19 Very overrepresented44 Legal Services 0.66% 0.35% 1.88 Very overrepresented66 Aviation Logistics 2.38% 1.30% 1.83 Very overrepresented06 Communications 12.41% 7.87% 1.58 Very overrepresented34 Financial Management 1.18% 0.79% 1.49 Overrepresented11 Utilities 2.42% 1.69% 1.43 Overrepresented70 Airfield Services 1.92% 1.45% 1.33 Overrepresented41 MCCS 0.13% 0.10% 1.30 Overrepresented04 Logistics 2.81% 2.36% 1.19 Overrepresented46 Combat Camera 0.31% 0.27% 1.17 Overrepresented35 Motor Transport 9.11% 7.92% 1.15 Overrepresented60 Aircraft Maintenance 3.15% 3.40% 0.93 Underrepresented23 Ammo & EOD 1.14% 1.23% 0.93 Underrepresented05 MAGTF Plans 0.18% 0.20% 0.87 Underrepresented63 Avionics 1.80% 2.18% 0.83 Underrepresented64 Avionics 1.33% 1.65% 0.80 Underrepresented02 Intelligence 1.13% 1.45% 0.78 Underrepresented28 Ground Elec Maintenance 1.83% 2.38% 0.77 Underrepresented13 Eng, Const, Fac, & Equip 3.57% 4.73% 0.75 Underrepresented
41

Appendix C
72 Air Control/Air Support/Antiair Warfare/ATC
0.92% 1.30% 0.71 Underrepresented
68 Meteorology & Oceanography 0.14% 0.19% 0.71 Underrepresented08 Field Artillery 1.73% 2.55% 0.68 Underrepresented55 Music 0.43% 0.63% 0.67 Underrepresented43 Public Affairs 0.20% 0.30% 0.66 Underrepresented59 Electronics Maintenance 0.73% 1.12% 0.66 Underrepresented65 Aviation Ordnance 0.97% 1.57% 0.62 Underrepresented18 Tank & AAV 0.77% 1.52% 0.51 Underrepresented21 Ground Ordnance Maintenance 1.17% 2.48% 0.47 Very underrepresented58 MP & Corrections 1.12% 2.40% 0.47 Very underrepresented73 Enlisted Flight Crews 0.08% 0.17% 0.46 Very underrepresented03 Infantry 9.17% 20.62% 0.44 Very underrepresented62 Aircraft Maintenance 0.89% 2.26% 0.39 Very underrepresented26 Signals Intelligence/Ground Elect
Warfare0.53% 1.38% 0.38 Very underrepresented
61 Aircraft Maintenance 1.19% 3.26% 0.37 Very underrepresented57 CBRN Defense 0.22% 0.64% 0.35 Very underrepresented
a. May 2007 tabulations by MI, M&RA.b. This is the percentage of black Marines in this occfld. These do not total to 100 percent because some Marines are still in training
MOSs.c. This is the percentage of all enlisted Marines in this occfld. These do not total to 100 percent because some Marines are still in
training MOSs.d. This is the ratio of the percentage of black Marines in this occfld to the percentage of all Marines in this occfld.
Table 4. Occupational distribution of black Marines, May 2007a (continued)
Occfld Occupation description
RepresentationBlack
MarinesbAll enlistedMarinesc Ratiod
42

Appendix D
Appendix D: Hispanic enlisted Marines by occupational field
Table 5 shows the representation of Hispanic enlisted Marines byoccupational field (occfld). Occflds are arranged from those with thelargest proportion of Hispanic enlisted Marines to those with thesmallest proportion of Hispanic enlisted Marines.
Table 5. Occupational distribution of Hispanic Marines, May 2007a
Representation
Occfld Occupation descriptionHispanic Marinesb
All enlistedMarinesc Ratiod
01 Personnel Admin & Retention 9.27% 5.18% 1.79 Very overrepresented30 Supply Admin & Operations 7.00% 4.21% 1.66 Very overrepresented31 Traffic Management 0.65% 0.40% 1.61 Very overrepresented41 MCCS 0.15% 0.10% 1.59 Very overrepresented44 Legal Services 0.53% 0.35% 1.51 Very overrepresented33 Food Service 2.06% 1.42% 1.46 Overrepresented66 Aviation Logistics 1.88% 1.29% 1.46 Overrepresented04 Logistics 3.10% 2.32% 1.33 Overrepresented11 Utilities 2.07% 1.68% 1.24 Overrepresented34 Financial Management 0.94% 0.78% 1.21 Overrepresented46 Combat Camera 0.32% 0.27% 1.20 Overrepresented35 Motor Transport 9.26% 7.84% 1.18 Overrepresented06 Communications 8.56% 7.75% 1.10 Overrepresented70 Airfield Services 1.46% 1.45% 1.01 Overrepresented13 Eng, Const, Fac, & Equip 4.72% 4.68% 1.01 Overrepresented
63/64 Avionics 3.66% 3.79% 0.97 Underrepresented21 Ground Ordnance Maintenance 2.35% 2.44% 0.96 Underrepresented08 Field Artillery 2.36% 2.53% 0.93 Underrepresented84 Recruiter 0.29% 0.31% 0.93 Underrepresented18 Tank & AAV 1.37% 1.53% 0.89 Underrepresented05 MAGTF Plans 0.17% 0.19% 0.89 Underrepresented02 Intelligence 1.28% 1.46% 0.88 Underrepresented
43

Appendix D
23 Ammo & EOD 1.10% 1.25% 0.88 Underrepresented72 Air Control/Air Support/Anti-Air
Warfare/ATC1.10% 1.26% 0.88 Underrepresented
68 Meteorology & Oceanography .17% 0.20% 0.86 Underrepresented60/61/
62Aircraft Maintenance 7.58% 8.92% 0.85 Underrepresented
43 Public Affairs .25% 0.30% 0.85 Underrepresented28 Ground Elec Maintenance 2.01% 2.38% 0.84 Underrepresented65 Aviation Ordnance 1.35% 1.61% 0.84 Underrepresented59 Electronics Maintenance .87% 1.07% 0.82 Underrepresented03 Infantry 15.91% 20.39% 0.78 Underrepresented58 MP & Corrections 1.84% 2.39% 0.77 Underrepresented89 Misc .68% 0.90% 0.76 Underrepresented73 Enlisted Flight Crews .12% 0.17% 0.70 Underrepresented57 CBRN Defense .42% 0.62% 0.68 Underrepresented55 Music .35% 0.62% 0.56 Underrepresented26 Signals Intelligence/Ground Elec
Warfare.66% 1.39% 0.48 Very underrepresented
80 Misc 2.08% 4.49% 0.46 Very underrepresented
a. June 2007 tabulations by CNA.b. This is the percentage of Hispanic Marines in this occfld. These do not total to 100 percent because some Marines are still in
training MOSs.c. This is the percentage of all enlisted Marines in this occfld. These do not total to 100 percent because some Marines are still in
training MOSs.d. This is the ratio of the percentage of Hispanic Marines in this occfld to the percentage of all Marines in this occfld.
Table 5. Occupational distribution of Hispanic Marines, May 2007a (continued)
Representation
Occfld Occupation descriptionHispanic Marinesb
All enlistedMarinesc Ratiod
44

Appendix E
Appendix E: Black Marine officers by occupational field
Table 6 shows the representation of black Marine officers by occupa-tional field (occfld). Occflds are arranged from those with the largestproportion of black Marine officers to those with the smallest propor-tion of black Marine officers.
Table 6. Occupational distribution of black officers, June 2007a
Representation
Occfld Occupation description
BlackMarine officersb
All Marine officersc Ratiod
33 Food Service 0.51% 0.10% 5.22 Very overrepresented31 Traffic Management 0.41% 0.08% 5.14 Very overrepresented65 Aviation Ordnance 0.82% 0.24% 3.43 Very overrepresented30 Supply Admin & Operations 11.31% 3.98% 2.84 Very overrepresented01 Personnel Admin & Retention 6.42% 2.48% 2.59 Very overrepresented34 Financial Management 4.08% 1.67% 2.44 Very overrepresented21 Ground Ordnance Maintenance 0.51% 0.25% 2.04 Very overrepresented59 Electronics Maintenance 0.41% 0.20% 2.03 Very overrepresented28 Ground Elec Maintenance 0.61% 0.30% 2.01 Very overrepresented43 Public Affairs 1.53% 0.82% 1.86 Very overrepresented66 Aviation Logistics 2.55% 1.38% 1.85 Very overrepresented04 Logistics 14.17% 8.18% 1.73 Very overrepresented58 MP & Corrections 2.04% 1.19% 1.71 Very overrepresented06 Communications 9.17% 5.95% 1.54 Very overrepresented63 Avionics 0.41% 0.27% 1.49 Overrepresented60 Aircraft Maintenance 2.75% 1.91% 1.44 Overrepresented23 Ammo & EOD 0.41% 0.29% 1.42 Overrepresented72 Air Control/Air Support/Antiair
Warfare/ATC3.98% 3.26% 1.22 Overrepresented
44 Legal Services 2.45% 2.84% 0.86 Underrepresented02 Intelligence 4.89% 5.84% 0.84 Underrepresented
45

Appendix E
80 Misc. 1.62 1.33% 0.82 Underrepresented03 Infantry 9.07% 13.06% 0.69 Underrepresented08 Field Artillery 3.47% 5.03% 0.69 Underrepresented13 Eng, Const, Fac, & Equip 1.63% 2.92% 0.56 Underrepresented18 Tank & AAV 0.92% 1.98% 0.46 Very underrepresented75 Pilots/NFOs 12.74% 32.59% 0.39 Very underrepresented
a. June 2007 tabulations by CNA. For O-1 to O-5 Marines. Only occflds with more than 10 Marines reported.b. This is the percentage of black Marine officers in this occfld. These do not total to 100 percent because some Marine officers are
still in training MOSs.c. This is the percentage of all Marine officers in this occfld. These do not total to 100 percent because some Marine officers are
still in training MOSs.d. This is the ratio of the percentage of black Marine officers in this occfld to the percentage of all Marine officers in this occfld.
Table 6. Occupational distribution of black officers, June 2007a (continued)
Representation
Occfld Occupation description
BlackMarine officersb
All Marine officersc Ratiod
46
Appendix F
Appendix F: Hispanic Marine officers by occupational field
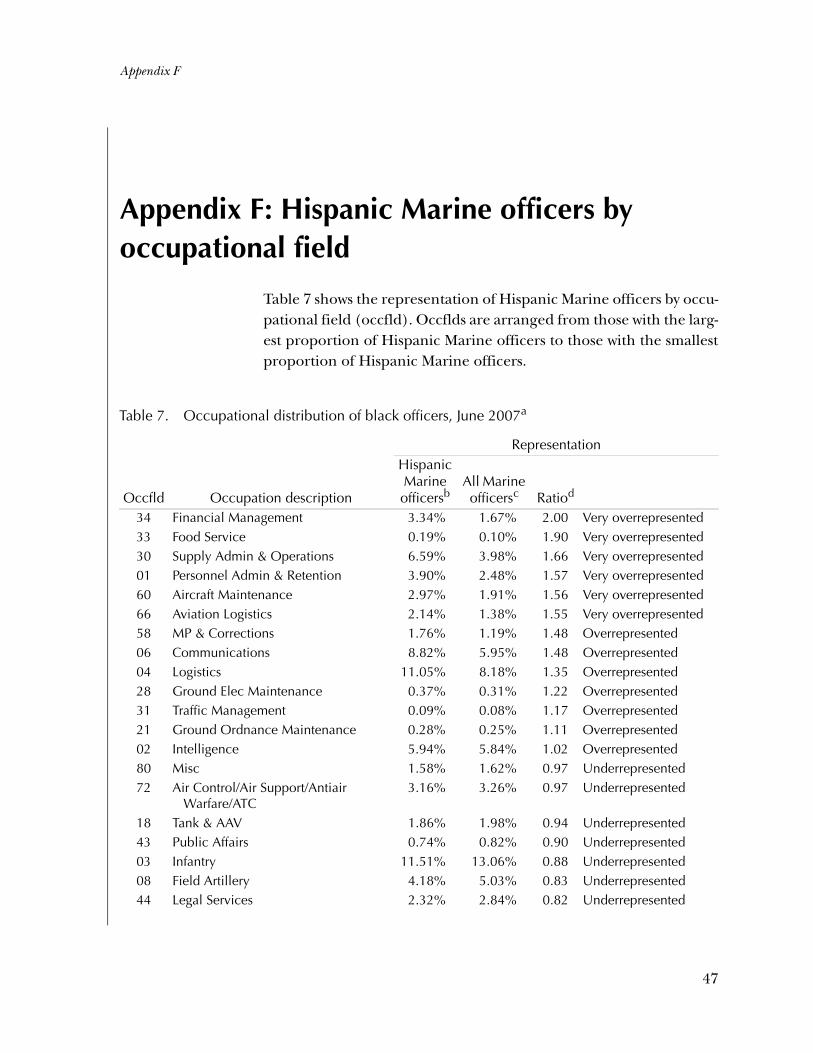
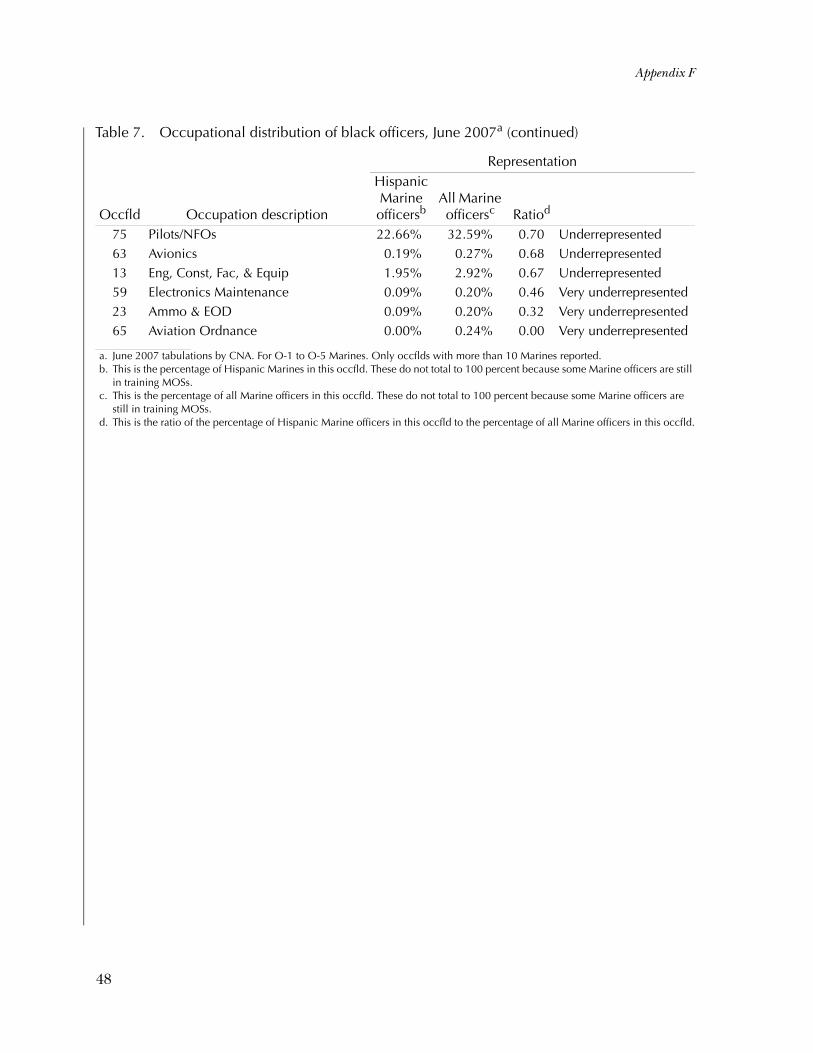
Table 7 shows the representation of Hispanic Marine officers by occu-pational field (occfld). Occflds are arranged from those with the larg-est proportion of Hispanic Marine officers to those with the smallestproportion of Hispanic Marine officers.
Table 7. Occupational distribution of black officers, June 2007a
Representation
Occfld Occupation description
HispanicMarine officersb
All Marine officersc Ratiod
34 Financial Management 3.34% 1.67% 2.00 Very overrepresented33 Food Service 0.19% 0.10% 1.90 Very overrepresented30 Supply Admin & Operations 6.59% 3.98% 1.66 Very overrepresented01 Personnel Admin & Retention 3.90% 2.48% 1.57 Very overrepresented60 Aircraft Maintenance 2.97% 1.91% 1.56 Very overrepresented66 Aviation Logistics 2.14% 1.38% 1.55 Very overrepresented58 MP & Corrections 1.76% 1.19% 1.48 Overrepresented06 Communications 8.82% 5.95% 1.48 Overrepresented04 Logistics 11.05% 8.18% 1.35 Overrepresented28 Ground Elec Maintenance 0.37% 0.31% 1.22 Overrepresented31 Traffic Management 0.09% 0.08% 1.17 Overrepresented21 Ground Ordnance Maintenance 0.28% 0.25% 1.11 Overrepresented02 Intelligence 5.94% 5.84% 1.02 Overrepresented80 Misc 1.58% 1.62% 0.97 Underrepresented72 Air Control/Air Support/Antiair
Warfare/ATC3.16% 3.26% 0.97 Underrepresented
18 Tank & AAV 1.86% 1.98% 0.94 Underrepresented43 Public Affairs 0.74% 0.82% 0.90 Underrepresented03 Infantry 11.51% 13.06% 0.88 Underrepresented08 Field Artillery 4.18% 5.03% 0.83 Underrepresented44 Legal Services 2.32% 2.84% 0.82 Underrepresented
47
Appendix F
75 Pilots/NFOs 22.66% 32.59% 0.70 Underrepresented63 Avionics 0.19% 0.27% 0.68 Underrepresented13 Eng, Const, Fac, & Equip 1.95% 2.92% 0.67 Underrepresented59 Electronics Maintenance 0.09% 0.20% 0.46 Very underrepresented23 Ammo & EOD 0.09% 0.20% 0.32 Very underrepresented65 Aviation Ordnance 0.00% 0.24% 0.00 Very underrepresented
a. June 2007 tabulations by CNA. For O-1 to O-5 Marines. Only occflds with more than 10 Marines reported.b. This is the percentage of Hispanic Marines in this occfld. These do not total to 100 percent because some Marine officers are still
in training MOSs.c. This is the percentage of all Marine officers in this occfld. These do not total to 100 percent because some Marine officers are
still in training MOSs.d. This is the ratio of the percentage of Hispanic Marine officers in this occfld to the percentage of all Marine officers in this occfld.
Table 7. Occupational distribution of black officers, June 2007a (continued)
Representation
Occfld Occupation description
HispanicMarine officersb
All Marine officersc Ratiod
48

List of figures
Figure 1. Black recruits as a percentage of all non-prior-service recruits . . . . . . . . . . . . . . . . . . . . . . . . . 4
Figure 2. Percentage of enlisted Marines who are black, by age . . . . . . . . . . . . . . . . . . . . . . . . 4
Figure 3. Percentage of black Marines by grade, June 2007 . . . . . . . . . . . . . . . . . . . . . . . 5
Figure 4. Hispanic recruits as a percentage of all non-prior-service recruits, . . . . . . . . . . . . . . 6
Figure 5. Percentage of enlisted Marines who are Hispanic . . . . . . . . . . . . . . . . . . . . . . . . 6
Figure 6. Percentage of Hispanic Marines by grade, June 2007 . . . . . . . . . . . . . . . . . . . . . . . 7
Figure 7. Black Marines in the support occflds (01 and 30) as a share of all black Marines . . . . . . . . . . . . 10
Figure 8. Marines under age 25: Overall percentage black and MOS 0311 percentage black. . . . . . . . 10
Figure 9. First-term reenlistment rates by racial/ethnic group: FY80 through FY06 . . . . . . . . . . . . . . 14
Figure 10. Percentage of enlisted male Marines who are married, by age: December 2006 . . . . . . . . . . . 15
Figure 11. General military propensity by race/ethnicity . . . . 16
Figure 12. Percentage black: Current Sergeants Major/Master Gunnery Sergeants and their original accession representation . . . . . . . . . . . . . . . . . . . . . 18
49
Figure 13. Percentage Hispanic: Current Sergeants Major/Master Gunnery Sergeants and their original accession representation . . . . . . . . . . . . . . . 19
Figure 14. Black and Hispanic officer candidates as a percentage of all Marine officer accessions . . . . . 22
Figure 15. Educational attainment affects shares relevant for comparison . . . . . . . . . . . . . . . . . . . . 22
Figure 16. Percentage of Marine officers who are black or Hispanic, by fiscal year . . . . . . . . . . . . . . . . 23
Figure 17. Percentage black or Hispanic Marine officers by grade, June 2007 . . . . . . . . . . . . . . . . . . 24
Figure 18. Percentage black enlisted Marines by grade, December 1970 . . . . . . . . . . . . . . . . . . . . 31
Figure 19. Percentage black enlisted Marines by grade, September 1985 . . . . . . . . . . . . . . . . . . . . 32
Figure 20. Percentage black enlisted Marines by grade, September 1990 . . . . . . . . . . . . . . . . . . . . 32
Figure 21. Percentage black enlisted Marines by grade, September 1995 . . . . . . . . . . . . . . . . . . . . 33
Figure 22. Percentage black enlisted Marines by grade, September 2000 . . . . . . . . . . . . . . . . . . . . 33
Figure 23. Percentage black enlisted Marines by grade, September 2005 . . . . . . . . . . . . . . . . . . . . 34
Figure 24. Percentage black, by grade, in the Army and Marine Corps: March 2007 . . . . . . . . . . . . . . 36
50

List of tables
Table 1. Black and Hispanic officer accession shares: Selected years . . . . . . . . . . . . . . . . . . . . . 27
Table 2. Comparison of black/Hispanic shares for field grade and general officers . . . . . . . . . . . 29
Table 3. Accessions: Percentage black by fiscal year. . . . . . 35
Table 4. Occupational distribution of black Marines, May 2007 . . . . . . . . . . . . . . . . . . . . . . . . 37
Table 5. Occupational distribution of Hispanic Marines, May 2007 . . . . . . . . . . . . . . . . . . . . . . . . 39
Table 6. Occupational distribution of black officers, June 2007 . . . . . . . . . . . . . . . . . . . . . . . 41
Table 7. Occupational distribution of black officers, June 2007 . . . . . . . . . . . . . . . . . . . . . . . 43
51

This page intentionally left blank.
52


CR
M D
0016
910.
A1
/ Fin
al