Embed Size (px)
Citation preview

BIOTECHNOLOGY FOR ENGINEERSCore Course for
B.Eng.(Chemical Engineering)Semester I (2010/2011)
Mohamad Hekarl Uzir, MSc.,DIC.,PhD.(London)- [email protected]
School of Chemical Engineering
Engineering Campus, Universiti Sains Malaysia
Seri Ampangan, 14300 Nibong Tebal
Seberang Perai Selatan, Penang
EKC271 – p. 1/161
Course Contents
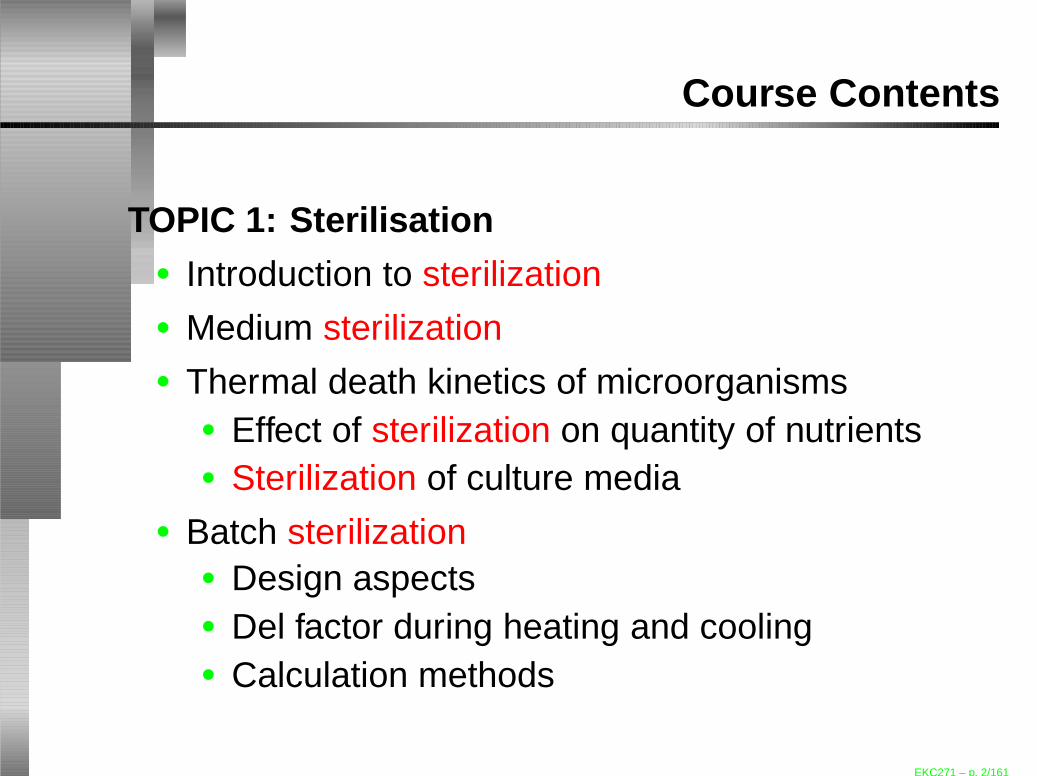
TOPIC 1: Sterilisation• Introduction to sterilization• Medium sterilization• Thermal death kinetics of microorganisms
• Effect of sterilization on quantity of nutrients• Sterilization of culture media
• Batch sterilization• Design aspects• Del factor during heating and cooling• Calculation methods
EKC271 – p. 2/161

Course Contents
TOPIC 1: Sterilisation• Continuous sterilization• Sterilization of air
• Methods of air sterilization• Theory of fibrous filter
• Sterilization of fermenter
EKC271 – p. 3/161

Course Contents
TOPIC 2: Bacterial Growth• Growth curve and the phases involved• Batch culture
• Material balance for batch culture• Kinetics of batch culture–Monod Model
• Continuous culture• Material balance for continuous culture• Kinetics of continuous culture–Monod Model
EKC271 – p. 4/161
Course Contents
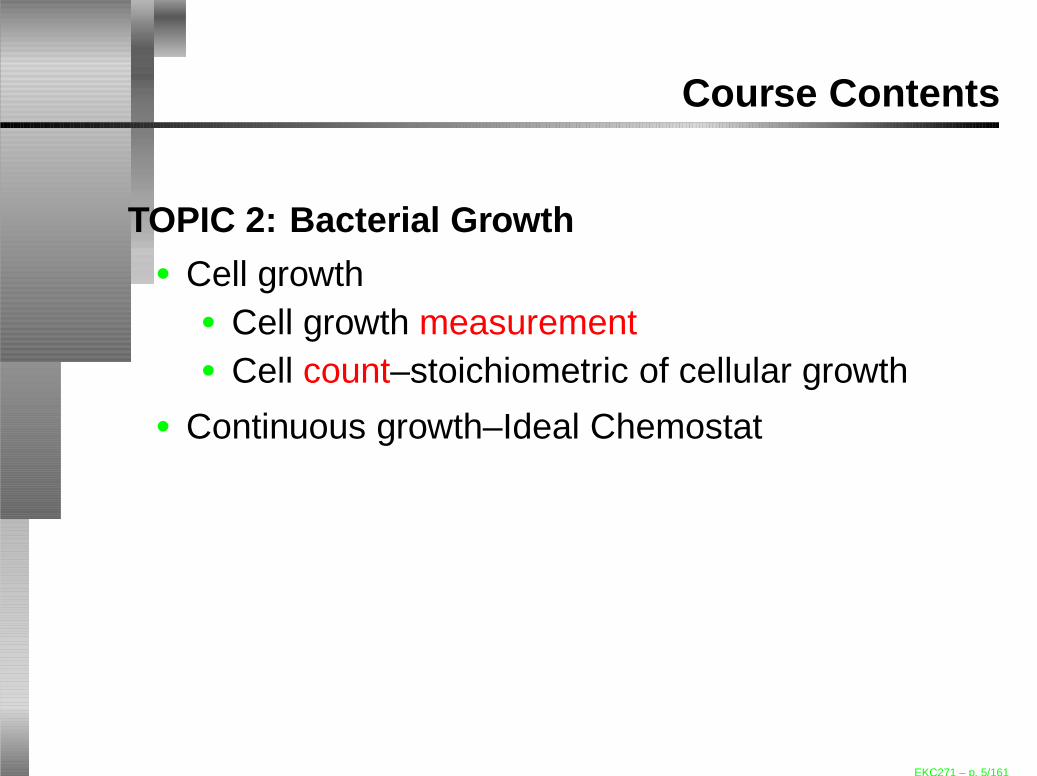
TOPIC 2: Bacterial Growth• Cell growth
• Cell growth measurement• Cell count–stoichiometric of cellular growth
• Continuous growth–Ideal Chemostat
EKC271 – p. 5/161

Course Contents
TOPIC 3: Effect of Environmental Conditions• Effect of different conditions towards growth
kinetics• Effect on temperature• Effect on pH• Effect on oxygen concentration
• Heat generation by microbial growth
EKC271 – p. 6/161
Course Contents
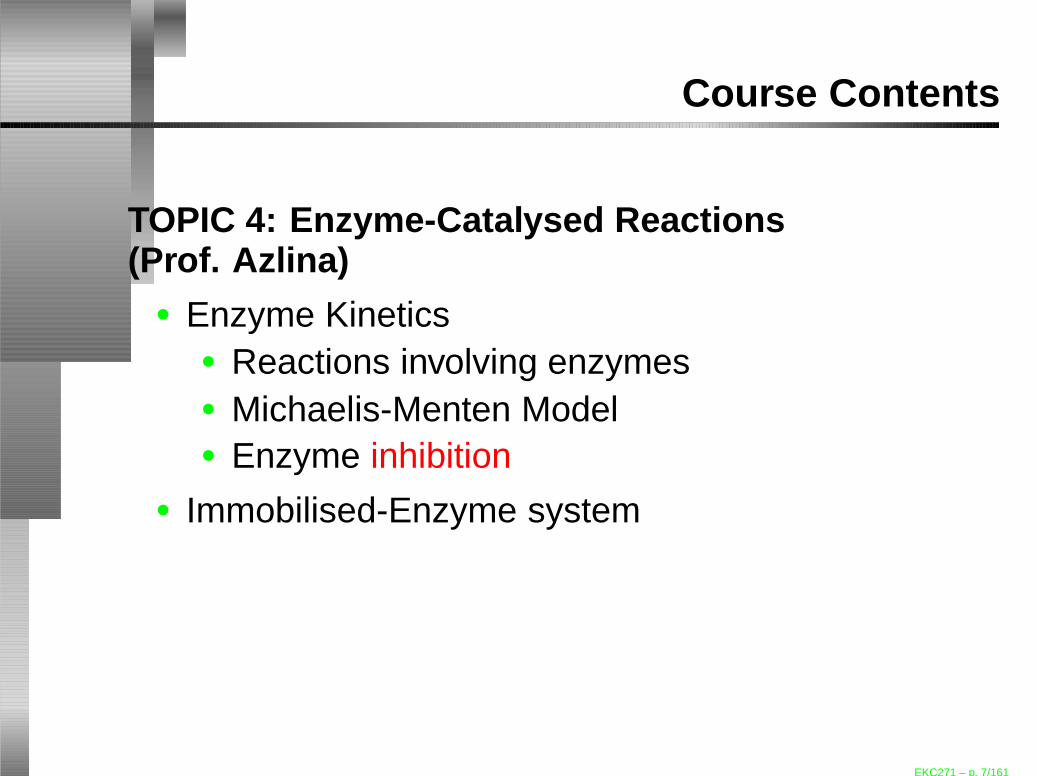
TOPIC 4: Enzyme-Catalysed Reactions(Prof. Azlina)
• Enzyme Kinetics• Reactions involving enzymes• Michaelis-Menten Model• Enzyme inhibition
• Immobilised-Enzyme system
EKC271 – p. 7/161
Overview
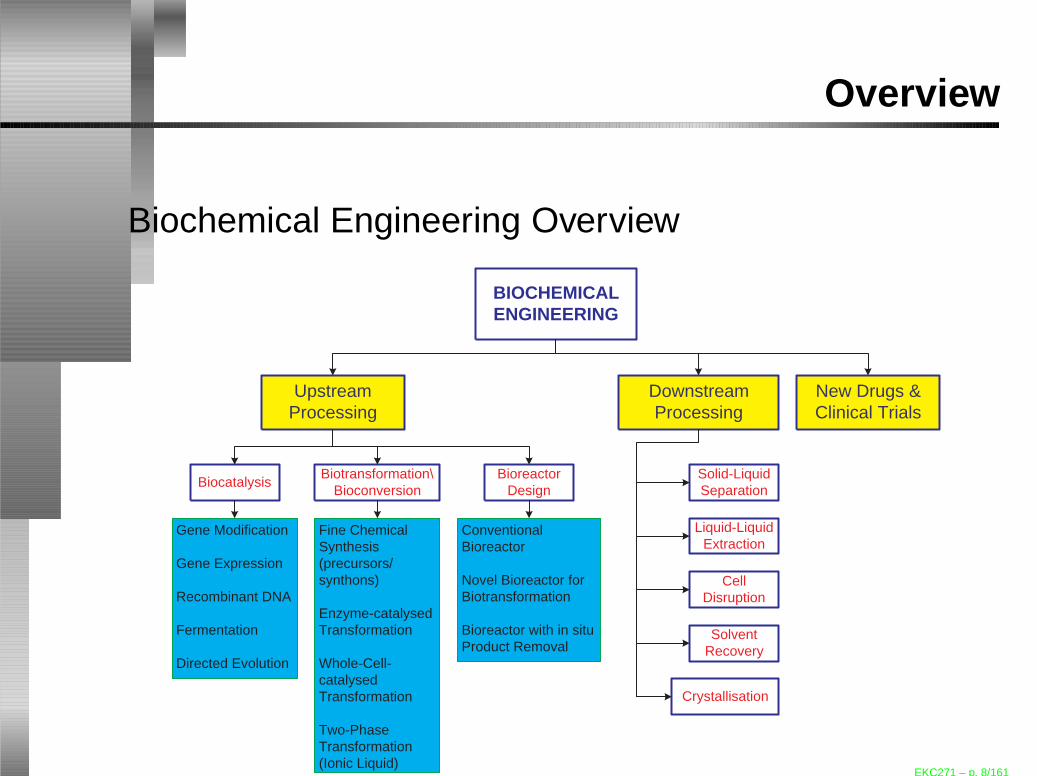
Biochemical Engineering Overview
BIOCHEMICAL ENGINEERING
Upstream Processing
Downstream Processing
New Drugs & Clinical Trials
Biocatalysis Biotransformation\
Bioconversion Bioreactor
Design
Gene Modification
Gene Expression
Recombinant DNA
Fermentation
Directed Evolution
Fine Chemical Synthesis (precursors/ synthons)
Enzyme-catalysed Transformation
Whole-Cell- catalysed Transformation
Two-Phase Transformation (Ionic Liquid)
Conventional Bioreactor
Novel Bioreactor for Biotransformation
Bioreactor with in situ Product Removal
Solid-Liquid Separation
Liquid-Liquid Extraction
Cell Disruption
Solvent Recovery
Crystallisation
EKC271 – p. 8/161

Sterilisation
Introduction• It differentiates a biochemical process from a
chemical process.• Pure bacterial (or any organisms) culture requires
a “contamination-free” environment to grow• Therefore, a container use to grow this organism
should be free from contaminants (eg.bacteria/fungi from other species)
EKC271 – p. 9/161

Sterilisation
• Fermentation can only proceed with the following:1. a microorganism2. a medium3. a fermenter4. nutrients (other additives)5. air, for aerobic process
EKC271 – p. 10/161
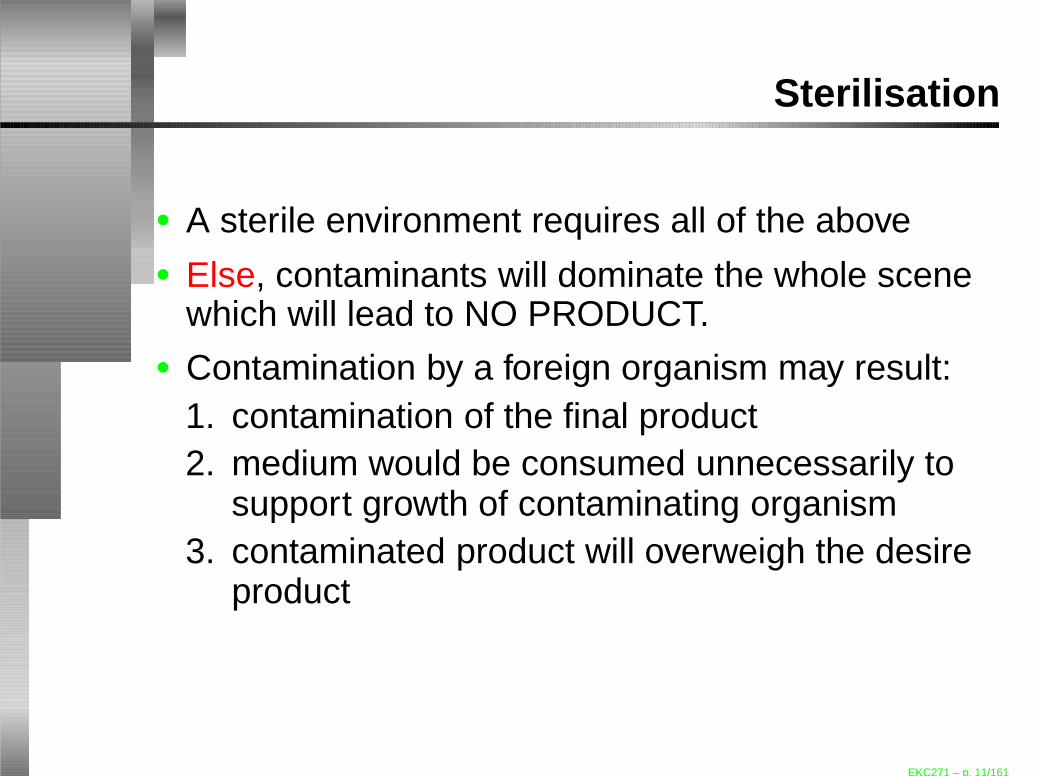
Sterilisation
• A sterile environment requires all of the above• Else, contaminants will dominate the whole scene
which will lead to NO PRODUCT.• Contamination by a foreign organism may result:
1. contamination of the final product2. medium would be consumed unnecessarily to
support growth of contaminating organism3. contaminated product will overweigh the desire
product
EKC271 – p. 11/161
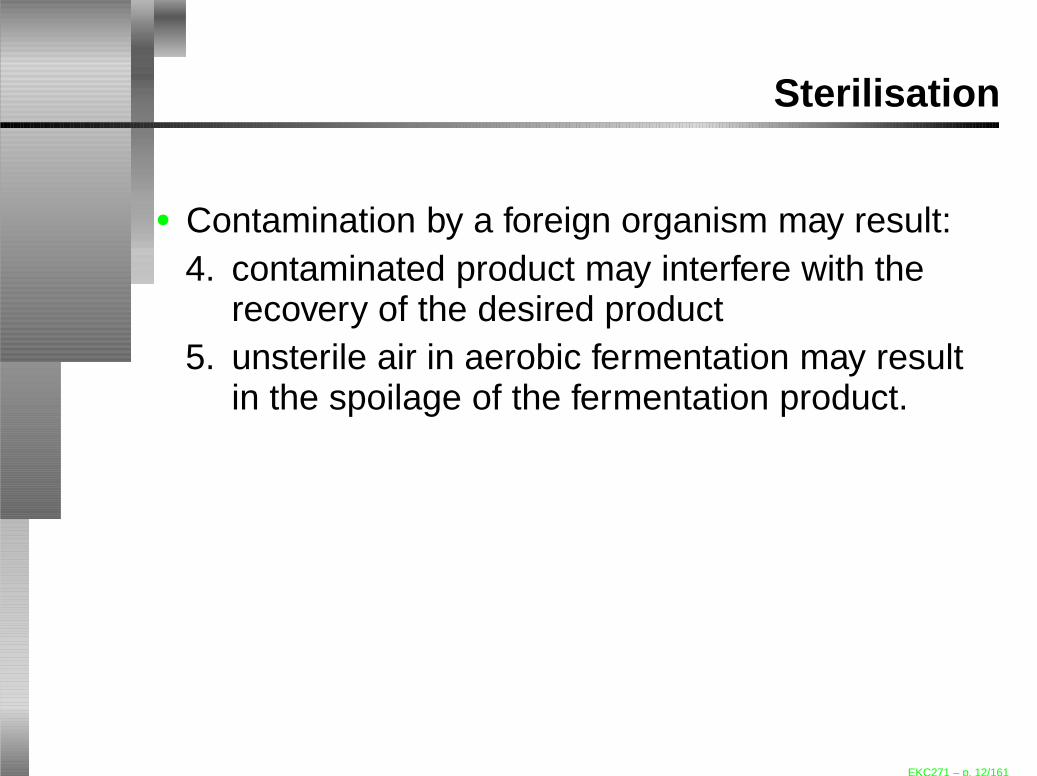
Sterilisation
• Contamination by a foreign organism may result:4. contaminated product may interfere with the
recovery of the desired product5. unsterile air in aerobic fermentation may result
in the spoilage of the fermentation product.
EKC271 – p. 12/161
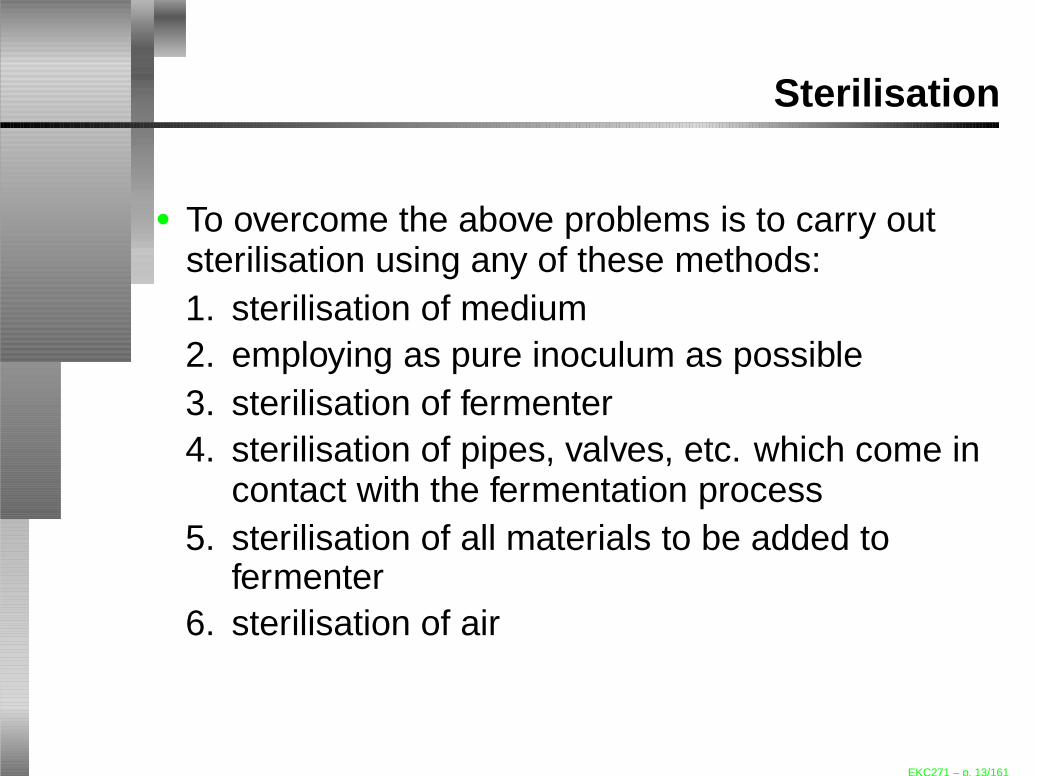
Sterilisation
• To overcome the above problems is to carry outsterilisation using any of these methods:1. sterilisation of medium2. employing as pure inoculum as possible3. sterilisation of fermenter4. sterilisation of pipes, valves, etc. which come in
contact with the fermentation process5. sterilisation of all materials to be added to
fermenter6. sterilisation of air
EKC271 – p. 13/161
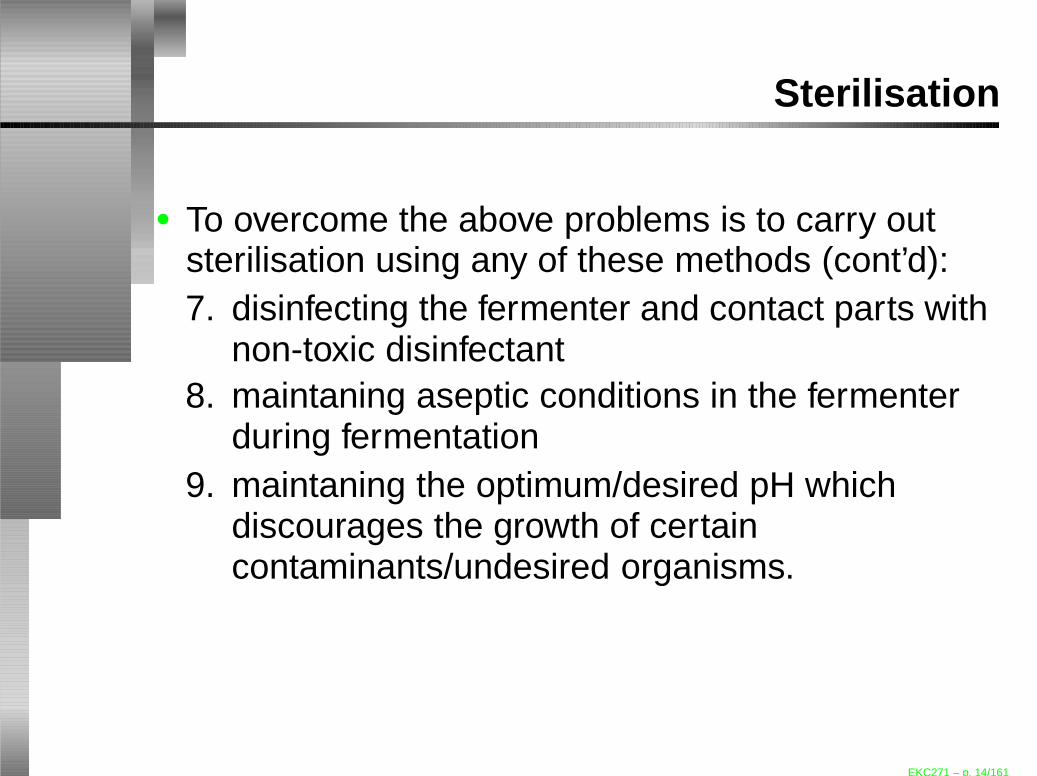
Sterilisation
• To overcome the above problems is to carry outsterilisation using any of these methods (cont’d):7. disinfecting the fermenter and contact parts with
non-toxic disinfectant8. maintaning aseptic conditions in the fermenter
during fermentation9. maintaning the optimum/desired pH which
discourages the growth of certaincontaminants/undesired organisms.
EKC271 – p. 14/161

Sterilisation
• Sterilisation can be carried out using:1. HEAT from the steam2. RADIATION from UV light3. CHEMICAL4. FILTRATION
EKC271 – p. 15/161

Sterilisation
Medium Sterilisation• Medium or media (singular) is an aqueous
component which consists of source of nutrientsand vitamins for bacterial growth.
• It should be free from any organisms before it canbe used for bacterial/fungi inoculation.
• Medium contamination can lead to:1. other type of organism to use the nutrients2. this can lead to changes in chemical structure
of the nutrients3. change in pH
EKC271 – p. 16/161
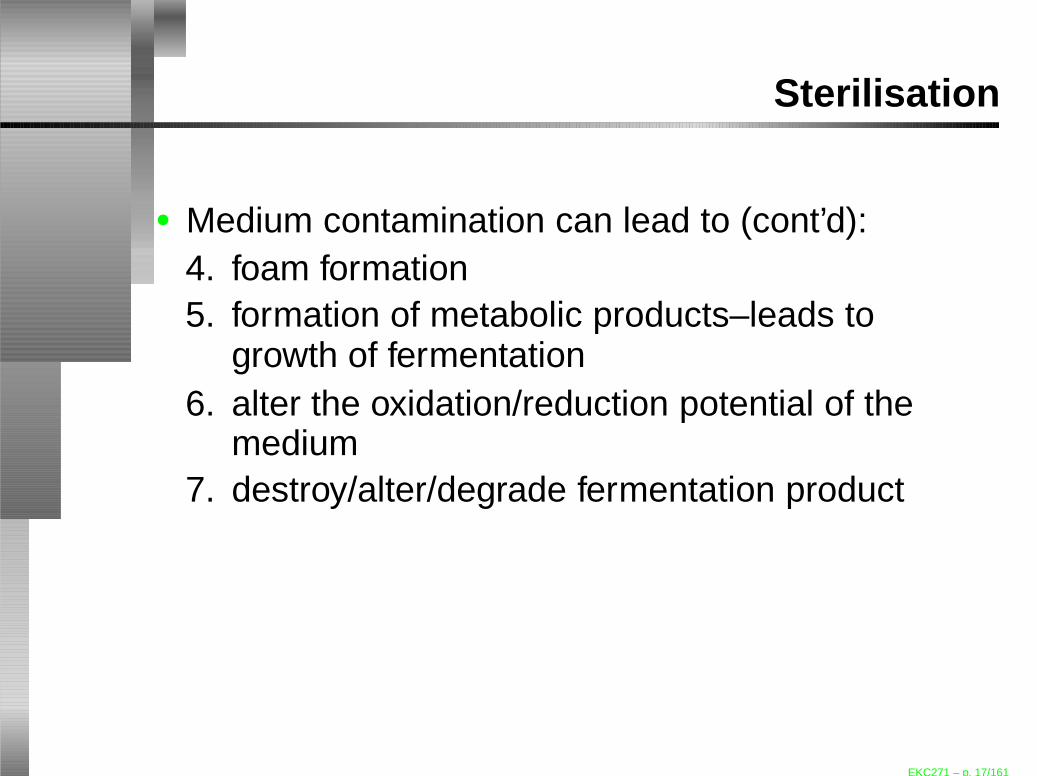
Sterilisation
• Medium contamination can lead to (cont’d):4. foam formation5. formation of metabolic products–leads to
growth of fermentation6. alter the oxidation/reduction potential of the
medium7. destroy/alter/degrade fermentation product
EKC271 – p. 17/161
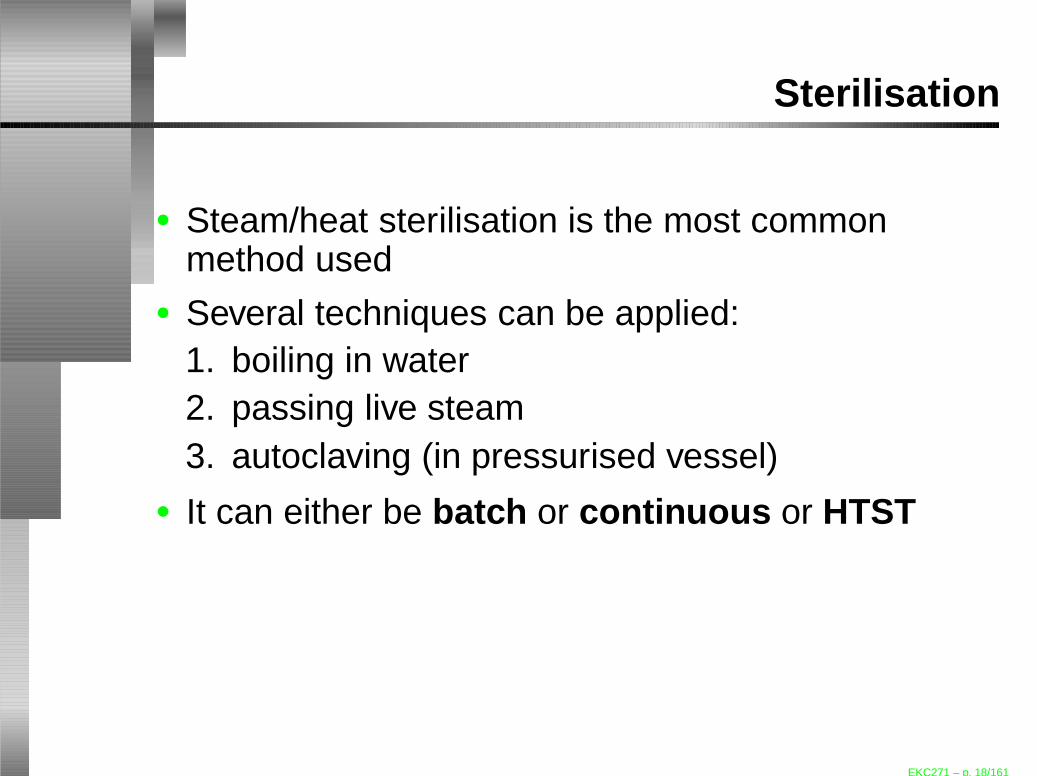
Sterilisation
• Steam/heat sterilisation is the most commonmethod used
• Several techniques can be applied:1. boiling in water2. passing live steam3. autoclaving (in pressurised vessel)
• It can either be batch or continuous or HTST
EKC271 – p. 18/161

Sterilisation
• Synthetic media–do not require much sterilisationcompared to crude media• synthetic–(or defined) is a type of medium
which consists of known chemicals component(phosphate, chloride, nitrate etc.)
• crude–(or complex such as Luria-Bertani (LB))is a type of nutrient which mainly consists ofunknown amount of nutrients. The mediumnormally contains yeast extract, peptone andglucose/glycerol.
• Synthetic media may require only a small amountof heating for sterilisation
EKC271 – p. 19/161

Sterilisation
• Crude media are likely to contain fungal sporesand sometimes traces of bacterial cells, therefore,requires prolong heating
• However, excessive heating may cause proteindenaturing or degrade the sugar
• pH should also be adjusted to neutrality (7.0)before sterilisation then adjust back to the requiredpH with pre-sterilised acid/alkali
• If special nutrient/vitamin is required during thefermentation, it can be filter-sterilised prior toinoculation
EKC271 – p. 20/161

Sterilisation
Thermal Death Kinetics of Microorganisms
• Thermal heatr̃ate of destruction of microbes bysteam/moist heat
• it is described as;
−dN
dt= kN (1)
EKC271 – p. 21/161
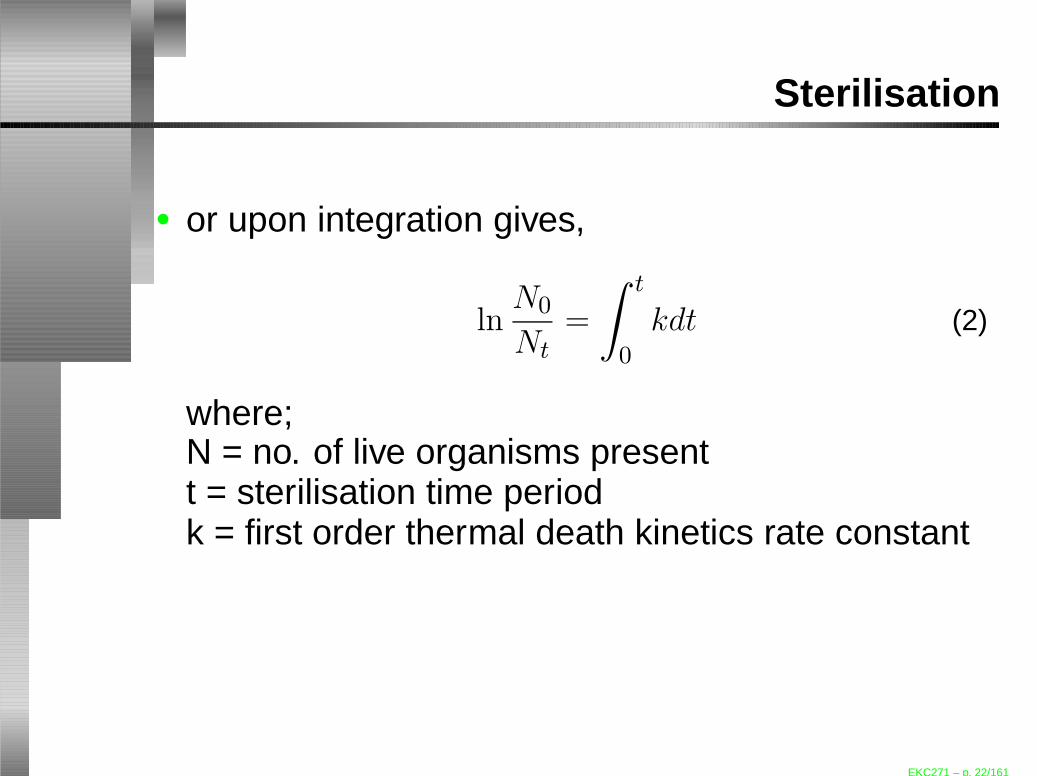
Sterilisation
• or upon integration gives,
lnN0
Nt=
∫ t
0
kdt (2)
where;N = no. of live organisms presentt = sterilisation time periodk = first order thermal death kinetics rate constant
EKC271 – p. 22/161
Sterilisation
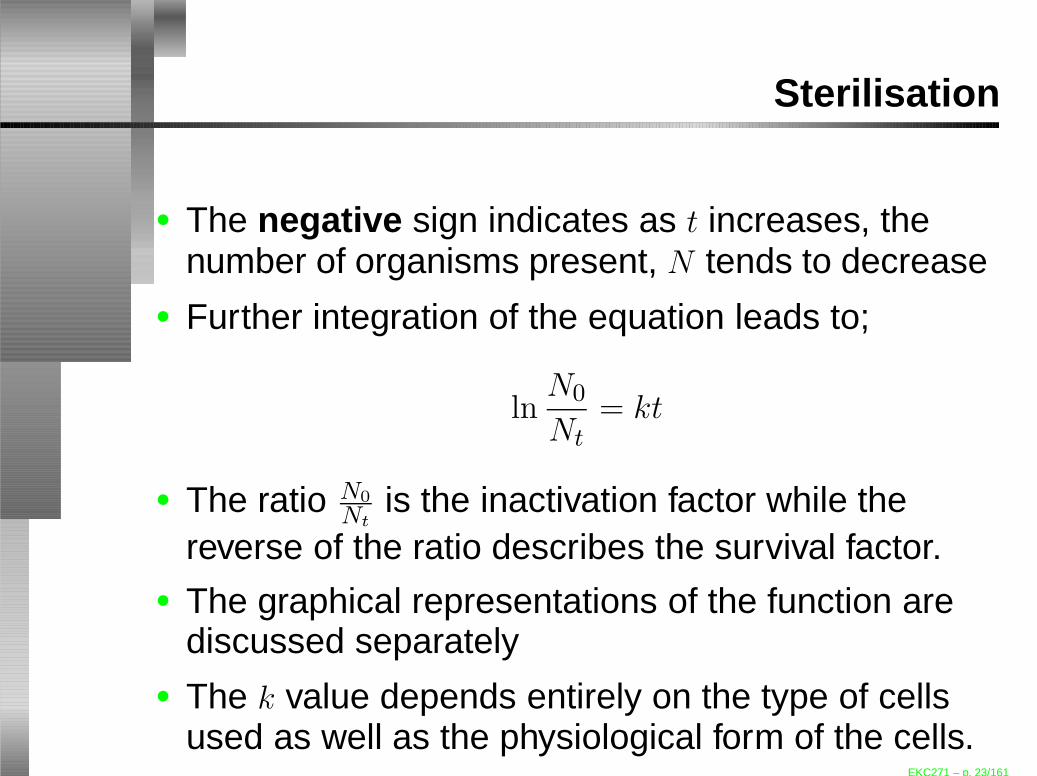
• The negative sign indicates as t increases, thenumber of organisms present, N tends to decrease
• Further integration of the equation leads to;
lnN0
Nt= kt
• The ratio N0
Ntis the inactivation factor while the
reverse of the ratio describes the survival factor.• The graphical representations of the function are
discussed separately• The k value depends entirely on the type of cells
used as well as the physiological form of the cells.EKC271 – p. 23/161
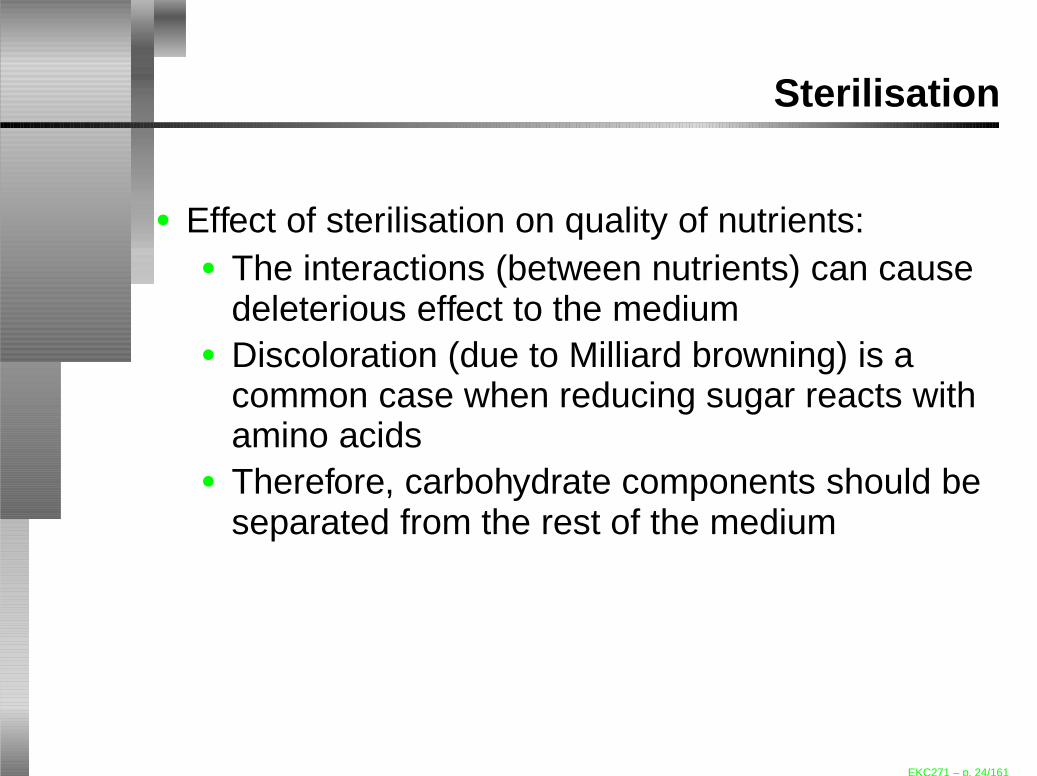
Sterilisation
• Effect of sterilisation on quality of nutrients:• The interactions (between nutrients) can cause
deleterious effect to the medium• Discoloration (due to Milliard browning) is a
common case when reducing sugar reacts withamino acids
• Therefore, carbohydrate components should beseparated from the rest of the medium
EKC271 – p. 24/161
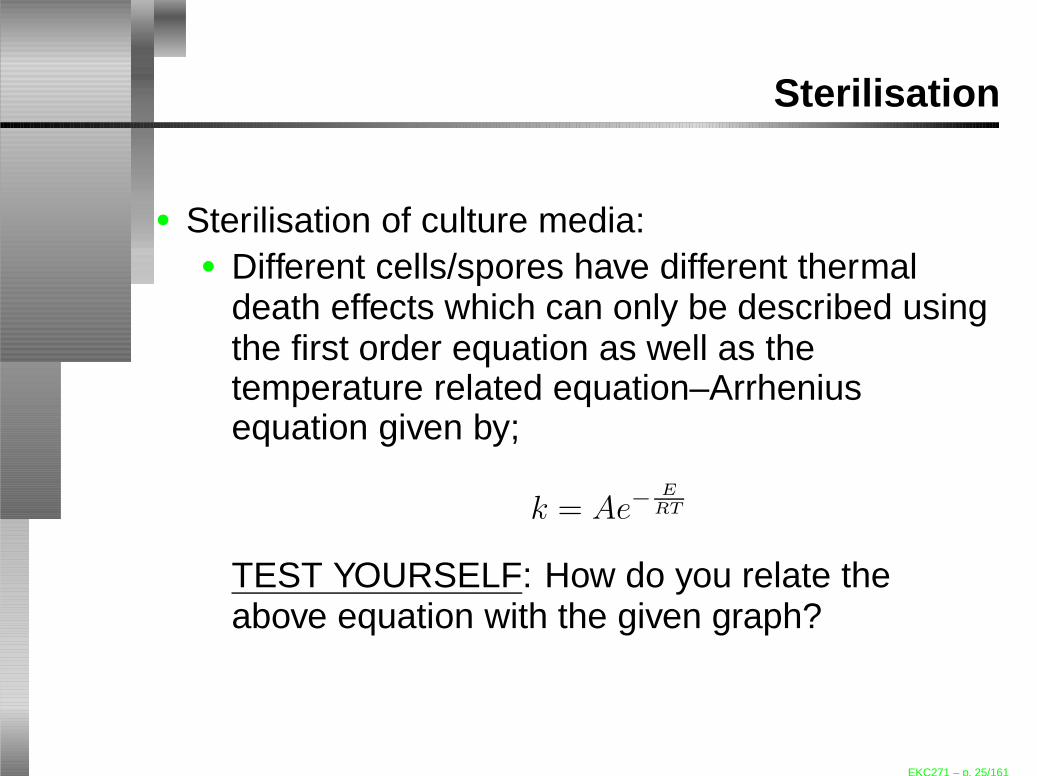
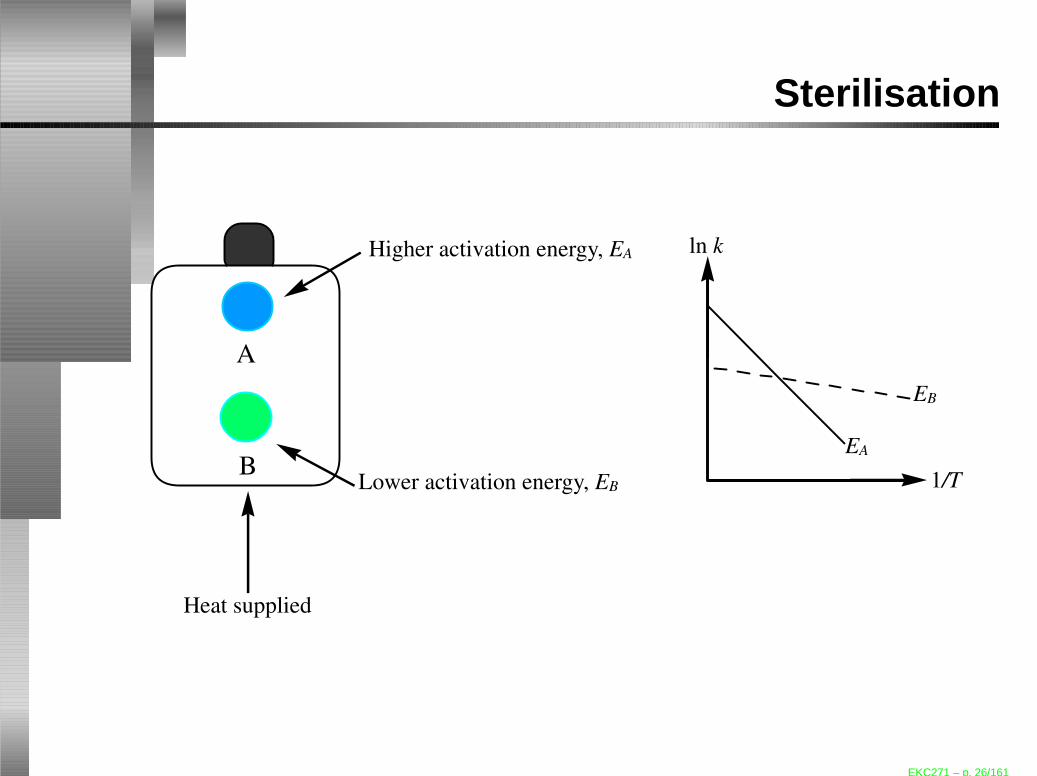
Sterilisation
• Sterilisation of culture media:• Different cells/spores have different thermal
death effects which can only be described usingthe first order equation as well as thetemperature related equation–Arrheniusequation given by;
k = Ae−ERT
TEST YOURSELF: How do you relate theabove equation with the given graph?
EKC271 – p. 25/161
Sterilisation
A
B
Heat supplied
Higher activation energy, EA
Lower activation energy, EB
ln k
1/T
EB
EA
EKC271 – p. 26/161
Sterilisation
• Sterilisation of culture media (cont’d):• Sterilisation of mixed cultures with different
sterilisation time–leads to different extents ofviable cells
• Consider a mixed culture, C which consists ofcultures A and B
• Using
lnN0
Nt= kt
⇒ lnNt − lnN0 = −kt
EKC271 – p. 27/161
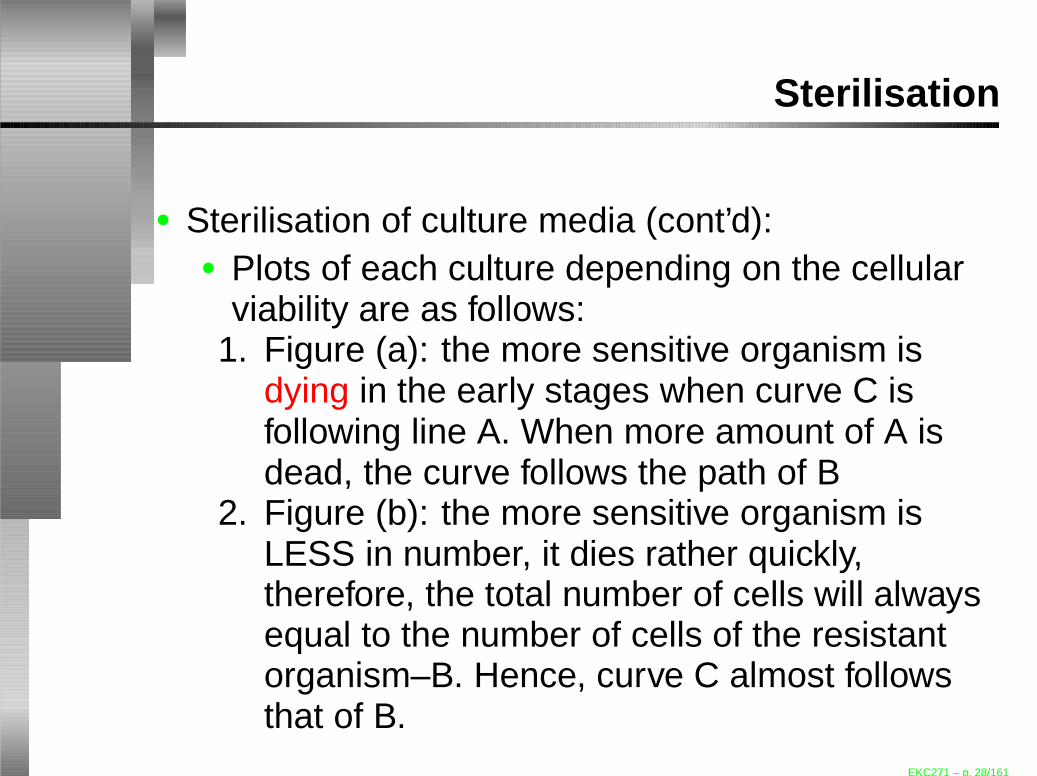
Sterilisation
• Sterilisation of culture media (cont’d):• Plots of each culture depending on the cellular
viability are as follows:1. Figure (a): the more sensitive organism is
dying in the early stages when curve C isfollowing line A. When more amount of A isdead, the curve follows the path of B
2. Figure (b): the more sensitive organism isLESS in number, it dies rather quickly,therefore, the total number of cells will alwaysequal to the number of cells of the resistantorganism–B. Hence, curve C almost followsthat of B.
EKC271 – p. 28/161
Sterilisation
B
C
A
Time
ln Nt
B
C
A
Time
ln Nt
B
(a) High propotion of sensitive culture A (b) High propotion of sensitive culture B
EKC271 – p. 29/161

Sterilisation
Batch Sterilisation• Sterilisation can be carried out in two different
configurations (i) batch and (ii) continuous• For a batch method–items to be sterilised are
loaded in a sterilizer (autoclave) and steam isinjected according to the desired programme andlater discharge upon completion for furtherutilisation
• It is the popular technique use in most biotechprocesses, however, it has ONEdisadvantage–destruction of nutrients
EKC271 – p. 30/161

Sterilisation
• The advantages include:• LOW initial cost of investment• LESS chances of contamination after
sterilisation–sterilisation can be carried out insame vessel/fermenter itself
• LESS mechanical failure–since the control iscarried out manually
• EASY handling of high proportion of solid media
EKC271 – p. 31/161

Sterilisation
• Design aspects:• The determination of whether a sterilisation is
complete or not can be related to Arrheniusequation;
k = AeERT
OR seldom written as;
d(ln k)
dT=
E
RT 2
which upon integration give a constant k0 whichlater equals to A, the Arrhenius constant.
EKC271 – p. 32/161

Sterilisation
• Design aspects (cont’d):• Using the equation, a set of experiments at
various temperatures and k is evaluated.• This is later combined with the thermal death
equation;
lnN0
Nt= kt
leads to;
lnN0
Nt= Ate−
ERT (3)
EKC271 – p. 33/161
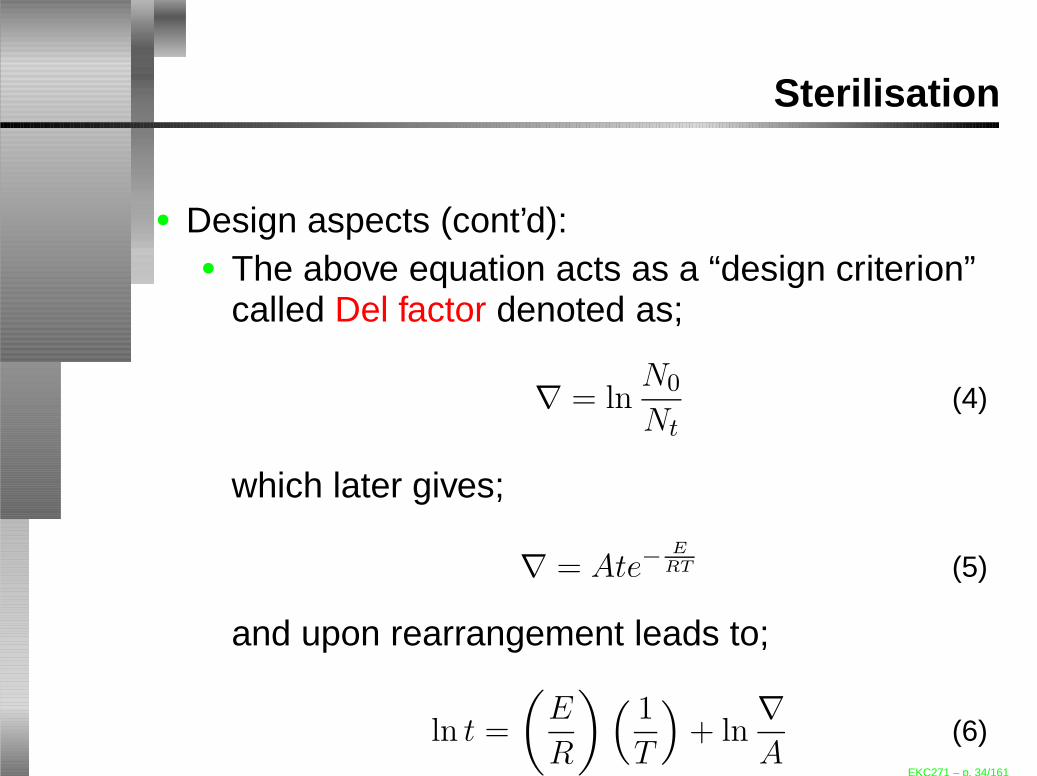
Sterilisation
• Design aspects (cont’d):• The above equation acts as a “design criterion”
called Del factor denoted as;
∇ = lnN0
Nt(4)
which later gives;
∇ = Ate−ERT (5)
and upon rearrangement leads to;
ln t =
(
E
R
)
(
1
T
)
+ ln∇
A(6)
EKC271 – p. 34/161
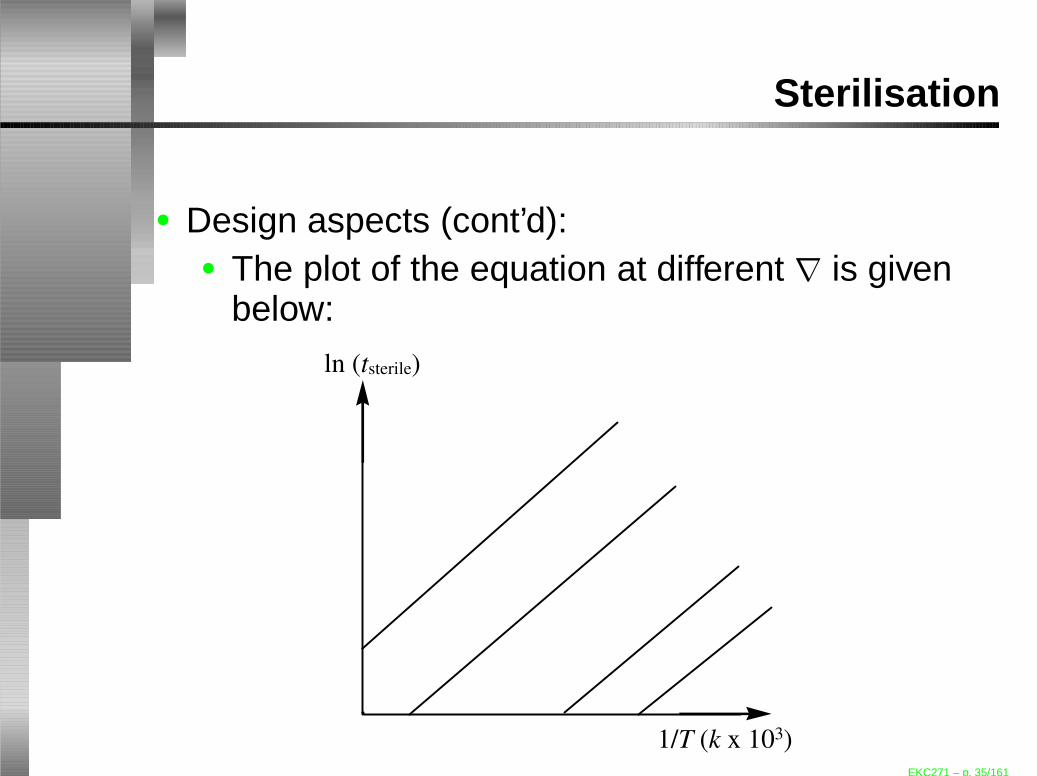
Sterilisation
• Design aspects (cont’d):• The plot of the equation at different ∇ is given
below:ln (tsterile)
1/T (k x 103)EKC271 – p. 35/161

Sterilisation
• Design aspects (cont’d):• Equation (6) acts as the design criterion called
the Del Factor• It is defined as the measure of fractional
reduction in living organisms count over theinitial number present
• The factor is based on certain heat and timeregime
• Consider the spores of Bacillusstearothermophilus which is the most heatresistant microorganism with• activation energy, E = 283 kJ/mol• Arrhenius constant, A = 1× 1036.2 s−1
EKC271 – p. 36/161
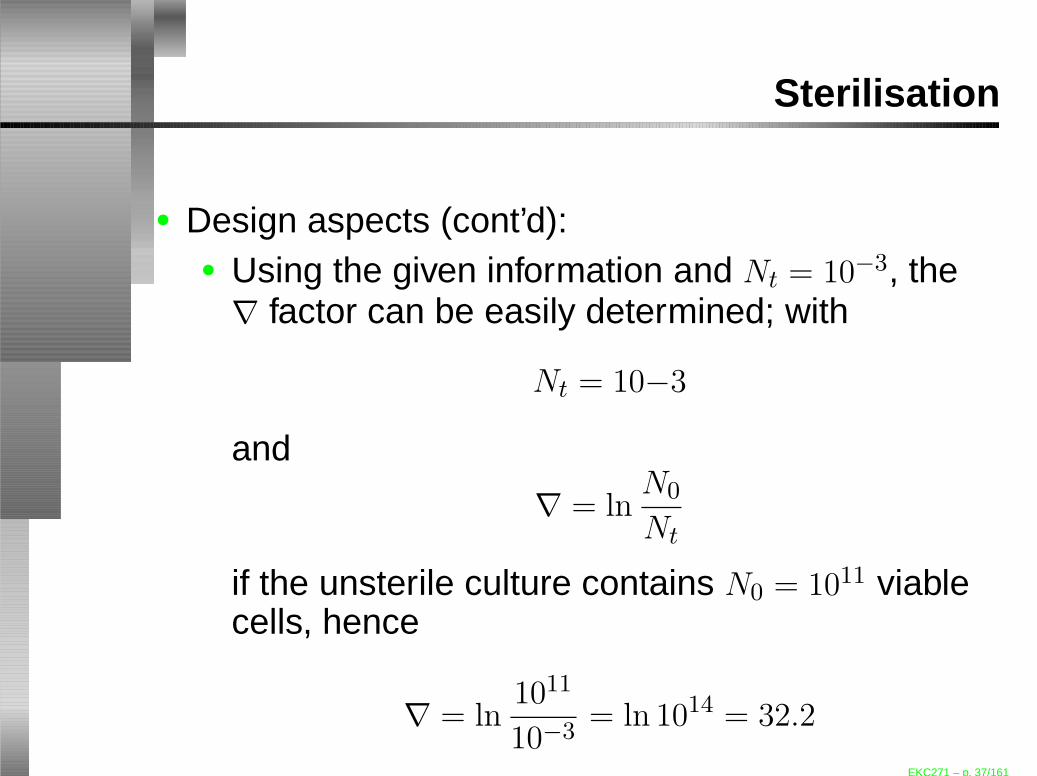
Sterilisation
• Design aspects (cont’d):• Using the given information and Nt = 10−3, the∇ factor can be easily determined; with
Nt = 10−3
and
∇ = lnN0
Nt
if the unsterile culture contains N0 = 1011 viablecells, hence
∇ = ln1011
10−3= ln 1014 = 32.2
EKC271 – p. 37/161
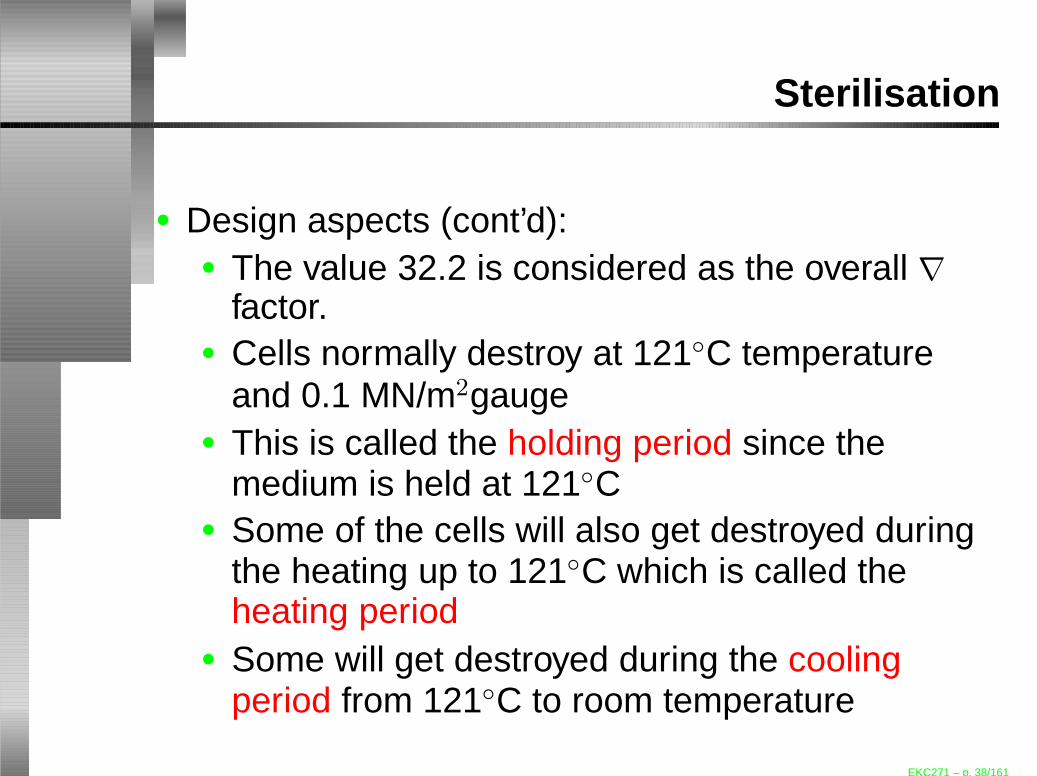
Sterilisation
• Design aspects (cont’d):• The value 32.2 is considered as the overall ∇
factor.• Cells normally destroy at 121◦C temperature
and 0.1 MN/m2gauge• This is called the holding period since the
medium is held at 121◦C• Some of the cells will also get destroyed during
the heating up to 121◦C which is called theheating period
• Some will get destroyed during the coolingperiod from 121◦C to room temperature
EKC271 – p. 38/161

Sterilisation
• Design aspects (cont’d):• This can be simplified into;
∇overall = ∇heating +∇holding +∇cooling
• ∇ factor during heating and cooling:• From Equation (6), it is obvious that when the
temperature increases, ∇ factor also increases• It is possible to get ∇ at any temperature ⇒
holding period• But temperature is not constant during
heating-up and cooling-down periods
EKC271 – p. 39/161

Sterilisation
• ∇ factor during heating and cooling (cont’d):• Using;
∇ = lnN0
Nt=
∫ t
0
kdt (7)
• With the above equation, the heating-up andcooling-down periods can be determined,provided the temperature and time is known
• However, it is highly unlikely to describe thefunction of t an T in the form of linear,hyperbolic or exponential
• Therefore, graphical integration is advisable
EKC271 – p. 40/161

Sterilisation
• ∇ factor during heating and cooling (cont’d):• An experiment to get a profile of temperature
w.r.t time is conducted• A graph of time, t against temprature, T is then
plotted• The temperature, T1 during a time, t1 is noted
as an average temperature at the beginning oft1 until the end of t1 i.e T1 is marked at themidpoint of t1
• Consider the culture of B. stearothermophiluswith Activation energy, E = 283 kJ/mol andArrhenius constant, A = 1× 1036.2 s−1
EKC271 – p. 41/161
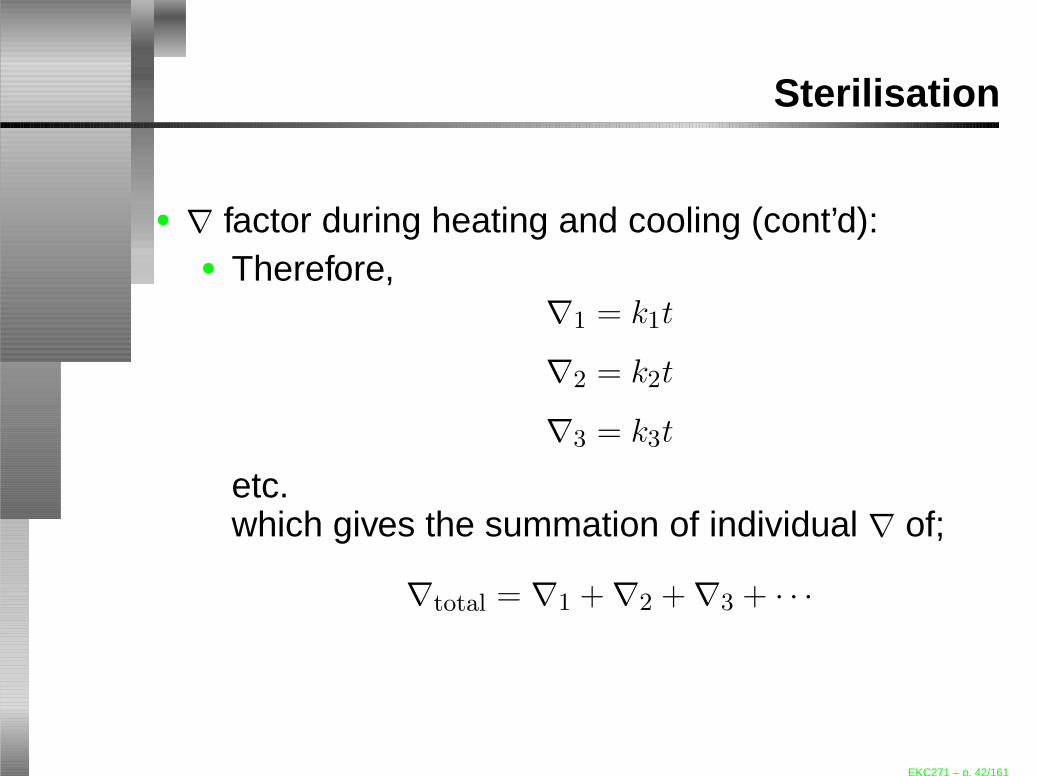
Sterilisation
• ∇ factor during heating and cooling (cont’d):• Therefore,
∇1 = k1t
∇2 = k2t
∇3 = k3t
etc.which gives the summation of individual ∇ of;
∇total = ∇1 +∇2 +∇3 + · · ·
EKC271 – p. 42/161

Sterilisation
• ∇ factor during heating and cooling (cont’d):• Hence,
∇heating =
n∑
i=1
∇i (8)
• Then ∇ at the given temperature can bedetermined by substituting in the Arrheniusequation
k = Ae−ERT
• A new graph can be plotted with Arrheniusvalues, k against time, t and the area under thegraph can be calculated
EKC271 – p. 43/161
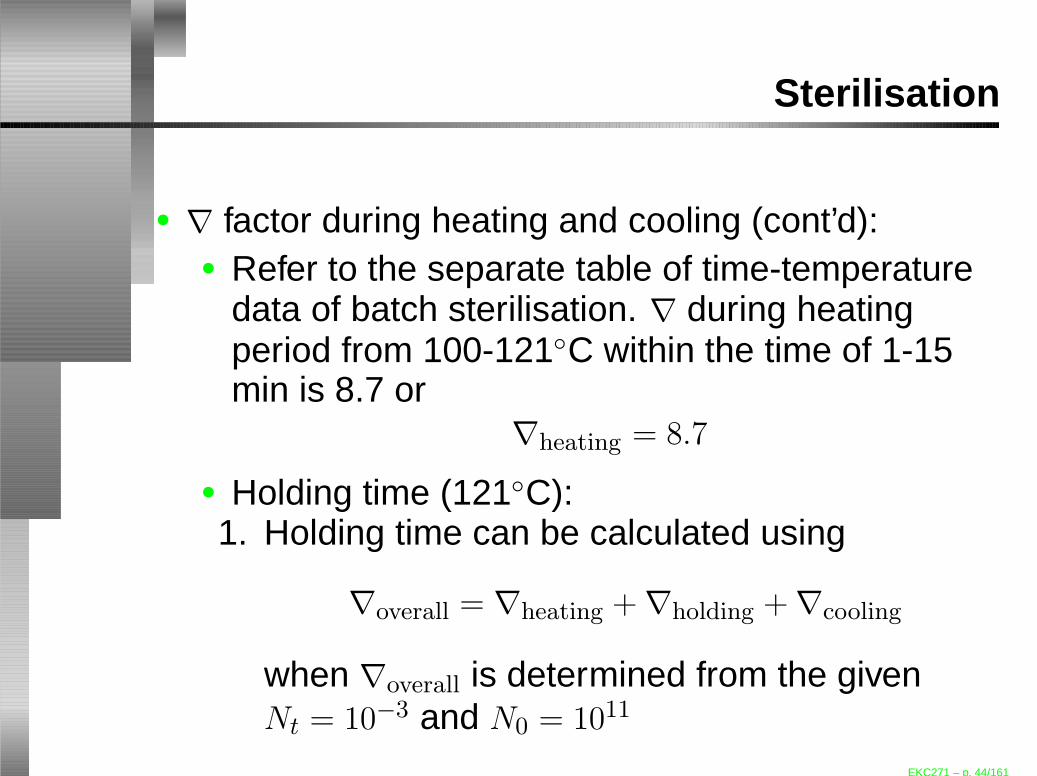
Sterilisation
• ∇ factor during heating and cooling (cont’d):• Refer to the separate table of time-temperature
data of batch sterilisation. ∇ during heatingperiod from 100-121◦C within the time of 1-15min is 8.7 or
∇heating = 8.7
• Holding time (121◦C):1. Holding time can be calculated using
∇overall = ∇heating +∇holding +∇cooling
when ∇overall is determined from the givenNt = 10−3 and N0 = 1011
EKC271 – p. 44/161
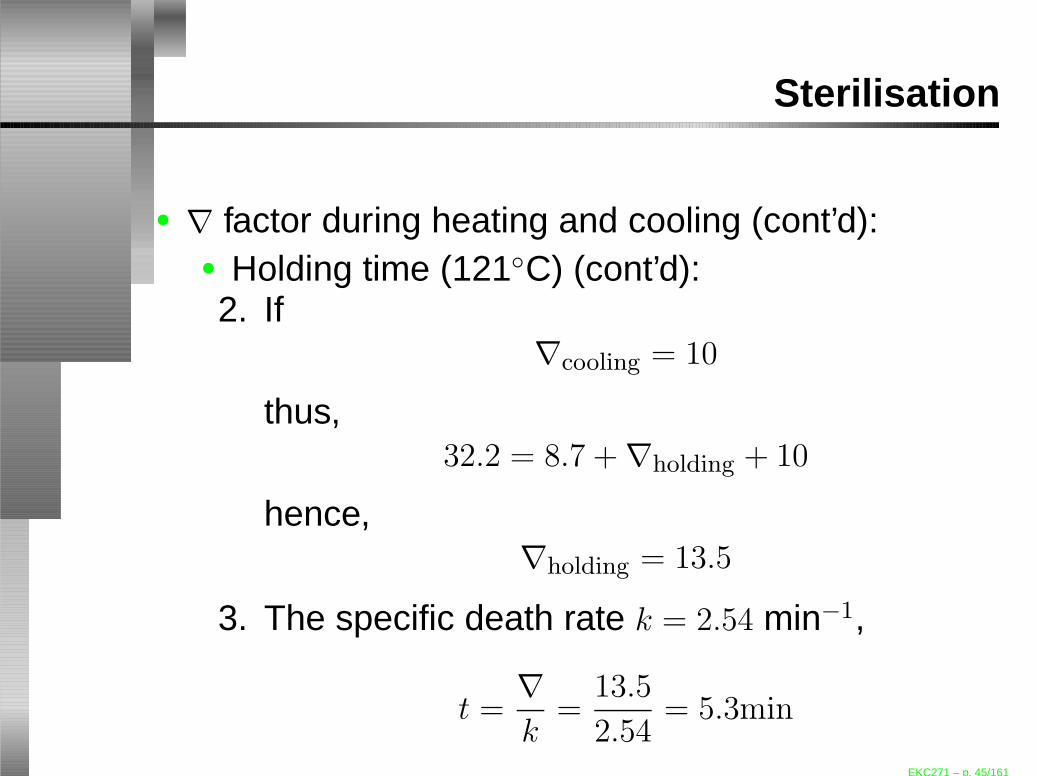
Sterilisation
• ∇ factor during heating and cooling (cont’d):• Holding time (121◦C) (cont’d):2. If
∇cooling = 10
thus,32.2 = 8.7 +∇holding + 10
hence,∇holding = 13.5
3. The specific death rate k = 2.54 min−1,
t =∇
k=
13.5
2.54= 5.3min
EKC271 – p. 45/161
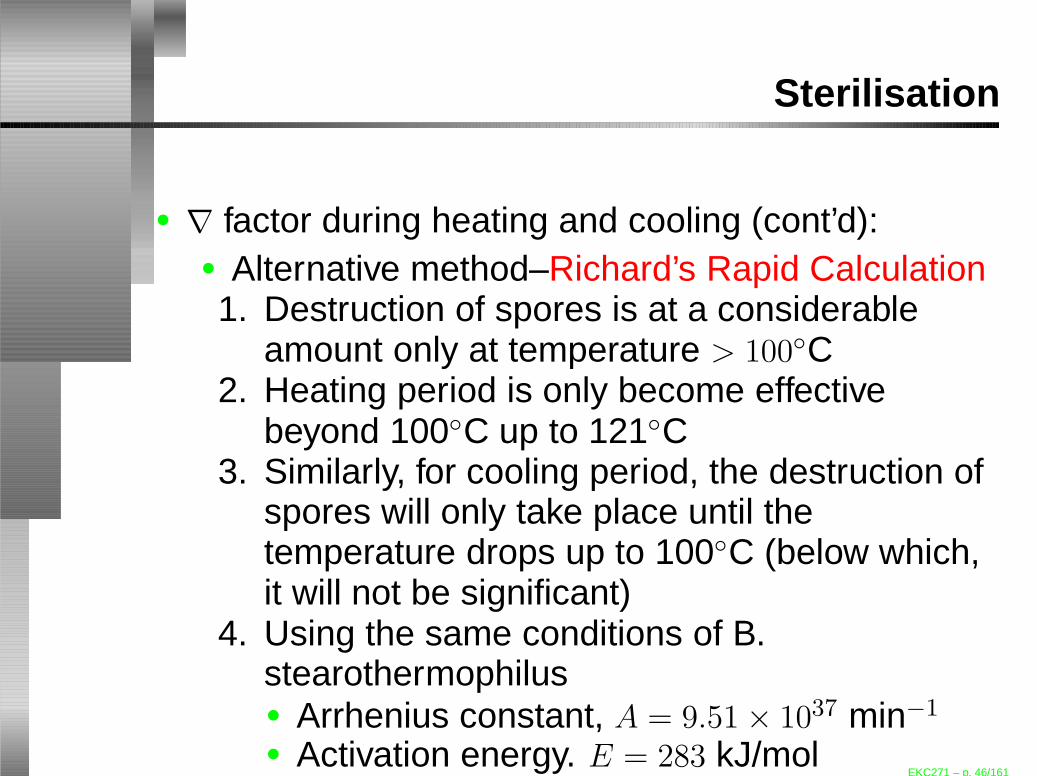
Sterilisation
• ∇ factor during heating and cooling (cont’d):• Alternative method–Richard’s Rapid Calculation1. Destruction of spores is at a considerable
amount only at temperature > 100◦C2. Heating period is only become effective
beyond 100◦C up to 121◦C3. Similarly, for cooling period, the destruction of
spores will only take place until thetemperature drops up to 100◦C (below which,it will not be significant)
4. Using the same conditions of B.stearothermophilus• Arrhenius constant, A = 9.51× 1037 min−1
• Activation energy. E = 283 kJ/molEKC271 – p. 46/161

Sterilisation
• ∇ factor during heating and cooling (cont’d):• Alternative method–Richard’s Rapid Calculation5. The ∇ factor at 100◦C is neglected and ∇ at
other temperatures are based on the value atthe previous temperature which occurred 1min earlier (since temp. raise is 1◦C/min)
∇(T ) = ∇(T−1) + k(T ) × 1.0
6. k(T ) is the thermal sterilisation occurred attemp. T in 1 min.
EKC271 – p. 47/161
Sterilisation
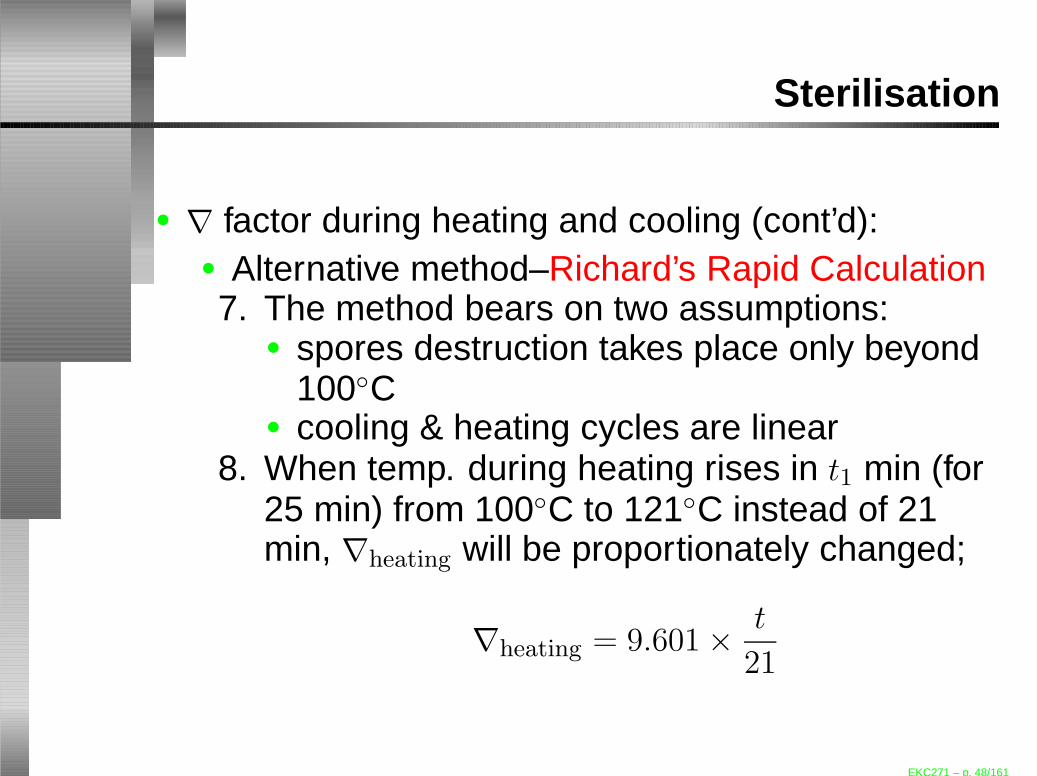
• ∇ factor during heating and cooling (cont’d):• Alternative method–Richard’s Rapid Calculation7. The method bears on two assumptions:
• spores destruction takes place only beyond100◦C
• cooling & heating cycles are linear8. When temp. during heating rises in t1 min (for
25 min) from 100◦C to 121◦C instead of 21min, ∇heating will be proportionately changed;
∇heating = 9.601×t
21
EKC271 – p. 48/161
Sterilisation
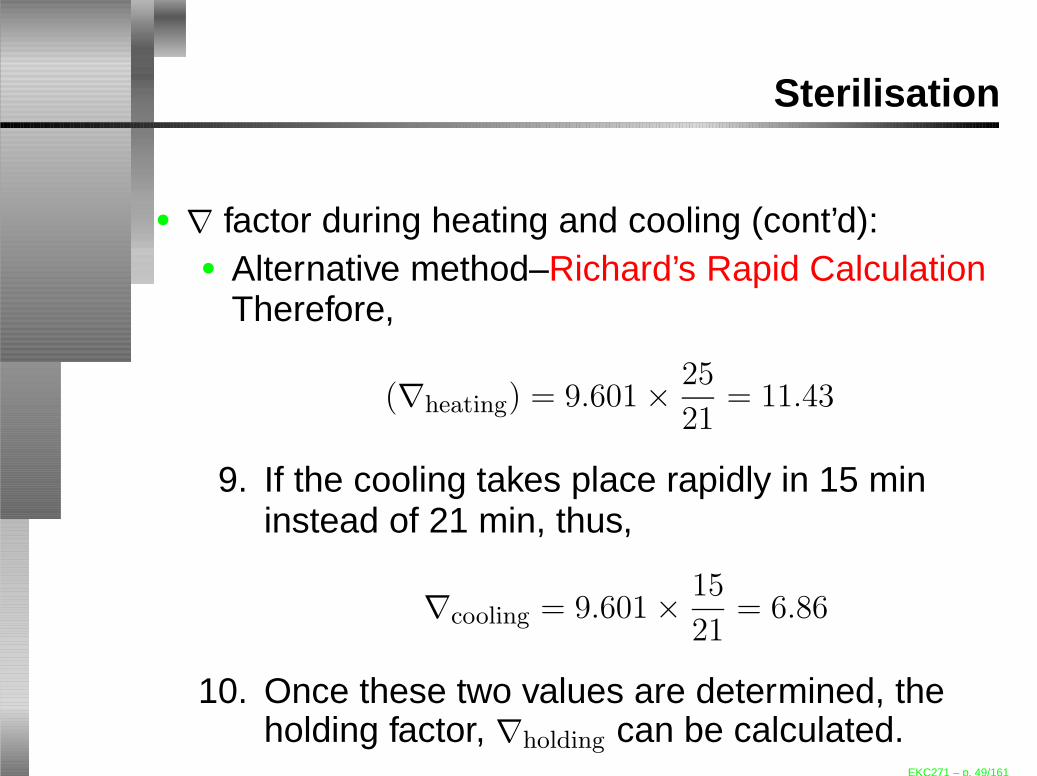
• ∇ factor during heating and cooling (cont’d):• Alternative method–Richard’s Rapid Calculation
Therefore,
(∇heating) = 9.601×25
21= 11.43
9. If the cooling takes place rapidly in 15 mininstead of 21 min, thus,
∇cooling = 9.601×15
21= 6.86
10. Once these two values are determined, theholding factor, ∇holding can be calculated.
EKC271 – p. 49/161

Sterilisation
Continuous Sterilisation• There will be continuous inflow and outflow of
material–best if capacity of operation is high• Advantages include:
1. capacity/throughput can be higher2. medium quality can be better maintained3. can be controlled (avoid human error)4. cost of running/operation–LESS5. short sterilisation time6. the only option for HTST operation7. holding capacity of steam–LESS8. ease in process scale-up
EKC271 – p. 50/161

Sterilisation
• Disadvantages include:1. HIGH initial capital investment2. aseptic transportation along the line
• Two method of continuous sterilisation:1. continuous plate heat exchange2. continuous steam injection and flash cooling
EKC271 – p. 51/161
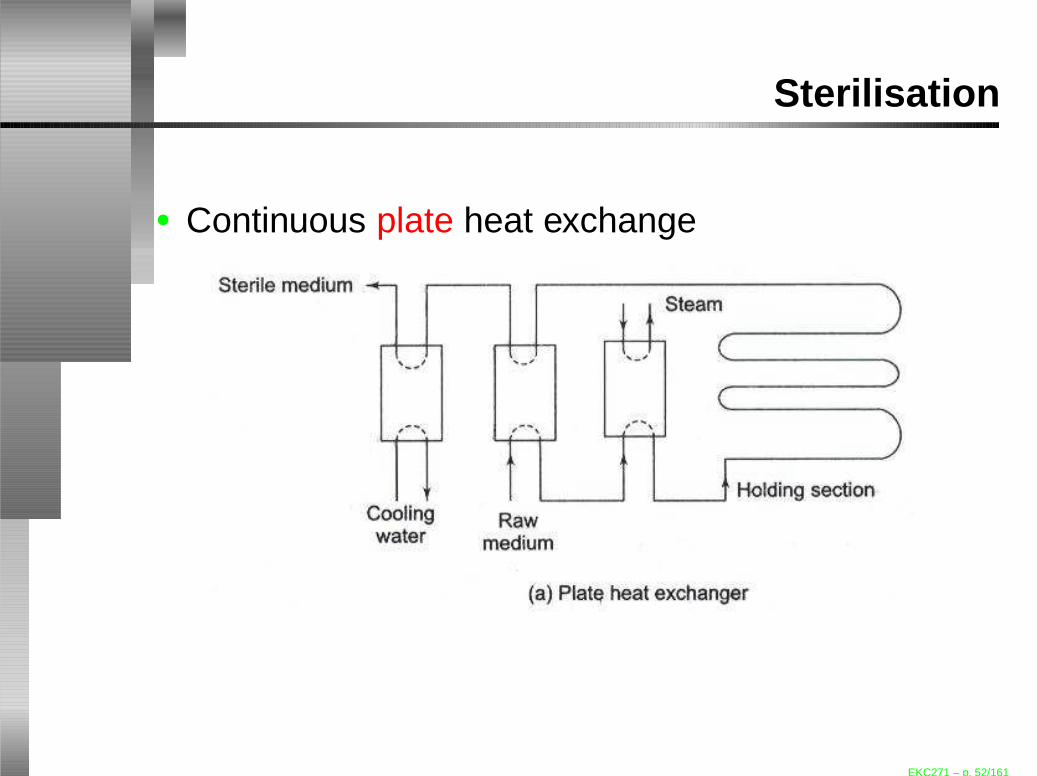
Sterilisation
• Continuous plate heat exchange
EKC271 – p. 52/161

Sterilisation
• For a continuous plate heat exchange1. Incoming unsterile medium is preheated by heat
exchanger with the outgoing sterile medium.2. Subsequently, it is heated with steam in the
heat exchanger and passed through the holdingsection
3. The holding section maintains the mediumaccording the required holding timerequirement, flow rate of medium and length ofholding section
EKC271 – p. 53/161

Sterilisation
• Continuous steam injection and flash cooling
EKC271 – p. 54/161

Sterilisation
• For a continuous steam injection and flash cooling1. Steam is directly and continuously injected
along with the medium2. Therefore, heating time and heating section are
negligible3. Holding time is based on the length of the
holding pipe–where sterilisation is taking place4. Steam and sterilised medium under
pressure–passed through the expansion valveinto vacuum chamber–steam is removed undervacuum
EKC271 – p. 55/161

Sterilisation
• For a continuous steam injection and flash cooling(cont’d)5. Sterile medium passes into preheat
exchanger–give out heat to the incomingunsterile medium which then passes throughthe cooling zone
EKC271 – p. 56/161
Sterilisation
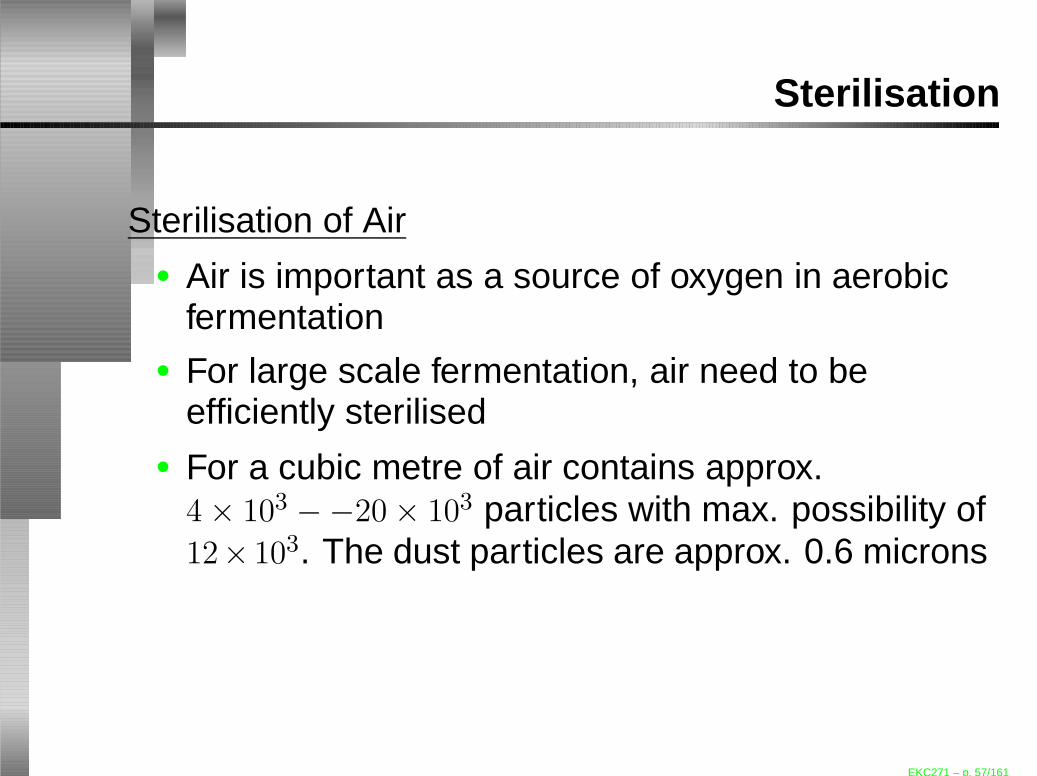
Sterilisation of Air• Air is important as a source of oxygen in aerobic
fermentation• For large scale fermentation, air need to be
efficiently sterilised• For a cubic metre of air contains approx.4× 103 −−20× 103 particles with max. possibility of12× 103. The dust particles are approx. 0.6 microns
EKC271 – p. 57/161
Sterilisation
• Methods of air sterilisation:1. Heating2. UV rays OR other electromagnetic waves3. germicidal spray4. by filtration
EKC271 – p. 58/161

Sterilisation
• Heating air is possible BUT not economical–due toits POOR thermophysical properties (lower heattransfer coeff.)
• UV ray is an effective technique in killing air-bornemicrobes–only applicable in small area
• Germicide can also reduce the amount of bacteriavia spraying with phenol, ethylene oxide orformalin–can sterile air in a small size room
EKC271 – p. 59/161
Sterilisation
• Filtration is an effective method and practical–filteris used to remove microorganisms form the airprovided that:• pores of a filter need to be smaller than the size
of microbes–absolute filters• pore size is bigger than the size of
microbes–fibrous filter (cotton, glass-wool, slag,steel-wool etc.)
EKC271 – p. 60/161

Sterilisation
• Theory of fibrous filter:• The mechanisms applied are: inertial
impaction, interception, diffusion, settling bygravitational force and electrostatic force
• The comparisons are tabulated and givenseparately
EKC271 – p. 61/161
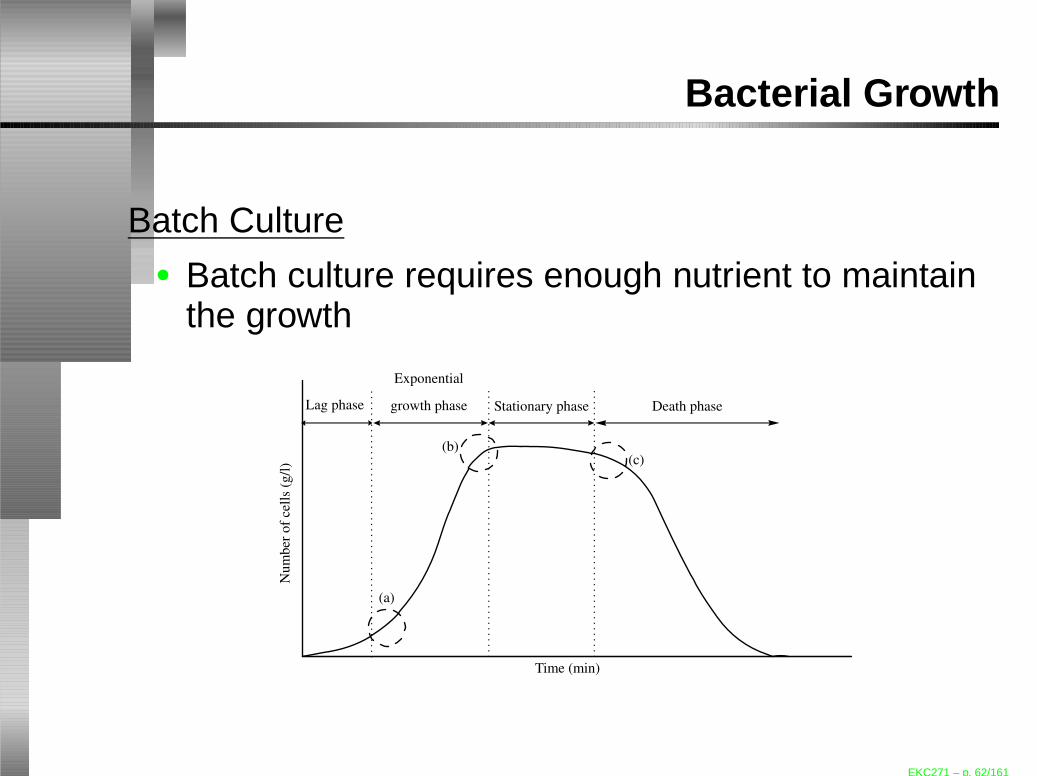
Bacterial Growth
Batch Culture• Batch culture requires enough nutrient to maintain
the growth
Lag phase
Exponential
growth phase Stationary phase Death phase
Nu
mb
er o
f ce
lls
(g/l
)
Time (min)
(a)
(c)(b)
EKC271 – p. 62/161
Bacterial Growth
• The figure shows an increase of cell at the start ofthe cultivation (fermentation) process
• Due to the presence of enough nutrient for the cellto grow
• The amount of nutrient decreases as it beingconsumed by the cell.
• Other side products such as carbon dioxide orethanol is also formed simultaneously.
EKC271 – p. 63/161

Bacterial Growth
• In batch cultures, the cell properties such as;• size of cells• internal nutrient• metabolic function
vary considerably during the above growth phases.• No apparent increase of the amount of cell at the
start of cultivation, this is termed as the lag phase .
EKC271 – p. 64/161
Bacterial Growth
• After this period (can be between 10 to 15 mins)the number of cells increases exponentially thus,this stage is called the exponential growthphase ;• the cell properties tend to be constant• last for a short period of time
• The next stage is the stationary phase where thepopulation of cell achieves it maximum number.This is because:• all nutrient in the closed system has been used
up by the cell.• lack of nutrient will eventually stop the cell from
multiplying.EKC271 – p. 65/161
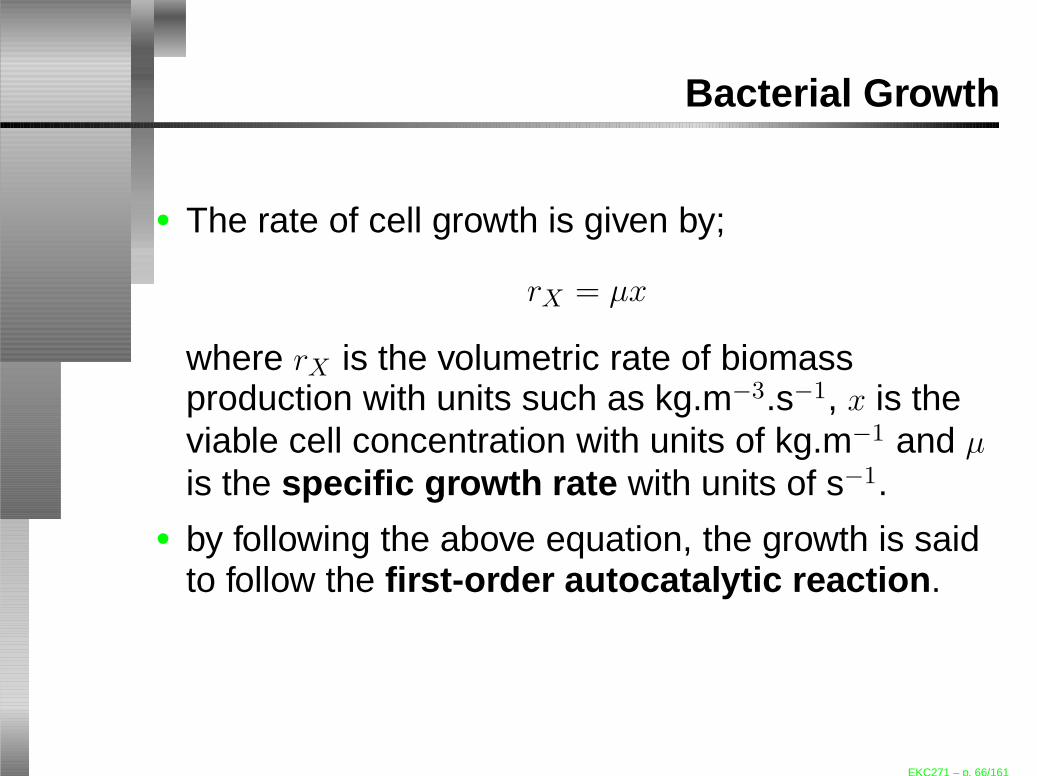
Bacterial Growth
• The rate of cell growth is given by;
rX = µx
where rX is the volumetric rate of biomassproduction with units such as kg.m−3.s−1, x is theviable cell concentration with units of kg.m−1 and µ
is the specific growth rate with units of s−1.• by following the above equation, the growth is said
to follow the first-order autocatalytic reaction .
EKC271 – p. 66/161
Bacterial Growth
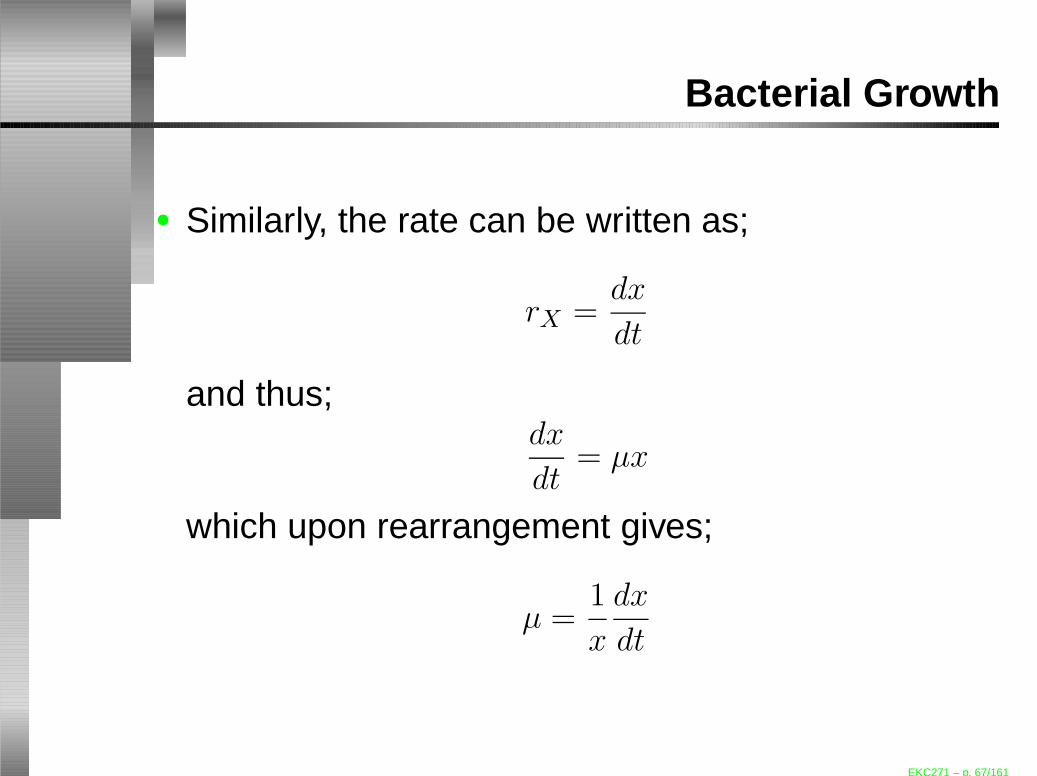
• Similarly, the rate can be written as;
rX =dx
dt
and thus;dx
dt= µx
which upon rearrangement gives;
µ =1
x
dx
dt
EKC271 – p. 67/161
Bacterial Growth
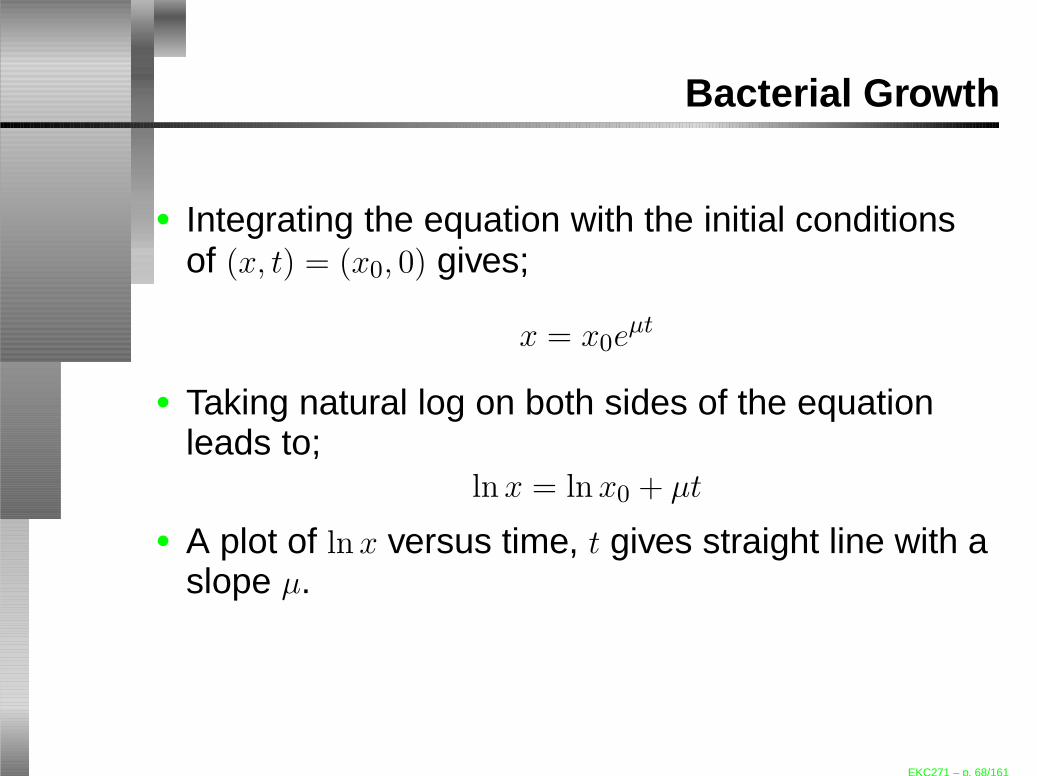
• Integrating the equation with the initial conditionsof (x, t) = (x0, 0) gives;
x = x0eµt
• Taking natural log on both sides of the equationleads to;
ln x = ln x0 + µt
• A plot of ln x versus time, t gives straight line with aslope µ.
EKC271 – p. 68/161
Bacterial Growth
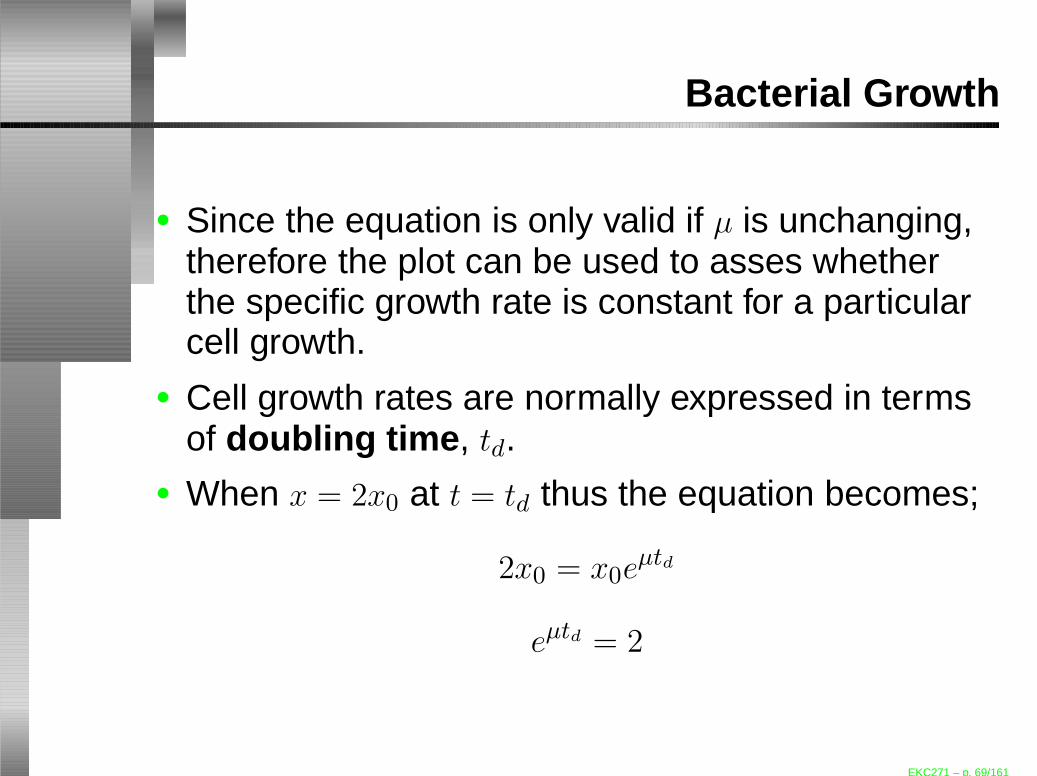
• Since the equation is only valid if µ is unchanging,therefore the plot can be used to asses whetherthe specific growth rate is constant for a particularcell growth.
• Cell growth rates are normally expressed in termsof doubling time , td.
• When x = 2x0 at t = td thus the equation becomes;
2x0 = x0eµtd
eµtd = 2
EKC271 – p. 69/161
Bacterial Growth
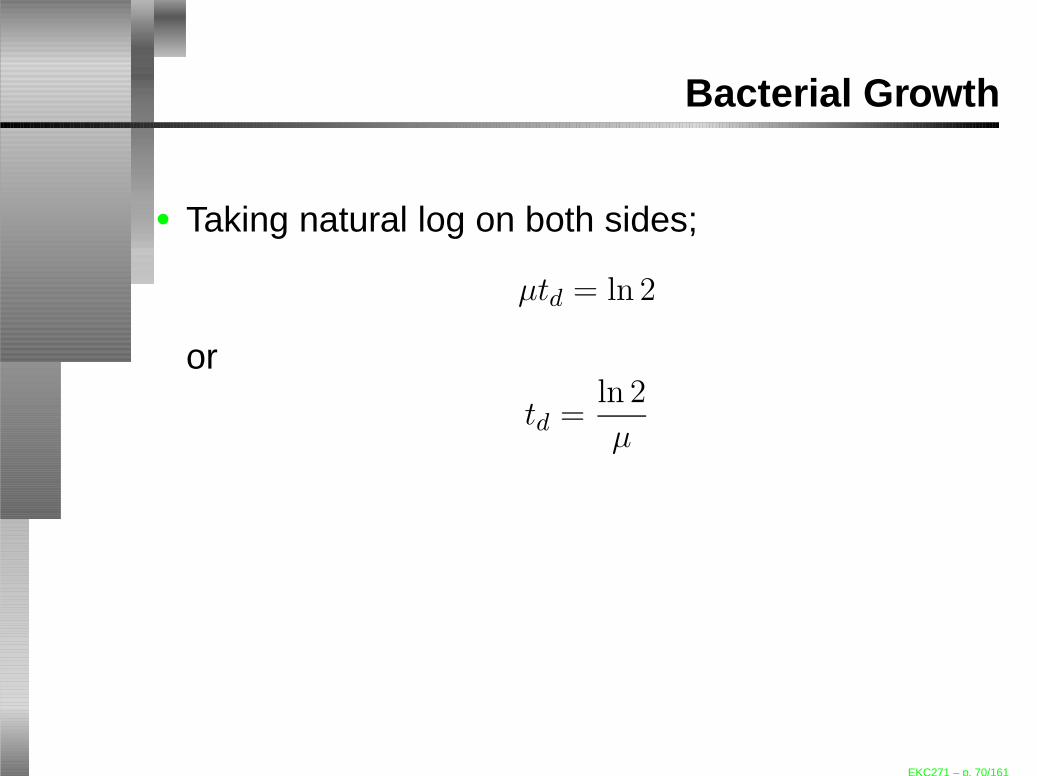
• Taking natural log on both sides;
µtd = ln 2
or
td =ln 2
µ
EKC271 – p. 70/161
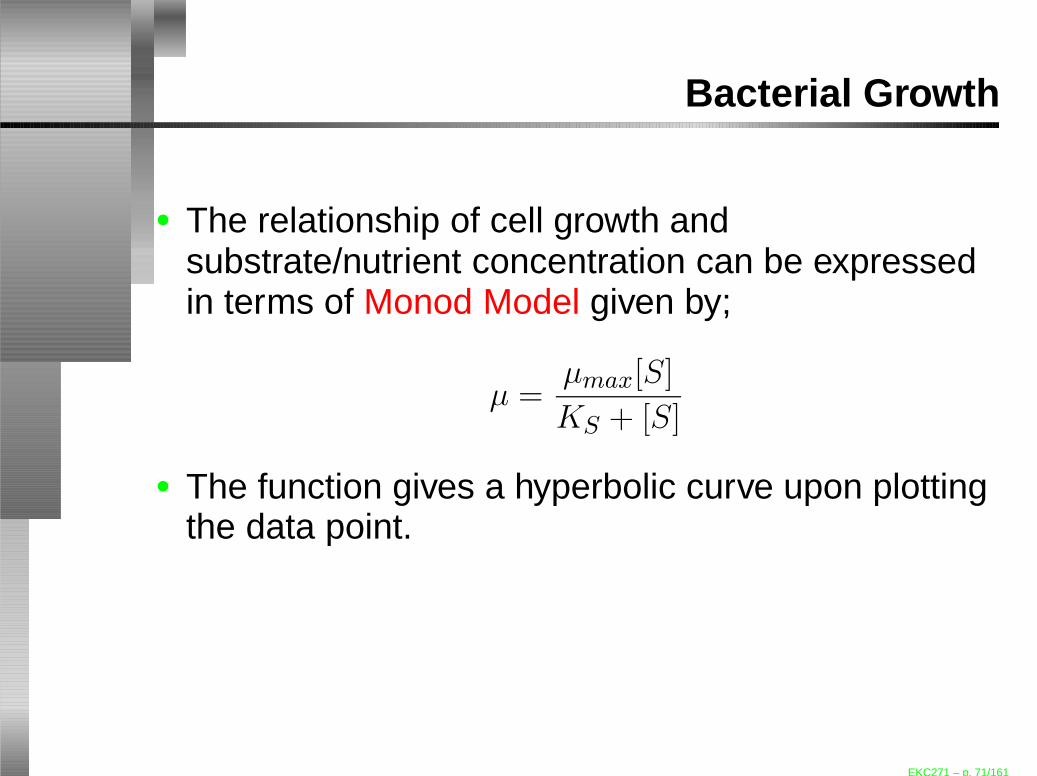
Bacterial Growth
• The relationship of cell growth andsubstrate/nutrient concentration can be expressedin terms of Monod Model given by;
µ =µmax[S]
KS + [S]
• The function gives a hyperbolic curve upon plottingthe data point.
EKC271 – p. 71/161

Bacterial Growth
• The final stage of cell cultivation is the deathphase . The decrease of the number of cell occursexponentially which happens when the cell breaksopen (lysed).
• The rate of death normally follows the first-orderkinetics given by;
dN
dt= −k
′
dN
EKC271 – p. 72/161
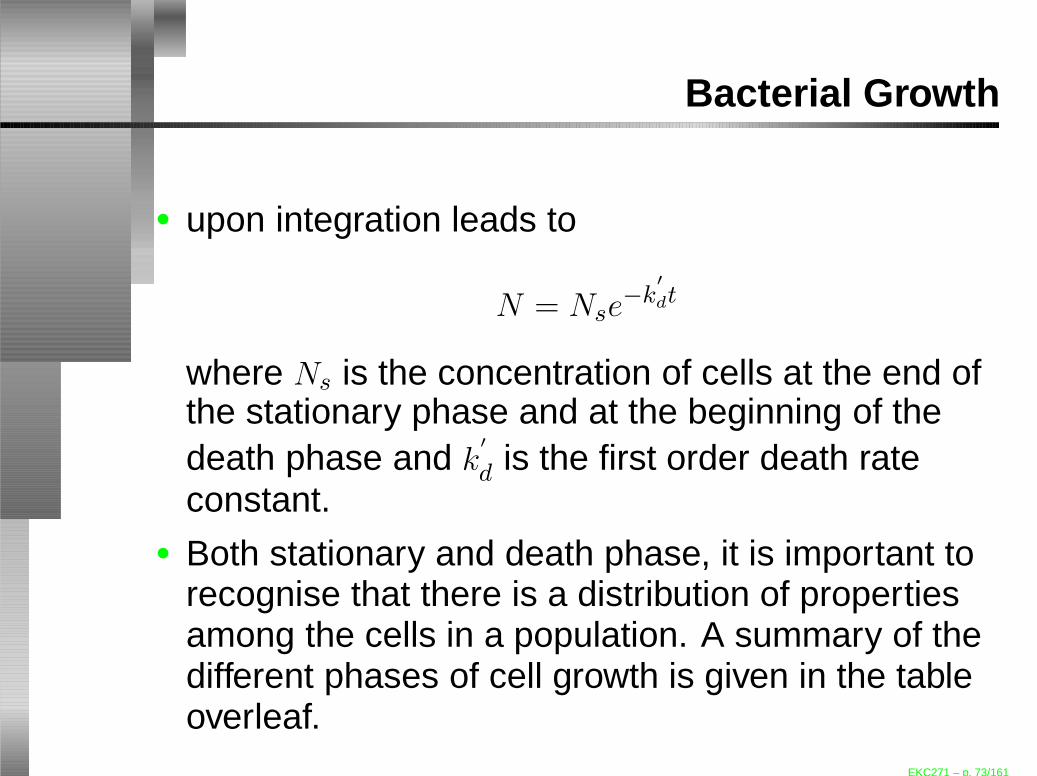
Bacterial Growth
• upon integration leads to
N = Nse−k
′
dt
where Ns is the concentration of cells at the end ofthe stationary phase and at the beginning of thedeath phase and k
′
d is the first order death rateconstant.
• Both stationary and death phase, it is important torecognise that there is a distribution of propertiesamong the cells in a population. A summary of thedifferent phases of cell growth is given in the tableoverleaf.
EKC271 – p. 73/161
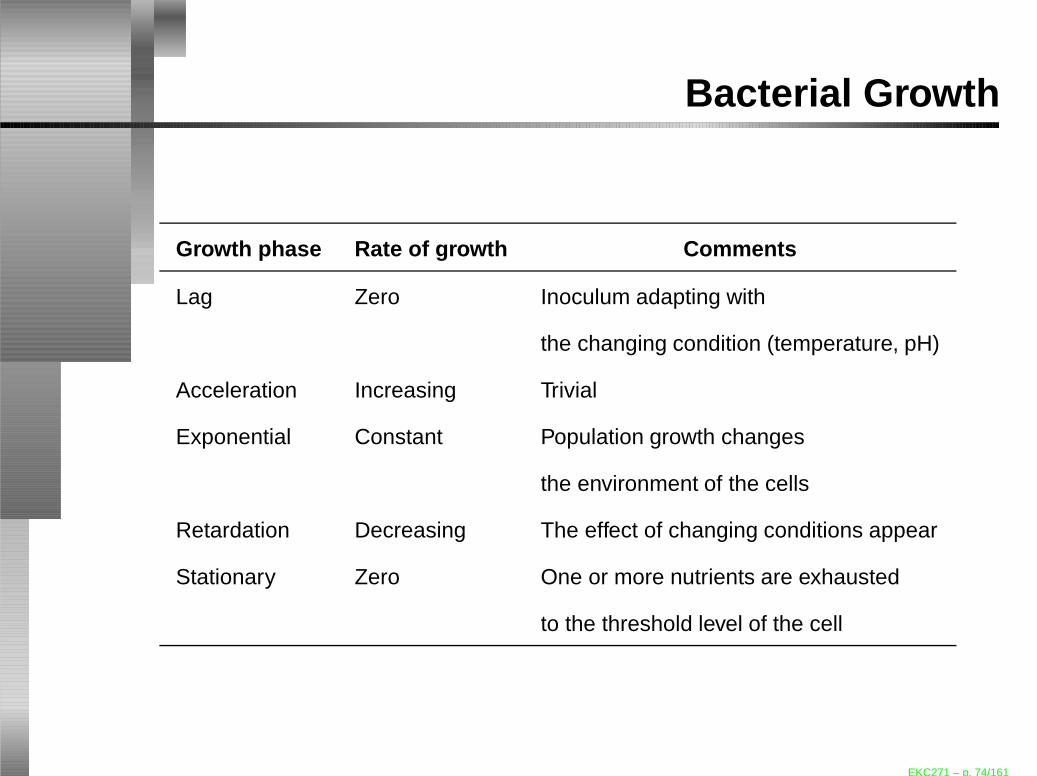
Bacterial Growth
Growth phase Rate of growth Comments
Lag Zero Inoculum adapting with
the changing condition (temperature, pH)
Acceleration Increasing Trivial
Exponential Constant Population growth changes
the environment of the cells
Retardation Decreasing The effect of changing conditions appear
Stationary Zero One or more nutrients are exhausted
to the threshold level of the cell
EKC271 – p. 74/161
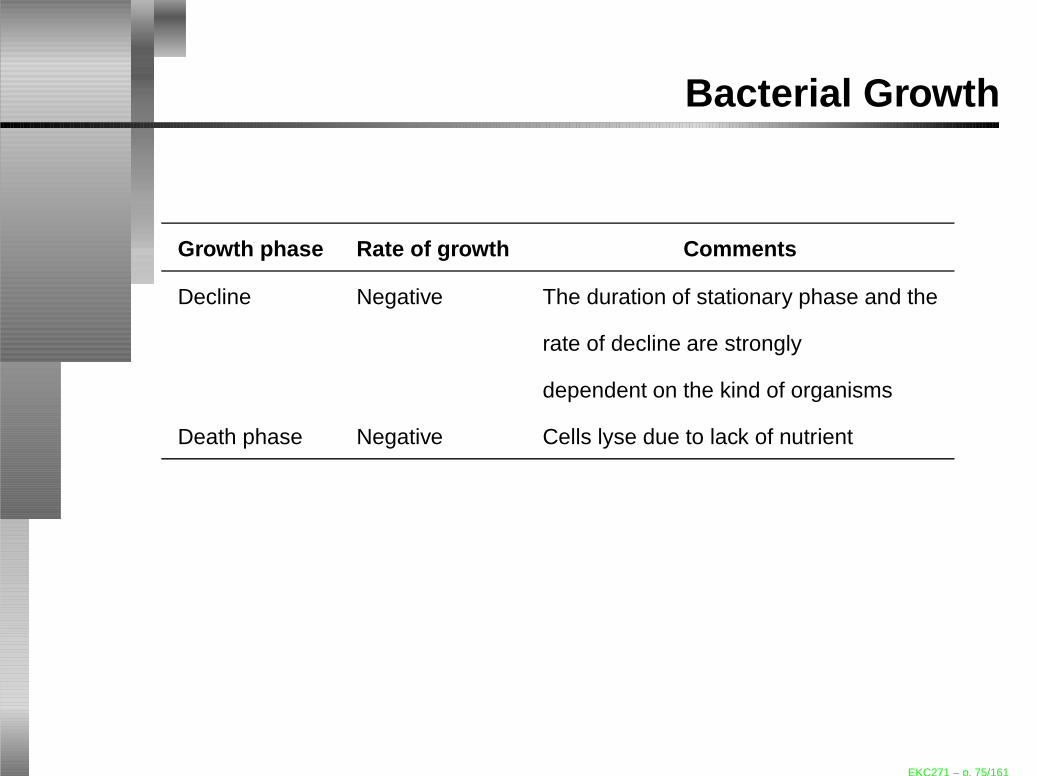
Bacterial Growth
Growth phase Rate of growth Comments
Decline Negative The duration of stationary phase and the
rate of decline are strongly
dependent on the kind of organisms
Death phase Negative Cells lyse due to lack of nutrient
EKC271 – p. 75/161

Bacterial Growth
• The balance of a batch reactor is given by the rateof accumulation of product equals to the rate offormation of the product due to chemical reactionor can be simply written as;
d
dt(VR · c) = VR · r
dc
dt= r (9)
where c is the amount of the component and r isthe reaction rate. VR in the first line of the equationis the total volume of the culture in the reactor.
EKC271 – p. 76/161

Bacterial Growth
V
Sterile air or
oxygen
EKC271 – p. 77/161

Bacterial Growth
• The balance of a batch reactor is given by the rateof accumulation of product equals to the rate offormation of the product due to chemical reactionor can be simply written as;
d
dt(VR · c) = VR · r
dc
dt= r (10)
where c is the amount of the component and r isthe reaction rate. VR in the first line of the equationis the total volume of the culture in the reactor.
EKC271 – p. 78/161

Bacterial Growth
Continuous Culture• In a continuous culture system, nutrients are
supplied to the cell at a constant rate.• To maintain a constant volume of biomass in the
reactor, an equal volume of cell culture is removed.• This will allow the cell population to reach a
steady-state condition.• The reactor configuration of a continuous process
is given overleaf.
EKC271 – p. 79/161

Bacterial Growth
Nutrient Inlet
Biomass Outlet
V
Sterile air or
oxygen
EKC271 – p. 80/161
Bacterial Growth
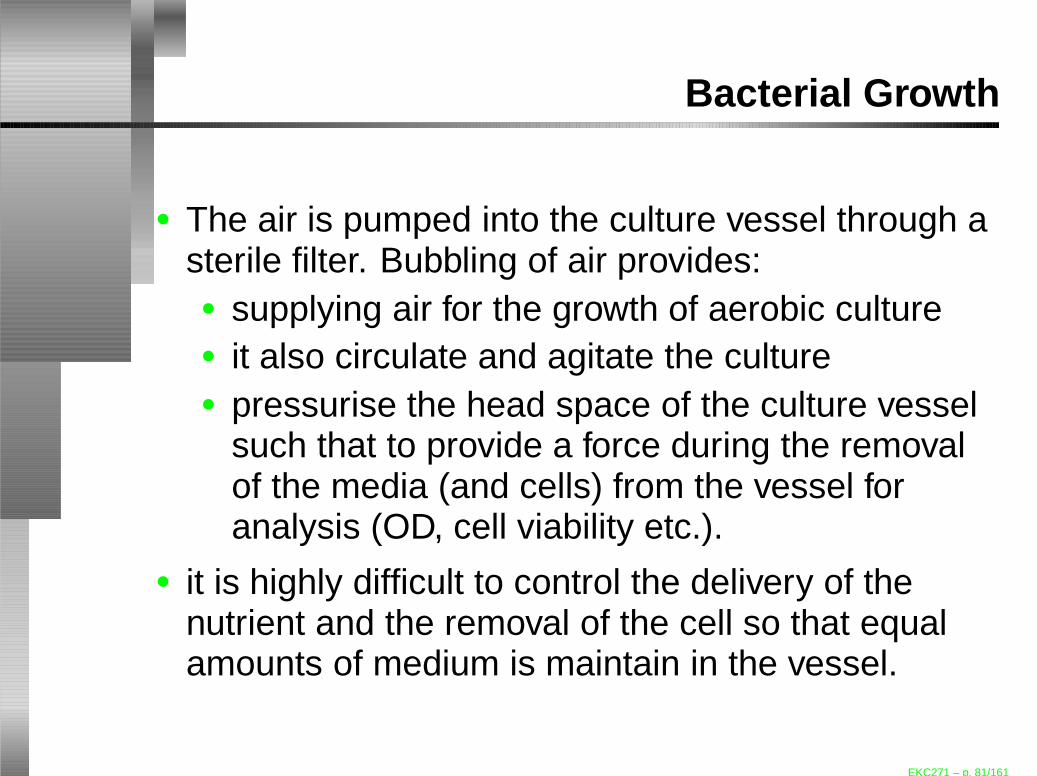
• The air is pumped into the culture vessel through asterile filter. Bubbling of air provides:• supplying air for the growth of aerobic culture• it also circulate and agitate the culture• pressurise the head space of the culture vessel
such that to provide a force during the removalof the media (and cells) from the vessel foranalysis (OD, cell viability etc.).
• it is highly difficult to control the delivery of thenutrient and the removal of the cell so that equalamounts of medium is maintain in the vessel.
EKC271 – p. 81/161
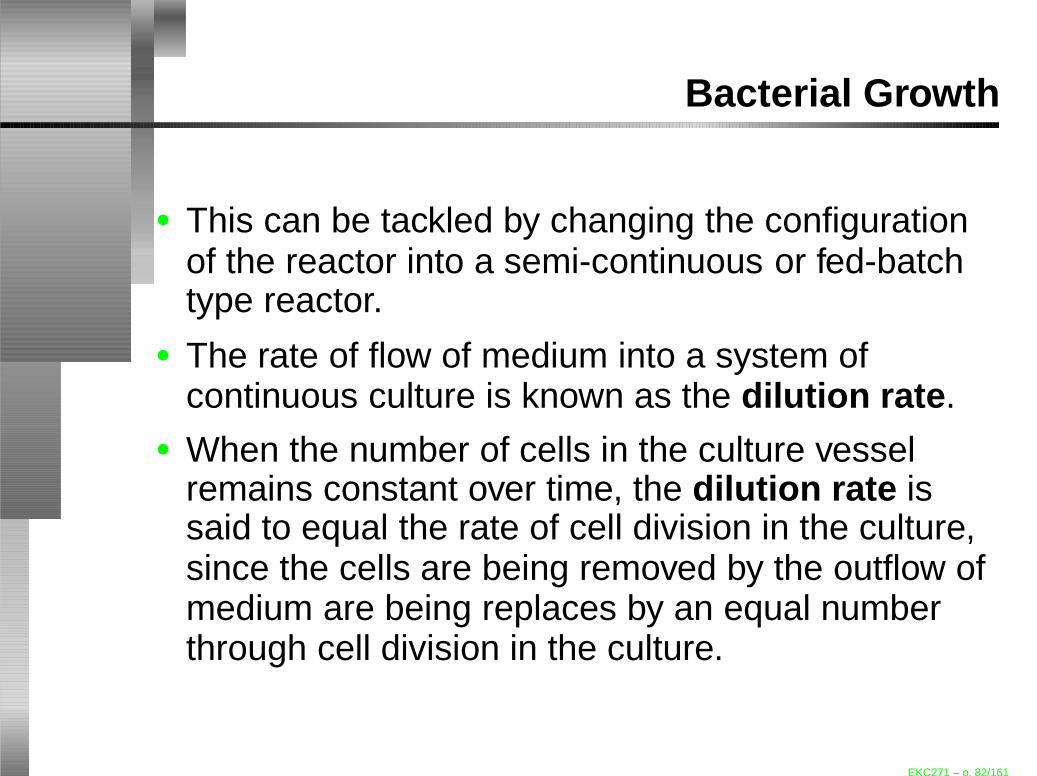
Bacterial Growth
• This can be tackled by changing the configurationof the reactor into a semi-continuous or fed-batchtype reactor.
• The rate of flow of medium into a system ofcontinuous culture is known as the dilution rate .
• When the number of cells in the culture vesselremains constant over time, the dilution rate issaid to equal the rate of cell division in the culture,since the cells are being removed by the outflow ofmedium are being replaces by an equal numberthrough cell division in the culture.
EKC271 – p. 82/161

Bacterial Growth
• Similar to that of the batch cultivation, the materialbalance for a continuous culture can be written as;
d
dt(VR · c) = Foco − Fici − VR · r (11)
in order to maintain the volume within the vessel;
Fi = Fo = F
EKC271 – p. 83/161

Bacterial Growth
• Thus,
d
dt(VR · c) = F (co − ci)− VR · r
⇒dc
dt=
F
VR(co − ci)− r − c
dVRdt
(12)
EKC271 – p. 84/161
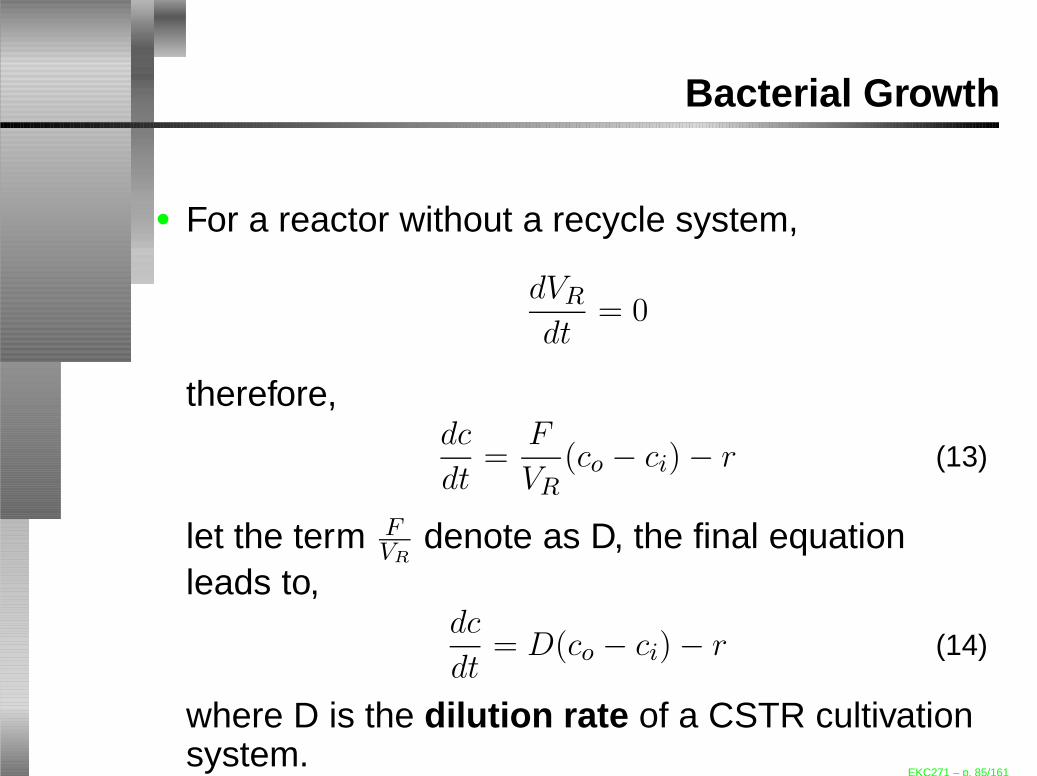
Bacterial Growth
• For a reactor without a recycle system,
dVRdt
= 0
therefore,dc
dt=
F
VR(co − ci)− r (13)
let the term FVR
denote as D, the final equationleads to,
dc
dt= D(co − ci)− r (14)
where D is the dilution rate of a CSTR cultivationsystem.
EKC271 – p. 85/161

Bacterial Growth
Batch growth• Material balance:
• consider the cell concentration in the fermenter;
d
dt(VRx) = VRrx
⇒ VRdx
dt= VRrx
since r =µmax[S]KS+[S]
, thus;
⇒dx
dt=
(
µmax[S]
KS + [S]
)
EKC271 – p. 86/161

Bacterial Growth
Batch growth• Material balance:
• at steady-state, dxdt = 0 thus,
⇒µmax[S]
KS + [S]= 0
• this clearly shows that when there is no growthin the bioreactor, there will be no cell to divide,thus no new cells to be produced.
EKC271 – p. 87/161

Bacterial Growth
Batch growth• Material balance:
• consider the substrate/nutrient concentrationin the fermenter;
d
dt(VR[S]) = −VRrx
• at steady-state condition, d[S]dt = 0 which leads to
[S] = 0 as well.
EKC271 – p. 88/161

Bacterial Growth
Continuous growth• Material balance:
• the balance on the continuous stirred-tankfermenter/reactor is similar to that of the batch,provided that there are inlet and outlet to andfrom the fermenter respectively.
• consider the cell concentration, x;
d
dt(VRx) = Fixi − Foxo + VRrx
butrx = µx
EKC271 – p. 89/161

Bacterial Growth
Continuous growth• Material balance:
• thus;d
dt(VRx) = Fixi − Foxo + VRµx
upon expansion and let µ =µmax[S]KS+[S]
gives,
VRdx
dt= Fixi − Foxo + VR
(
µmax[S]
KS + [S]
)
x
EKC271 – p. 90/161

Bacterial Growth
Continuous growth• Material balance:
• upon rearranging;
dx
dt=
Fi
VRxi −
Fo
VRxo +
(
µmax[S]
KS + [S]
)
x
• for a constant volume in a bioreactor,
Fi = Fo = F
EKC271 – p. 91/161
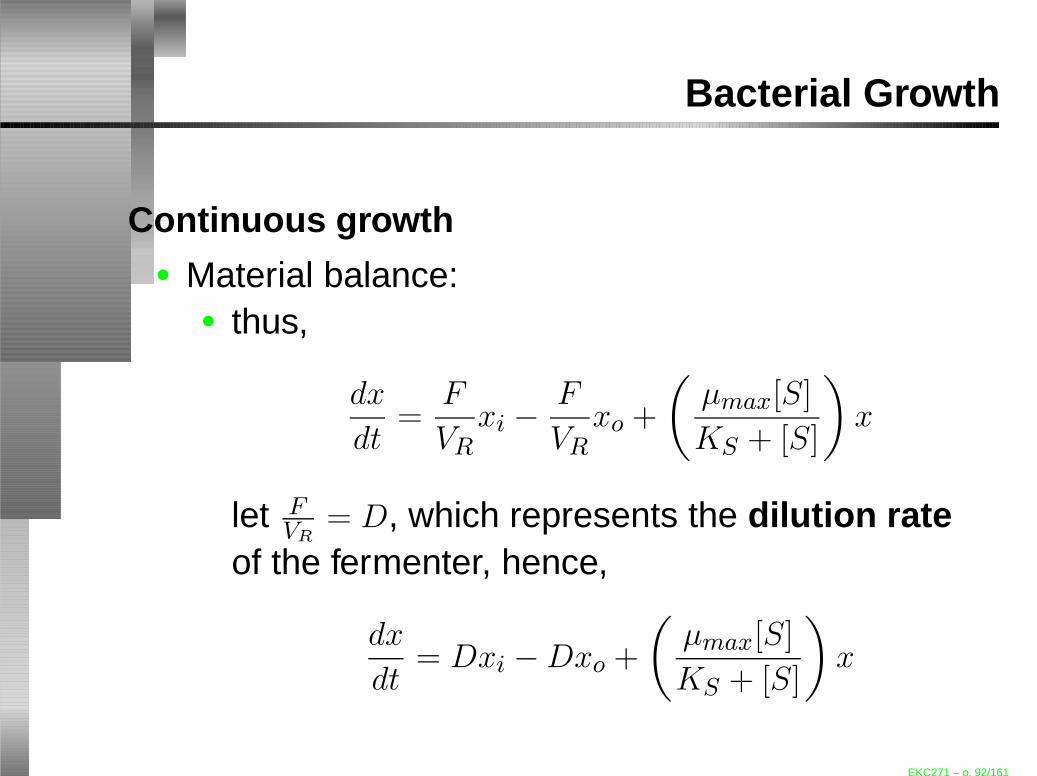
Bacterial Growth
Continuous growth• Material balance:
• thus,
dx
dt=
F
VRxi −
F
VRxo +
(
µmax[S]
KS + [S]
)
x
let FVR
= D, which represents the dilution rateof the fermenter, hence,
dx
dt= Dxi −Dxo +
(
µmax[S]
KS + [S]
)
x
EKC271 – p. 92/161
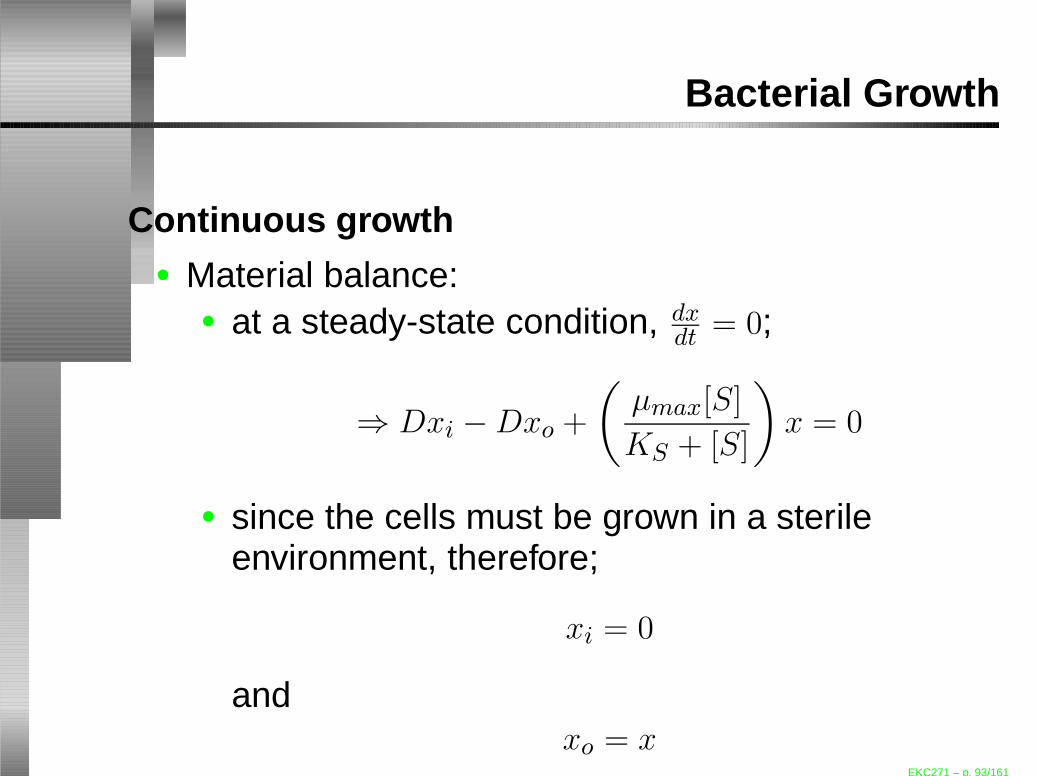
Bacterial Growth
Continuous growth• Material balance:
• at a steady-state condition, dxdt = 0;
⇒ Dxi −Dxo +
(
µmax[S]
KS + [S]
)
x = 0
• since the cells must be grown in a sterileenvironment, therefore;
xi = 0
andxo = x
EKC271 – p. 93/161
Bacterial Growth
Continuous growth• Material balance:
• then the equation becomes;
Dx =
(
µmax[S]
KS + [S]
)
x
⇒ D = µmax
(
[S]
KS + [S]
)
where;Dmax = µ
EKC271 – p. 94/161

Bacterial Growth
Continuous growth• Material balance:
• at a washout steady-state, as the dilution rate,D of the continuous fermenter increases, theconcentration of substrate, [S] also increases,where
D > Dmax
at x = 0.
EKC271 – p. 95/161

Bacterial Growth
Continuous growth• Material balance:
• the feed substrate, [S] will be such that
[S] ≫ KS
and Dmax becomes approximately equals to themaximum specific growth rate, µmax,
Dmax ≈ µmax
EKC271 – p. 96/161

Bacterial Growth
Continuous growth• Material balance:
• solving for the substrate concentration leads to;
[S] =KSD
µmax −D
EKC271 – p. 97/161
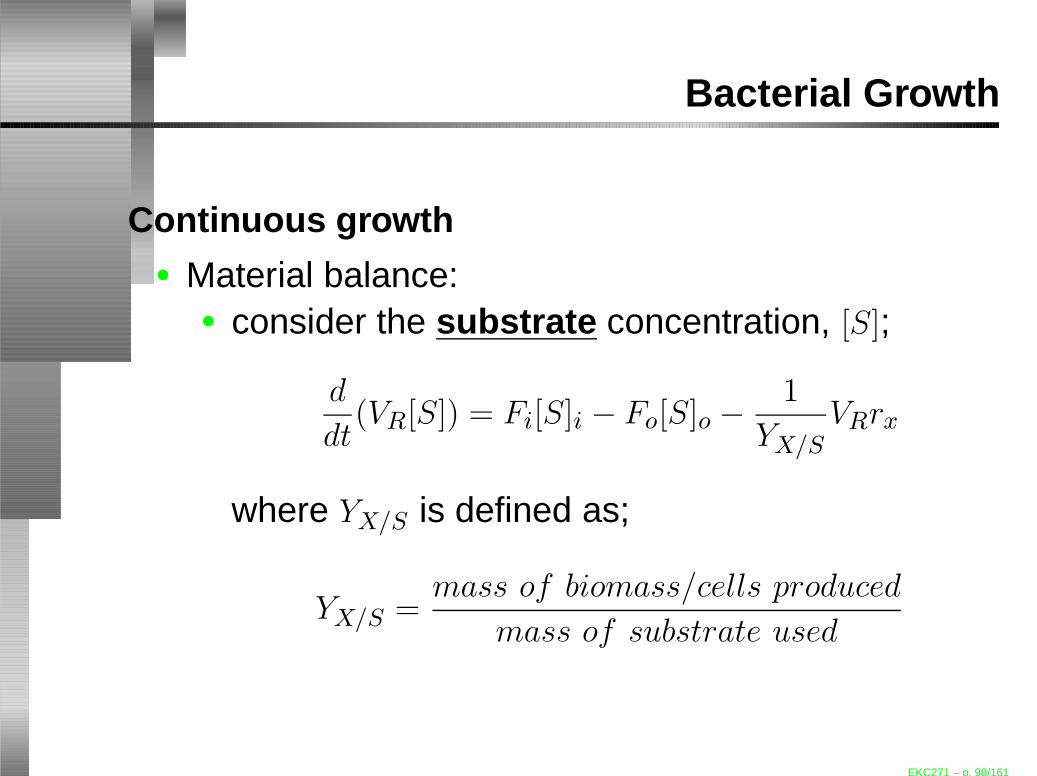
Bacterial Growth
Continuous growth• Material balance:
• consider the substrate concentration, [S];
d
dt(VR[S]) = Fi[S]i − Fo[S]o −
1
YX/SVRrx
where YX/S is defined as;
YX/S =mass of biomass/cells produced
mass of substrate used
EKC271 – p. 98/161
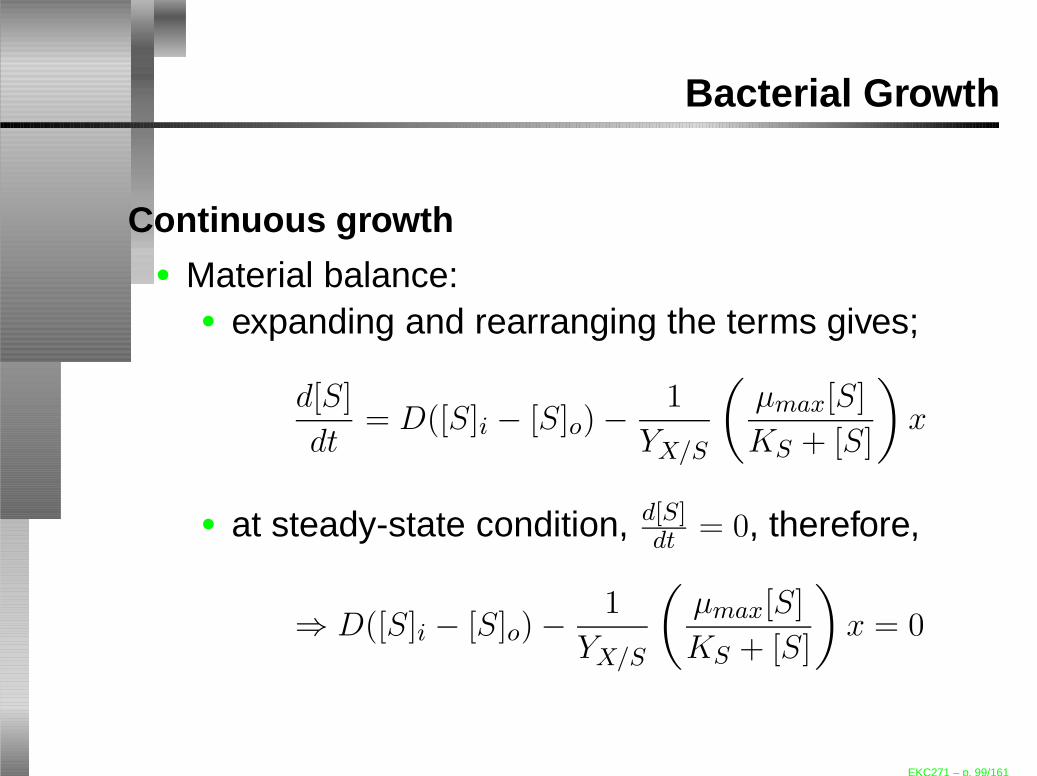
Bacterial Growth
Continuous growth• Material balance:
• expanding and rearranging the terms gives;
d[S]
dt= D([S]i − [S]o)−
1
YX/S
(
µmax[S]
KS + [S]
)
x
• at steady-state condition, d[S]dt = 0, therefore,
⇒ D([S]i − [S]o)−1
YX/S
(
µmax[S]
KS + [S]
)
x = 0
EKC271 – p. 99/161

Bacterial Growth
Continuous growth• Material balance:
• let the outlet substrate concentration, [S]o = [S]therefore,
⇒ D([S]i − [S])−1
YX/S
(
µmax[S]
KS + [S]
)
x = 0
and upon substitution of the term [S] into theabove equation gives;
x = YX/S
(
[S]i −KSD
µmax −D
)
EKC271 – p. 100/161

Effects of Environment on CellGrowth
• There are 3 main environmental factors that cangive effect to the cell growth;1. Temperature2. pH3. Oxygen
• Effect of Temperature• Temperaturea can change the configuration of
cell constituents, especially proteins andmembrane components. There is a 2-foldincrease in the specific growth rate, µ for every10◦C rise in temperature. For certain type ofcells the optimal temperature is listed below:
aCourtesy of Dr. W.S. Long EKC271 – p. 101/161
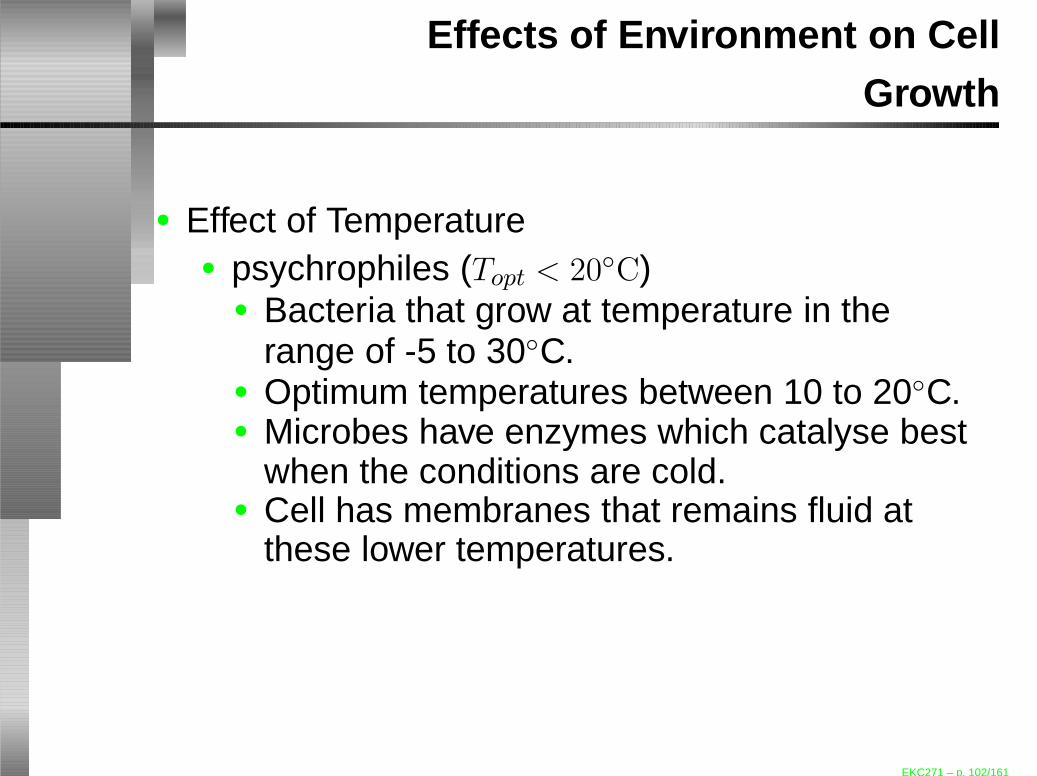
Effects of Environment on CellGrowth
• Effect of Temperature• psychrophiles (Topt < 20◦C)
• Bacteria that grow at temperature in therange of -5 to 30◦C.
• Optimum temperatures between 10 to 20◦C.• Microbes have enzymes which catalyse best
when the conditions are cold.• Cell has membranes that remains fluid at
these lower temperatures.
EKC271 – p. 102/161

Effects of Environment on CellGrowth
• Effect of Temperature• psychrophiles (Topt < 20◦C)
• Examples of this type of organism: algae thatlive near the poles of the Earth at temperaturebelow 0◦C, bacteria that spoil milk, meat,vegetables and fruits even when they arestored in a fridge–it only slows down the therate of spoilage of food and cannot stop thegrowth of these microbes.
EKC271 – p. 103/161

Effects of Environment on CellGrowth
• Effect of Temperature• mesophiles (Topt = 20− 50◦C)
• Microbes that grow at optimal temperatures inthe range of 20 to 40◦C.
• These type of organisms can be found inwarm-blooded creatures e.g. humans.Pathogenic bacteria is one of the kind as wellas symbiotic bacteria.
EKC271 – p. 104/161

Effects of Environment on CellGrowth
• Effect of Temperature• thermophiles (Topt > 50◦C)
• Bacteria that live at temperatures exceed50◦C.
• It can tolerate at very harsh conditions suchas decomposing materials, hot springs (temp.between 80 to 85◦C) and deep in the oceansby thermal vents bubbling up from the hotrocks below the Earth’s crust.
EKC271 – p. 105/161

Effects of Environment on CellGrowth
Temperature ( ◦C)
Group Minimum Optimum Maximum
Thermophiles 40 to 45 55 to 75 60 to 80Mesophiles 10 to 15 30 to 45 35 to 47Psychrophiles
– Obligate -5 to 5 15 to 18 19 to 22– Facultative -5 to 5 25 to 30 30 to 35
EKC271 – p. 106/161
Effects of Environment on CellGrowth
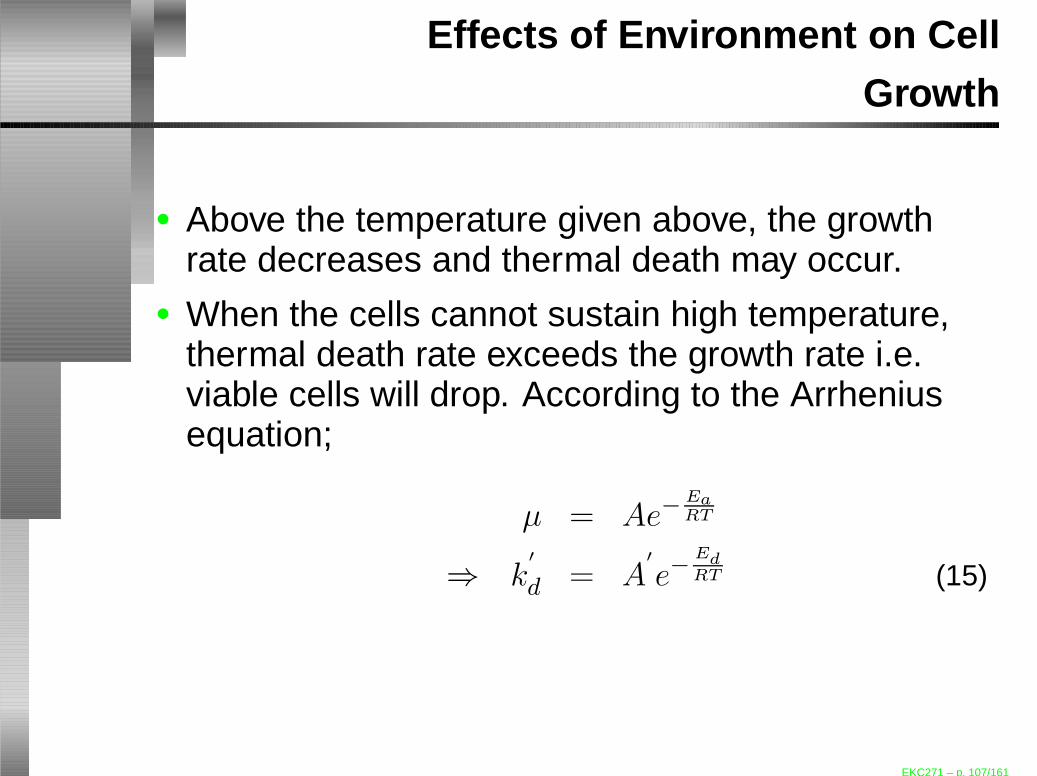
• Above the temperature given above, the growthrate decreases and thermal death may occur.
• When the cells cannot sustain high temperature,thermal death rate exceeds the growth rate i.e.viable cells will drop. According to the Arrheniusequation;
µ = Ae−EaRT
⇒ k′
d = A′
e−EdRT (15)
EKC271 – p. 107/161

Effects of Environment on CellGrowth
• A typical values for Ed for thermal destruction ofmicroorganism are high, small increase oftemperature have a significant effect on k
′
d and therate of death.
• • Ea: Activation energy for growth• Ed: Activation energy for thermal death
• Temperature also affects product formation andyield coefficient.
EKC271 – p. 108/161

Effects of Environment on CellGrowth
• The optimal temperature for growth and productformation differ;• when T > Topt, the maintenance requirement of
cell increases.• ms or mp increases with increasing temperature
with value of E between 15 to 20 kcal ·mol−1
and thus decreases YX/S.(ms and mp are themaintenance coefficient for substrate andproduct respectively).
EKC271 – p. 109/161
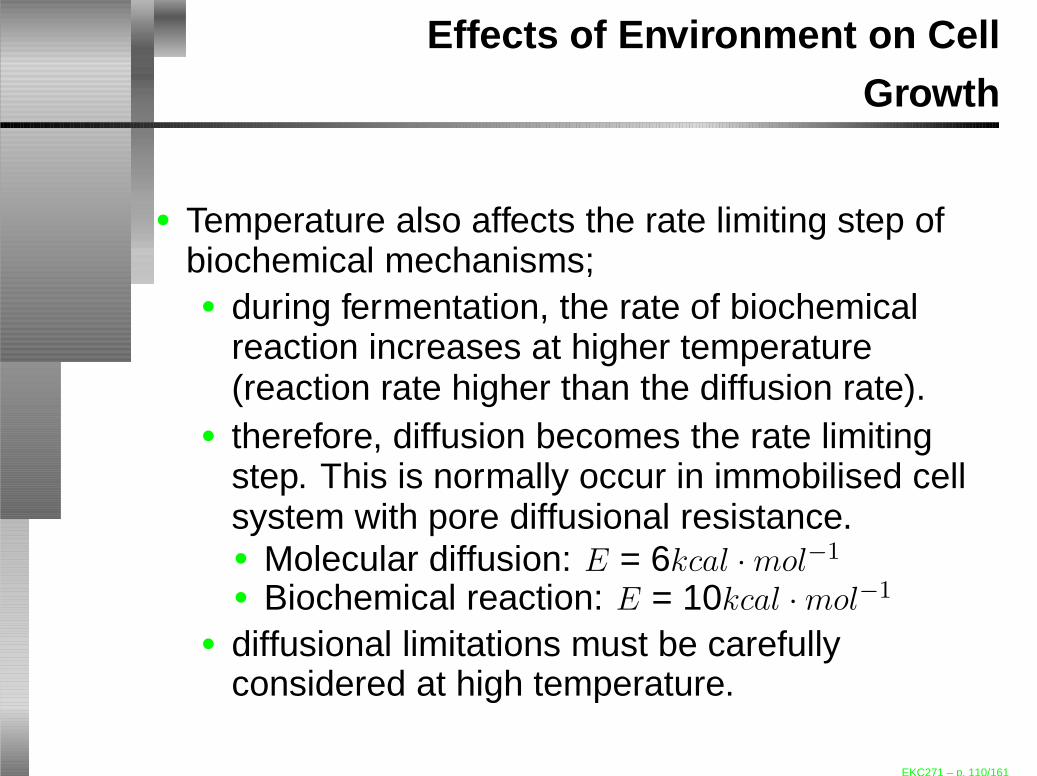
Effects of Environment on CellGrowth
• Temperature also affects the rate limiting step ofbiochemical mechanisms;• during fermentation, the rate of biochemical
reaction increases at higher temperature(reaction rate higher than the diffusion rate).
• therefore, diffusion becomes the rate limitingstep. This is normally occur in immobilised cellsystem with pore diffusional resistance.• Molecular diffusion: E = 6kcal ·mol−1
• Biochemical reaction: E = 10kcal ·mol−1
• diffusional limitations must be carefullyconsidered at high temperature.
EKC271 – p. 110/161
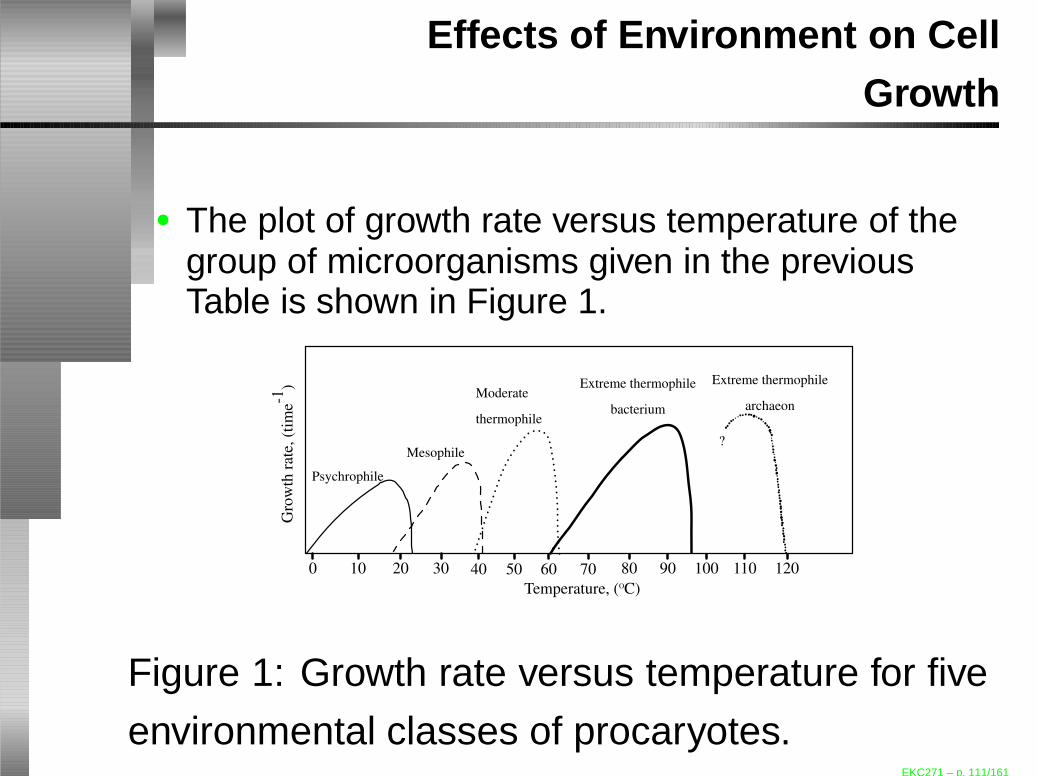
Effects of Environment on CellGrowth
• The plot of growth rate versus temperature of thegroup of microorganisms given in the previousTable is shown in Figure 1.
Gro
wth
rat
e, (
tim
e-1)
Temperature, (OC)
Psychrophile
Extreme thermophile
bacterium
Moderate
thermophile
Mesophile
Extreme thermophile
archaeon
0 1101009080706050402010 30 120
?
Figure 1: Growth rate versus temperature for five
environmental classes of procaryotes.EKC271 – p. 111/161

Effects of Environment on CellGrowth
• Effect of pH• The influence of pH on cellular activity is
determined by the sensitivity of the individualenzymes to changes in the pH.
• Enzymes are normally active only within acertain pH interval and the total enzyme activityof the cell is therefore a complex function of theenvironmental pH.
• Consider the influence of pH on a singleenzyme, which is taken to represent the cellactivity.
EKC271 – p. 112/161

Effects of Environment on CellGrowth
• Effect of pH
[E] [E]- [E]2-
-H+ -H+
+H++H+
Figure 2: Enzyme forms with changing of pH.
EKC271 – p. 113/161

Effects of Environment on CellGrowth
• Effect of pH• Where [E]− is taken to be the active form of
enzyme while the two other forms are assumedto be completely inactive, with K1 and K2 beingthe dissociation constants for the free acids [E]
and [E]− respectively.• The fraction of active enzyme [E]− is calculated
to be;[E]−
[E]tot=
1
1 +[H+]K1
+ K2
[H+]
(16)
EKC271 – p. 114/161

Effects of Environment on CellGrowth
• Effect of pH• The enzyme activity is taken to be
k = ke[E]−.
If the cell is determined by the activity of theenzyme considered above, the maximumspecific growth rate, µmax becomes;
µmax =k[E]tot
1 +[H+]K1
+ K2
[H+]
(17)
EKC271 – p. 115/161

Effects of Environment on CellGrowth
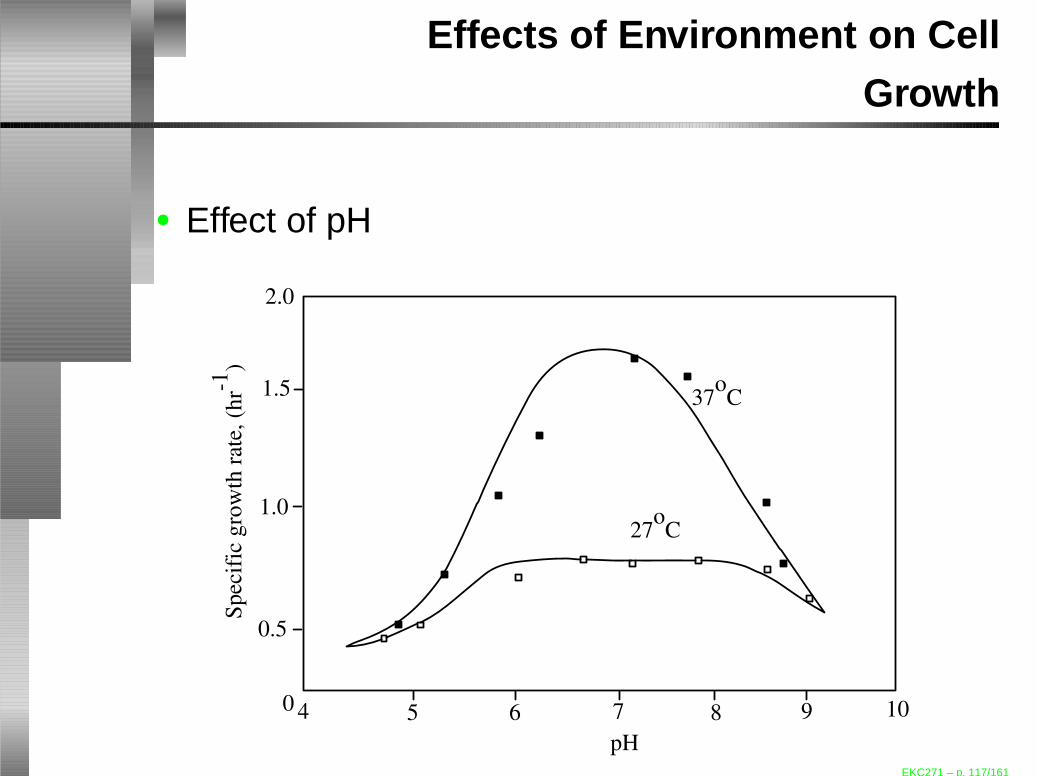
• Effect of pH• This model has been found to fit well with the
specific activity data for a few microorganismsand the fitting for E. coli cell as well as values ofthe fitted parameters is given in Figure 3 andTable 1 respectively.
EKC271 – p. 116/161
Effects of Environment on CellGrowth
• Effect of pH
37o
C
27o
C
pH
Sp
ecif
ic g
row
th r
ate,
(h
r-1)
0.5
1.0
1.5
40
2.0
6 7 8 9 105
EKC271 – p. 117/161
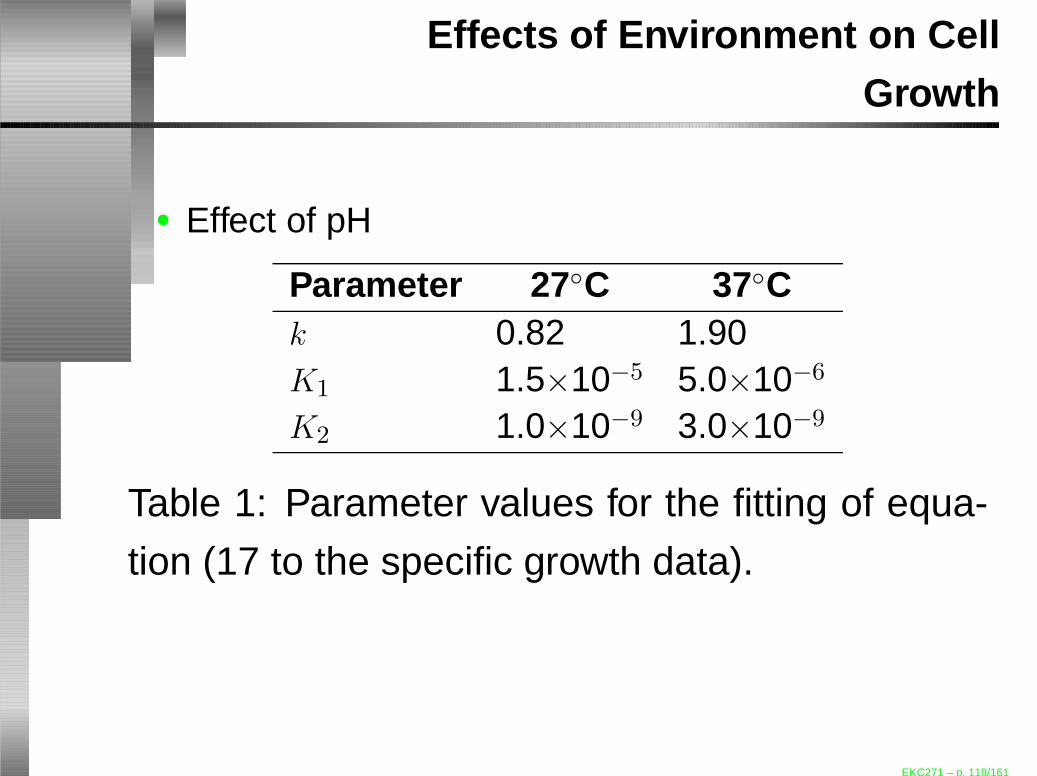
Effects of Environment on CellGrowth
• Effect of pH
Parameter 27 ◦C 37◦Ck 0.82 1.90K1 1.5×10⁻⁵ 5.0×10⁻⁶
K2 1.0×10⁻⁹ 3.0×10⁻⁹
Table 1: Parameter values for the fitting of equa-
tion (17 to the specific growth data).
EKC271 – p. 118/161
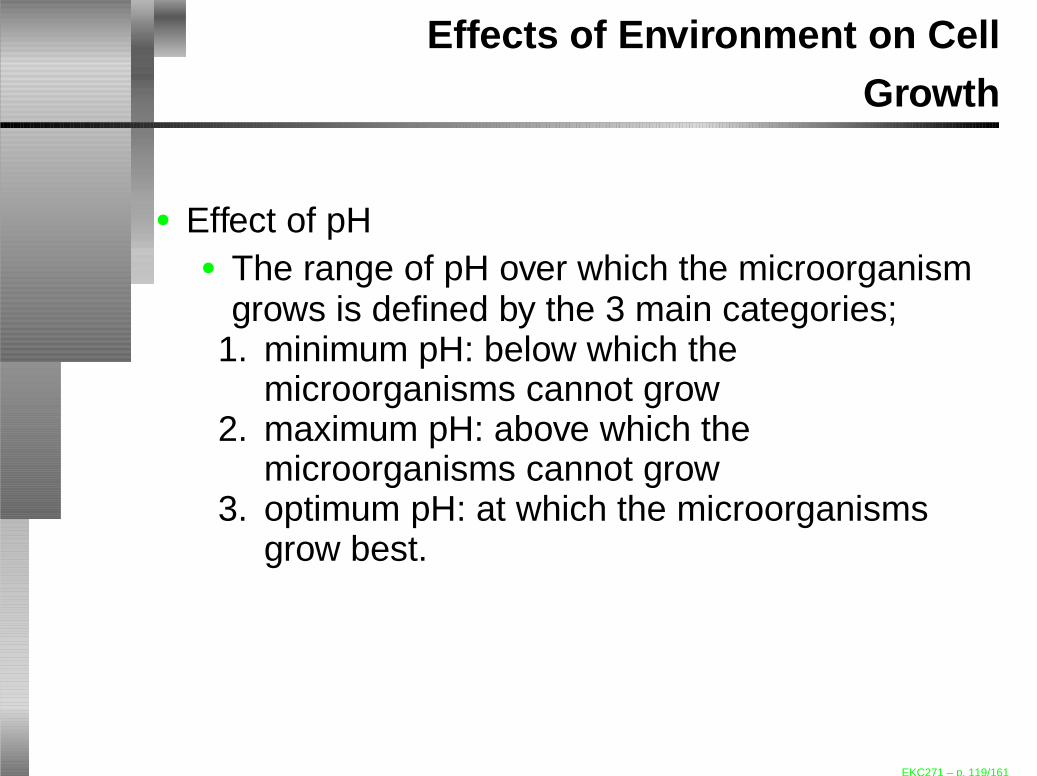
Effects of Environment on CellGrowth
• Effect of pH• The range of pH over which the microorganism
grows is defined by the 3 main categories;1. minimum pH: below which the
microorganisms cannot grow2. maximum pH: above which the
microorganisms cannot grow3. optimum pH: at which the microorganisms
grow best.
EKC271 – p. 119/161

Effects of Environment on CellGrowth
• Effect of pH• For most bacteria there is an orderly increase in
growth rate between the minimum and theoptimum
• Orderly decrease in growth rate between theoptimum and the maximum pH–reflecting thegeneral effect of changing [H+] on the rates ofenzymatic reaction as shown in Figure 120.
EKC271 – p. 120/161

Effects of Environment on CellGrowth
• Effect of pH
Acidophile AlkaliphileNeutrophile
Gro
wth
rat
e, (
tim
e-1)
7More acidic More basic
pH
EKC271 – p. 121/161
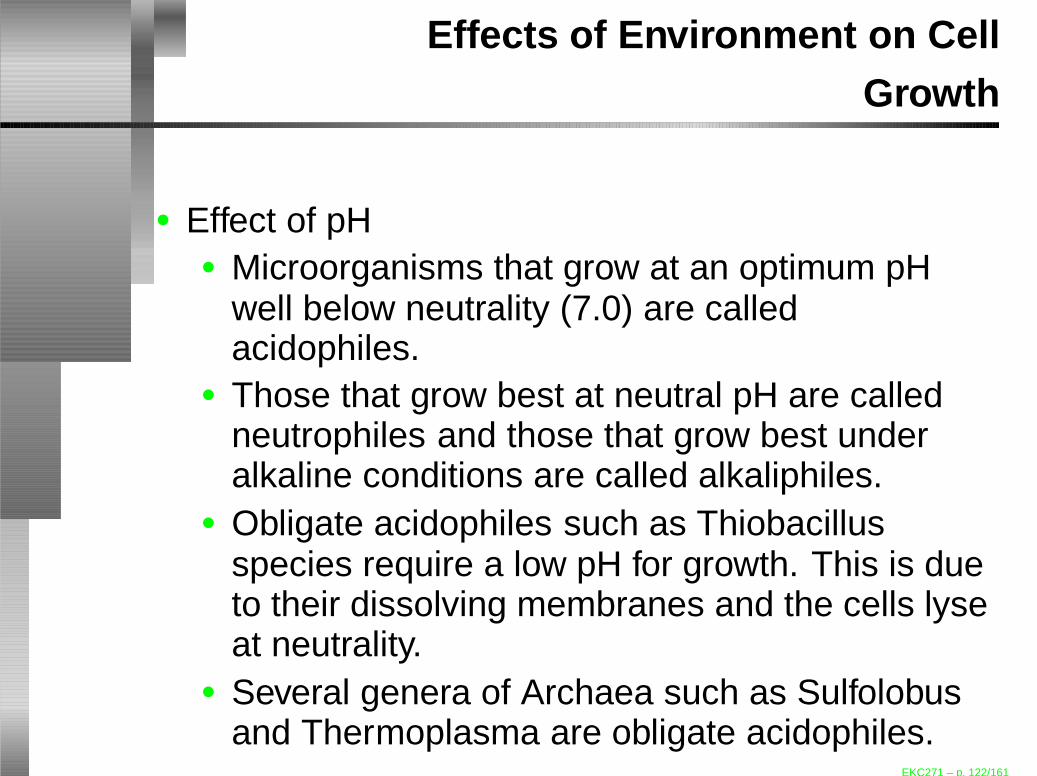
Effects of Environment on CellGrowth
• Effect of pH• Microorganisms that grow at an optimum pH
well below neutrality (7.0) are calledacidophiles.
• Those that grow best at neutral pH are calledneutrophiles and those that grow best underalkaline conditions are called alkaliphiles.
• Obligate acidophiles such as Thiobacillusspecies require a low pH for growth. This is dueto their dissolving membranes and the cells lyseat neutrality.
• Several genera of Archaea such as Sulfolobusand Thermoplasma are obligate acidophiles.
EKC271 – p. 122/161
Effects of Environment on CellGrowth
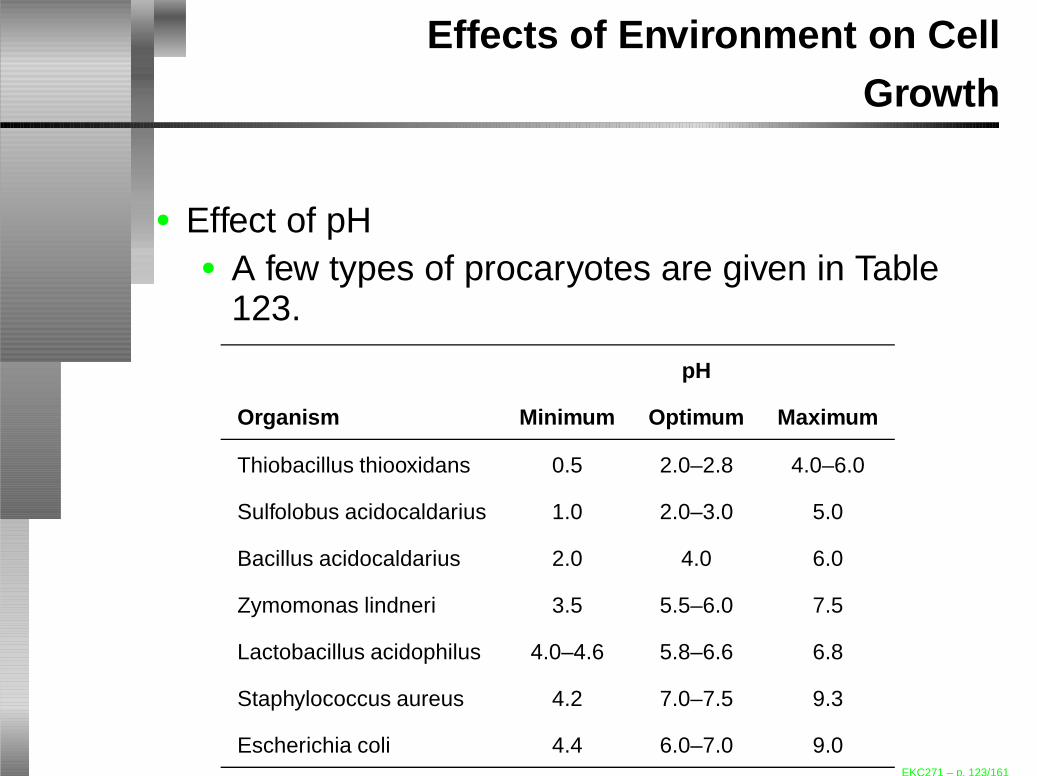
• Effect of pH• A few types of procaryotes are given in Table
123.
pH
Organism Minimum Optimum Maximum
Thiobacillus thiooxidans 0.5 2.0–2.8 4.0–6.0
Sulfolobus acidocaldarius 1.0 2.0–3.0 5.0
Bacillus acidocaldarius 2.0 4.0 6.0
Zymomonas lindneri 3.5 5.5–6.0 7.5
Lactobacillus acidophilus 4.0–4.6 5.8–6.6 6.8
Staphylococcus aureus 4.2 7.0–7.5 9.3
Escherichia coli 4.4 6.0–7.0 9.0EKC271 – p. 123/161
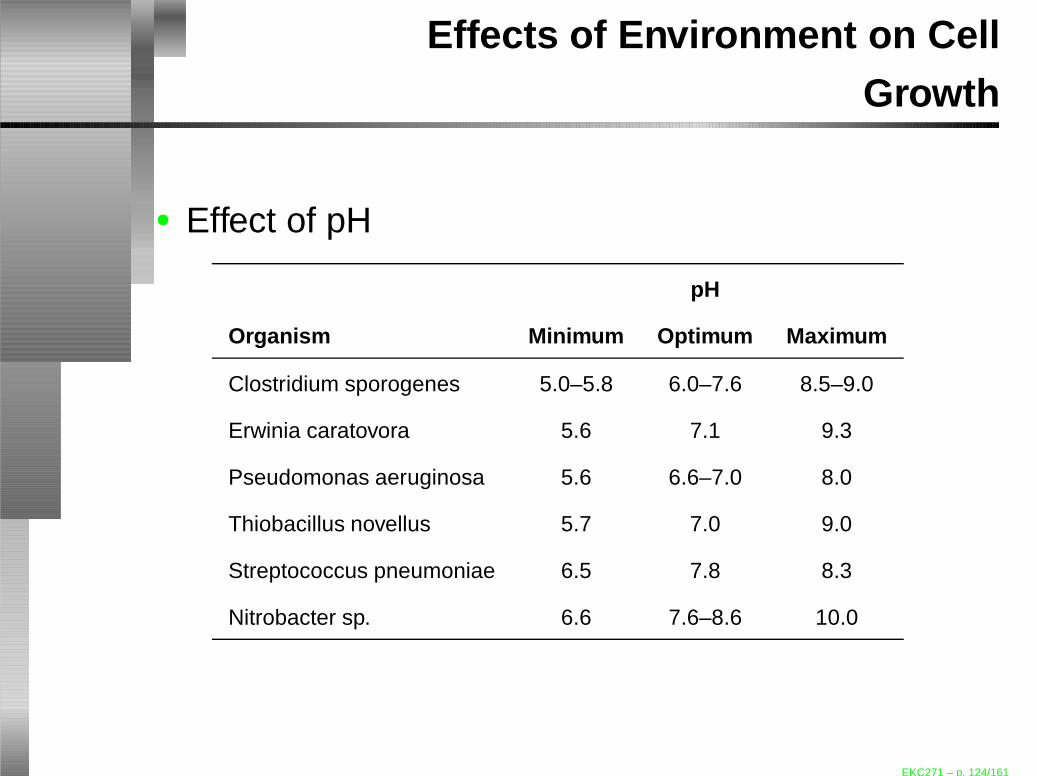
Effects of Environment on CellGrowth
• Effect of pH
pH
Organism Minimum Optimum Maximum
Clostridium sporogenes 5.0–5.8 6.0–7.6 8.5–9.0
Erwinia caratovora 5.6 7.1 9.3
Pseudomonas aeruginosa 5.6 6.6–7.0 8.0
Thiobacillus novellus 5.7 7.0 9.0
Streptococcus pneumoniae 6.5 7.8 8.3
Nitrobacter sp. 6.6 7.6–8.6 10.0
EKC271 – p. 124/161

Effects of Environment on CellGrowth
• Effect of Oxygen• Dissolved oxygena (DO) is an important
substrate in an aerobic fermentations–limitingsubstrate, since O2 is sparingly soluble gas inwater (7p.p.m at standard temperature andpressure: 25◦C and 1atm). When oxygen is ratelimiting, the specific growth rate, µ varies withDO.• Below a critical oxygen concentration, the
growth approaches a first-order rate.• Above the critical oxygen concentration,
growth rate becomes independent of DO.aCourtesy of Dr. W.S. Long
EKC271 – p. 125/161

Effects of Environment on CellGrowth
• Effect of Oxygen• When dissolved oxygen level is below the
critical level, then the oxygen concentration is agrowth rate limiting, thus, another mediumbecomes the growth extent limiting.
• This can be seen in Azotobacter vivelandii–atdissolved oxygen of 0.05mg·l−1, the growth rateof the organism is 50% of its maximum, even iflarge amount of nutrient (glucose) is present.
EKC271 – p. 126/161

Effects of Environment on CellGrowth
• Effect of Oxygen• This, however, does not affect the amount of
cells formed since the cells will keep growingwhenever there is enough oxygen dissolved.The critical oxygen concentration varies withdifferent organisms;• bacteria and yeast: 5–10%• mold cultures: 10–50%
• The growth extent or the mass of cells formeddepends on the amount of glucose, on the otherhand, the growth rate depends on the amountof oxygen dissolved, DO.
EKC271 – p. 127/161

Effects of Environment on CellGrowth
• Effect of Oxygen• The transfer of oxygen from gas bubbles to cells
is limited by oxygen transfer through liquid filmsurrounding the gas bubbles;
NO2= kLa(C
∗− CL)
where NO2is the oxygen transfer rate (OTR)
with the units of mgO2·l−1h−1 and;
• kL: O2 transfer coefficient (cm·h−1)• a: gas–liquid interface area (cm2·cm−3)• kLa: volumetric O2 transfer coefficient (h−1)• C∗: saturated dissolved oxygen (mg·l−1)• CL: actual dissolved oxygen (mg·l−1)
EKC271 – p. 128/161

Effects of Environment on CellGrowth
• Effect of Oxygen• Oxygen Uptake Rate (OUR)
• Oxygen uptake rate is given by;
OUR = qO2X =
µX
YX/O2
(18)
where;· qO2
: specific rate of O2 consumption(mgO2
·g−1dcw·h
−1)· YX/O2
: oxygen yield coefficients (gdcw·g−1O2
)· X: cell concentration (gdcw·l−1)
EKC271 – p. 129/161
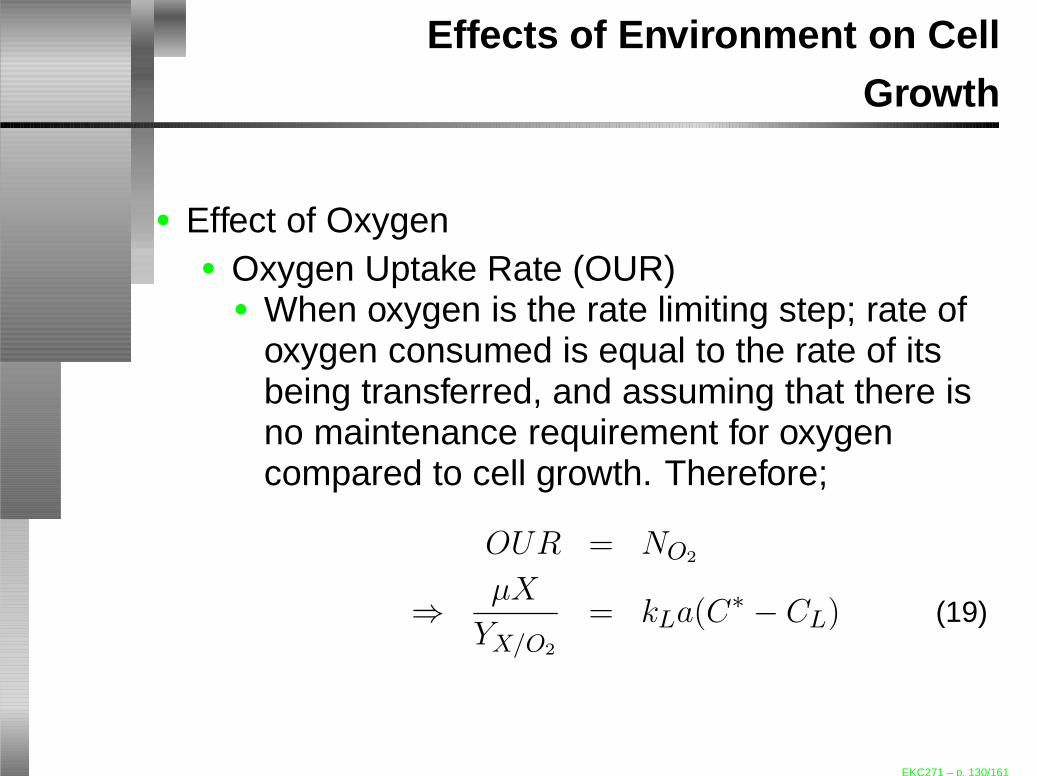
Effects of Environment on CellGrowth
• Effect of Oxygen• Oxygen Uptake Rate (OUR)
• When oxygen is the rate limiting step; rate ofoxygen consumed is equal to the rate of itsbeing transferred, and assuming that there isno maintenance requirement for oxygencompared to cell growth. Therefore;
OUR = NO2
⇒µX
YX/O2
= kLa(C∗− CL) (19)
EKC271 – p. 130/161

Effects of Environment on CellGrowth
• Effect of Oxygen• Oxygen Uptake Rate (OUR)
• since the terms (µX) is the rate of cell growthwith respect to time, hence;
dX
dt= kLa(C
∗− CL)YX/O2
(20)
EKC271 – p. 131/161
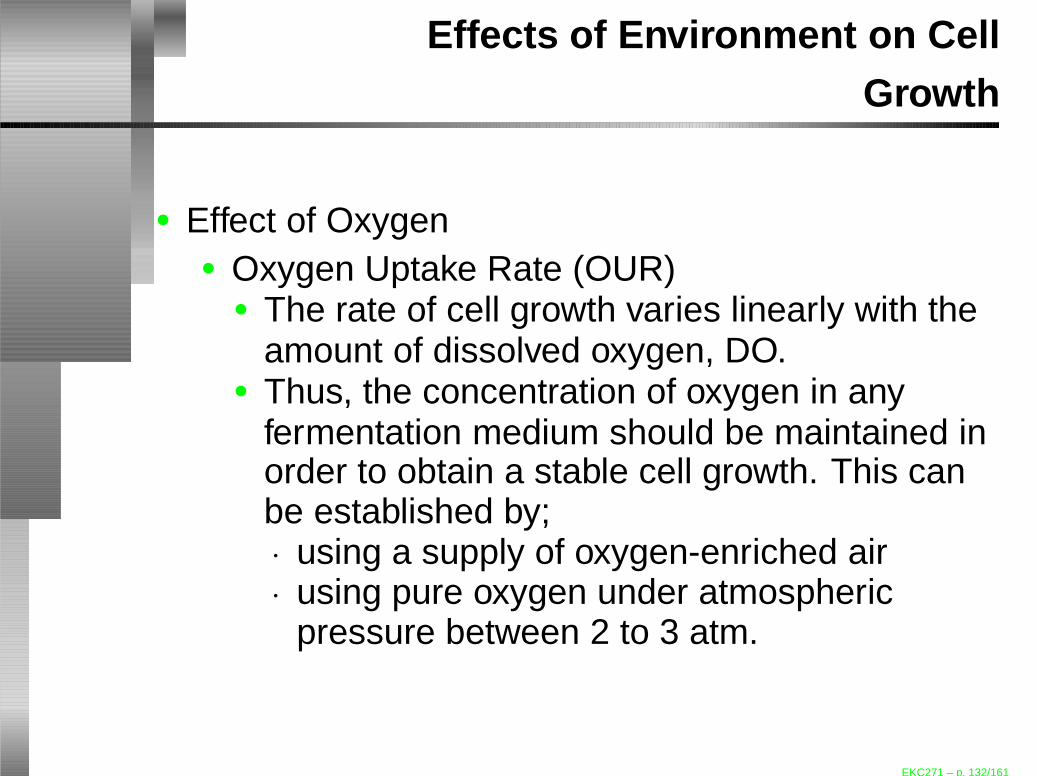
Effects of Environment on CellGrowth
• Effect of Oxygen• Oxygen Uptake Rate (OUR)
• The rate of cell growth varies linearly with theamount of dissolved oxygen, DO.
• Thus, the concentration of oxygen in anyfermentation medium should be maintained inorder to obtain a stable cell growth. This canbe established by;· using a supply of oxygen-enriched air· using pure oxygen under atmospheric
pressure between 2 to 3 atm.
EKC271 – p. 132/161

Effects of Environment on CellGrowth
• Heat Generation by Microbial Growth• Chemical reaction that occurs within the cells
produces energy which is released as heat.• Cellular heat production is primarily the result of
energy and growth metabolism whichconsequently makes the heat generated fromthe cells to be approximately proportional to theenergy in utilising substrate.
EKC271 – p. 133/161

Effects of Environment on CellGrowth
• Heat Generation by Microbial Growth• the yield factor due to the heat produced, Y△
can be written as;
Y△(gcell ·kcal−1) =
Ys(∆Hs − Ys∆Hc)
(gcell · g−1substrate)
(kcal · g−1substrate)
(21)• It is derived based on the approximate energy
balances over the two different pathways shownin Figure 4
EKC271 – p. 134/161
Effects of Environment on CellGrowth
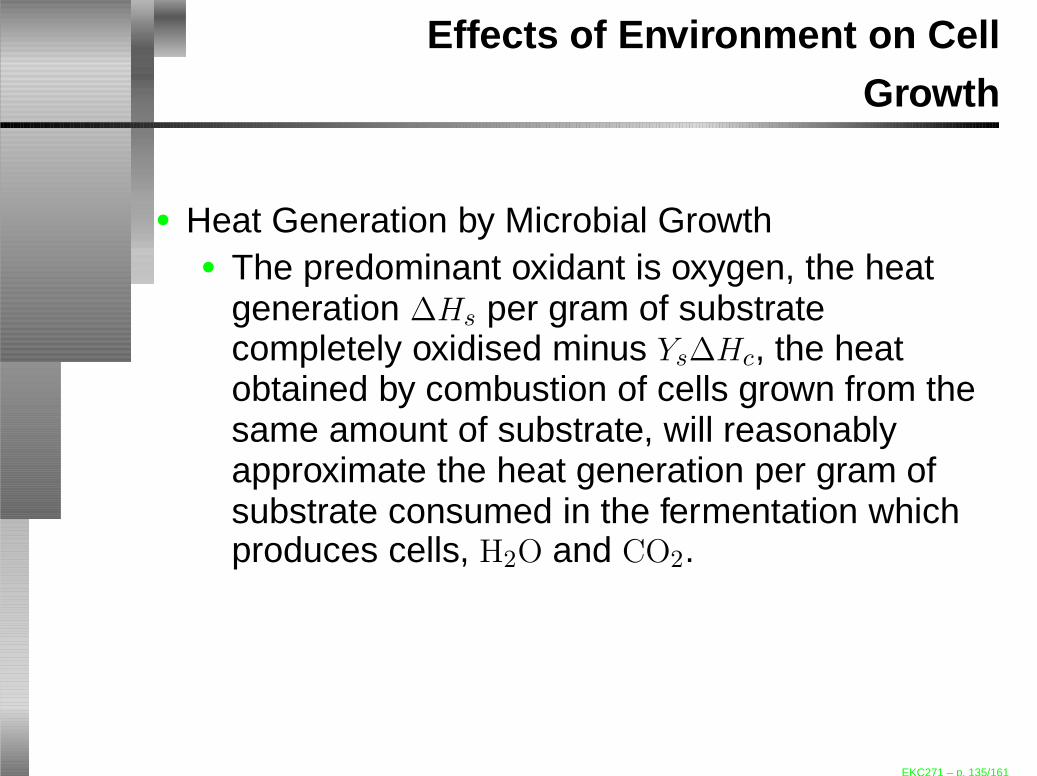
• Heat Generation by Microbial Growth• The predominant oxidant is oxygen, the heat
generation ∆Hs per gram of substratecompletely oxidised minus Ys∆Hc, the heatobtained by combustion of cells grown from thesame amount of substrate, will reasonablyapproximate the heat generation per gram ofsubstrate consumed in the fermentation whichproduces cells, H2O and CO2.
EKC271 – p. 135/161
Effects of Environment on CellGrowth
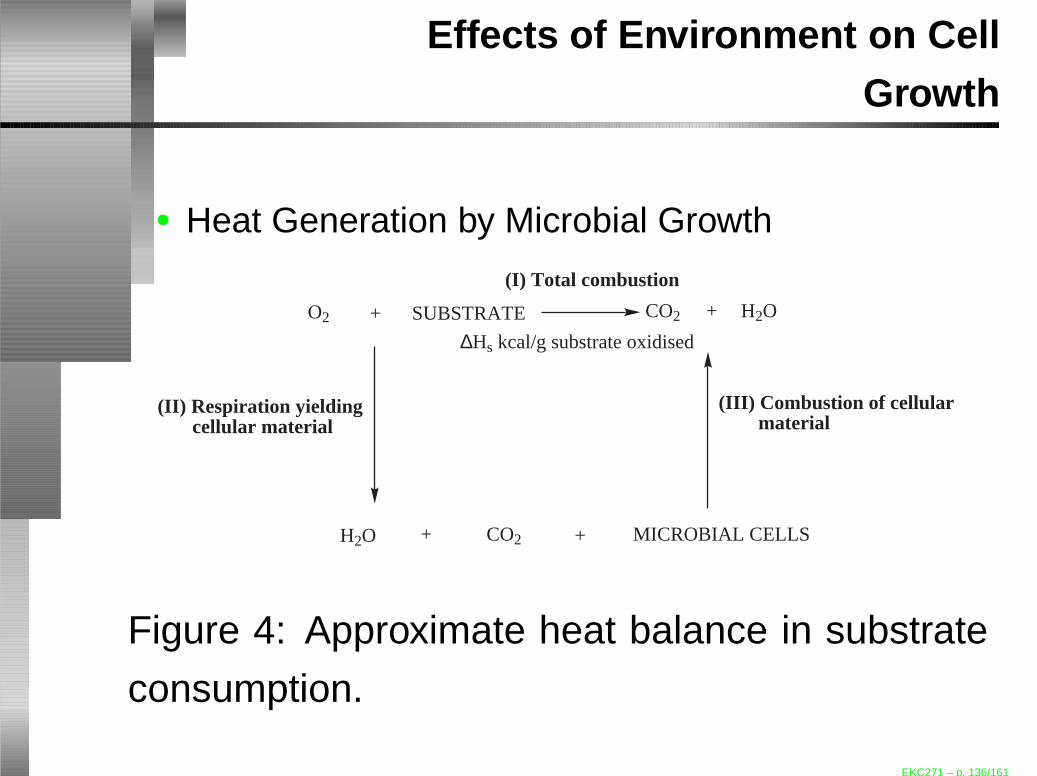
• Heat Generation by Microbial Growth
O2 + SUBSTRATE CO2 H2O
H2O CO2 MICROBIAL CELLS
+
+ +
(I) Total combustion
(II) Respiration yielding cellular material
(III) Combustion of cellular material
∆Hs kcal/g substrate oxidised
Figure 4: Approximate heat balance in substrate
consumption.
EKC271 – p. 136/161
Effects of Environment on CellGrowth
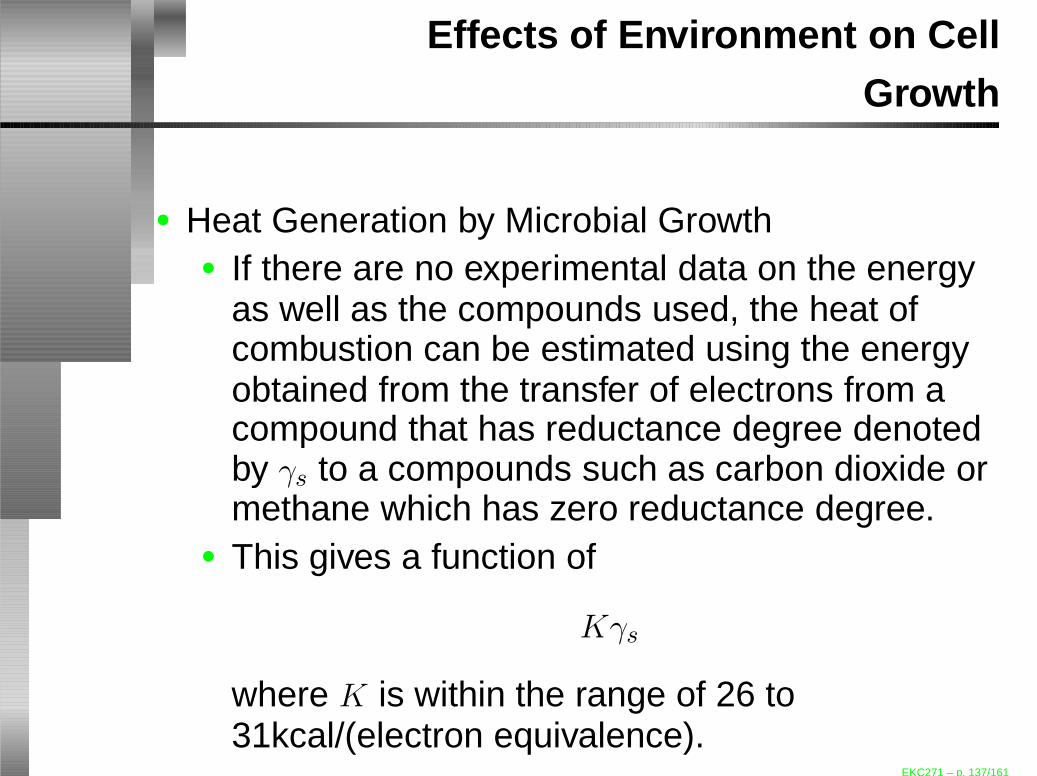
• Heat Generation by Microbial Growth• If there are no experimental data on the energy
as well as the compounds used, the heat ofcombustion can be estimated using the energyobtained from the transfer of electrons from acompound that has reductance degree denotedby γs to a compounds such as carbon dioxide ormethane which has zero reductance degree.
• This gives a function of
Kγs
where K is within the range of 26 to31kcal/(electron equivalence).
EKC271 – p. 137/161

Effects of Environment on CellGrowth
• Example 2: Estimate the heat of combustion ofPseudomonas fluorescens growing in glucosemedium.
EKC271 – p. 138/161

Effects of Environment on CellGrowth
• Answer 2: The reaction for cell combustion isgiven as;
CH1.66N0.20O0.27(CELLS) + 1.28O2 →
CO2 + 0.10N2 + 0.83H2O
• Assuming that such a reaction produces carbondioxide, water and nitrogen. By assuming thatthe heat of combustion of oxygen is 104kcal permole of O2, the heat released by combustion ofbacteria can be estimated using the inverse ofequation (21);
EKC271 – p. 139/161
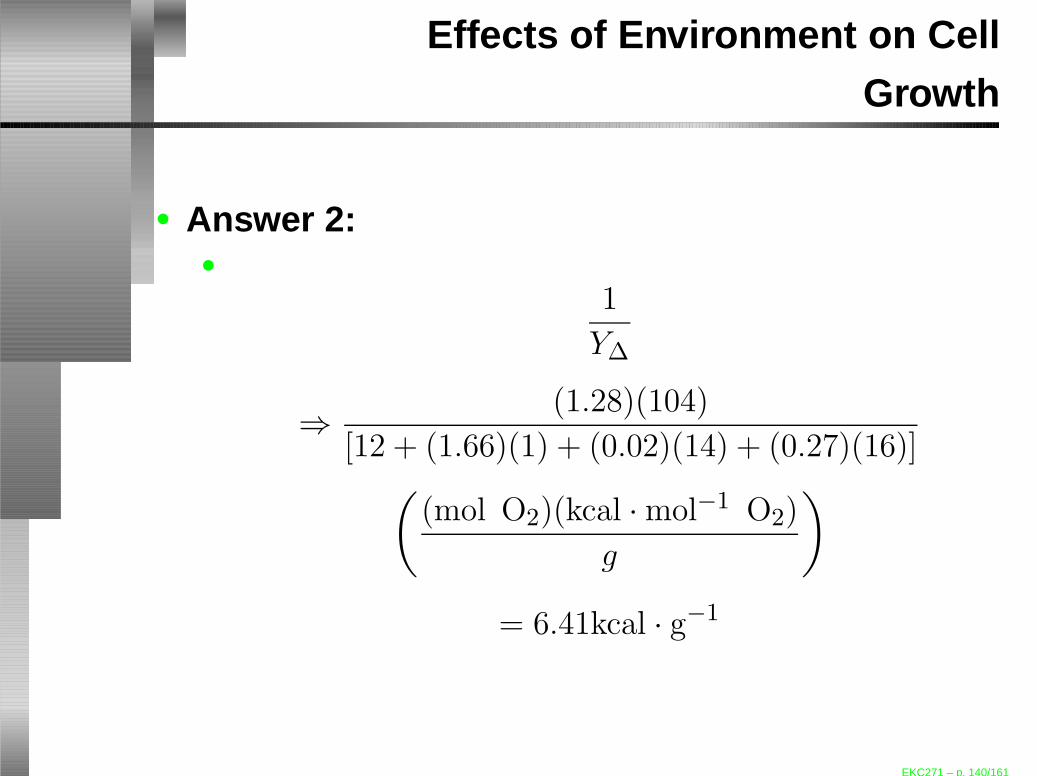
Effects of Environment on CellGrowth
• Answer 2:•
1
Y∆
⇒(1.28)(104)
[12 + (1.66)(1) + (0.02)(14) + (0.27)(16)](
(mol O2)(kcal ·mol−1 O2)
g
)
= 6.41kcal · g−1
EKC271 – p. 140/161
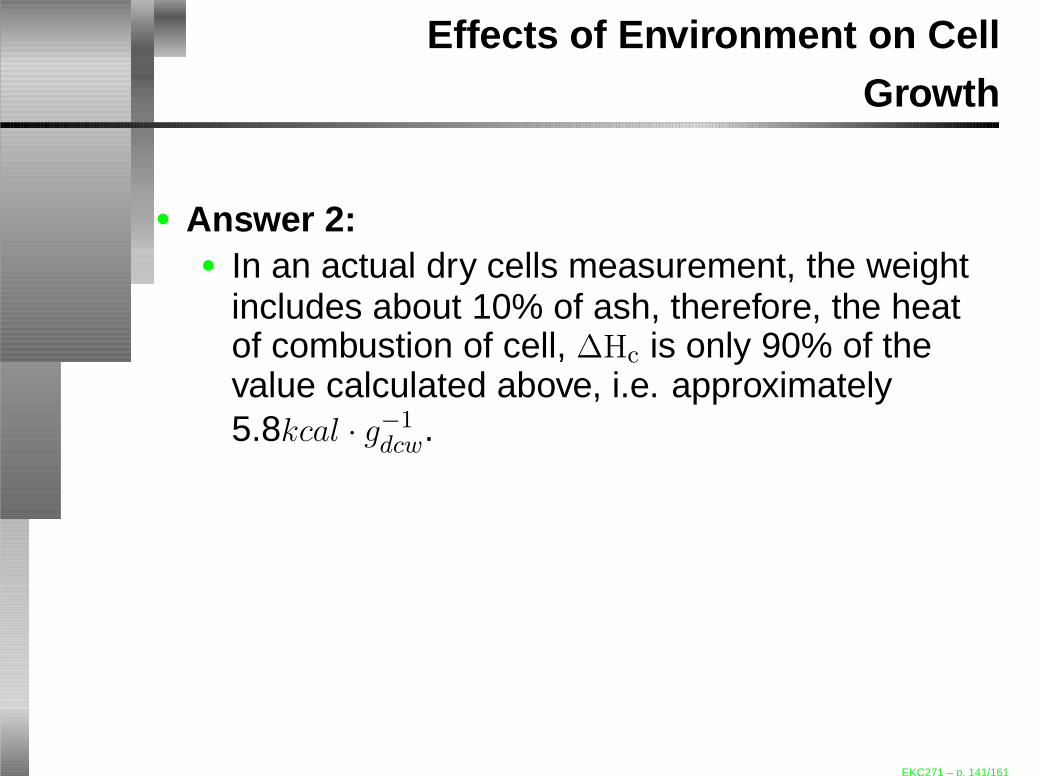
Effects of Environment on CellGrowth
• Answer 2:• In an actual dry cells measurement, the weight
includes about 10% of ash, therefore, the heatof combustion of cell, ∆Hc is only 90% of thevalue calculated above, i.e. approximately5.8kcal · g−1
dcw.
EKC271 – p. 141/161

Effects of Environment on CellGrowth
• Heat Generation by Microbial Growth• It can be seen that group of hydrocarbons
produces more heat compared to the partiallyoxygenated species, for instance,Y∆(CH4) < Y∆(CH3OH) andY∆(n− alkanes) < Y∆(glucose).
• The comparison of the growth factors betweenvarious bacteria is tabulated in the next slide.
EKC271 – p. 142/161
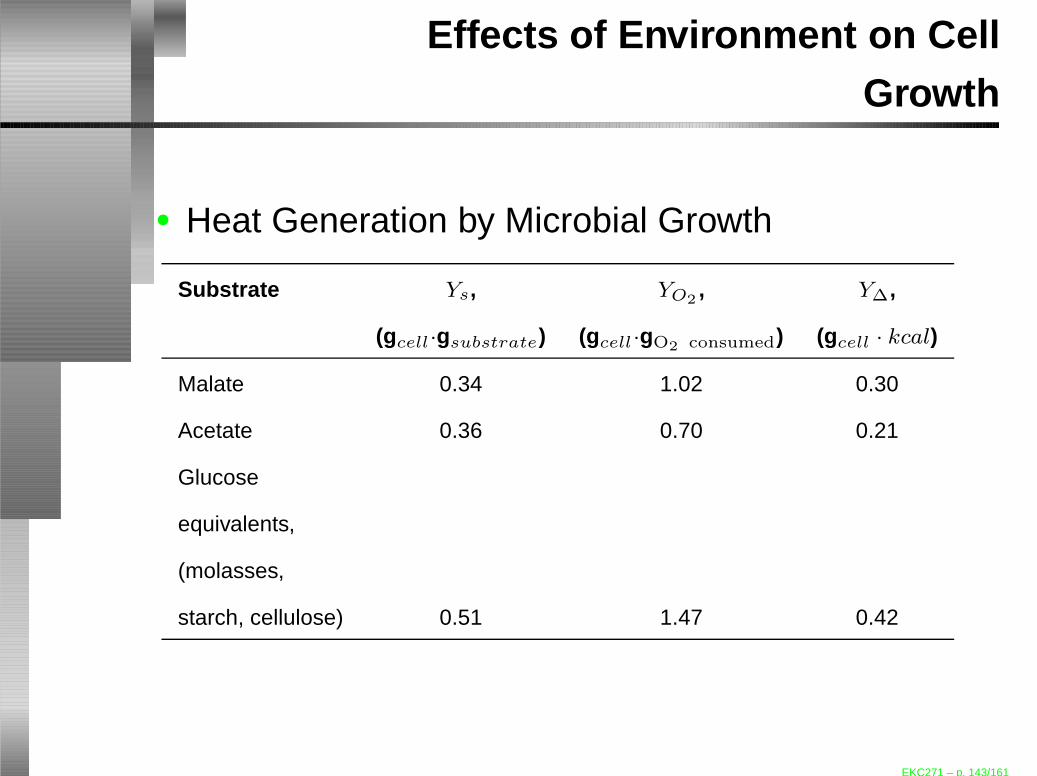
Effects of Environment on CellGrowth
• Heat Generation by Microbial Growth
Substrate Ys, YO2, Y∆,
(gcell·gsubstrate) (gcell·gO2 consumed) (gcell · kcal)
Malate 0.34 1.02 0.30
Acetate 0.36 0.70 0.21
Glucose
equivalents,
(molasses,
starch, cellulose) 0.51 1.47 0.42
EKC271 – p. 143/161
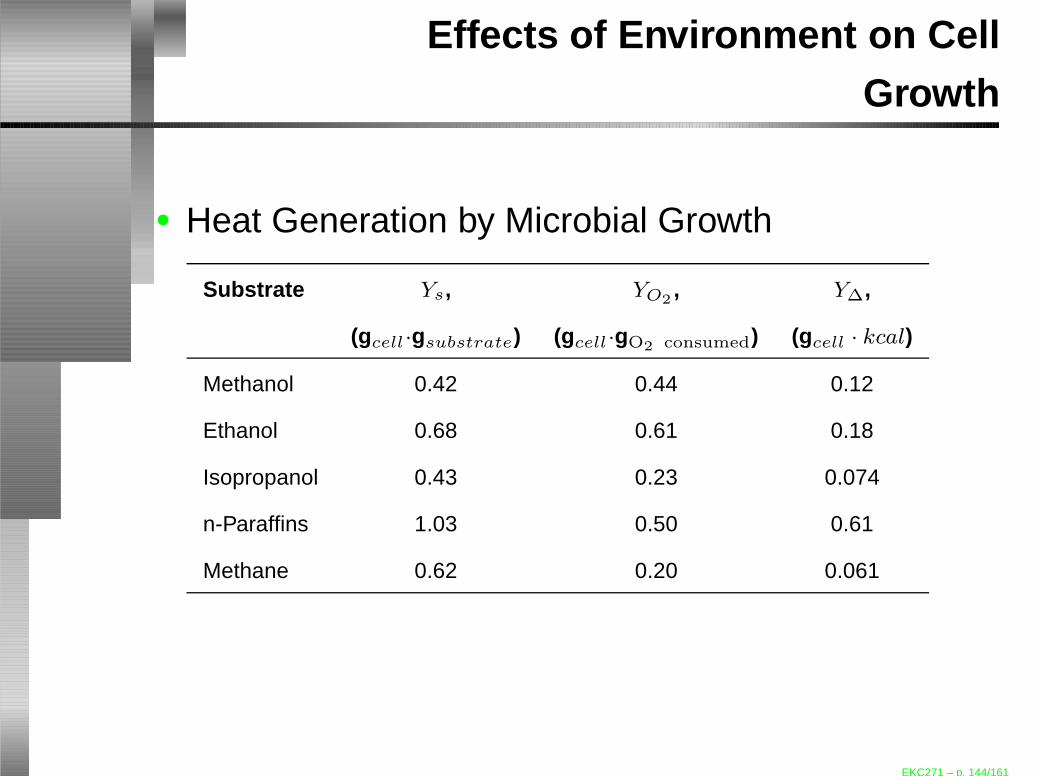
Effects of Environment on CellGrowth
• Heat Generation by Microbial Growth
Substrate Ys, YO2, Y∆,
(gcell·gsubstrate) (gcell·gO2 consumed) (gcell · kcal)
Methanol 0.42 0.44 0.12
Ethanol 0.68 0.61 0.18
Isopropanol 0.43 0.23 0.074
n-Paraffins 1.03 0.50 0.61
Methane 0.62 0.20 0.061
EKC271 – p. 144/161
Effects of Environment on CellGrowth
• Heat Generation by Microbial Growth• The heat produced from cellular growth can
also be related to the Gibbs free energy ∆G.• Some of the free energy present in the
substrate dissipates to the surroundingenvironment.
• This is apparent in an aerobic processes, theheat generated may be substantial and to keepthe temperature constant, bioreactors areequipped with either external or internal coolingfacilities.
EKC271 – p. 145/161
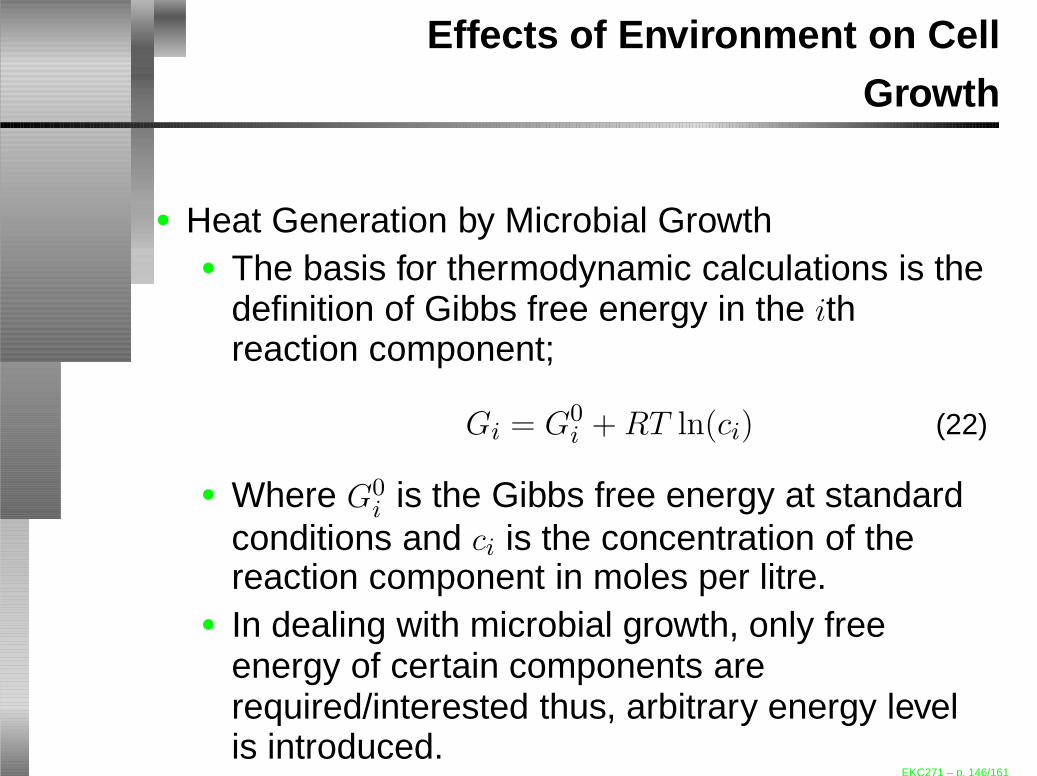
Effects of Environment on CellGrowth
• Heat Generation by Microbial Growth• The basis for thermodynamic calculations is the
definition of Gibbs free energy in the ithreaction component;
Gi = G0i +RT ln(ci) (22)
• Where G0i is the Gibbs free energy at standard
conditions and ci is the concentration of thereaction component in moles per litre.
• In dealing with microbial growth, only freeenergy of certain components arerequired/interested thus, arbitrary energy levelis introduced.
EKC271 – p. 146/161
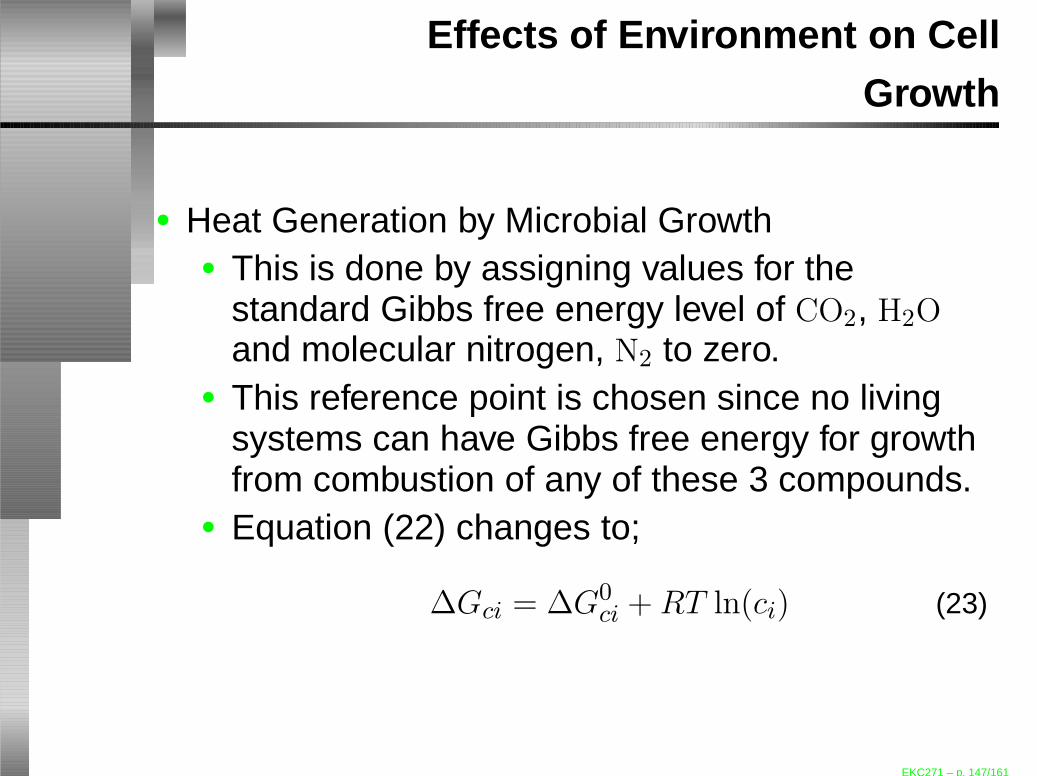
Effects of Environment on CellGrowth
• Heat Generation by Microbial Growth• This is done by assigning values for the
standard Gibbs free energy level of CO2, H2Oand molecular nitrogen, N2 to zero.
• This reference point is chosen since no livingsystems can have Gibbs free energy for growthfrom combustion of any of these 3 compounds.
• Equation (22) changes to;
∆Gci = ∆G0ci +RT ln(ci) (23)
EKC271 – p. 147/161
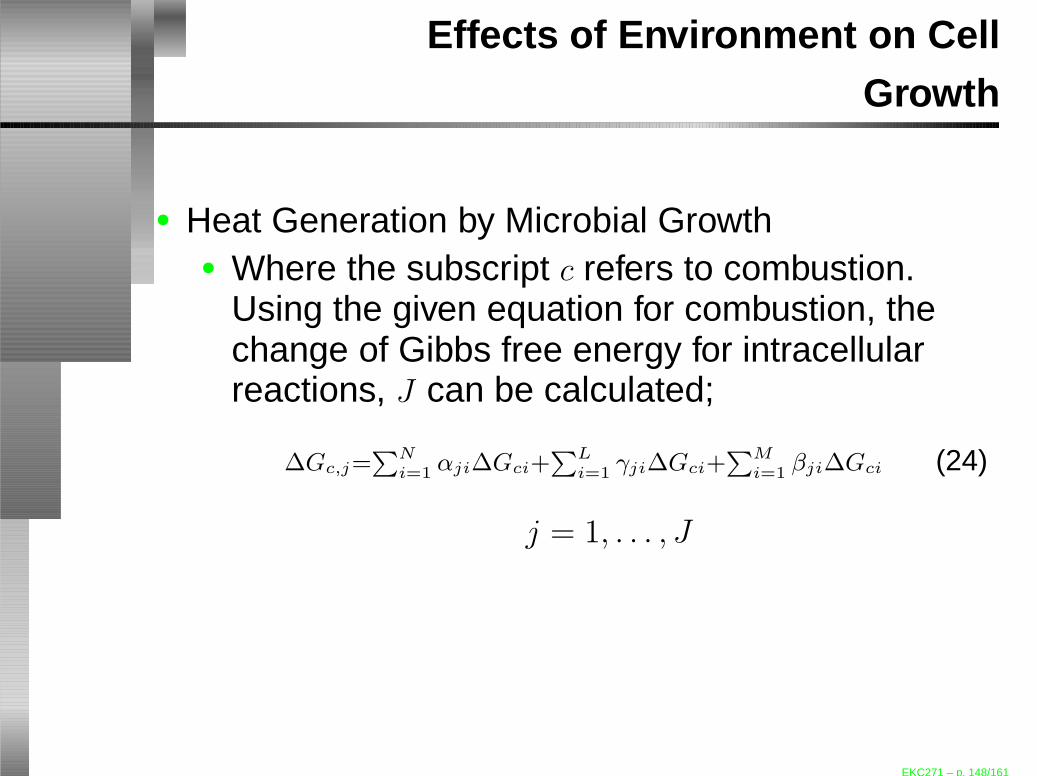
Effects of Environment on CellGrowth
• Heat Generation by Microbial Growth• Where the subscript c refers to combustion.
Using the given equation for combustion, thechange of Gibbs free energy for intracellularreactions, J can be calculated;
∆Gc,j=∑N
i=1αji∆Gci+
∑L
i=1γji∆Gci+
∑M
i=1βji∆Gci (24)
j = 1, . . . , J
EKC271 – p. 148/161

Effects of Environment on CellGrowth
• Heat Generation by Microbial Growth• Where N , L and M refers to substrate, biomass
and metabolic product respectively, while α, βand γ defines the stoichiometric coefficients ofa particular growth equation.
• It follows the conditions:• if ∆Gc,j < 0, the reaction runs spontaneously
in the forward direction.• if ∆Gc,j = 0, the reaction is in equilibrium.
• To calculate the energy dissipation, the lastterm in equation (23) can be omitted since itscontribution to the overall change in free energyin a reaction is negligible.
EKC271 – p. 149/161
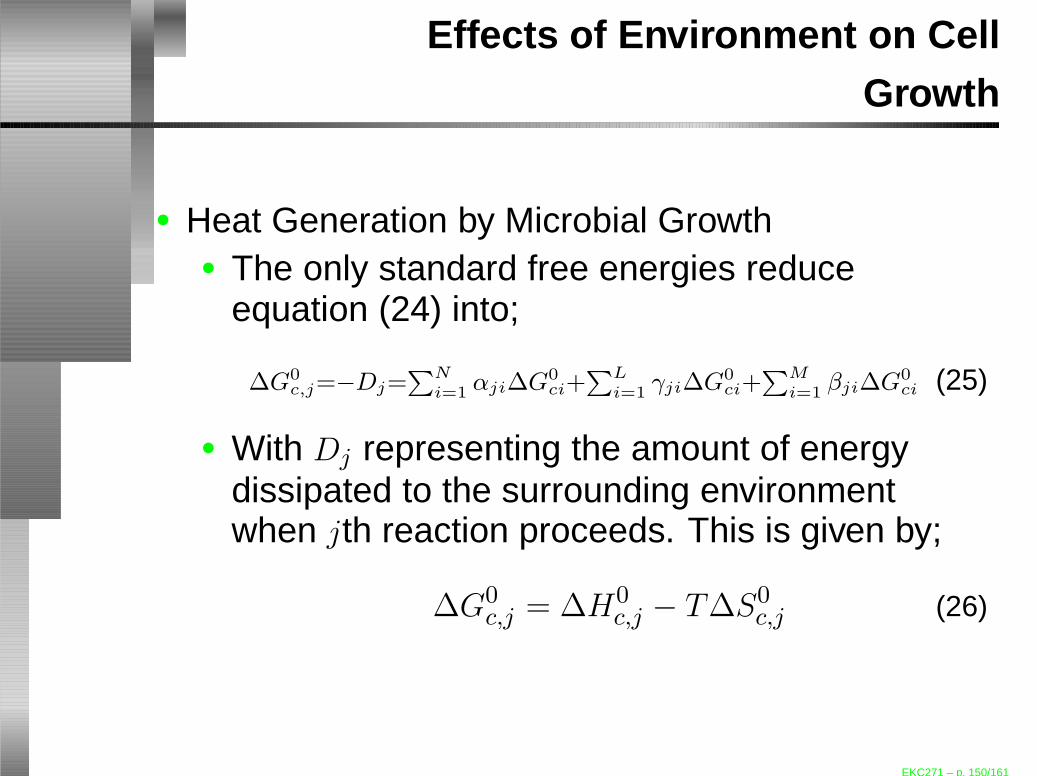
Effects of Environment on CellGrowth
• Heat Generation by Microbial Growth• The only standard free energies reduce
equation (24) into;
∆G0c,j=−Dj=
∑N
i=1αji∆G0
ci+∑L
i=1γji∆G0
ci+∑M
i=1βji∆G0
ci (25)
• With Dj representing the amount of energydissipated to the surrounding environmentwhen jth reaction proceeds. This is given by;
∆G0c,j = ∆H0
c,j − T∆S0c,j (26)
EKC271 – p. 150/161

Effects of Environment on CellGrowth
• Heat Generation by Microbial Growth• Where ∆H0
c,j represents the enthalpy of reactionwhich equals to the generation of heat for thereaction. Similar to equation (25), the enthalpybalance for jth reaction can be set up as;
∆H0c,j=−Qj=
∑N
i=1αji∆H0
ci+∑L
i=1γji∆H0
ci+∑M
i=1βji∆H0
ci; j=1,...,J
(27)• With Qj representing the amount of heat
generated by the jth reaction.
EKC271 – p. 151/161
Effects of Environment on CellGrowth
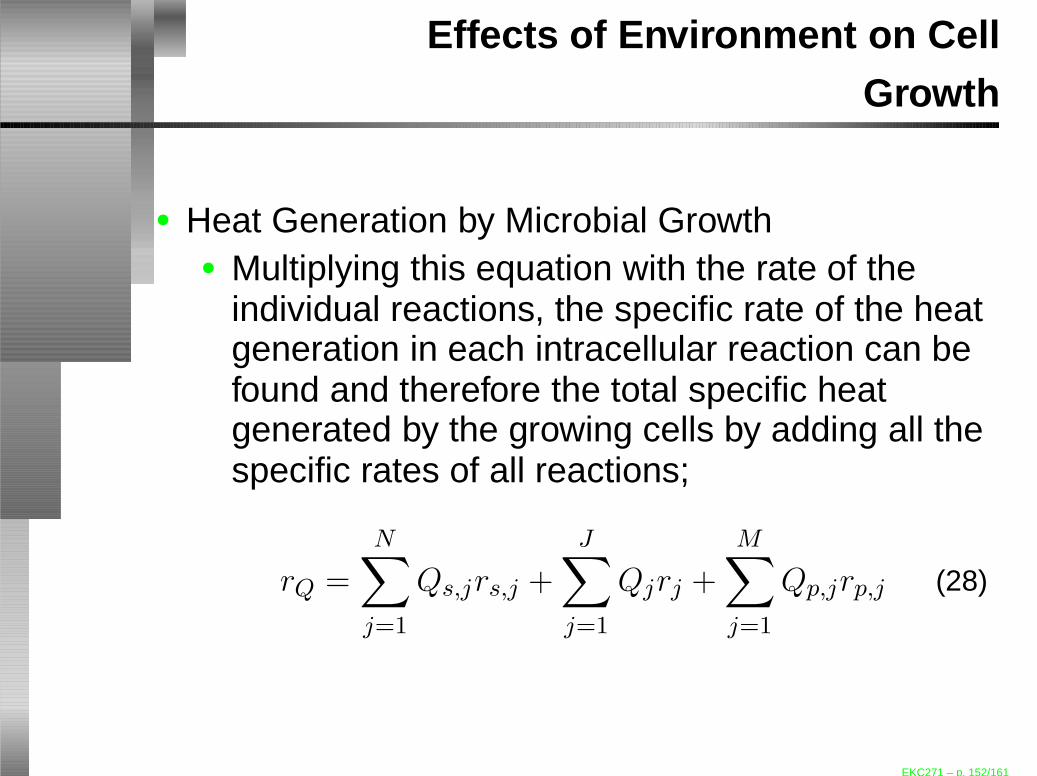
• Heat Generation by Microbial Growth• Multiplying this equation with the rate of the
individual reactions, the specific rate of the heatgeneration in each intracellular reaction can befound and therefore the total specific heatgenerated by the growing cells by adding all thespecific rates of all reactions;
rQ =
N∑
j=1
Qs,jrs,j +
J∑
j=1
Qjrj +
M∑
j=1
Qp,jrp,j (28)
EKC271 – p. 152/161
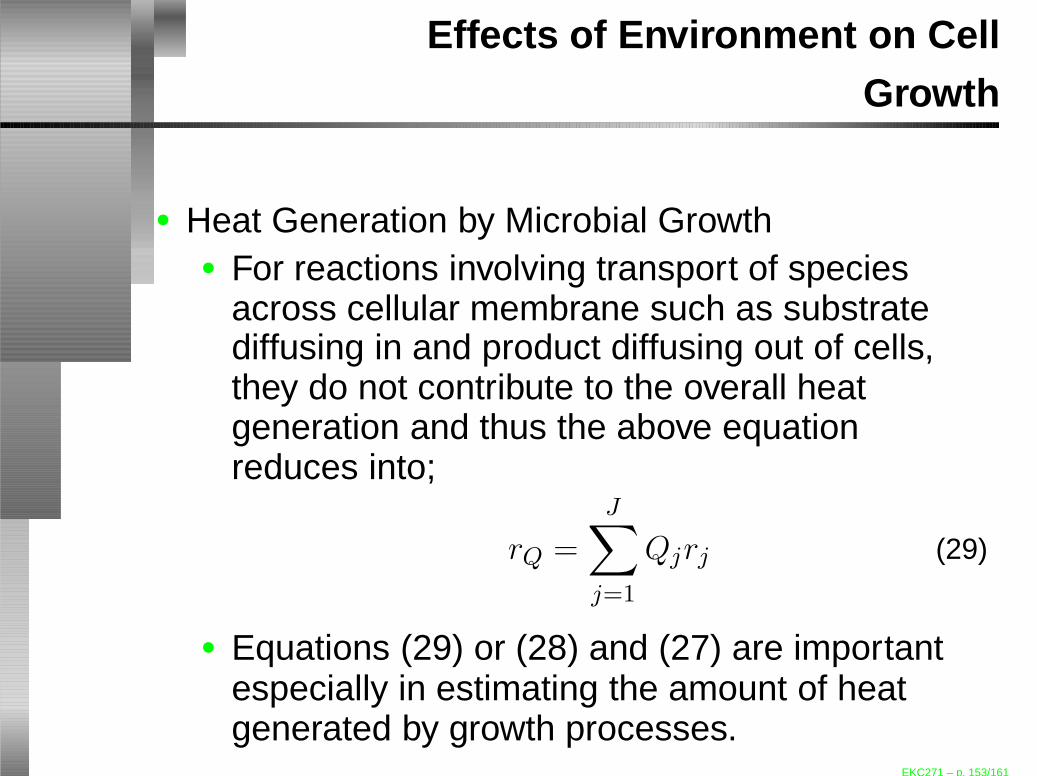
Effects of Environment on CellGrowth
• Heat Generation by Microbial Growth• For reactions involving transport of species
across cellular membrane such as substratediffusing in and product diffusing out of cells,they do not contribute to the overall heatgeneration and thus the above equationreduces into;
rQ =
J∑
j=1
Qjrj (29)
• Equations (29) or (28) and (27) are importantespecially in estimating the amount of heatgenerated by growth processes.
EKC271 – p. 153/161

Effects of Environment on CellGrowth
• Heat Generation by Microbial Growth• A correlation was then proposed by Roels in
1983 to determine the heat of combustion ofseveral compounds and it is given by;
∆H0ci = 115κ∗i (30)
• With the units of kJ per C-mole and κ∗i is definedas the degree of reduction of the ith compoundscalculated on the basis of N2 being the nitrogensource; i.e. the multiplier for nitrogen λN is zero.κ∗i in the above equation is calculated using;
κ∗i = 4 + αi − 2bi.EKC271 – p. 154/161

Effects of Environment on CellGrowth
• Example 3: Calculate the heat generated duringthe growth of Baker’s yeast (Saccharomycescerevisiae) in two different conditions;1. aerobic growth with stoichiometric equation
(without the formation of ethanol) in a definedmedium;
0.600CH1.62O0.53N0.15+0.400CO2+0.649H2O
→CH2O+0.090NH3+0.384O2
EKC271 – p. 155/161
Effects of Environment on CellGrowth
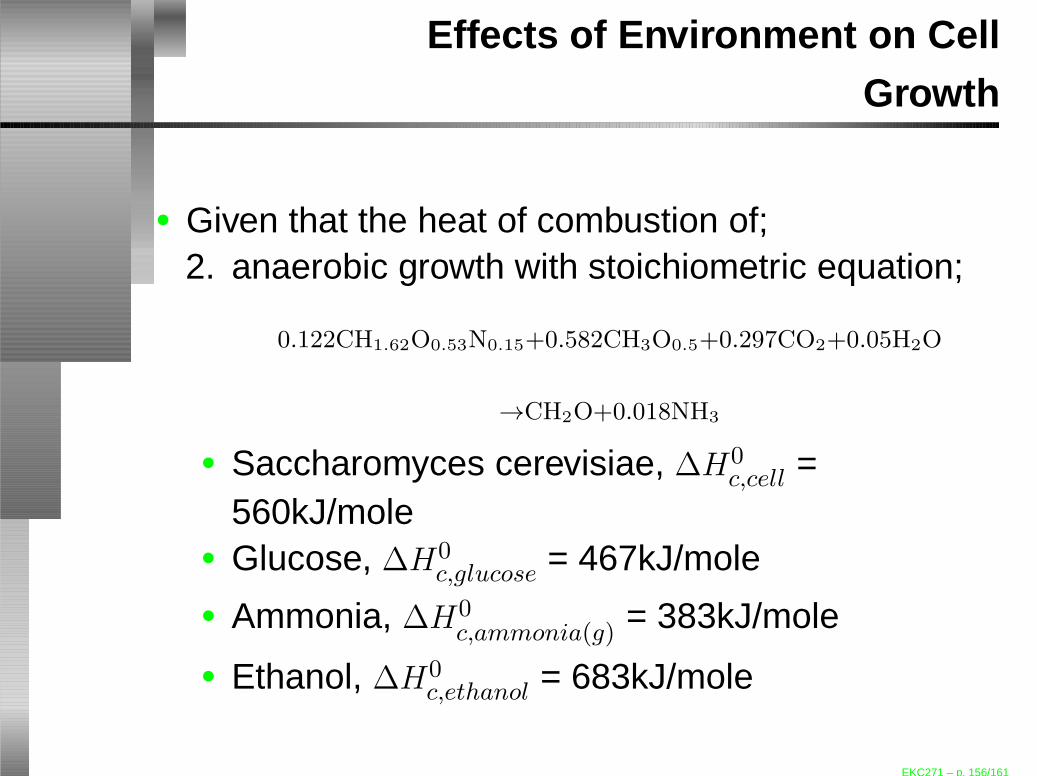
• Given that the heat of combustion of;2. anaerobic growth with stoichiometric equation;
0.122CH1.62O0.53N0.15+0.582CH3O0.5+0.297CO2+0.05H2O
→CH2O+0.018NH3
• Saccharomyces cerevisiae, ∆H0c,cell =
560kJ/mole• Glucose, ∆H0
c,glucose = 467kJ/mole
• Ammonia, ∆H0c,ammonia(g) = 383kJ/mole
• Ethanol, ∆H0c,ethanol = 683kJ/mole
EKC271 – p. 156/161
Effects of Environment on CellGrowth
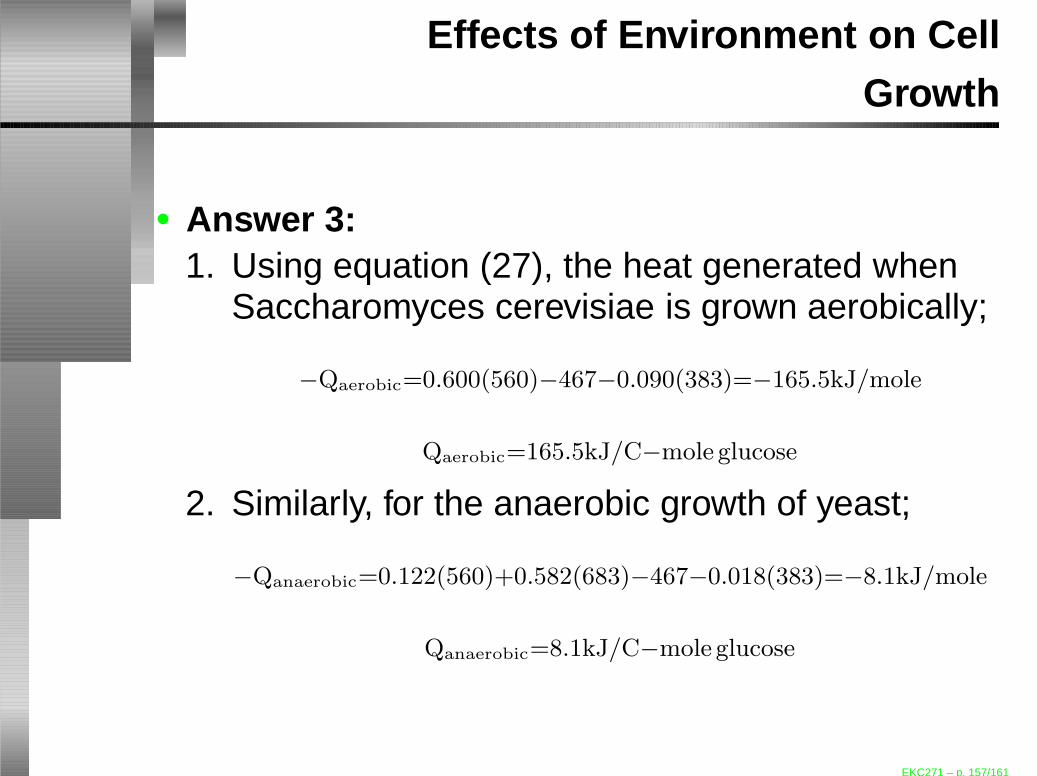
• Answer 3:1. Using equation (27), the heat generated when
Saccharomyces cerevisiae is grown aerobically;
−Qaerobic=0.600(560)−467−0.090(383)=−165.5kJ/mole
Qaerobic=165.5kJ/C−mole glucose
2. Similarly, for the anaerobic growth of yeast;
−Qanaerobic=0.122(560)+0.582(683)−467−0.018(383)=−8.1kJ/mole
Qanaerobic=8.1kJ/C−mole glucose
EKC271 – p. 157/161
Effects of Environment on CellGrowth
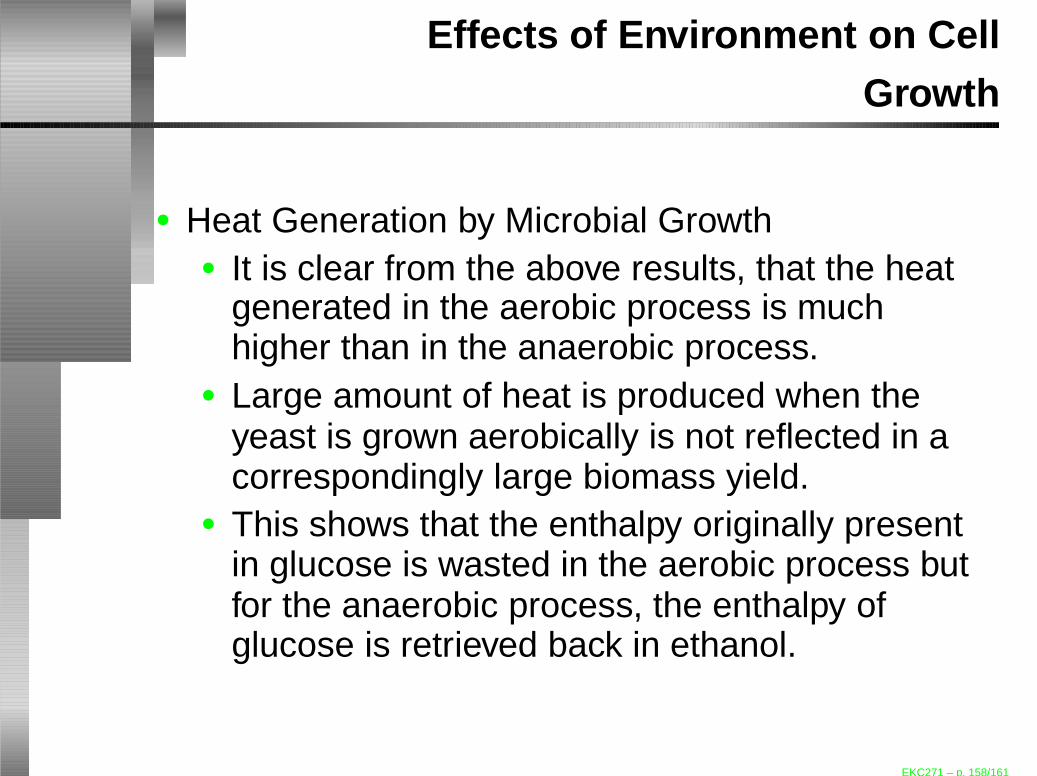
• Heat Generation by Microbial Growth• It is clear from the above results, that the heat
generated in the aerobic process is muchhigher than in the anaerobic process.
• Large amount of heat is produced when theyeast is grown aerobically is not reflected in acorrespondingly large biomass yield.
• This shows that the enthalpy originally presentin glucose is wasted in the aerobic process butfor the anaerobic process, the enthalpy ofglucose is retrieved back in ethanol.
EKC271 – p. 158/161
Effects of Environment on CellGrowth
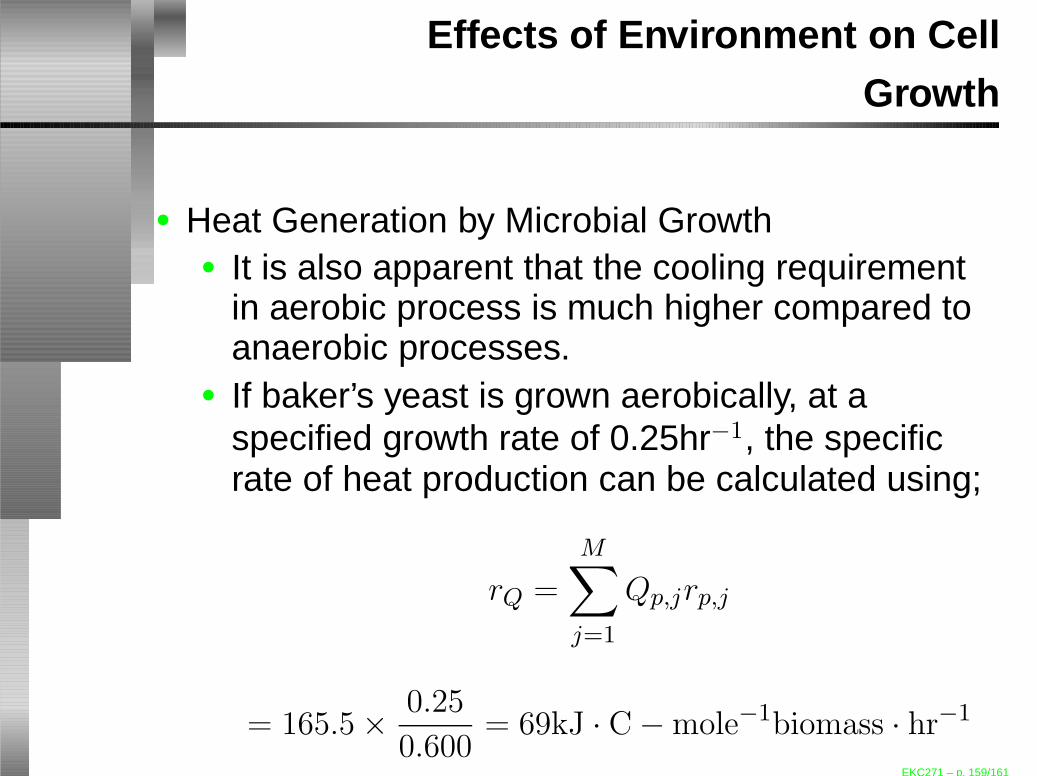
• Heat Generation by Microbial Growth• It is also apparent that the cooling requirement
in aerobic process is much higher compared toanaerobic processes.
• If baker’s yeast is grown aerobically, at aspecified growth rate of 0.25hr−1, the specificrate of heat production can be calculated using;
rQ =
M∑
j=1
Qp,jrp,j
= 165.5×0.25
0.600= 69kJ · C−mole−1biomass · hr−1
EKC271 – p. 159/161
Effects of Environment on CellGrowth
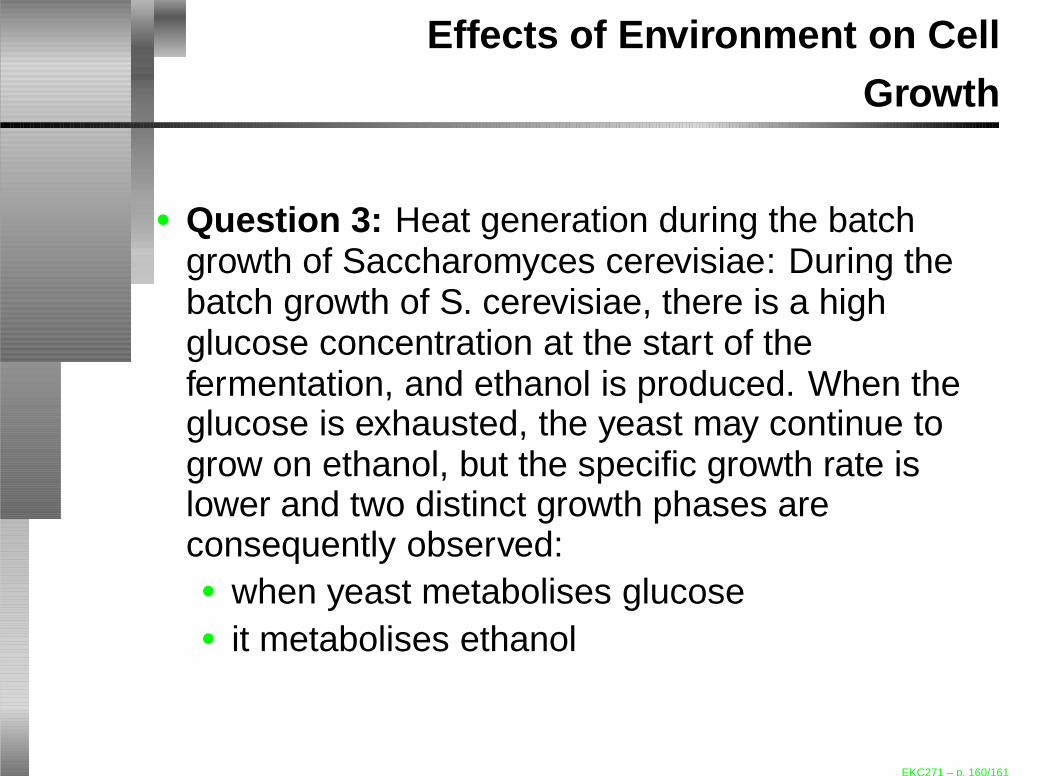
• Question 3: Heat generation during the batchgrowth of Saccharomyces cerevisiae: During thebatch growth of S. cerevisiae, there is a highglucose concentration at the start of thefermentation, and ethanol is produced. When theglucose is exhausted, the yeast may continue togrow on ethanol, but the specific growth rate islower and two distinct growth phases areconsequently observed:• when yeast metabolises glucose• it metabolises ethanol
EKC271 – p. 160/161

Effects of Environment on CellGrowth
• Question 3: Such a growth is known as diauxicgrowth and can be described by the givenstoichiometric equations:
CH1.6O0.5N0.15+2.06CH3O0.5+2.20CO2+1.59H2O
→5.26CH2O+0.15NH3+1.13O2
and
CH1.6O0.5N0.15+0.59CO2+1.81H2O→1.59CH3O0.5+0.15NH3+1.35O2
EKC271 – p. 161/161

Effects of Environment on CellGrowth
• Question 3: Given that the reaction/growth ratefor the first equation with glucose,µglucose = 0.35hr−1 and for the second equation withethanol, µethanol = 0.15hr−1. Calculate the heat ofproduction in each of the two reactions using theheat of combustion given in Example 3 .
EKC271 – p. 162/161