Embed Size (px)
Citation preview
Biotechnology Explorer™
Crime Scene Investigator PCR Basics™ Kit: A Real-Time PCR Extension
Application Note

Introduction . . . . . . . . . . . . . . . . . . . . . . . . . . . . . . . . . . . . . . . . . . . . . . 2
Learning Objectives . . . . . . . . . . . . . . . . . . . . . . . . . . . . . . . . . . . . . . 2
Real-Time PCR Background Information for Instructors . . . . . . 3
Experimental Protocol . . . . . . . . . . . . . . . . . . . . . . . . . . . . . . . . . . . . 8
Laboratory 1: Full Crime Scene Investigator Kit Protocol,
run on a Real-Time PCR Instrument . . . . . . . . . . . . . . . . . . . . . 9
Laboratory 2: Use the Crime Scene Kit DNA and Primers
to Demonstrate Quantitative PCR . . . . . . . . . . . . . . . . . . . . . . . 12
Conclusions . . . . . . . . . . . . . . . . . . . . . . . . . . . . . . . . . . . . . . . . . . . . . . 16
Glossary . . . . . . . . . . . . . . . . . . . . . . . . . . . . . . . . . . . . . . . . . . . . . . . . . 18
References . . . . . . . . . . . . . . . . . . . . . . . . . . . . . . . . . . . . . . . . . . . . . . 22
Table of Contents
Biotechnology Explorer Crime Scene Investigator PCR Basics™ Kit:
A Real-Time PCR Extension
Application Note
This application note was
developed in collaboration with
Dr. David Palmer of Contra Costa
Community College and Drs.
Linnea Fletcher and Trish Phelps
of Austin Community College.
We'd like to thank each of them
for the invaluable guidance and
contribution each provided to
this activity.

This application note covers the use of the Crime Scene Investigator PCR Basics kit as a foundation for a teaching lab demonstration and use of real-time PCR technology.
The Biotechnology Explorer Crime Scene Investigator PCR Basics kit is a tool for teaching students the principles of the polymerase chain reaction (PCR) and its use inforensic DNA analysis. Real-time PCR is an extremely important technology, useful in food analysis, gene expression analysis, and many other applications in which the goal is to not only ask “what DNA is present” but also “how much".
To teach the basics of real-time PCR in the classroom with the Crime Scene Investigatorkit reagents simply substitute the Taq polymerase mastermix with iQ™ SYBR® Greensupermix, use strip tubes and optical flat caps, and amplify the reactions on a real-timeBio-Rad PCR instrument such as the MiniOpticon™. Although the Crime SceneInvestigator PCR Basics kit was developed for conventional PCR and end-point analysisof amplification products by gel electrophoresis, this kit can be easily adapted for instruction in real-time PCR.
Given the robustness of the Crime Scene Investigator kit and the expense of the real-time PCR reagents, this kit is a good starting point for novices to become familiarwith real-time PCR techniques. Since genotyping rather than quantitation is the goal forDNA fingerprinting, real-time PCR is not used in real world STR analysis that the CrimeScene Investigator kit simulates. However, the real-time PCR application that this kit offers is a rich opportunity to learn the principles and techniques of real-time quantitativePCR. Additionally, the DNA fingerprints can still be investigated using gel electrophoresisand melt-curve analysis showing how real-time and conventional PCR can be complimentary techniques.
At the end of this exercise, students will:
• Discover key differences between the goals of conventional PCR and real-time PCR analysis
• Analyze and evaluate real-time PCR results • Learn the advantage of melt-curve analysis of the SYBR® Green I detection chemistry
and compare this with final amplification products using agarose gel analysis • Determine the accuracy and reliability of pipeting techniques by preparing duplicate
or triplicate serial dilutions of template DNA• Discover the sensitivity of PCR and how little template is required for detectable
amplification results• Understand how real-time PCR can quantitate the DNA in a sample• Develop an understanding of the molecular basis of DNA amplification reactions
using real-time thermal cyclers
Biotechnology Explorer Crime Scene Investigator PCR Basics™ Kit:
A Real-Time PCR Extension
Application Note
1-800-4BIORAD (1-800-424-6723) 2
Introduction
Learning Objectives

1-800-4BIORAD (1-800-424-6723) 3
Applications of Real-Time PCRPCR has found so many applications in the biotechnology lab that it has been said: “PCR is to biology what petroleum is to transportation” (Pray, 2004). Although there havebeen many ways that PCR has been adapted for the detection of specific nucleic acids incells, real-time PCR is becoming the most widely used application of PCR in the researchlab for genomic and gene expression analysis, and is rapidly establishing itself as a technique in the clinical diagnostic lab (Bustin et al, 2005; Kubista, 2006; Leutenegger,2001; Mackay, 2004; Stevens, 2003). The need for faster, more accurate, and more economical systems with a high throughput has fueled the popularity of real-time PCR.
Using genomic DNA as the template for amplification, real-time PCR can be used in infectious disease diagnostics to rapidly determine levels of specific pathogens in varioustissues (Mackay, 2004; Leutenegger, 2001; Stevens, 2003; Templeton, 2003). The molecular diagnostic lab also relies heavily on real-time PCR for detection of aneuploidiesand the diagnosis of other genetic diseases (Gibson, 2006; Jiang, 2004; Stevens, 2003;Watson, 2005). In microbiology labs, real-time PCR can be used to detect and quantitatevarious microbial contaminants in environmental samples (Mackay, 2004). This approachis especially invaluable in the analysis of microbes that are difficult to grow in culture.
Alternatively, using RNA as the template, reverse transcriptase can be used to generateDNA template for real-time PCR reactions, a strategy referred to as quantitative reversetranscriptase PCR (qRT-PCR), or as transcription-mediated amplification (TMA). Thisapproach has become a valuable tool in the study of gene expression, where changes in transcription levels of various mRNAs can be compared with those of a gene that does not undergo changes in transcription, most often these tend to be the so-called“housekeeping genes”. This technique has also become an important assay in the molecular diagnostic lab, where it can be used to determine the viral loading by retroviruses, or to diagnose disease by expression profiles (Bernard, 2002; Bustin &Mueller, 2005; Kubista, 2006; Saleh-Lakha, 2005; Wong, 2005).
Theory of Real-Time PCRConventional PCR does well to detect the presence of the DNA that the primer pair targets. Conventional PCR detects the amplified product (amplicon) by an end-pointanalysis — running the DNA on an agarose gel after the reactions are completed. If thetarget DNA sequence is not there, no amplicon will appear on the agarose gel. If as little as a single DNA molecule that contains the target DNA sequence is in the sample,the amplification by 25-30 cycles is sufficient to generate detectable amplicons via electrophoresis. Thus, conventional PCR makes a highly sensitive assay for specific DNA sequence, which is useful for the diagnosis of diseases, especially viral types. It isalso a rapid, highly sensitive and specific assay for microbes in environmental samples.Through the use of reverse transcriptase, conventional PCR has also become the standard for the detection of RNA targets, useful for analysis of gene expression inresearch and medical diagnosis. In this case, reverse transcriptase generates DNA from an RNA template, forming a template for the PCR polymerase amplification.
Real-time PCR is based on the same principles as conventional PCR. The reactionrequires both forward and reverse primers bracketing the target region (amplicon),nucleotides, and a DNA polymerase such as Taq. However, real-time PCR allows theaccumulation of amplified product to be detected and measured as the reaction progresses — in “real time”. The difference is the addition of a fluorescence chemistry,which enables product amplification to be monitored throughout the entire real time reaction using specialized Bio-Rad thermal cyclers equipped with fluorescence detectionmodules. The measured fluorescence reflects the amount of amplified product in eachcycle. Real-time PCR results can either be qualitative (presence or absence of asequence) or quantitative (number of copies of DNA). Real-time PCR that is quantitative is also known as qPCR. The main advantage of using real-time PCR over conventionalPCR is that real-time PCR allows you to determine the starting template copy number
Real-Time PCRBackground
Information forInstructors
Biotechnology Explorer Crime Scene Investigator PCR Basics™ Kit:
A Real-Time PCR Extension
Application Note

1-800-4BIORAD (1-800-424-6723) 4
with accuracy and high sensitivity over a wide dynamic range. Conventional PCR can at best be semi-quantitative and the methods to obtain quantitative data can be quite complicated. One advantage of conventional PCR is better determination of the sizes ofthe amplified PCR products using conventional gel electrophoresis. Therefore, separatingthe real-time PCR products on a gel following amplification allows the visualization anddetermination of the size of the amplified products.
How Real-Time PCR WorksTo best understand how real-time PCR works, think of what is happening in a PCR reaction. During the first cycles of a PCR reaction, the amount of amplicon doubles. The amount of amplicon after each cycle then multiplies exponentially in proportion to the starting amount of template in the sample. At some point, this doubling slows as theamount of substrate, nucleotides, and primers become used up. The DNA polymerasealso becomes less active after the prolonged heating within the thermal cycler. The loss of doubling efficiency results in a plateau effect and the amount of amplicon producedwith the later thermal cycles is no longer proportional to the amount of template DNA inthe sample (Figure 1). After enough cycles, all amplicons reach a certain maximum concentration, regardless of the initial concentration of template DNA.
Figure 1. Amplification plot. During the exponential phase, the amount of PCR product approximately doubles ineach cycle. As the reaction proceeds and reaction components are consumed, the reaction slows and enters theplateau phase.
The key to determining the quantity of original template DNA present in a sample duringamplification is to examine the initial thermal cycles before reaching the plateau region ofamplification. To do this, the level of amplification is monitored continuously during thethermal cycling. Initially, fluorescence remains at background levels, and increases in fluorescence are not detectable (cycles 1-18 in Figure 1) even though PCR product accumulates exponentially. Eventually, enough amplified product accumulates to yield a detectable fluorescent signal. The cycle number at which this occurs is called thethreshold cycle, or CT. Since the CT value is measured in the exponential phase whenreagents are not limited, real-time qPCR can be used to reliably and accurately calculatethe initial amount of template present in the reaction.
The CT of a reaction is determined mainly by the amount of template present at the startof the amplification reaction. If a large amount of template is present at the start of thereaction, relatively few amplification cycles will be required to accumulate enough productto give a fluorescent signal above background. Thus, the reaction will have a low, or early,CT. In contrast, if a small amount of template is present at the start of the reaction, moreamplification cycles will be required for the fluorescent signal to rise above background.Thus, the reaction will have a high, or late, CT. This relationship forms the basis for thequantitative aspect of real-time PCR.
Biotechnology Explorer Crime Scene Investigator PCR Basics™ Kit:
A Real-Time PCR Extension
Application Note

1-800-4BIORAD (1-800-424-6723) 5
Optimizing a Real-Time Quantitative PCR Assay (qPCR)Since real-time quantitation is based on the relationship between initial template amountand the CT value obtained during amplification, an optimal qPCR assay is absolutelyessential for accurate and reproducible quantitation of your particular sample. The hallmarks of an optimized qPCR assay are:
• Linear standard curve (R2 > 0.980 or r > I-0.990I)• Consistency across replicate reactions
A powerful way to determine whether your qPCR assay is optimized is to run a set of serial dilutions of template DNA and use the results to generate a standard curve. Thetemplate used for this purpose can be a target with known concentration (for example,nanograms of genomic DNA or copies of plasmid DNA) or a sample of unknown quantity(for example, cDNA). A standard curve is constructed by plotting the log of the startingquantity of template (or the dilution factor, for unknown quantities) against the CT valueobtained during amplification of each dilution. The equation of the linear regression line,along with Pearson’s correlation coefficient (r) or the coefficient of determination (R2), canthen be used to evaluate whether your qPCR assay is optimized.
Ideally, the dilution series will produce amplification curves that are evenly spaced, asshown in Figure 2A. If perfect doubling occurs with each amplification cycle, the spacingof the fluorescence curves will be determined by the equation 2n = dilution factor, where n is the number of cycles between curves at the fluorescence threshold (in other words,the difference between the CT values of the curves). For example, with a 10-fold serialdilution of DNA, 2n = 10. Therefore, n = 3.32, and the CT values should be separated by 3.32 cycles. Evenly spaced amplification curves will produce linear standard curves, as shown in Figure 2B. The equation and r values of the linear regression lines are shown above the plot.
The r or R2 value of a standard curve represents how well the experimental data fit theregression line; that is, how linear the data are. Linearity, in turn, gives a measure of thevariability across assay replicates and whether the amplification efficiency is the same fordifferent starting template copy numbers. A significant difference in observed CT valuesbetween replicates will lower the r or R2 value. You should strive for an r whose absolutevalue is >0.990 or and R2 value >0.980 for your qPCR reactions.
Figure 2. Generating a standard curve to assess reaction optimization. A standard curve was generated usinga 10-fold dilution of a template amplified on the iCycler IQ® real-time system. Each dilution was assayed in triplicate.A. Amplification curves of the dilution series. B. Standard curve with the CT plotted against the log of the startingquantity of template for each dilution. The equation for the regression line and the r value are shown above the graph.
Biotechnology Explorer Crime Scene Investigator PCR Basics™ Kit:
A Real-Time PCR Extension
Application Note
A
B

1-800-4BIORAD (1-800-424-6723) 6
Chemistries for Monitoring Real-Time PCRA key step in designing a qPCR assay is selecting the chemistry to monitor the amplification of the target sequence. The variety of fluorescent chemistries available canbe categorized into two major types:
• DNA-binding dyes (SYBR® Green I) • Dye-labeled, sequence specific oligonucleotide primers or probes
(molecular beacons, TaqMan assays, and hybridization probes)
The most commonly used chemistries for real-time PCR are the DNA-binding dye SYBR® Green I and TaqMan hydrolysis probe. We provide an overview of SYBR® Green Ifluorescence chemistry below. For more information regarding TaqMan and other dye-labeled primers or probes please refer to Bio-Rad Laboratories’ Real-Time PCRApplications Guide (170-9799EDU).
SYBR® Green I is a DNA dye that binds non-discriminately to double-stranded DNA(dsDNA). SYBR® Green I exhibits minimal fluorescence when it is free in solution, but its fluorescence increases dramatically (up to 1000-fold) upon binding to dsDNA (Figure 3).As the PCR reaction progresses the amplified product accumulates exponentially, moreSYBR® Green I binds, and fluorescence increases. The advantage of using SYBR® GreenI is its simplicity. This is similar to the action of ethidium bromide, but unlike ethidium bromide, SYBR® Green I does not interfere with DNA polymerases, so it can be addeddirectly to a PCR reaction mixture. SYBR® Green I also has less background fluorescencethan does ethidium bromide, is able to detect lower concentrations of double-strandedDNA, and is not hazardous.
Figure 3. DNA-binding dyes in real-time PCR. Fluorescence dramatically increases when the dye moleculesbind to double-stranded DNA.
Other advantages of using a dye that binds only to dsDNA such as SYBR® Green I includesimple assay design (only two primers are needed; probe design is not necessary),ability to test multiple genes quickly without designing multiple probes (for example, forvalidation of gene expression data from many genes in a microarray experiment), lowerinitial cost (probes cost more), and the ability to perform a melt-curve analysis to checkthe specificity of the amplification reaction.
Biotechnology Explorer Crime Scene Investigator PCR Basics™ Kit:
A Real-Time PCR Extension
Application Note

1-800-4BIORAD (1-800-424-6723) 7
The main disadvantage to the use of SYBR® Green I is its nonspecificity. Since it will bind to any double-stranded DNA, you cannot distinguish between the amplification oftarget DNA and the amplification of primer-dimers. Also, if non-target sequences arebeing amplified, this will show up in a SYBR® Green I fluorescence curve and will be indistinguishable from amplification of target sequence. For this reason, when using SYBR® Green I it is prudent to verify that target DNA is being amplified; this is commonlydone by running an agarose gel of the reaction products (conventional PCR). Alternatively,post amplification melt-curve analysis can be performed on the real-time PCR instrumentto distinguish reaction products and analyze reaction specificity, eliminating the need foragarose gel analysis of reaction products.
Melt-Curve AnalysisThe principle of the melt-curve analysis is that the temperature is increased from a lowtemperature (where all sequences are annealed) to a high temperature causing strand dissociation. As the dsDNA melts, SYBR® Green I is released and a decrease in fluorescence is observed. Two factors are important in melting temperatures: the size of the double-stranded DNA and the GC content. The higher the GC content and thelarger the strand size, the higher the melting temperature will be. By comparing the melt temperatures of known amplicons, the presence of an extra non-target amplicon or primer-dimers is easily detected.
In a typical melt-curve, the fluorescence intensity is plotted against the temperature. The fluorescence decreases as the temperature increases and as the dsDNA becomesdenatured. There are two distinct stages to the curve: the rapid loss of fluorescence asthe DNA begins to melt and the slower loss of fluorescence as the last of the dsDNA disassociates. Software can also plot the negative first derivative of the rate of change of fluorescence vs. temperature (-d(RFU)/dT). A characteristic peak at the amplicon’smelting temperature (Tm, the temperature at which 50% of the base pairs of a DNAduplex are separated) distinguishes it from other products such as primer-dimers, whichmelt at different temperatures. An example of this is shown in Figure 4. The melt peakwith a Tm of 89°C represents the specific product, and corresponds to the upper band in lanes 2 and 3 on the gel. The peak with a Tm of 78°C represents the nonspecific product, and corresponds to the lower bands in lanes 2 and 3 on the gel.
Figure 4. Melt-curve analysis of reaction product from a SYBR® Green I assay. The melt-curve analysis function of real-time instruments can be used to distinguish specific products from non-specific products. A. The negative first derivative of the change in fluorescence is plotted as a function temperature. The two peaksindicate the Tm values of two PCR products. B. Gel analysis of the qPCR products. Lane 1, AmpliSize® 50-2,000base pairs (bp) molecular ruler; lanes 2 and 3, two replicates of qPCR product from the reaction shown in (A). The two PCR products are revealed by separate bands in the gel.
Biotechnology Explorer Crime Scene Investigator PCR Basics™ Kit:
A Real-Time PCR Extension
Application Note

1-800-4BIORAD (1-800-424-6723) 8
Special PrecautionsIt is imperative that best laboratory practices are followed when performing real-time PCR experiments. Given the extreme sensitivity of PCR, extra precautions must be takento avoid cross contamination of template sources in equipment and reagents. Make sureto use a fresh pipet tip at each pipeting step. To avoid contamination of the micropipetsthemselves, the use of filtered tips is strongly advised. Gloves should be worn while performing a PCR experiment and they should be changed frequently to avoid cross contamination of DNA. Work areas should also be kept DNA-free. Note that ethanol is not an effective way to clean your work area. DNA is not soluble in ethanol and thereforeethanol does a poor job of removing DNA. A 10% bleach solution is probably the bestapproach as it will hydrolyze as well as dissolve the DNA. A consumer pump spray likeFormula 409 or Fantastik can be an effective alternative to applying bleach to affectedsurfaces. In addition, screwcap tubes prevent spraying of your precious sample when youopen the lid and help reduce contamination of gloved fingers when you open the tube.
Many people cannot pipet 2 µl reproducibly. It is difficult to tell when the volume is incorrect because of a loose tip or a worn and unreliable pipetor. One can visualize 5 µl in the tip and can usually tell if the volume is incorrect. Using pooled master mixes forreplicate sample tubes can improve the assay’s reproducibility by avoiding multiple pipeting steps and the necessity of pipeting small volumes. After transferring into a solution, rinse the pipet tip by gently pumping up and down into the solution several times to mix the sample and make the transfer more quantitative. Remember to vortexand spin samples down with a centrifuge before PCR, especially after thawing frozensamples. Finally, because real-time PCR relies on the optical detection of fluorescencecoming from the PCR reaction itself, care must be taken to avoid introducing bubbles orfoam into the PCR tubes before beginning the reaction.
Materials and MethodsThe Crime Scene Investigator PCR Basics kit is designed to simulate real-world forensicDNA analysis at a single locus: amplified suspect DNA is compared to amplified crimescene DNA and the results are compared on an agarose gel. This kit can be extended todemonstrate real-time PCR in two different labs. Each may be performed separately orrun in sequence for greater depth of understanding and increased hands-on experience.
Laboratory 1 preserves the original intent of the Crime Scene Investigator kit. It allows students to observe real-time PCR as the reactions progress and allows the students to amplify and compare suspect versus crime scene DNA samples using agarose gel electrophorsis.
Laboratory 2 is more advanced, and modifies the Crime Scene Investigator kit protocol toinclude a DNA dilution series and an optional very fast PCR protocol. This lab allows for arapid demonstration of the quantitative nature of real-time PCR and melt-curve analysis,and in doing so uses an entirely different experimental design than the core Crime SceneInvestigator kit.
Biotechnology Explorer Crime Scene Investigator PCR Basics™ Kit:
A Real-Time PCR Extension
Application Note
Experimental Protocol
Educators not familiar with the basic principles of real-time PCR may also wish to
purchase the Bio-Rad Real-Time PCR Applications Guide (170-9799EDU), as it provides
an excellent tutorial on the theory and application of quantitative PCR. Bio-Rad’s
Amplification Central is also an excellent online source of information on real-time PCR
including PCR Doctor, animations and other interactive tools. For more information
please visit us at www.bio-rad.com/genomics/pcrsupport
1-800-4BIORAD (1-800-424-6723) 9
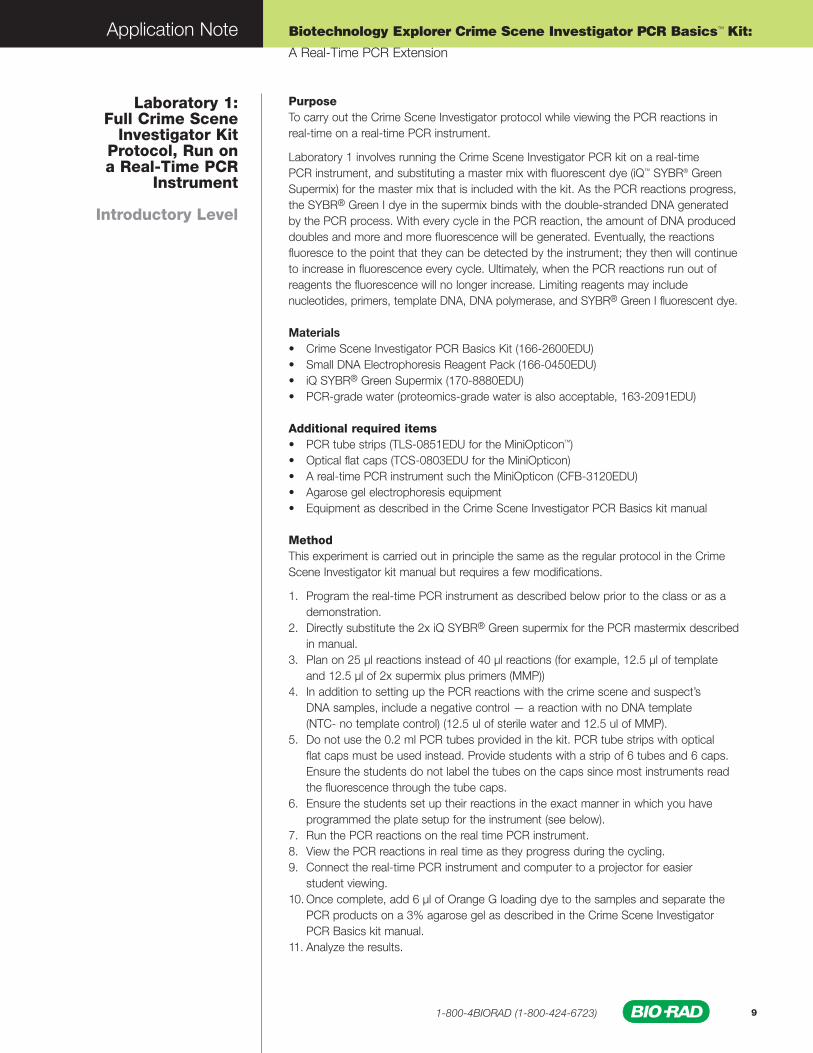
PurposeTo carry out the Crime Scene Investigator protocol while viewing the PCR reactions inreal-time on a real-time PCR instrument.
Laboratory 1 involves running the Crime Scene Investigator PCR kit on a real-time PCR instrument, and substituting a master mix with fluorescent dye (iQ™ SYBR® GreenSupermix) for the master mix that is included with the kit. As the PCR reactions progress,the SYBR® Green I dye in the supermix binds with the double-stranded DNA generatedby the PCR process. With every cycle in the PCR reaction, the amount of DNA produceddoubles and more and more fluorescence will be generated. Eventually, the reactions fluoresce to the point that they can be detected by the instrument; they then will continueto increase in fluorescence every cycle. Ultimately, when the PCR reactions run out ofreagents the fluorescence will no longer increase. Limiting reagents may includenucleotides, primers, template DNA, DNA polymerase, and SYBR® Green I fluorescent dye.
Materials• Crime Scene Investigator PCR Basics Kit (166-2600EDU)• Small DNA Electrophoresis Reagent Pack (166-0450EDU)• iQ SYBR® Green Supermix (170-8880EDU)• PCR-grade water (proteomics-grade water is also acceptable, 163-2091EDU)
Additional required items• PCR tube strips (TLS-0851EDU for the MiniOpticon™) • Optical flat caps (TCS-0803EDU for the MiniOpticon)• A real-time PCR instrument such the MiniOpticon (CFB-3120EDU)• Agarose gel electrophoresis equipment• Equipment as described in the Crime Scene Investigator PCR Basics kit manual
MethodThis experiment is carried out in principle the same as the regular protocol in the CrimeScene Investigator kit manual but requires a few modifications.
1. Program the real-time PCR instrument as described below prior to the class or as a demonstration.
2. Directly substitute the 2x iQ SYBR® Green supermix for the PCR mastermix described in manual.
3. Plan on 25 µl reactions instead of 40 µl reactions (for example, 12.5 µl of template and 12.5 µl of 2x supermix plus primers (MMP))
4. In addition to setting up the PCR reactions with the crime scene and suspect’s DNA samples, include a negative control — a reaction with no DNA template (NTC- no template control) (12.5 ul of sterile water and 12.5 ul of MMP).
5. Do not use the 0.2 ml PCR tubes provided in the kit. PCR tube strips with optical flat caps must be used instead. Provide students with a strip of 6 tubes and 6 caps. Ensure the students do not label the tubes on the caps since most instruments read the fluorescence through the tube caps.
6. Ensure the students set up their reactions in the exact manner in which you have programmed the plate setup for the instrument (see below).
7. Run the PCR reactions on the real time PCR instrument.8. View the PCR reactions in real time as they progress during the cycling.9. Connect the real-time PCR instrument and computer to a projector for easier
student viewing.10. Once complete, add 6 µl of Orange G loading dye to the samples and separate the
PCR products on a 3% agarose gel as described in the Crime Scene Investigator PCR Basics kit manual.
11. Analyze the results.
Laboratory 1: Full Crime Scene
Investigator KitProtocol, Run on a Real-Time PCR
Instrument
Introductory Level
Biotechnology Explorer Crime Scene Investigator PCR Basics™ Kit:
A Real-Time PCR Extension
Application Note

1-800-4BIORAD (1-800-424-6723) 10
Programming the Real-Time PCR InstrumentThe real-time instrument should be programmed by the instructor prior to the class (possibly as a demonstration, if appropriate). Use the manual and software provided with the instrument to perform the setup according to the recommendations below. Due to the complexity of real-time PCR instruments there are a lot of choices with regardto changing the parameters of the protocol. If a parameter is not specified below use the instrument’s default settings and consult the instruction manual or the instrument’stechnical support group for additional advice. For advice on the MiniOpticon™ call1(800)4-BIO-RAD in the US or contact your local Bio-Rad office.
Plate SetupSee Figure 5 for a suggestion on plate setup. It is essential that the students are aware that the correct placement of their samples in the thermal cycler is vital to the interpretation of their final results. Most instruments will allow you to save the plate setupto use with other classes. To identify and orient the PCR strips, label the side of eachPCR tube in the strip with an indelible marker. Do not write on the caps since that willinterfere with the fluorescence reading.
Figure 5. Plate setup. NTC (no template control); CS (crime scene DNA sample); A (suspect A DNA sample); B (suspect B DNA sample); C (suspect C DNA sample); and D (suspect D DNA sample)
The dye used in this experiment is SYBR® Green I, so if you are using a multicolor real-timePCR system (such as the Mini Opticon or the iQ5), be sure to select this dye in your platesetup. Alternatively, you may identify the wells as containing FAM dye, since it is detectedat the same wavelength as SYBR® Green I.
Programming the ProtocolProgram the real-time thermal cycler with the following protocol:
The reaction volume will be 25 µl.The lid temperature should be 95-100°C.
Cycle 1: 94°C for 2 min Initial denaturation of DNA
Cycle 2: 94°C for 30 sec Denaturation52°C for 30 sec Annealing72°C for 1 min Extension- collect data after this step
Repeat Cycle 2 for 40 cycles
Cycle 3: Melt-curve analysis. Program the instrument to heat the samples from 55°C to95°C in increments of 0.5°C and have the instrument collect data (or read the samples)after 10 seconds for each incremental step. Alternatively, use the instrument’s default settings for the melt-curve data collection.
Save the protocol to the instrument’s library.
Biotechnology Explorer Crime Scene Investigator PCR Basics™ Kit:
A Real-Time PCR Extension
Application Note

1-800-4BIORAD (1-800-424-6723) 11
Please note Laboratory 2 has an alternative cycling protocol designed to obtain results inabout 1 hour (see page 12 for Lab 2). However, this fast protocol will preferentially amplifythe smaller suspect target DNA allele sequences (200 and 300 bp) and will not allow students to match the crime scene with a suspect on an agarose gel at the end of theactivity since not all bands will be amplified.
Laboratory 1 Expected ResultsThe graph below shows what the fluorescence of the PCR reactions looks like, observedin real time as the Crime Scene Investigator PCR reactions amplified. Total fluorescence ison the y-axis of the graph, and the PCR cycle number is on the x-axis.
Figure 6. PCR Amplification plot. Color key: red = CSI kit reactions, black = no template control.
The graph clearly shows that the Crime Scene Investigator kit PCR reactions began toamplify to significant levels after cycle number 5. By cycle number 20, the curves haveentered the plateau phase. This indicates that the PCR process had run to completionand that no more amplification was going on. Interestingly, samples without any templateDNA (the “no template control") began to show amplification very late in the PCR cycling(after cycle 30). These amplification products were PCR primer-dimers, resulting from theprimers themselves serving as DNA templates. Viewed in real time, as the PCR run is progressing, the graph above is a visually dramatic demonstration of how the DNA isbeing amplified in the thermal cycler.
Melt-curve analysis shows the temperature at which a double-stranded amplicon dissociates into single-stranded DNA, thus releasing the SYBR® Green I resulting in adecrease in fluorescence. Different amplicons will dissociate at different temperaturesbased upon the length of the amplicon and the GC content. Melt-curve analysis for thisdata set will potentially show five different amplicons plus a primer-dimer peak. To reducethis complexity, view the melt curves for a single reaction or for a set of reactions from asingle DNA sample. It should be possible to identify specific peaks representing the twoamplicons amplified in the reaction that should match the gel electrophoresis results. It is also possible to overlay the crime scene sample data with each of the suspects (onesuspect at a time) to see whether there is a match. Do you have as much confidence inthe match from the melt-curve data as from the agarose gel electrophoresis data?
When the PCR products from the real-time reactions are separated on an agarose gel,the band patterns typically expected from the kit are easily visualized.
Biotechnology Explorer Crime Scene Investigator PCR Basics™ Kit:
A Real-Time PCR Extension
Application Note
1-800-4BIORAD (1-800-424-6723) 12
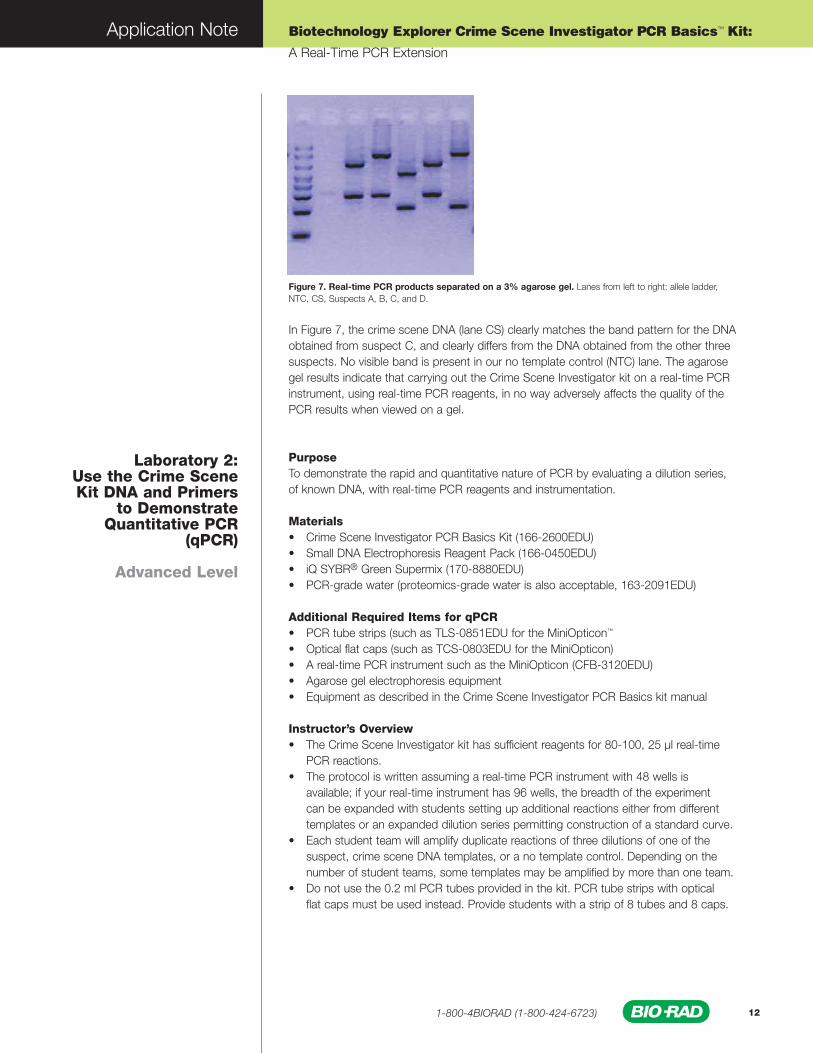
Figure 7. Real-time PCR products separated on a 3% agarose gel. Lanes from left to right: allele ladder,NTC, CS, Suspects A, B, C, and D.
In Figure 7, the crime scene DNA (lane CS) clearly matches the band pattern for the DNAobtained from suspect C, and clearly differs from the DNA obtained from the other threesuspects. No visible band is present in our no template control (NTC) lane. The agarosegel results indicate that carrying out the Crime Scene Investigator kit on a real-time PCRinstrument, using real-time PCR reagents, in no way adversely affects the quality of thePCR results when viewed on a gel.
PurposeTo demonstrate the rapid and quantitative nature of PCR by evaluating a dilution series, of known DNA, with real-time PCR reagents and instrumentation.
Materials• Crime Scene Investigator PCR Basics Kit (166-2600EDU)• Small DNA Electrophoresis Reagent Pack (166-0450EDU)• iQ SYBR® Green Supermix (170-8880EDU)• PCR-grade water (proteomics-grade water is also acceptable, 163-2091EDU)
Additional Required Items for qPCR• PCR tube strips (such as TLS-0851EDU for the MiniOpticon™
• Optical flat caps (such as TCS-0803EDU for the MiniOpticon)• A real-time PCR instrument such as the MiniOpticon (CFB-3120EDU)• Agarose gel electrophoresis equipment• Equipment as described in the Crime Scene Investigator PCR Basics kit manual
Instructor’s Overview• The Crime Scene Investigator kit has sufficient reagents for 80-100, 25 µl real-time
PCR reactions. • The protocol is written assuming a real-time PCR instrument with 48 wells is
available; if your real-time instrument has 96 wells, the breadth of the experiment can be expanded with students setting up additional reactions either from different templates or an expanded dilution series permitting construction of a standard curve.
• Each student team will amplify duplicate reactions of three dilutions of one of the suspect, crime scene DNA templates, or a no template control. Depending on the number of student teams, some templates may be amplified by more than one team.
• Do not use the 0.2 ml PCR tubes provided in the kit. PCR tube strips with optical flat caps must be used instead. Provide students with a strip of 8 tubes and 8 caps.
Laboratory 2: Use the Crime SceneKit DNA and Primers
to Demonstrate Quantitative PCR
(qPCR)
Advanced Level
Biotechnology Explorer Crime Scene Investigator PCR Basics™ Kit:
A Real-Time PCR Extension
Application Note

1-800-4BIORAD (1-800-424-6723) 13
Ensure the students do not label the tubes on the caps since most instruments read the fluorescence through the tube caps.
• Reagents can either be aliquoted or taken by students from a master stock depending on the instructor’s preference.
Programming the Real-Time PCR InstrumentThe real-time instrument should be programmed by the instructor prior to the class (possibly as a demonstration, if appropriate). Use the manual and software provided withthe instrument to perform the setup according to the recommendations below. Due to the complexity of real-time PCR instruments there are a lot of choices with regard toadjusting the parameters of the protocol. If a parameter is not specified below use theinstrument’s default settings and consult the instruction manual or the instrument’s technical support group for additional advice. For advice on the MiniOpticon™ call1(800)4-BIO-RAD in the US or contact your local Bio-Rad office.
Plate SetupSee Figure 8 for a suggestion on plate setup. It is essential that the students are aware that the correct placement of their samples in the thermal cycler is vital to the interpretation of their final results. Most instruments will allow you to save the plate setupto use with other classes. To identify and orient the PCR strips, label the side of eachPCR tube in the strip with an indelible marker. Do not write on the caps since that willinterfere with the fluorescence reading.
Figure 8. Plate setup. A (suspect A DNA sample); B (suspect B DNA sample); C (suspect C DNA sample); D (suspect D DNA sample); and CS (crime scene DNA sample) in duplicate at various dilutions. Numbers 1-3 correspond to the three dilution factors, while number 4 corresponds to the no template control.
The dye used in this experiment is SYBR® Green I, so if you are using a multicolor real-timePCR system (such as the MiniOpticon or the iQ5™), be sure to select this dye in your platesetup. Alternatively, you may identify the wells as containing FAM dye, since it is detectedat the same wavelength as SYBR® Green I.
Programming the ProtocolProgram the thermal cycler with the following fast PCR protocol.
The reaction volume will be 25 µl.The lid temperature should be 95-100°C.
Cycle 1: 94°C for 2 min Initial denaturation of DNA
Cycle 2: 94°C for 10 sec Denaturation52°C for 30 sec Annealing & Extension- collect data
Repeat Cycle 2 for 40 cycles
Biotechnology Explorer Crime Scene Investigator PCR Basics™ Kit:
A Real-Time PCR Extension
Application Note

1-800-4BIORAD (1-800-424-6723) 14
Cycle 3: Melt-curve analysis. Program the instrument to heat the samples from 55°C to95°C in increments of 0.5°C and have the instrument collect data (or read the samples)after 10 seconds for each incremental step. Alternatively, use the instrument’s default settings for the melt-curve analysis.
Save the protocol to the instrument’s library.
Note: This is a fast PCR protocol that will allow you to obtain results for the 200 and 300 bp alleles in around 1 hour. However, this protocol does not amplify the higher molecular weight alleles (500, 700 and 1000 bp). If desired, use the protocol in Lab 1(page 10) which will amplify all the alleles.
Thaw Tubes1. On ice, thaw the DNA samples and primers from the Crime Scene Investigator kit
and the iQ SYBR® Green Supermix
Prepare Serial Dilutions of DNA2. The crime scene and suspect DNA will be diluted 100, 10,000, and 1,000,000 fold.
Each student team will prepare four 1.5 ml microfuge tubes, labeled with the DNA template name (either A, B, C, D or CS) and dilution reference.
Example for DNA Sample Suspect A:Suspect A #1- 1/100 dilutionSuspect A #2- 1/10,000 dilutionSuspect A #3- 1/1,000,000 dilutionSuspect A #4- no template control
3. Add 990 µl sterile distilled water to each of the above tubes.
Add 10 µl of concentrated template DNA to tube labeled #1. Mix tube thoroughly by vortexing for at least 10 seconds or by flicking tube at least 20 times.Transfer 10 µl diluted DNA from tube #1 to tube #2. Mix thoroughly.Transfer 10 µl diluted DNA from tube #2 to tube #3. Mix thoroughly.Tube #4 will have no DNA template added.
Prepare PCR Tubes4. Obtain an eight-well PCR tube strip. You will prepare duplicate PCR reactions.
Label each pair of tubes with the template name and the dilution reference, and be sure to only write on the sides of the tubes. For example, the eight-tube strip for the group(s) analyzing Suspect A would have each tube labeled as follows: A1; A1; A2; A2; A3; A3; A4; A4. Ensure the reactions are set up in the exact manner programmed into the real-time PCR instrument.
5. Add 12.5 µl of template DNA from each tube of your dilution series to the pair of corresponding PCR tubes.
Prepare PCR Mastermix6. Label a fresh 1.5 ml microtube “MM".
7. Pipet 110 µl of iQ SYBR® Green supermix to the MM tube.
8. Pipet 2.2 µl of the Crime Scene Investigator kit primers (blue) to the MM tube. Mix thoroughly by vortexing for 10 seconds or flicking the tube 20 times. Spin down the tube contents.
Student Protocol
Biotechnology Explorer Crime Scene Investigator PCR Basics™ Kit:
A Real-Time PCR Extension
Application Note

1-800-4BIORAD (1-800-424-6723) 15
Add Mastermix to PCR Tubes9. Add 12.5 µl of mastermix to each of the 8 PCR reactions using a fresh pipet tip
each time. Mix the reaction gently by slowly pipeting up and down several times, without withdrawing the pipet tip. Remember that this PCR will be detected optically, so be careful to avoid introducing bubbles into the PCR reaction.
10.Cap tubes using the optical flat caps. Gently tap tubes on bench or use a microfuge with an adaptor to ensure the mixture is at the bottom of the tubes.
Run PCR Reactions11.Run the PCR reactions on the real-time PCR instrument.
12.View the PCR reactions in real time as they progress during the cycling.
13.Connect the real-time PCR instrument and computer to a projector for easier student viewing.
14. (Optional) Once complete, add 6 µl of Orange G loading dye to the samples and run the PCR products out on a 3% agarose gel as described in the Crime Scene Investigator kit manual. Please note that using the two-step fast cycling protocol will amplify only the 200 and 300 bp alleles and thus will not permit matching the crime scene DNA with the suspect.
15.Analyze the results.
Laboratory 2 Expected ResultsThe real-time PCR reactions will show up as curves similar to those shown in the following graphs. The 1/100 diluted DNA, being most concentrated, will have curves that appear “earliest", for example, around cycle 15. Those diluted 1/10,000 fold willappear later, perhaps around cycle 25. Finally, those samples diluted 1/1,000,000 willappear last, after cycle number 30. The no template control will contain PCR primer-dimers and will also begin to amplify around cycle 30.
Figure 9. PCR Amplification plot. Color key: Green=100X, Red=10,000X, Blue=1,000,000X , Black=NTC.
The above quantitation graph clearly demonstrates the quantitative nature of real-timePCR. Samples containing higher concentrations of starting DNA result in curves that rise earlier. The point at which these curves cross the threshold cycle (commonly calledthe CT value) directly relates to the starting quantity of template. These CT values cansubsequently be used to accurately quantitate DNA concentrations. For example, sincePCR involves a doubling of the amount of DNA every cycle, curves with CT values that differ by 3 cycles would represent 23 = an 8-fold difference in starting template concentration.
Biotechnology Explorer Crime Scene Investigator PCR Basics™ Kit:
A Real-Time PCR Extension
Application Note
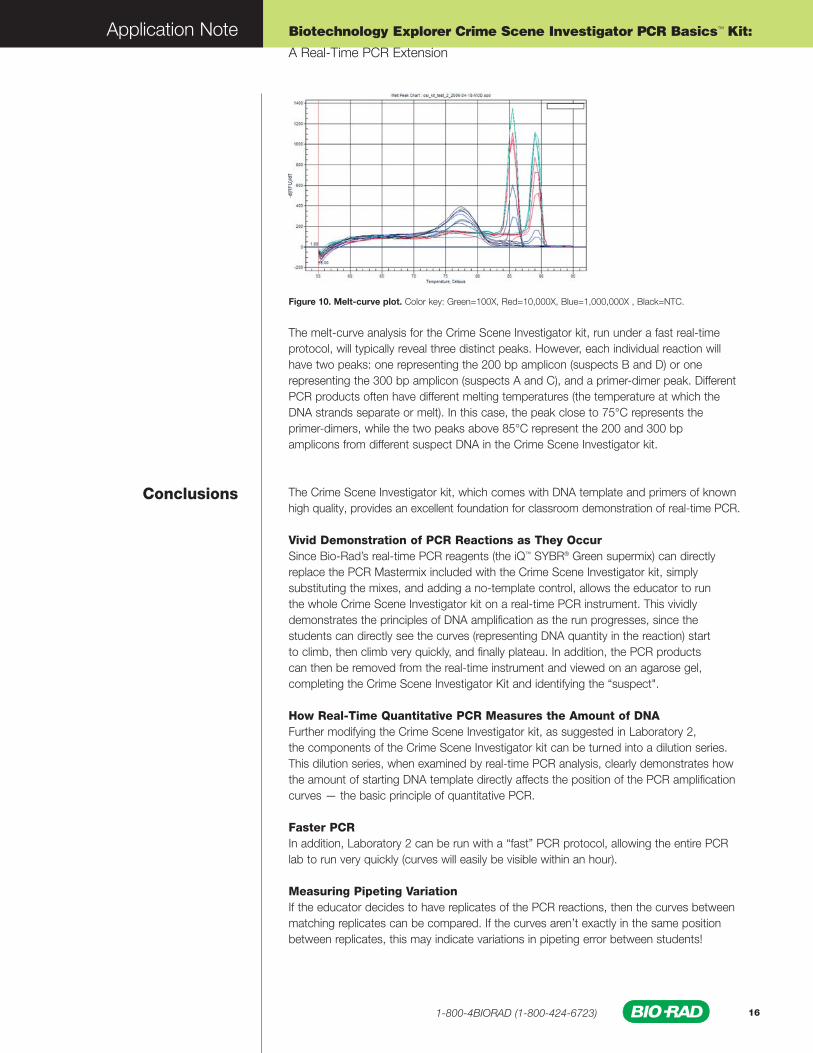
Figure 10. Melt-curve plot. Color key: Green=100X, Red=10,000X, Blue=1,000,000X , Black=NTC.
The melt-curve analysis for the Crime Scene Investigator kit, run under a fast real-timeprotocol, will typically reveal three distinct peaks. However, each individual reaction willhave two peaks: one representing the 200 bp amplicon (suspects B and D) or one representing the 300 bp amplicon (suspects A and C), and a primer-dimer peak. DifferentPCR products often have different melting temperatures (the temperature at which theDNA strands separate or melt). In this case, the peak close to 75°C represents theprimer-dimers, while the two peaks above 85°C represent the 200 and 300 bp amplicons from different suspect DNA in the Crime Scene Investigator kit.
The Crime Scene Investigator kit, which comes with DNA template and primers of knownhigh quality, provides an excellent foundation for classroom demonstration of real-time PCR.
Vivid Demonstration of PCR Reactions as They OccurSince Bio-Rad’s real-time PCR reagents (the iQ™ SYBR® Green supermix) can directlyreplace the PCR Mastermix included with the Crime Scene Investigator kit, simply substituting the mixes, and adding a no-template control, allows the educator to run the whole Crime Scene Investigator kit on a real-time PCR instrument. This vividly demonstrates the principles of DNA amplification as the run progresses, since the students can directly see the curves (representing DNA quantity in the reaction) start to climb, then climb very quickly, and finally plateau. In addition, the PCR products can then be removed from the real-time instrument and viewed on an agarose gel, completing the Crime Scene Investigator Kit and identifying the “suspect".
How Real-Time Quantitative PCR Measures the Amount of DNAFurther modifying the Crime Scene Investigator kit, as suggested in Laboratory 2, the components of the Crime Scene Investigator kit can be turned into a dilution series.This dilution series, when examined by real-time PCR analysis, clearly demonstrates howthe amount of starting DNA template directly affects the position of the PCR amplificationcurves — the basic principle of quantitative PCR.
Faster PCRIn addition, Laboratory 2 can be run with a “fast” PCR protocol, allowing the entire PCRlab to run very quickly (curves will easily be visible within an hour).
Measuring Pipeting VariationIf the educator decides to have replicates of the PCR reactions, then the curves betweenmatching replicates can be compared. If the curves aren’t exactly in the same positionbetween replicates, this may indicate variations in pipeting error between students!
Conclusions
Biotechnology Explorer Crime Scene Investigator PCR Basics™ Kit:
A Real-Time PCR Extension
Application Note
1-800-4BIORAD (1-800-424-6723) 16

The importance of Proper Experimental ControlsThe Laboratory 2 serial dilution experimant clearly indicates that the lowest dilutions ofDNA (one million fold diluted from the DNA that comes with the kit) take a very long number of cycles to amplify a significant amount of product. So many cycles, in fact, thatthe primer-dimers (that occur naturally in samples without any DNA template at all) amplify at about the same point. Therefore, this experiment clearly shows that positive results inreal-time PCR do not necessarily mean that there was any starting template DNA!
Melt-Curve Analysis Finally, the melt-curve analysis that is easily incorporated at the end of a real-time PCRreaction can be used to discuss the dynamics of DNA. At some temperatures DNA is single-stranded, at others it is double-stranded, and the difference between the two configurations is critical for the operation of PCR. Also, melt-curve analysis generates visible “peaks” that can be used to determine what type of PCR products have been produced (primer-dimers, or amplicons of different sizes).
Biotechnology Explorer Crime Scene Investigator PCR Basics™ Kit:
A Real-Time PCR Extension
Application Note
1-800-4BIORAD (1-800-424-6723) 17

A gel, made of an uncharged agarose polymer, that is typically used to separate nucleicacids and other biomolecules by size via electrophoresis.
PCR product; the DNA produced by amplification in a PCR reaction.
An increase in the amount of a DNA sequence resulting from the polymerase chain reaction (PCR).
A measure of how closely the majority of PCR cycles in a given run approximate perfectdoubling of product. The amplification efficiency, E, is calculated from the slope of thestandard curve using the formula E = 10–1/slope. The percent amplification efficiency iscalculated using the formula %E = (E–1) x 100%, where 100% efficiency is an indicator ofa robust assay.
The graphical representation of changes in relative fluorescence units (RFU) per real-timePCR cycle.
A PCR step in which the reaction is cooled to allow primers to bind to the denatured template.
The initial cycles of real-time PCR, during which the changes in fluorescent amplificationsignal are not detectable in a given sample.
Complementary DNA. A DNA sequence that is synthesized from mRNA template byreverse transcription. The cDNA sequence is complementary to the mRNA templatesequence.
A statistical measure of the degree of linear or nonlinear association between two variables, which indicates the strength of that association. Represents how well theexperimental data fit the regression line. In the case of a simple linear regression, R2 is the square of the correlation coefficient (r).
A statistical measure of the degree of linear relationship between two variables that indicates the strength of that relationship. Represents how well the experimental data fitthe regression line. A coefficient of 1 means a perfect linear relationship.
See threshold cycle.
One round of denaturation, annealing, and extension steps in a PCR protocol.
A PCR step in which the reaction is heated to break the hydrogen bonds that hold double-stranded DNA together, thus separating the DNA into single-stranded molecules.Typical denaturing temperatures are 92–95°C.
Deoxyribonucleic acid; strands of linked deoxyribonucleotides that contain the geneticinformation of cells. By convention, the sequence of nucleotide bases (A, T, G, and C) iswritten in the 5' to 3' direction.
Abbreviation for a deoxynucleoside 5'-triphosphate when the exact deoxynucleotide (typically dATP, dTTP, dGTP, or dCTP) is unspecified or unknown.
A double-stranded DNA molecule.
Agarose gel
Amplicon
Amplification
Amplification efficiency
Amplification plot
Annealing step
Baseline
cDNA
Coefficient of determination (R2)
Correlation coefficient (r)
CT
Cycle
Denaturation step
DNA
dNTP
dsDNA
Glossary
Biotechnology Explorer Crime Scene Investigator PCR Basics™ Kit:
A Real-Time PCR Extension
Application Note
1-800-4BIORAD (1-800-424-6723) 18

See amplification efficiency.
The period of an amplification reaction during which the product accumulates exponentially, approximately doubling with every cycle. During this phase, the amplificationplot can be approximated by an exponential equation and a plot of log RFU vs. cyclenumber can be fit by a line.
See gene expression.
A PCR step in which the temperature is set to allow DNA polymerase to extend theprimer by adding nucleotides complementary to the template sequence.
5- or 6-carboxyfluorescein, a fluorescent molecule commonly used to monitor the amplification of target in probe-based real-time PCR assays.
Light of a specific range of wavelengths that is emitted from a molecule previously excited by energy of a different range of wavelengths. Each fluorescent molecule hascharacteristic excitation and emission spectra.
The regulated transcription of mRNA for subsequent translation into protein in a livingorganism. PCR techniques allow the detection of relative gene expression in a sample by amplifying the cDNA generated from purified mRNA.
In a thermal cycler, a controlled, incremental temperature differential across a reactionblock.
Genes that are continuously expressed in virtually all cells due to the constant requirement of the gene product for basic cellular function. Their expression is thought to be unaffected by experimental treatments. These genes are often used as referencegenes in relative quantification.
In PCR, a substance that prevents efficient amplification.
See molecular weight marker.
A DNA fragment of known size used as a standard for comparison when estimating thesize of unknown DNA fragments following gel electrophoresis. A series of molecularweight markers is sometimes called a ladder.
A concentrated mixture of reaction components that can easily and consistently be diluted with water, primers, and template for use in a PCR.
A plot of fluorescence vs. sample temperature used to determine the melting temperature(Tm) of a population of DNA molecules, to distinguish specific products from nonspecificproducts in real-time PCR. To create the curve, one must use a reporter chemistry thatdistinguishes dsDNA from single-stranded DNA (e.g., SYBR® Green I), and measure fluorescence while incrementally increasing the sample temperature.
Messenger RNA. An RNA molecule that is translated into a protein in the cell. For geneexpression studies, mRNA can be reverse-transcribed into cDNA, which in turn serves as the initial template for PCR.
A relatively short, single-stranded sequence of nucleotides, synthesized artificially andused as a probe or primer to bind a complementary sequence. Also called “oligo".
Efficiency
Exponential phase
Expression
Extension step
FAM
Fluorescence
Gene expression
Gradient
Housekeeping gene
Inhibitor
Marker
Molecular weight marker
Master mix
Melt-curve
mRNA
Oligonucleotide
Biotechnology Explorer Crime Scene Investigator PCR Basics™ Kit:
A Real-Time PCR Extension
Application Note
1-800-4BIORAD (1-800-424-6723) 19

See polymerase chain reaction.
The nonexponential phase of PCR that occurs after many cycles, when the rate of amplification decreases.
A technique that uses a series of denaturation, annealing, and extension steps to copy(amplify) specific DNA or cDNA sequences.
An oligonucleotide that binds to a DNA template and serves as the starting point for DNA strand elongation during the extension step of PCR. To amplify a specific target, two primers are designed, one complementary to each strand of the dsDNA, such thatthe two bracket the target of interest.
An artifact or nonspecific product, composed of annealed primers, that forms when there is homology within or between PCR primers.
Quantitative PCR. Also called real-time PCR. A technique that uses fluorescently labeledmolecules to track the accumulation of amplified products with each cycle of PCR.
See correlation coefficient.
See coefficient of determination.
Also called quantitative PCR or qPCR, a technique that uses fluorescently labeled molecules to track the accumulation of amplified products with each cycle of PCR.
A gene whose expression level is used for normalization in relative quantification. Seehousekeeping gene.
A type of real-time PCR data analysis used to calculate differences in a target concentration across different samples. The technique uses a reference, which is expected to have the same concentration in every sample, to normalize the target concentration in each sample.
An RNA-dependent DNA polymerase. Used in RT-PCR to transcribe an mRNA sequenceinto cDNA.
The process of transcribing mRNA to cDNA using reverse transcriptase.
Relative fluorescence units; a unit of fluorescence intensity measured by a real-time PCR detection system.
Ribonucleic acid; a nucleic acid, transcribed from DNA, that plays an important role intranslating genes into proteins.
See reverse transcription.
Reverse transcription PCR. A PCR technique in which reverse transcriptase synthesizescDNA from RNA template, and the cDNA is subsequently amplifiied by PCR.
A quantitative research tool used to determine the concentration or copy number of anunknown substance. In PCR, the CT values obtained when amplifying a series of knownnucleic acid quantities is plotted, and the graph is used to estimate the quantity ofunknown nucleic acid sequences.
PCR
Plateau phase
Polymerase chain reaction(PCR)
Primer
Primer-dimer
qPCR
r
R2
Real-time PCR
Reference gene
Relative quantification
Reverse transcriptase
Reverse transcription
RFU
RNA
RT
RT-PCR
Standard curve
Biotechnology Explorer Crime Scene Investigator PCR Basics™ Kit:
A Real-Time PCR Extension
Application Note
1-800-4BIORAD (1-800-424-6723) 20

Biotechnology Explorer Crime Scene Investigator PCR Basics™ Kit:
A Real-Time PCR Extension
Application Note
A fluorescent molecule that binds nonspecifically to dsDNA. When free in solution, SYBR® Green I exhibits little fluorescence, but its fluorescence increases up to 1,000-foldwhen it binds to dsDNA. SYBR® Green I is commonly used for nonspecific detection ofPCR products in real-time PCR assays.
A thermally stable DNA polymerase used in PCR to amplify nucleic acid. This polymerasealso exhibits 5' exonuclease acitivty, which cleaves the reporter from the 5' end of aTaqMan probe during amplification.
The specific nucleotide sequence that is to be amplified during the PCR reaction.
The gDNA or cDNA sample used in a PCR study or the nucleic acid sequence that serves as the pattern for the synthesis of its complementary nucleic acid strand.
In real-time PCR, the level of fluorescence that is considered to be significantly above thebaseline level measured in the early cycles. A valid threshold value may be automaticallyselected by software-based algorithms, or may be manually selected during real-timePCR data analysis.
In real-time PCR, the cycle number (in the exponential phase) at which enough amplifiedproduct has accumulated to yield a detectable fluorescent signal (i.e., to cross the threshold fluorescence level). The CT value is used to accurately and reliably measure the initial amount of template present in the reaction.
Melting temperature. The temperature at which 50% of DNA of a given sequence is denatured into single strands. The melting temperature is heavily dependent upon theDNA length and GC content.
SYBR® Green I
Taq polymerase
Target
Template
Threshold
Threshold cycle (CT)
Tm
1-800-4BIORAD (1-800-424-6723) 21

Biotechnology Explorer Crime Scene Investigator PCR Basics™ Kit:
A Real-Time PCR Extension
Application Note
1-800-4BIORAD (1-800-424-6723) 22

ReferencesBernard, P.S. & C.T. Wittwer. Real-time PCR technology for cancer diagnostics. Clin Chem 48:1178-1185 (2002)
Bustin, S.A., Benes, V, Nolan, T, & M.W. Pfaffl. Quantitative real-time RT-PCR—a perspective. J Mol Endrocrinology. 34:597-601 (2005)
Bustin, S.A.,& R. Mueller. Real-time reverse transcription PCR (qRT-PCR) and its potential use in clinical diagnosis. Clin Sci 109:365-379. (2005)
Gibson, N.J. The use of real-time PCR methods in DNA sequence variation analysis. Clin Chim Acta 363:32-47 (2006)
Jiang, Y., T. Ellis, & A.R. Greenlee. Genotyping Parkinson disease-associated mitochondrial polymorphisms. Clin. Med. Res. 2(2):99-106 (2004)
Kubista, M, Andrade, J.M., Bengtsson, M, Forootan, A, Jonak, J, Lind, K, Sindelka, R, Sjoback, R, Sjogreen, B, Strombom, L, Stahlberg, A, & n. Zoric,The real-time polymerase chain reaction. Molecular Aspects of Medicine, 27:95-125 (2006) (www.sciencedirect.com)
Leutenegger, C.M. The real-time TaqMan PCR and applications in veterinary medicine. Vet Sci. Tomorrow 1: 1-15. (2001)
Mackay, I.M. Real-time PCR in the microbiology laboratory. Microbiol Infect. 10: 190-212. (2004)
Pray, P.A. Consider the Cycler. The Scientist . pp34-37. (Sep 13, 2004)
Saleh-Lakha, S., M. Miller, R.G. Campbell, K. Schneider, P. Elahinamesh, M.M. Hart, & J.T. Trevors. Microbial gene expression in soil: methods, applications, and challenges. J. Microbiol. Methods. 63(1)1-19. (2005)
Stevens, C.D. Clinical Immunology and Serology: A Laboratory Perspective. 2nd Ed. F.A. Davis Co. Philadelphia (2003)
Templeton, K.E., S.A. Scheltinga, A. van der Zee, B.M.W. Diederen, A.M. Kruijssen, H. Goossens, E. Kuijper, & E.C.J. Claas. Evaluation of real-time PCRfor detection of and discrimination between Bordetella pertussis, Borderella parapertussis, and Bordetella homesii for clinical diagnosis. J. Clin. Microb.41(9):4121-4126 (2003)
Watson, D.E., & B. Li. TaqMan applications in genetic and molecular toxicology. Int. J. Toxicol. 24(3):139-45. (2005)
Wong, M.L. & J.F. Medrano. Real-time PCR for mRNA quantification. BioTechniques, 39: (2005)
Legal NoticesFantastik is a trademark of S.C. Johnson and Son, Inc. Formula 409 is a trademark of The Clorox Comapny. SYBR® is a trademark of InvitrogenCorporation. TaqMan are trademarks of Roche Molecular Systems, Inc.
Notice regarding Bio-Rad thermal cyclers and real-time systems: Purchase of this instrument conveys a limited, non-transferable immunity from suit forthe purchaser’s own internal research and development and for use in applied fields other than Human In Vitro Diagnostics under one or more of U.S.Patents Nos. 5,656,493, 5,333,675, 5,475,610 (claims 1, 44, 158, 160–163, and 167 only), and 6,703,236 (claims 1–7 only), or corresponding claimsin their non-U.S. counterparts, owned by Applera Corporation. No right is conveyed expressly, by implication, or by estoppel under any other patentclaim, such as claims to apparatus, reagents, kits, or methods such as 5' nuclease methods. Further information on purchasing licenses may beobtained by contacting the Director of Licensing, Applied Biosystems, 850 Lincoln Centre Drive, Foster City, California 94404, USA. Bio-Rad’s real-timethermal cyclers are licensed real-time thermal cyclers under Applera’s United States Patent No. 6,814,934 B1 for use in research and for all other fieldsexcept the fields of human diagnostics and veterinary diagnostics. Purchase of iTaq™ DNA polymerase includes an immunity from suit under patentsspecified in the product insert to use only the amount purchased for the purchaser’s own internal research. No other patent rights (such as 5’ NucleaseProcess patent rights) are conveyed expressly, by implication, or by estoppel. Further information on purchasing licenses may be obtained by contactingthe Director of Licensing, Applied Biosystems, 850 Lincoln Centre Drive, Foster City, California 94404, USA
Bio-Rad Laboratories, Inc. is licensed by Invitrogen Corporation to sell reagents containing SYBR® Green I for use in real-time PCR, for research purposesonly. Purchase of this product includes an immunity from suit under patents specified in the product insert to use only the amount purchased for thepurchaser’s own internal research. No other patent rights are conveyed expressly, by implication, or by estoppel. Further information on purchasinglicenses may be obtained by contacting the Director of Licensing, Applied Biosystems, 850 Lincoln Centre Drive, Foster City, California 94404, USA.
1662605 Rev A 07-0151 408 1205