Embed Size (px)
Citation preview
BIOSYNTHESIS AND AXONAL TRANSPORT OF RAT
NEUROHYPOPHYSIAL PROTEINS AND PEPTIDES
HAROLD GAINER, YOSEF SARNE, and MICHAEL J. BROWNSTEIN
From the Behavioral Biology Branch and the Laboratory of Clinical Science, National Institutes of Health, Bethesda, Maryland 20014. Dr. Sarne's present address is the Department of Behavioral Biology, Technion Medical School, Haifa, Israel.
ABSTRACT
~S-cysteine injected adjacent to the supraoptic nucleus (SON) of the rat is rapidly incorporated into proteins. These 35S-cysteine-labeled proteins in the SON (1-24 h after injection) were separated by polyacrylamide gel electrophoresis, and the distribution of radioactive proteins on the gels was analyzed. 1 h after injection, about 73% of the radioactivity appeared in two peaks (both about 20,000 mol wt). With time, these peaks (putative precursors of neurophysin) decreased, as a 12,000 mol wt peak (containing two distinct neurophysins) increased in radioac- tivity. Both the 20,000- and 12,000-mol wt proteins are transported into the axonal (median eminence) and nerve terminal (posterior pituitary) regions of the rat hypothalamo-neurohypophysial system. Conversion of the larger precursor protein to the smaller neurophysin appears to occur, in large part, intra-axonally during axonal transport. Six distinct aSS-cysteine-labeled peptides (< 2500 mol wt), in addition to arginine vasopressin and oxytocin, are also synthesized in the SON and transported to the posterior pituitary where they are released together with labeled neurophysin by potassium depolarization in the presence of extracel- lular calcium. These data provide support for the hypothesis that the neurohypo- physial peptides (vasopressin and oxytocin) and neurophysins are derived from the post-translational cleavage of protein precursors synthesized in the SON, and that the conversion process can occur in the neurosecretory granule during axonal transport.
The question whether neuronal peptides are syn- thesized by ribosomal mechanisms as protein pre- cursors and then transformed to biologically active peptides by post-translational cleavage mecha- nisms, similar to those for insulin (47), or by direct enzymic (synthetase) mechanisms has received considerable attention in recent years (38). The answer to this question has several implications with regard to the cell biology of "peptidergic" neurons, i.e., neurons which synthesize and store specific peptides for release as intercellular mes-
sengers (3, 13, 30). Since ribosomes appear to be restricted to the neuron perikaryon (21), ribo- somal mechanisms of peptide biosynthesis and their regulation would necessarily have to occur at this site in the neuron. In contrast, an enzymic mechanism of biosynthesis would allow these processes to occur in any part of the neuron (e.g., the axon terminal), analogous to the synthesis of conventional neurotransmitters (e.g., acetylcho- line, gamma aminobutyric acid, catecholamines, etc.).
366 ThE JOURNAL OF CELL BIOLOGY" VOLUME 73, 1977' pages 366-381
Dow
nloaded from http://rupress.org/jcb/article-pdf/73/2/366/1072464/366.pdf by guest on 07 April 2022

The peptidergic neurons of the mammalian hy- pothalamo-neurohypophysiai system represent ex- cellent models for such studies. The neurohypo- physial peptides (oxytocin and vasopressin) and proteins (neurophysins) are synthesized by neu- rons in the supraoptic nucleus (SON) and para- ventricular nucleus (PVN) of the hypothalamus and subsequently transported intra-axonally to the posterior pituitary (neurohypophysis) where they are stored in nerve terminals for release (2, 15, 22). As a result of their extensive investigations, Sachs and his colleagues (44) have hypothesized that vasopressin and neurophysin are derived from a common precursor protein which is synthesized by ribosomal mechanisms. The evidence in sup- port of this hypothesis is as follows: (a) the synthe- sis of vasopressin occurs only at the site of the neuronal perikarya in the hypothalamus. The neu- rohypophysis, containing the axons and terminals of these same neurons, is incapable of vasopressin synthesis (40, 42). (b) In vivo and in vitro experi- ments on the incorporation of ~S-cysteine into vasopressin showed that labeled vasopressin ap- peared only after a significant time lag (>1.5 h in the dog). Application of a protein synthesis inhibi- tor, puromycin, during the pulse-label period completely inhibits the incorporation of ~S-cys- teine into vasopressin, whereas if the puromycin is applied after the pulse (but before the appearance of labeled vasopressin) the incorporation of label into the peptide is not inhibited (42, 44, 50). Sachs and Takabatake (42) concluded from these findings that puromycin inhibited the synthesis of the precursor, but that once the precursor was synthesized the inhibitor did not affect the cleav- age of the precursor to vasopressin. (c) Neurophy- sin and vasopressin appear to be synthesized with similar kinetics (43), and inhibition of neurophy- sin synthesis by incubation in the presence of ana- logues of amino acids found in neurophysin but not vasopressin also inhibited the synthesis of va- sopressin (44). These data indicated a common precursor for both neurophysin and vasopressin. (d) Consistent with this hypothesis are the recent findings that rats with genetic defects in vasopres- sin synthesis, i.e., the Brattleboro strain, are also deficient in specifically the vasopressin-associated neurophysin (37, 52). (e) Various physical-chemi- cal properties of neurophysin suggest that this protein is not in its originally synthesized form (8).
Although considerable evidence for the exis- tence of a precursor of neurophysin and vasopres- sin has been available, efforts to isolate and char-
acterize this postulated precursor in biosynthetic experiments have been unsuccessful. In this pa- per, we present evidence for the existence of a protein precursor to neurophysin in the rat hy- pothalamo-neurohypophysiai system, its tentative identification as a protein of 20,000 mol wt, and evidence for its post-translational modification during axonal transport. With the use of the bio- synthesis-axonal transport paradigm described in this paper, we have detected several cysteine-con- taining peptides, other than vasopressin and oxy- tocin, which appear to be transported to the poste- rior pituitary for release. A preliminary account of this work has been published (14).
MATERIALS AND METHODS
Animals and Operative Procedures
Rats of the Osborne-Mendel strain were used in these experiments. The animals were anaesthetized with ether, and their heads were fixed in a stereotaxic instrument (5 ~ nose down). A flap of skull bone was removed, exposing the brain, and two 31-gauge, stainless steel needles were positioned 7 mm rostral to the interauricu- lar line, 2.5 mm on each side of the midline. The needles were lowered 8.6 mm beneath the dural surface, and 1 /~1 of a solution containing 10 #,Ci of ~S-l-cystine (50 Ci/ retool, New England Nuclear, Boston, Mass.) in 0.9% NaCI and 10 mM dithiothreitol was injected through each needle over a period of 10 rain. After the injection, the needles were left in position for 10 rain, and were then removed from the brain. Histological examination of the brains showed that the tips of the needles had been just above and lateral to the supraoptic nuclei (SON). The scalp was dosed with wound clips, and the animals awoke 10 rain postoperatively. At various times post- injection, the animals were sacrificed by decapitation, and their brains and pituitaries were quickly removed and frozen on dry ice. Serial frontal sections (300/~m in thickness) of the brain were cut in a cryostat at -9~ The SON where oxytocin and vasopressin containing neuronal perikarya are found (49), and the median emi- nence (ME) through which axons from the SON neurons pass, were dissected by the Palkovitz punch technique (35). The posterior pituitary, where the axons of the hypothalamo-neurohypophysial system terminate, was also studied. These tissue samples were homogenized in 0.1 N HCI in order to destroy degradative enzymes (11), and the homogenates were stored at -70~
Polyacrylamide Gel Electrophoresis
o f Labeled Proteins
Four types of polyacrylamide gel electrophoresis (PAGE) were used to separate ~S-labeled proteins from the isolated tissues: acid-urea gels, basic gels (with a running pH of 9.5), electrophoresis in the presence of
GAINER, SARNE, AND BROWNS'rEIN Rat Neurohypophysial Proteins and Peptides 3 6 7
Dow
nloaded from http://rupress.org/jcb/article-pdf/73/2/366/1072464/366.pdf by guest on 07 April 2022

sodium dodecyl sulfate (SDS), and isoelectric focusing (IEF) gels. Two methods were used to prepare the tissue samples for electrophoresis. (a) The tissues were directly homogenized in a sample buffer (see below) appropriate for the gel system to be used, and the homogenate was centrifuged at 12,000 gmax. The supernate was then applied directly to the gel for electrophoresis. (b) The tissues which had been homogenized in 0.1 M HCI were treated with 10% TCA, and the precipitated proteins were separated from the TCA-soluble proteins by cen- trifugation. Both the TCA-precipitable and-soluble frac- tions were washed extensively with ether to remove the TCA and stored at -70"C until use. The TCA-precipita- ble fraction was solubilized by the specific sample buffer and subjected to electrophoresis. The TCA-soluble pep- tides were analyzed as will be described later.
The acid-urea polyacrylamide gels were prepared as described elsewhere (24), except that the separating gel also contained 0.1% Triton X-100. Electrophoresis in the system is toward the cathode, and the running pH of the gel is 2.7. The sample buffer contained 8 M urea, 1% Triton X-100, and 0.9 M acetic acid. SDS gel electro- phoresis was done with the buffer system described by Neville (29). The running pH of this system is 9.5, and the sample buffer contained 1% SDS, and 2% /3-mer- captoethanol made up in the upper gel buffer (29). This same gel system, in the absence of SDS and/3-mercapto- ethanol, was used to separate proteins on the basis of their charge and size, and is referred to as the "pH 9.5 gel" in the text. IEF in polyacrylamide gels was done according to the method described by O'Farrell (34). The sample buffer used with this gel system contained 8 M urea, 1% Triton X-100, and 2% ampholytes (pH 3- 10), and the sample was loaded at the anode end of the gel. Conventional disc gels were used when the radioac- tive patterns on the gels were determined by slicing techniques, and slab gels were used for radioautographic analysis. After electrophoresis, the gels were stained with Coomassie Blue and destained by conventional techniques. Several marker proteins were used to stand- ardize each gel run. The marker proteins were either added to the sample buffer containing the labeled pro- teins (providing an internal standard for the gel) or co-run during the same gel electrophoresis run on a separate gel. The marker proteins used for acid-urea gels were bovine serum albumin, cytochrome c, and bovine neuro- physin I and II (obtained as a gift from Dr. E. Di- liberto). The same marker proteins, except for eyto- chrome c, were used for the pH 9.5 gel, and bovine serum albumin (68,000 mol wt), ovalbumin (43,000 mol wt), carbonic anhydrase (29,000 mol wt), cytochrome c (12,000 tool wt), and insulin a and /3 subunits (2,500 and 3,500 mol wt) were used in SDS gel electrophoresis.
In some experiments, the labeled proteins were elec- trophoresed on acid-urea gels, and after electrophoresis, the gels were sliced longitudinally into two halves. One half was sliced and counted for its radioactive profile, and the other half was frozen at -70~ When the
migration proteins on the gels of the labeled proteins were determined, the slices containing the labeled pro- teins of interest were sliced out of the frozen gel, frag- mented, and eluted in either SDS or IEF sample buffer. The sample buffer and gel fragments were then applied to either SDS or IEF gels for electrophoresis.
Analysis of TCA-Soluble Peptides The TCA-soluble fractions were chromatographed on
Sephadex G-25 columns (0.9 x 30 cm, Pharmacia- Uppsala, Sweden) with 5% acetic acid as the eluant. The TCA-soluble fractions were lyophilized, dissolved in 0.2 ml of 5 % acetic acid and applied to the column without disturbing the gel, and eluted. Flow rates were about 40 ml/h, and blue dextran, arglnine vasopressin, and ribo- flavin were used as markers on the G-25 column. Ali- quots from the resulting fractions were counted for their radioactivity, and the radioactive fractions preceding the riboflavin fraction were pooled and lyophilized. The ly- ophilized peptides were dissolved in a small volume of 5% acetic acid, and spotted on cellulose (500/.tm thick) thin-layer chromatography (TLC) plates (Analtech, Inc., Newark, Del.), for two-dimensional TLC. The solvent used for the first dimension (solvent 1) contained bu- tanol:HzO:pyridine in the ratio 1:1:1, while solvent 2 contained butanol:HzO:acetic acid:pyridine in the ratios of 3:3:1:3. The antioxidant thiodiglycol (0.1% vol/vol) was also added to both solvents. Arginine vasopressin and oxytocin were added to each sample and detected on each plate at the end of the chromatographic separation by fluorescamine treatment of the plate (17). The addi- tion of these peptide markers served as internal stan- dards for each run, and also provided information as to the position of these peptides on the plate. The plates were radioautographed as described below.
Release Experiments with the Posterior Pituitary
Posterior pituitaries were removed from rats which had been injected in the SON with ~S-cysteine 24 h before and suspended at 37"C in normal saline solution (composition in raM/liter: 130 NaCI, 5.4 KCI, 1.3 CaCI2, 0.8 MgSO4, 10 mM N-2-hydroxyethylpiperazine- N'-2-ethane sulfonic acid [HEPES], and 10 mM glucose) equilibrated with 95% O~, 5% COs. All incubating solutions were adjusted to pH 7.3-7.4 and 335-340 mosmoi/liter with NaCI and contained bovine serum albumin (1 mg/ml). The pituitaries were then incubated in the above-described medium at 37~ for a total of 30 rain (each pituitary was incubated in a separate Falcon microtest culture dish well in 100 p,1 of medium for 10 min, and transferred to a new well containing fresh medium). The medium from the final 10-min incubation was made 0.1 M with HCI and saved for analysis. The TCA-precipitable and-soluble cpm in this sample is re- ferred to as the "basal release" in the text. The pituitar- ies were then transferred consecutively to wells contain-
368 TME JOURNAL OF CELL BIOLOGY " VOLUME 73, 1977
Dow
nloaded from http://rupress.org/jcb/article-pdf/73/2/366/1072464/366.pdf by guest on 07 April 2022

ing normal K+-Ca+§ medium, high K+-Ca++-free medium, and high K+-Ca++-containing medium (incuba- tion periods were 10 min each, for a total of 20 rain in each medium). The composition of the normal K+-Ca +§ free medium (in mM/liter) was 130 NaCI, 5.4 KC1, 0.8 MgSO4, 4.2 MgClz, 1 Na-ethylene glycol-bis(fl-amino- ethyl ether)N,N,N',N'-tetraacetate (EGTA), 10 mM HEPES, and 10 mM glucose; the high K+-Ca++-free medium was the same except that NaCI was lowered to 51 mM and the KC1 was raised to 80 mM; the high K +- Ca++-containing medium was the same as the normal saline solution (see above) except that the NaC1 was lowered to 51 mM and the KCI raised to 80 raM. Each medium was acidified with HC1 (to a concentration of 0.1 M HCI), and the pituitary (after the experiment) was homogenized in 0.1 M HC! as described above. TCA- precipitable and-soluble cpm was determined from each of the medium samples, and was expressed as a fraction of the basal release into the medium (per 10 min of incubation). The labeled proteins and peptides in the release medium, i.e., the high K+-Ca++-containing me- dium, were analyzed by acid-urea gel electrophoresis and thin-layer chromatography, respectively, as described above.
Analysis of Radioactivity Polyacrylamide gels in tubes were sliced by conven-
tional methods and processed for their radioactivity as described elsewhere (24). Slab gels were dried in a Bio- Rad slab gel drier (Bio-Rad Laboratories, Richmond, Calif.) onto 3 MM Whatman filter paper, covered with X-ray film (Kodak Royal X-Omat film, CGR Medical Associates, Rockville, Md) and exposed at -70"C (4). The radioautograms were scanned with an E-M densi- tometer (EM Laboratories, Inc., Elmsford, N. Y.) for a qualitative representation of the radioactive pattern on the gels, and quantitative data were obtained by slicing out the radioactive bands of interest, solubilizing them in an appropriate cocktail (54), and counting their radioac- tivity in a Beckman liquid scintillation counter (Beckman Instruments, Inc., FuUerton, Calif.). Radioactivity in each band was expressed as a percentage of total cpm on the gel.
The TCA-precipitable and-soluble cpm of the tissue and media were obtained by conventional techniques using Whatman 3 MM filter paper pads for TCA precipi- tation. The counting efficiency for asS was 68% and the background was 18 cpm.
R E S U L T S
Incorporation o f as S-Cysteine into Neurohypophysial Proteins and Their Axonal Transport to the Posterior Pituitary
The t ime-course of appearance of S%-labeled pro te in , i .e. , TCA-prec ip i tab le cpm, in the various
regions of the hypothalamo-neurohypophysial sys- tem is shown in Fig. 1. The data in Fig. 1 A (filled circles, solid line) show that, at 30 min after injec- tion of ssS-cysteine into the SON, about 30% of the radioactivity in the SON region was TCA precipitable, and that this value did not change significantly until about 6 h postinjection. Thus,
1.01,, , , , , , u~ 0.81- A SUPRAOPTIC NUCLEUS
< 0 0.2 le''e"
0 I t I I I I
0.10 B MEDIAN EMINENCE
z o t ~ej
u. 0.05 0
Eo. ,~ .......... o .................. .0 u 0 I t i I I
-'J 2.0 C POSTERIOR PITUITARY T
" 9 0 .
< o 1.5
E 4
~ 1.0
o. --*-- Control < 0.5 u --o-- Colchicine Injected t-
0 '--~---n ......... g ......... F ........ -o
2 4 6 12 18 24 HOURS
FIGURE t Time-course of appearance of a~S-labeled proteins in the supraoptic nucleus (A), median eminence (B), and posterior pituitary (C) after a bilateral microin- jection of ~S-cysteine into the SON of female rats. Filled circles show data from control rats; open circles repre- sent data from rats which were intraventricularly injected with colchicine 12 h before injection of the a~S-cysteine. Note that although there is considerable labeled protein in the SON after 30 rain, labeled protein first appears in the median eminence only after 1 h, and in the posterior pituitary after 2 h. In addition, the appearance of axon- ally transported labeled protein is inhibited by colchicine (B) and (C), whereas the percent of incorporation in the SON was unaffected (A) by colchicine. The incorpora- tion into the SON (A) is expressed as the fraction of total cpm in the punched tissue that was TCA precipitable (PPT'L). In (B) and (C) the TCA-precipitable cpm in the tissue was expressed as a fraction of the TCA-precipi- table cpm in the punched SON sample of the same rat. Data (filled circles) are expressed as means -+ standard deviations. The number of experiments for each time- point is shown in (C).
GAINER, SARNE, AND BROWNSTEIN Rat Neurohypophysial Proteins and Peptides 369
Dow
nloaded from http://rupress.org/jcb/article-pdf/73/2/366/1072464/366.pdf by guest on 07 April 2022

the incorporation of ~S-cysteine into protein by the SON was very rapid, and approximated a pulse incubation.
Labeled proteins did not appear at the level of the ME (Fig. 1 B, solid line) until 1 h post-injec- tion, and rose rapidly between 1 and 2 h, reaching a maximum at about 12 h. In the posterior pitui- tary (Fig. 1 C, solid line), labeled proteins were first detected at 2 h and rose rapidly to a maximum value at 12 h. These kinetic data are consistent with the notion that the proteins are first synthe- sized in the SON region and then transported intra-axonally to the posterior pituitary via axons traversing the median eminence. The time lag of 60-120 min between injection in the SON and arrival of labeled proteins in the posterior pituitary is comparable to values found by others in similar experiments with rats (32, 36) and consistent with the expected axonal transport rates of neurohypo- physial proteins (see Table 4 in reference 52). Further evidence for the role of axonal transport in the arrival of labeled proteins in the median eminence and posterior pituitary comes from the colchicine studies shown in Fig. 1. Colchicine, an inhibitor of axonal transport (10, 19, 20, 26), was injected into the lateral ventricles (100 p.g dis- solved in 10 /zl of 0.9% NaCi) 12 h before the bilateral injection of 35S-cysteine in the rat SON. Although this colchicine treatment did not appre- ciably affect 35S-cysteine incorporation into pro- teins in the SON (Fig. 1 A, broken line), the appearance of labeled proteins in the ME (Fig. 1 B, broken line) and posterior pituitary (Fig. 1 C, broken line) was dramatically reduced. Similar effects of colchicine on axonal transport of neuro- hypophysial principles were demonstrated by Nor- strom (31) and Sachs et al. (45).
Analysis of Proteins Transported to the Posterior Pituitary
In an attempt to evaluate the diversity of pro- teins transported to the posterior pituitary after 3~S-cysteine injection into the SON, we separated the labeled proteins from the posterior pituitary (24 h post-injection) by using four different PAGE systems (see Materials and Methods).
The results of these separations are illustrated in Fig. 2. Fig. 2 A shows that the pattern of labeled proteins transported to the posterior pituitary was relatively simple with electrophoresis on pH 9.5 gels. Only one major peak of radioactivity was detected. Separation of the labeled neurohypo- physial proteins on acid-urea gels (pH 2.7 gel) also
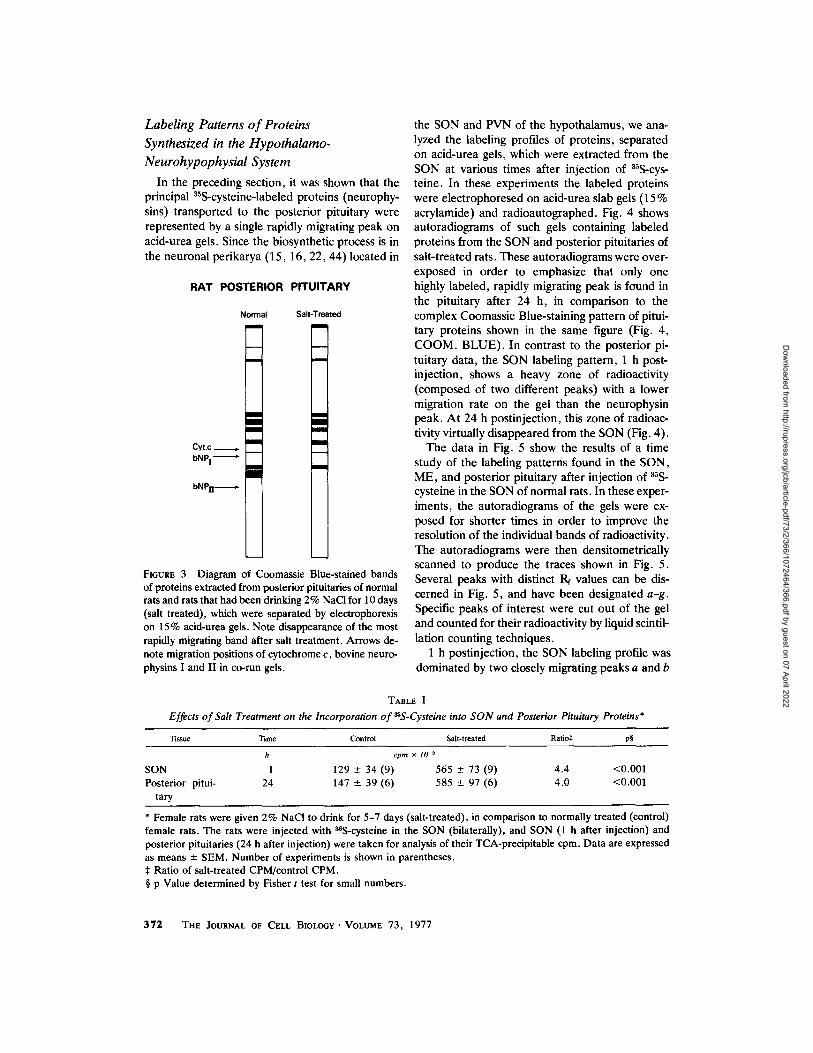
revealed only one major radioactive peak which migrated on the gel between bovine neurophysins I and II (Fig. 2 B). We believe that these labeled peaks (Fig. 2 A and B) represent transported neu- rophysin(s) for several reasons. (a) Neurophysin is known to be the major cysteine-rich, acidic protein transported to the posterior pituitary (16). A similar labeling pattern of transported neuro- physins has been reported by Norstrom et al. (33) using a gel system comparable to our pH 9.5 gel system. (b) These radioactive protein peaks were highly soluble in alcohol, just as has been reported for neurophysin (1, 25, 55). (c) The labeled peak found on acid-urea gels (Fig. 2 B) corresponds in migration position on the gel to a major Coomas- sie Blue-stained band, which is specifically de- creased in staining intensity when the rats are osmotically stressed by 2% NaCI in their drinking water (Fig. 3). (d) These labeled proteins are released from the pituitary by potassium depolari- zation in the presence of calcium (see later) as is expected for neurophysin (12).
With regard to the salt treatment of the rats mentioned above, it is of interest to note that the labeling pattern shown in Fig. 2 B was the same independent of whether the experiments were done on normal or salt-treated, i.e., after 5-10 days of exposure to 2% NaCI in the drinking water, rats. The only difference was that the abso- lute cpm in the peak from salt-treated rats was about fourfold greater than that from normal rats. This was probably due to the fact that salt-treated rats incorporated four times more ~S-cysteine into SON proteins and transported four times more labeled protein to the pituitary in 24 h than nor- mal rats (Table I). In the Coomassie Blue-staining patterns shown in Fig. 3, at least seven major stained bands were detected by acid-urea PAGE of proteins from normal rat pituitary. However, only the most rapidly migrating band contained 35S-labeled proteins. Consistent with this was the observation that this stained band selectively dis- appeared with salt treatment, although the same radioactive peak was still present. Since both vaso- pressin and oxytocin are depleted in the posterior pituitary of rats after prolonged osmotic stress (18), it is possible that both the vasopressin- and oxytocin-associated rat neurophysins, which ap- pear to be distinct proteins (5,37,48) , comigrated in this gel system. In this regard, it is important to note that we have detected both ~S-labeled argi- nine vasopressin and oxytocin in the posterior pituitary 24 h after injection of 35S-cysteine in the
370 THE JOURNAL OF CELL BIOLOGY" VOLUME 73, 1977
Dow
nloaded from http://rupress.org/jcb/article-pdf/73/2/366/1072464/366.pdf by guest on 07 April 2022

20
~-15 d ~ o
,,-4, ( . 9 a0 o
•
E 5 o
pH 9.5 GEL
BSA +
10 20 30 40 SLICE NUMBER
10
8
6
4
2
0
i i i i lo| B bNP, bNP. j lo
+++: +1 +
0 ~ 10 20 30 40
SLICE NUMBER
J q i n i i
c
10 20 30 40 50 60 SLICE NUMBER
MOLECULAR WEIGHT/IO00 68 43 29- 12 3
i ~ i i i
D bliP].,
10 20 30 40 50 60 SLICE NUMBER
lO
9
8
7 I 6 o.
5
4
3
FIGURE 2 Polyacrylamide gel electrophoresis (PAGE) of asS-labeled proteins extracted from rat pituitar- ies 24 h after injection of ~S-cysteine into the SON. (A) Disc PAGE (7.5% acrylamide) in a pH 9,5 (running pH) system. Internal marker protein was bovine serum albumin (BSA). (B) Disc PAGE (7.5% acrylamide) in a pH 2.7 system (acid-urea gel). Internal markers: BSA; bovine neurophysins I and II, bNPt and bNPxl. (C) Isoelectric focusing (IEF) (7.5% acrylamide) with pH 3-10 ampholytes. The broken line shows the actual pH gradient measured using a co-run gel. (D) Disc PAGE in sodium dodecyl sulfate (SDS). Upper abscissa shows slice positions of internal marker proteins of known molecular weight, and arrow shows position of bNP~ and bNP. in a co-run gel. Polyacrylamide concentration of gel was 11%.
SON (see Fig. 8). The ratio of labeled vasopressin to that of oxytocin in the neurohypophysis was about 1.8 in our experiment, which was compara- ble to the value of 1.49 obtained by Burford et al. (6) for the ratio of radioactivity in vasopressin- neurophysin to that in oxytocin-neurophysin after intracisternal injections of 35S-cysteine.
In view of our inability to resolve more than one major radioactive pituitary peak with the above- described gel systems, which separate proteins on the basis of both electrical charge and molecular size properties, we turned to IEF separation pro- cedures. Fig. 2 C shows the results of such experi- ments. The labeled neurohypophysial proteins electrofocused principally in the acidic region of the gel ranging in isoelectric points from pH 4.5 to 5.2 with the peak value at about pH 4.8. In subsequent IEF experiments using expanded pH gradients on the gel, i.e., from pH 3.5 to 7, we
found that the labeled neurohypophysial proteins are represented by two distinct closely migrating peaks with pI values equal to 4.6 and 4.8. These may correspond to the two rat neurophysins re- ported by Burford and Pickering (5) who used a different separation procedure.
Separation of the labeled neurohypophysial proteins by PAGE in SDS showed that the trans- ported proteins were of relatively low molecular weight (Fig. 2 D). Similar findings that the trans- ported, labeled neurohypophysial proteins showed a peak on SDS gels at around 12,000 mol wt (ranging between 10,000 and 14,500 mol wt) have been reported by others (31, 33). It should be pointed out that, although the peak in Fig. 2 D comigrated with the 12,000-tool wt marker-pro- tein in the gel, bovine neurophysins I and II (which are about 10,000 mol wt) also comigrated with this marker-protein (see arrow in Fig. 2 D).
GAINER, SARNE, AND BROWNS'rEIN Rat Neurohypophysial Proteins and Pep#des 371
Dow
nloaded from http://rupress.org/jcb/article-pdf/73/2/366/1072464/366.pdf by guest on 07 April 2022
Labeling Patterns of Proteins Synthesized in the Hypothalamo- Neurohypophysial System
In the preceding section, it was shown that the principal 35S-cysteine-labeled proteins (neurophy- sins) transported to the posterior pituitary were represented by a single rapidly migrating peak on acid-urea gels. Since the biosynthetic process is in the neuronal perikarya (15, 16, 22, 44) located in
RAT POSTERIOR PITUITARY
Cyt.c bNP I
bNPr=
Normal Salt-Treated
m m
m m
=
I l l l l
=
llll m alma
m
Illl
FmURE 3 Diagram of Coomassie Blue-stained bands of proteins extracted from posterior pituitaries of normal rats and rats that had been drinking 2% NaC! for 10 days (salt treated), which were separated by electrophoresis on 15% acid-urea gels. Note disappearance of the most rapidly migrating band after salt treatment. Arrows de- note migration positions of cytochrome c, bovine neuro- physins I and II in co-run gels.
the SON and PVN of the hypothalamus, we ana- lyzed the labeling profiles of proteins, separated on acid-urea gels, which were extracted from the SON at various times after injection of 3%-cys- teine. In these experiments the labeled proteins were electrophoresed on acid-urea slab gels (15 % acrylamide) and radioautographed. Fig. 4 shows autoradiograms of such gels containing labeled proteins from the SON and posterior pituitaries of salt-treated rats. These autoradiograms were over- exposed in order to emphasize that only one highly labeled, rapidly migrating peak is found in the pituitary after 24 h, in comparison to the complex Coomassie Blue-staining pattern of pitui- tary proteins shown in the same figure (Fig. 4, COOM. BLUE). In contrast to the posterior pi- tuitary data, the SON labeling pattern, 1 h post- injection, shows a heavy zone of radioactivity (composed of two different peaks) with a lower migration rate on the gel than the neurophysin peak. At 24 h postinjection, this zone of radioac- tivity virtually disappeared from the SON (Fig. 4).
The data in Fig. 5 show the results of a time study of the labeling patterns found in the SON, ME, and posterior pituitary after injection of 35S- cysteine in the SON of normal rats. In these exper- iments, the autoradiograms of the gels were ex- posed for shorter times in order to improve the resolution of the individual bands of radioactivity. The autoradiograms were then densitometrically scanned to produce the traces shown in Fig. 5. Several peaks with distinct Rr values can be dis- cerned in Fig. 5, and have been designated a-g. Specific peaks of interest were cut out of the gel and counted for their radioactivity by liquid scintil- lation counting techniques.
1 h postinjection, the SON labeling profile was dominated by two closely migrating peaks a and b
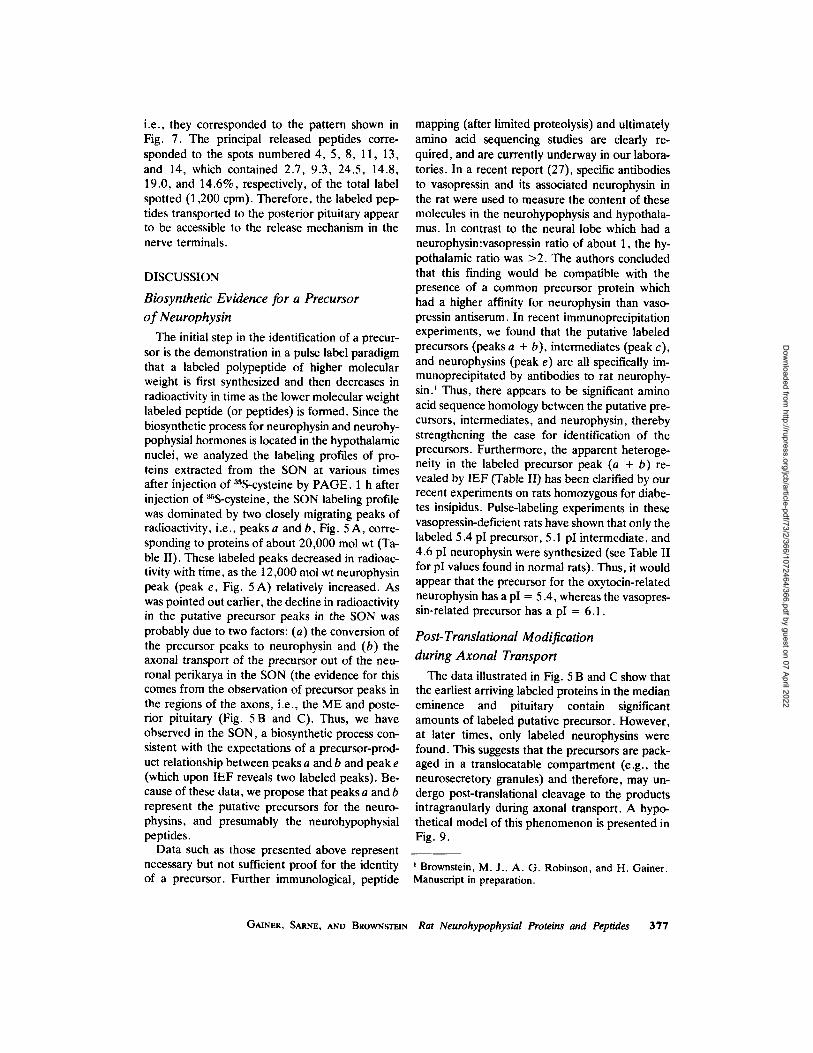
TABLE I
Effects o f Salt Treatment on the Incorporation o f ~S-Cysteine into S O N and Posterior Pituitary Proteins*
Tissue Time Control Salt-treated Ratior pw
h cpm xlO 3
SON 1 129 -+ 34 (9) 565 --- 73 (9) 4 .4 < 0 . 0 0 1
Posterior pitui- 24 147 - 39 (6) 585 +- 97 (6) 4.0 <0.001 tary
* Female rats were given 2% NaC! to drink for 5-7 days (salt-treated), in comparison to normally treated (control) female rats. The rats were injected with ~S-cysteine in the SON (bilaterally), and SON (1 h after injection) and posterior pituitaries (24 h after injection) were taken for analysis of their TCA-precipitable cpm. Data are expressed as means -+ SEM. Number of experiments is shown in parentheses. r Ratio of salt-treated CPM/control CPM. w p Value determined by Fisher t test for small numbers.
3 7 2 THE JOURNAL OF CELL BIOLOGY" VOLUME 73, 1977
Dow
nloaded from http://rupress.org/jcb/article-pdf/73/2/366/1072464/366.pdf by guest on 07 April 2022

FmORE 4 Autoradiographic and Coomassie Blue (COOM. BLUE)-staining patterns of SON and pituitary (PIT) proteins electrophoresed on 15% acid-urea slab gels. The radioactive proteins were obtained from ex- tracts of tissues from salt-treated female rats (5 days), whereas the Coomassie Blue-stained gel contained pos- terior pituitary proteins from a normal (control) female rat. The Coomassie Blue band corresponding to the labeled peak generally appears less densely stained on slab gels than on disc gels shown in Fig. 3. Arrows designate migration positions of bovine serum albumin (BSA) and cytochrome c (Cyt. c) marker proteins co-run on the same slab gel.
of radioactivity (Fig. 5 A), with migration rates much lower than that of the labeled neurophysin peak arriving in the pituitary at 24 h, i.e., peak e in Fig. 5 C. Note that two other minor compo- nents, l a n d g, could also be detected in the 24-h posterior pituitary using autoradiographic tech- niques. Hence, after 1 h, only 8.4% of the total radioactivity in the SON appeared in the rapidly migrating peaks, i.e., peaks d and e, whereas 72.6% of the cpm resided in peaks a and b. As can be seen in Fig. 5 B and C, the relative radioactivity in peaks a and b continued to decrease, while that of peaks d and e increased with time. In compari- son, there appeared to be relatively little change in peak c with time. The above-described events appeared to occur in an identical fashion in both male and female rats which were induced to in- crease their neurohypophysial activity by drinking 2% NaCI (unpublished data).
The apparent decrease in radioactivity" in peaks a and b simultaneous with the increase in relative radioactivity of peaks d and e in the SON, in such a "pulse" label paradigm, is consistent with a precursor-product relationship between these pro-
teins. Since neurophysins are known to be synthe- sized by neurons in the SON (22, 44), and appear to correspond to the labeled peak e in the SON and pituitary after 24 h (Fig. 5), then peaks a and b may represent the protein precursors of the oxytocin-related and vasopressin-related neuro- physins. Since peak d is only found in the SON at short times after the injection of 3sS-cysteine, it is possible that this may be a short-lived intermedi- ate in the conversion of the precursor proteins to neurophysin. In order to determine whether the labeled peaks (a and b) were greater in molecular weight than the presumed product (peak e), la- beled proteins extracted from the SON and poste- rior pituitary 1 and 24 h post-injection, respec- tively, were electrophoresed on acid-urea gels. Peaks a + b, c, and e were located on the gels, cut out, eluted, and evaluated for their apparent molecular weights by three different methods: Sephadex G-75 chromatography, PAGE in SDS, and Ferguson plot analysis (9, 24, 39) of acid-urea gels. The results of all three methods were in close agreement (Table II), showing the molecular weights of the putative precursors (peaks a and b) and neurophysins (peak e) to be 19,000-20,000 mol wt and 12,000-13,000 tool wt, respectively.
SON b B MEDIAN EMINENCE
,h
L 2h ~ e
I~OURE 5 Densitometric tracings of autoradiographs of 15 % acid-urea slab gels on which ~S-labeled proteins from the SON, median eminence, and posterior pituitary were electrophoresed. Normal male rats were injected with asS-cysteine into the SON, and tissues were taken for analysis at various times postinjection (1-24 h). The letters a-g shown over the tracings correspond to distinct radioactive peaks in the autoradiographs.
GAINER, SARNE, AND BROWNSTEIN Rat Neurohypophysial Proteins and Peptides 373
Dow
nloaded from http://rupress.org/jcb/article-pdf/73/2/366/1072464/366.pdf by guest on 07 April 2022

TABLE II Molecular Weight and lsoelectric Point Determina- tions of the Putative Precursors and Neurophysins in the Rat*
Ferguson Protein G-75 plot SDS IEPw
Precursors (peaks a + b)
Intermediates (peak c)
Neurophysins (peak e )
tool wt (x lO-S)r
19 20 20 5.4, 6.1
15 - 15 5.1, 5.6
12 13 12 4.6, 4.8
* Labeled proteins were extracted from the SON and posterior pituitary of salt-treated rats after 1 and 24 h postinjection, respectively, and electrophoresed on acid- urea gels. The labeled peaks from the SON (represented by peaks a, b, and c in Fig. 5 A) and one labeled peak from the pituitary (peak e in Fig. 5 B) were eluted from the gels and analyzed. ~: Molecular weights of the isolated labeled peaks a, b, c, and e were determined by three independent methods: (a) chromatography using Sephadex G-75, (b) Fergu- son plot analysis of acid-urea gels, and (c) SDS gel electrophoresis. w Isoelectric points (IEP) of the isolated proteins were determined by isoelectric focusing of peaks a, b, c, and e on polyacrylamide gels. Each peak eluted from the acid- urea gel run appeared to be heterogeneous. Two major peaks of radioactivity were found each for the precursor (a + b ), the intermediate (c), and the neurophysin (e).
Therefore, these data are consistent with the pro- posal that peaks a and b represent precursors of the labeled proteins in peak e. As pointed out earlier, peak e actually contains two major, dis- tinctly labeled proteins as revealed by IEF (pI 4.6 and 4.8; Table II), and peaks a and b also run as two independent labeled peaks with pI values of 5.4 and 6.1 on IEF gels (Table II). The data represent necessary but not sufficient evidence to prove the identity of a precursor, and further experiments (see Discussion) are clearly necessary for this purpose. However, we have observed, in the SON, a biosynthetic process consistent with the requirements of a precursor-product relation- ship, and tentatively propose that peaks a and b represent the precursors to the neurophysins found in peak e.
Axonal Transport and Post-Translational
Processing o f the Putative Precursor
Although peak e in the SON increases in radio-
activity as peaks a and b decrease (Fig. 5 A), peak e never attains the level of radioactivity expected if there were simply a conversion of a and b to e in the SON, i.e., at 1 h a and b = 72.6%, whereas the maximal value attained in the SON (at 24 h) for peak e = 28.5%. The data illustrated in Fig. 5 A suggest that a significant amount of peaks a and b is transported out of the SON, presumably into the axons, before conversion takes place. Indeed, on the basis of other data, Sachs and colleagues (44) had hypothesized that the conver- sion of the precursor takes place in the axon dur- ing axonal transport. This hypothesis is supported by the data illustrated in Fig. 5 B and C. At early times postinjection (e.g., 1-2 h), when the puta- tive precursor is heavily labeled in the SON (Fig. 5 A), one might expect that the labeled proteins in the axon (derived from axonal transport of pro- teins from the neuronal somata in the SON) should contain significant labeled precursor. How- ever, at later times, i.e., 24 h postinjection, when virtually only labeled neurophysin is present in the SON, the axonally transported proteins should contain principally labeled neurophysin. These ex- pectations are borne out by the data shown in Fig. 5 B. 2 h postinjection, the labeling profile in the median eminence, an area rich in axons from the SON, indicates that about 40% of the radioactiv- ity is in the precursors (Fig. 5 B, peaks a and b). If one considers the time delay between synthesis in the SON and transport to the axons in the ME, it is apparent that the labeled proteins arriving after 2 h in the ME (Fig. 5 B) must have been derived from the population of labeled proteins in the SON after about 1 h (Fig. 5 A). Hence, the pre- cursor to product conversion process, resulting in the labeling pattern seen in Fig. 5 B (2 h), must have occurred intra-axonally during transport. 24 h postinjection, the ME labeling profile displays virtually only neurophysin (Fig. 5 B), consistent with the pattern seen in the SON at that time (Fig. 5 A). A similar sequence of events appears to be evident for the axon terminals in the posterior pituitary (Fig. 5 C).
Peptides Transported to the
Posterior Pituitary If one assumes that the 19,000-20,000-mol wt
putative precursor is converted to a 12,000- 13,000-moi wt neurophysin during axonal trans- port, one might expect to find other peptide prod- ucts (in addition to the 1,100-moi wt vasopressin and oxytocin) as a result of the post-translational
374 TIlE JOURNAL OF CELL BIOLOGY" VOLUME 73 , 1977
Dow
nloaded from http://rupress.org/jcb/article-pdf/73/2/366/1072464/366.pdf by guest on 07 April 2022

cleavage process. Consequently, we have exam- ined the diversity of 35S-cysteine-labeled peptides which are synthesized in the SON and transported to the posterior pituitary.
Fig. 6 depicts the results of Sephadex G-25 chromatography of the TCA-soluble fraction from a posterior pituitary 24 h after injection of asS- cysteine in the SON. The labeled peptides are represented by a broad peak corresponding to molecular weights ranging from 700 to 2,500 mol wt. Note that there is no asS-label which coruns with the riboflavin marker (RIBO, Fig. 6), which indicates that no free asS-cysteine or its oxidized by-products are transported to the pituitary. Simi- lar labeling profiles were obtained from the TCA- soluble fractions from the SON (1 and 24 h postin- jection) after Sephadex G-25 separation.
The labeled peptides from the G-25 separations were lyophilized and spotted on a cellulose (TLC) plate and subjected to two-dimensional TLC. The results of the TLC separations are illustrated in Fig. 7. Fig. 7 shows a peptide map of asS-labeled peptides found in either the SON or the posterior pituitary. 18 distinct spots containing asS-label could be detected in the hypothalamo-neurohypo- physial system. One of these spots (spot 8) ap- pears to be more heavily labeled in the posterior pituitary than either oxytocin (spot 13) or arginine vasopressin (spot 11). That is, of the 103,722 cpm in labeled peptides from the 24-h posterior pitui- tary spotted on the TLC plate, the labels con-
tained (expressed as a percentage of total cpm) in spots 4, 5, 6, 8, 11, 13, and 14 were 3.2, 8.2, 0.7, 33.0, 25.6, 14.0, and 4.7%. Although the func- tional significance of these spots and their relative abundance are still undetermined, it is apparent from these data that many more peptides, other than the known neurohypophysial hormones oxy- tocin and vasopressin, are synthesized in the SON and transported to the posterior pituitary.
A similar chromatographic analysis of the la- beled peptides found in the SON 1 and 24 h postinjection was made. The distribution of label in the 1-h SON peptides was 7.3, 12.6, 1.9, 56.1, 6.1, 1.4, and 0.5% (expressed as a percentage of 121,102 cpm spotted) for spots 4, 5, 6, 8, 11, 13, and 14, respectively; whereas for the 24-h SON peptides, the distribution of label was 7.5, 6.1, 2.6, 52.7, 11.6, 1.6, and 0.1% (102,950 cpm spotted). Thus, the ~S-labeled spots numbered 4, 5, 8, and 11 (Fig. 7) contained substantial radioac- tivity in the SON at both 1 and 24 h. Since both arginine vasopressin (AVP) and oxytocin (OXY) are found in the SON (49), it is of interest that spot 11 (AVP) increased in radioactivity, whereas spot 13 (OXY) did not increase in radioactivity in the SON after 24 h (as compared to 1 h postinjec- tion). However, in the posterior pituitary (24 h), spot 13 contained a substantial amount of the label. The appearance of substantial radioactivity in vasopressin (spot 11) but not oxytocin (spot 13) in the SON (after 24 h) is consistent with previous
Vo .._..V�82 : Vi
AVP RIBO
~, 4
0
x 3 C - - 2 s E
o 2
i
i0 20 30 40 50 60
F R A C T I O N FIGURE 6 Sephadex-G25 separation of TCA-soluble, labeled peptides in the posterior pituitary 24 h after injection of asS-cysteine into the SON. Vo, Ve, and V t represent the void, excluded, and included volumes, respectively. Arrows show the fractions corresponding to arginine vasopressin (AVP) and riboflavin (RIBO).
GAINER, SARNE, AND BROW~STHN Rat Neurohypophysial Proteins and Peptides 375
Dow
nloaded from http://rupress.org/jcb/article-pdf/73/2/366/1072464/366.pdf by guest on 07 April 2022

SON- POSTERIOR PITUITARY
8 9
I C ~ 4C ~ 70
,oc
| t3
| CJ ~ 0 '~ orlgln
2 FIGURE 7 Labeled peptide map obtained by two-di- mensionai TLC of TCA-soluble, labeled peptides in the posterior pituitary 24 h postinjection. Spots numbered 11 and 13 correspond to arginine vasopressin and oxyto- cin, respectively. See text.
suggestions that the precursor to vasopressin is processed more rapidly than that to oxytocin (23, 53).
Release of Labeled Peptides from the Posterior Pituitary
The diversity of labeled peptides found in the pituitary after a~S-cysteine injection in the SON raises the question whether these peptides are released from the posterior pituitary by depolari- zation of the nerve terminals in the presence of extracellular calcium. In these experiments, a~S- cysteine was injected into the SON of normal rats, as opposed to salt-treated rats, in order to mini- mize the release of neurohypophysial principals in vivo. 24 h postinjection, the posterior pituitaries were removed from the rats and incubated in saline containing normal levels of K + and Ca § (see Materials and Methods). These pituitaries were then transferred and incubated serially in the various media in the following sequence: a) 5.4 mM K +, 1.3 mM Ca ++ (basal release media), b) 5.4 mM K § 0 mM Ca ++ (+ 1 mM EDTA), c) 80
++ mM K § 1.3 mM Ca . The TCA-precipitable and -soluble cpm released from the pituitaries into the soluble cpm released from the pituitries into the various media were determined and expressed as a
fraction of the release from the same tissue in the basal release medium. The data are illustrated in Fig. 8. There was no increase in TCA-soluble or -precipitable clam released over basal release by pituitaries depolarized by 80 mM K § in the absence of Ca ++. However, there was a twofold increase in TCA-soluble cpm and a threefold increase in TCA-precipitable cpm when Ca ++ (1.3 raM) was added to the medium containing 80 mM K + (Fig. 8A and B). Between 2 and 5% of the total cpm in the posterior pituitary was released by the cal- cium-dependent, potassium depolarization of the terminals.
Analysis of the TCA-precipitable cpm released into the 80 mM K +, 1.3 mM Ca § medium after electrophoresis on acid-urea gels revealed a pat- tern identical to that shown in Fig. 2 B. The TCA- soluble cpm in the 80 mM K +, 1.3 mM Ca § medium and pituitaries were spotted for two-di- mensional TLC as described earlier. The results of this analysis showed that the labeled peptides which were released into the medium were com- parable to those found in the posterior pituitary,
A
~2
u
5.4 K
0
FIGURE 8
T C A SOL.
§
8 0 K 1.3 Ca
B T C A PPT.
1.3 Cc
Release of labeled peptides by calcium-de- pendent, potassium depolarization of the posterior pitui- tary (24 h after injection of asS-cysteine into the SON of normal rats). (A) TCA-soluble (SOL.) peptides. (B) TCA-precipitable (PPT.) peptides. Data are expressed as cpm released per cpm basal release, i.e., basal release refers to the cpm appearing in the medium in the pres- ence of 5.4 mM K +, and 1.3 mM Ca ++ . See text for details of experiments. The K + and Ca ++ concentration of each medium is shown within the bars in the figure. The data are expressed as the average value _+ SEM. of 13 experiments.
3 7 6 THE JOURNAL OF CELL BIOLOGY" VOLUME 73, 1977
Dow
nloaded from http://rupress.org/jcb/article-pdf/73/2/366/1072464/366.pdf by guest on 07 April 2022
i.e., they corresponded to the pattern shown in Fig. 7. The principal released peptides corre- sponded to the spots numbered 4, 5, 8, 11, 13, and 14, which contained 2.7, 9.3, 24.5, 14.8, 19.0, and 14.6%, respectively, of the total label spotted (1,200 cpm). Therefore, the labeled pep- tides transported to the posterior pituitary appear to be accessible to the release mechanism in the nerve terminals.
DISCUSSION
Biosynthetic Evidence for a Precursor o f Neurophysin
The initial step in the identification of a precur- sor is the demonstration in a pulse label paradigm that a labeled polypeptide of higher molecular weight is first synthesized and then decreases in radioactivity in time as the lower molecular weight labeled peptide (or peptides) is formed. Since the biosynthetic process for neurophysin and neurohy- pophysial hormones is located in the hypothalamic nuclei, we analyzed the labeling profiles of pro- teins extracted from the SON at various times after injection of a~S-cysteine by PAGE. 1 h after injection of a'~S-cysteine, the SON labeling profile was dominated by two closely migrating peaks of radioactivity, i.e., peaks a and b, Fig. 5 A, corre- sponding to proteins of about 20,000 mol wt (Ta- ble II). These labeled peaks decreased in radioac- tivity with time, as the 12,000 mol wt neurophysin peak (peak e, Fig. 5 A) relatively increased. As was pointed out earlier, the decline in radioactivity in the putative precursor peaks in the SON was probably due to two factors: (a) the conversion of the precursor peaks to neurophysin and (b) the axonal transport of the precursor out of the neu- ronal perikarya in the SON (the evidence for this comes from the observation of precursor peaks in the regions of the axons, i.e., the ME and poste- rior pituitary (Fig. 5 B and C). Thus, we have observed in the SON, a biosynthetic process con- sistent with the expectations of a precursor-prod- uct relationship between peaks a and b and peak e (which upon IEF reveals two labeled peaks). Be- cause of these data, we propose that peaks a and b represent the putative precursors for the neuro- physins, and presumably the neurohypophysial peptides.
Data such as those presented above represent necessary but not sufficient proof for the identity of a precursor. Further immunological, peptide
mapping (after limited proteolysis) and ultimately amino acid sequencing studies are dearly re- quired, and are currently underway in our labora- tories. In a recent report (27), specific antibodies to vasopressin and its associated neurophysin in the rat were used to measure the content of these molecules in the neurohypophysis and hypothala- mus. In contrast to the neural lobe which had a neurophysin:vasopressin ratio of about 1, the hy- pothalamic ratio was >2. The authors concluded that this finding would be compatible with the presence of a common precursor protein which had a higher affinity for neurophysin than vaso- pressin antiserum. In recent immunoprecipitation experiments, we found that the putative labeled precursors (peaks a + b), intermediates (peak c), and neurophysins (peak e) are all specifically im- munoprecipitated by antibodies to rat neurophy- sin? Thus, there appears to be significant amino acid sequence homology between the putative pre- cursors, intermediates, and neurophysin, thereby strengthening the case for identification of the precursors. Furthermore, the apparent heteroge- neity in the labeled precursor peak (a + b) re- vealed by IEF (Table II) has been clarified by our recent experiments on rats homozygous for diabe- tes insipidus. Pulse-labeling experiments in these vasopressin-deficient rats have shown that only the labeled 5.4 pI precursor, 5.1 pI intermediate, and 4.6 pI neurophysin were synthesized (see Table II for pI values found in normal rats). Thus, it would appear that the precursor for the oxytocin-related neurophysin has a pI = 5.4, whereas the vasopres- sin-related precursor has a pI = 6.1.
Post-Translational Modification during Axonal Transport
The data illustrated in Fig. 5 B and C show that the earliest arriving labeled proteins in the median eminence and pituitary contain significant amounts of labeled putative precursor. However, at later times, only labeled neurophysins were found. This suggests that the precursors are pack- aged in a translocatable compartment (e.g., the neurosecretory granules) and therefore, may un- dergo post-translational cleavage to the products intragranularly during axonal transport. A hypo- thetical model of this phenomenon is presented in Fig. 9.
Brownstein, M. J., A. G. Robinson, and H. Gainer. Manuscript in preparation.
G~N~, S~a~E, AND BROW~ST~ Rat Neurohypophysial Proteins and Peptides 377
Dow
nloaded from http://rupress.org/jcb/article-pdf/73/2/366/1072464/366.pdf by guest on 07 April 2022

SOMA
SOMA Granule
Pool @
NUCLEUS
GOLGI "t,.b
x
Pro Peptide
\ / Axonal . Transpo~
AXON
AXON TERMINAL
Oo \ Oo~ Recycled Membrane (vesicles)
~ r ~ RELEASE DEPOLARIZATION
+CALCIUM
FIGURE 9 Hypothetical model of biosynthesis, translocation, processing, and release of peptides in a peptidergic neuron. Translation of mRNA occurs on the rough endoplasmic reticulum (R. E. R.) in the neuron soma yielding a propeptide or precursor protein molecule (P~) in the cisternal space of the R. E. R. The packaging of P~ into secretory granules occurs in the Golgi body. The secretory granule represents the site of post-translational processing to smaller peptide products ( P ~ . . . P,) which can occur either in the neuron soma or in the axon during axonal transport. The peptide products (P~) are released from the neuron terminals by depolarization in the presence of extracellular calcium.
In addition to this evidence, several other lines of evidence suggest that the processing of the precursor occurrs intragranularly during axonal transport. Sachs (41) found that the vasopressin content of granules in the neurohypophysis is five- fold greater than in the hypothalamus, and sug- gested that the generation of vasopressin from the precursor occurs principally in a region in between the perikarya in the hypothalamus and the neural lobe, i.e., in the axon. More recently, morphologi- cal evidence in support of intragranular processing has been reported. Using a triple aldehyde fixa- tive, Morris and Cannata (28) found that the dense core or neurosecretory granules in the neural lobe was best preserved at pH 5.0-6.0, but that a marked loss of density of the granule core
occurred at pH 8.0 (only 5% of all granules in the neural lobe remained dense cored at pH 8.0). In contrast, the granules in the perikarya in the SON and PVN showed a high degree of preservation of the dense core at pH 8.0 (7). The authors suggest that this difference in response to fixation at pH 8.0 between hypothalamus and neural lobe may reflect "maturation" changes in the granule during axonal transport. This maturation presumably re- flects the precursor-to-product conversion proc- ess.
Diversity of Peptides Transported to the Posterior Pituitary
The posterior pituitary gland is known to con- tain a wide variety of peptides relative to other
378 THE JOURNAL OF CELL BIOLOGY" VOLUME 73, 1977
Dow
nloaded from http://rupress.org/jcb/article-pdf/73/2/366/1072464/366.pdf by guest on 07 April 2022

tissues (46, 51). The biosynthesis-axonal transport paradigm employed in this study has allowed us to examine which of these peptides were synthesized in the hypothalamus, i.e., the SON in our experi- ments, ultimately for release by the posterior pi- tuitary. Thus, by this approach, we have used two properties of the peptidergic neuron as "biological filters" to elucidate which peptides may be "func- tionally relevant": a) the axonal transport mecha- nism and b) the release mechanism at the nerve terminal. For the latter, the criterion of calcium- dependent release (12) was used.
At least six substantially labeled peptides, in addition to oxytocin and vasopressin, were de- tected in the SON and the posterior pituitary, and were released by calcium-dependent, potassium depolarization of the pituitary. It should be pointed out that this represents a minimum esti- mate since only 35S-cysteine-containing peptides could be detected in these experiments. The use of other labeled amino acid precursors in future ex- periments may allow the resolution of still other peptides which are synthesized in the SON and transported to the neurohypophysis. The func- tional significance of these peptides, other than oxytocin and vasopressin, is unclear. Whether they are simply degradative by-products of the post-translational cleavage of the precursor or are mediators of some still unknown hormonal func- tions (possibly trophic) of the posterior pituitary remains to be determined.
Received for publication 30 September 1976, and in revised form 17 January 1977.
REFERENCES
1. ALEERS, R. W., and M. W. BPatHTm~N. 1959. A major component of neurohypophysial tissue associ- ated with antidiuretic activity. J. Neurochem. 3:269-276.
2. BAatMANN, W. 1968. Neurohypophysis: structure and function. In Neurohypophysial Hormones and Similar Polypeptides. B. Berde, editor. Springer- Verlag, Berlin. 1-39.
3. BARKER, J. L. 1976. Peptides: roles in neuronal excitability. Physiol. Rev. 56:435-452.
4. BONNER, W. M., and R. A. LAsr,~y. 1974. A film detection method for tritium-labeled proteins and nucleic acid in polyacrylamide gels. Eur. J. Bio- chem. (Tokyo). 46:83-88.
5. BURFORD, G. D., and B. T. thCrd~PaNG. 1972. The number of neurophysins in the rat. Influence of the concentration of bromphenol blue, used as a track-
ing dye, on the resolution of proteins by polyacryl- amide gel electrophoresis. Bioehem. J, 128:941- 944.
6. BURFORD, G. D., R. E. J. DYBALL, R. L. Moss, and B. T. PICr~RINt. 1974. Synthesis of both neu- rohypophysial hormones in both the paraventricular and supraoptic nuclei of the rat. J. Anat. 117:261- 269.
7. CANNATA, M. A., and J. F. MoirEs. 1973. Changes in the appearance of hypothalamus-neuro- hypophysial neurosecretory granules associated with their maturation. J. Endocrinol. 57:531-538.
8. CHAIK~N, I. M., R. E. RANDOLPH, and H. C. TAYLOR. 1975. Conformational effects associated with the interaction of polypeptide ligands with neu- rophysins. Ann. N. Y. Acad. Sci. 248:442-450.
9. CHRAMnACH, A., and D. ROUBAnD. 1971. Poly- acrylamide gel electrophoresis. Science (Wash. D. C.). 172:440-451.
10. DAHLSTltOM, A. 1971. Effects of vinblastine and colchicine on monamine containing neurons of the rat, with special regard to the axoplasmic transport of amine granules. Acta Neuropath. Suppl. 5:226- 237.
11. DEAn, C. R., M. D. HOLLENBERG, and D. B. HOVE. 1967. The relationship between neurophysin and the soluble proteins of pituitary neurosecretory granules. Biochem. J. 104:8-10c.
12. DOUGLAS, W. W., and A. M. POmNER. 1964. Stim- ulus-secretion coupling in a neurosecretory organ. The role of calcium in the release of vasopressin from the neurohypophysis, J. Physiol. 172:1-8.
13. GAINER, H., 1976. Peptides and Neuronal Func- tion. Adv. Biochem. Psychopharmacol. 15:193- 210.
14. GAINER, H., Y. SARNE, and M. J. BROWNS'rFaN. 1977. Neurophysin biosynthesis: conversion of a putative precursor during axonal transport. Science (Wash. D. C.), In press.
15. HELLER, H. 1974. History of neurohypophysial re- search. Handb. Physiol. 7:103-117.
16. HOVE, D. B., and J. C. PICKUp. 1974. Neurophy- sins. Handb. Physiol. 7:173-189.
17. IMAL K., P. BOtILEN, and S. STEIN. 1974. Detec- tion of fluorescamine-labeled amino acids, peptides, and other primary amines on thin-layer chromato- grams. Arch. Biochem. Biophys. 161:161-163.
18. JONES, C. W., and B. T. PICXERtnG. 1969. Compari- son of the effects of water deprivation and sodium chloride inhibition on the hormone content of the neurohypophysis of the rat. J. Physiol. (Lond.). 203:449-458.
19. KA~LSON, J.-O., and J. SJOS~.AND. 1969. The ef- fect of colchicine on the axonal transport of protein in the optic nerve and tract of the rabbit. Brain Res. 13:617-619.
20. KnEtrrZaERt, G. W. 1969. Neuronal dynamics and axonal flow. IV. Blockage of intra-axonai enzyme
GAINER, SARNE, AND BROWNS'rEIN Rat Neurohypophysial Proteins and Peptides 379
Dow
nloaded from http://rupress.org/jcb/article-pdf/73/2/366/1072464/366.pdf by guest on 07 April 2022

transport by colehicine. Proc. Natl. Acad. Sci. U. S. A. 62:723-728.
21. LASEK, R. J., H. GAINER, and R. J. PRYZBYLSKI. 1974. Transfer of newly synthesized proteins from Schwann cells to the squid giant axon. Proc. Natl. Acad. Sci. U. S. A. 71:1188-1198.
22. LEDERIS, K. 1974. Neurosecretion and the func- tional structure of the neurohypophysis. Handb. Physiol. 7:81-102.
23. LEOEmS, K., and K. JAYASENA. 1970. Storage of neurohypophysial hormones and the mechanism for their release. In International Encyclopedia of Phar- macology and Therapeutics. H. Heller and B. T. Picketing, editors. Pergamon Press Ltd., Oxford. 1:111-154.
24. Loll, Y. P., and H. GAINER. 1975. LOW molecular weight specific proteins in identified molluscan neu- rons. I. Synthesis and storage, Brain Res. 92:181- 192.
25. MACARTItUR, C. G. 1931. A new posterior pitui- tary preparation, Science (Wash. D. C.). 73:448.
26. McGREGOR, A. M., Y. KOMUA, A. D. KIDMAN, and L. AUSTIN. 1973. The blockage of axoplasmic flow of proteins by colchicine and cytochalasins A and B. J. Neurochem. 21:1059-1066.
27. McPHERSON, M. A., and B. T. PICKERING. 1975. Preliminary studies on the characterization of anti- bodies to the rat neurophysins, and their use in affinity chromatography. J. Endocrinol., 67:43P- 44P.
28. Moams, J. F., and M. A. CANNATA. 1973. Ultra- structural preservation of the dense core of poste- rior pituitary neurosecretory granules and its impli- cations for hormone release. J. Endocrinol. 57:517- 529.
29. NEVILLE, D. 1971. Molecular weight determination of protein-dodecyl sulfate complexes by gel electro- phoresis in a discontinuous buffer system. J. Biol. Chem. 246:6328-6334.
30. NICOLL, R. A. 1975. Promising peptides. In Neuro- transmitters, Hormones and Receptors: Novel Ap- proaches. J. A. Ferrendelli, B. S. McEwen, and S. Snyder, editors. Society for Neuroscience, Be- thesda, Md. 1:99-122.
31. NO~SrROM, A. 1975. Axonal transport and turn- over of neurohypophysial proteins in the rat. Ann. N. Y. Acad. Sci. 248:46-63.
32. NORSTROM, A., and J. SJOSTRAND. 1971. Axonal transport of proteins in the hypothalamo-neurohy- pophysial system of the rat. J. Neurochem. 18:29- 39.
33. NORSTROM, A., J. SJOSTRAND, B. G. LWEyr, O. UTrENTHAL, and D. B. HOPE. 1971. Electropho- retic and immunological characterization of rat neu- rophysin. Biochem. J. 122:671-676.
34. O'FAm~ELL, P. H. 1975. High resolution two-di- mensional electrophoresis of proteins. J. Biol. Chem. 250:4007-4021.
35. PALKOVITZ, M. 1973. Isolated removal of hypotha- lamic or other brain nuclei of the rat. Brain Res. 59:449-450.
36. lhCKERrN6, B. T., and C. W. JONES. 1971. The biosynthesis and intraneuronal transport of neuro- hypophysial hormones: preliminary studies in the rat. In Subcellular Organization and Function in Endocrine Tissues. H. Heller and K. Lederis, edi- tors. Cambridge University Press, New York 337- 351.
37. PICKERING, B. T., C. W. JONES, G. D. BURFORD, M. McPHE~SON, R. W. SWANN, P. F. HEAr, and J. F. MORRIS. 1975. The role of neurophysin proteins: suggestions from the study of their transport and turnover, Ann. N. Y. Acad. Sci. 7,48:15-35.
38. REICHLIN, S., R. SAPERSTERN, I. M. D. JACKSON, A. E. Bovo, and Y. PATEL. 1976. Hypothalamic hormones. Ann. Rev. Physiol. 38:389-424.
39. RODBARD, D., and A. CHgAMaACH. 1971. Estima- tion of molecular radius, free mobility, and valence using polyacrylamide gel electrophoresis. Anal. Bio- chem. 40:95-134.
40. SACHS, H. 1960. Vasopressin biosynthesis. I. In vivo Studies. J. Neurochem. 5:297-303.
41. SACHS, H. 1963. Studies on the intracellular distri- bution of vasopressin. J. Neurochem. 10:289-297.
42. SACHS, H., and Y. TAKABATAKE. 1964. Evidence for a precursor in vasopressin biosynthesis. Endocri- nology. 75:943-948.
43. SACHS, H., S. SAITO, and D. SUNDE. 1971. Bio- chemical studies on the neurosecretory and neuro- glial cells of the hypothalamo-neurohypophysial complex. In Subcellular Organization and Func- tion in Endocrine Tissues. H. Heller and K. Lederis, editors. Cambridge University Press, New York 325-336.
44. SACHS, H., P. FAWCEa~r, Y. TAKABATAKE, and R. PORTANOVA. 1969. Biosynthesis and release of va- sopressin and neurophysin. Recent Prog. Horm. Res. 25:447-491.
45. SACHS, H., D. PEARSON, and A. NUREDDIN. 1975. Guinea pig neurophysin: isolation, developmental aspects, biosynthesis in organ culture. Ann. N. Y. Acad. Sci. 248:36-45.
46. SHIN, S., F. LABELLA, and G. QUEEN. 1970. Char- acterization of amino acids and low molecular weight peptides bound to cytoplasmic granules from the posterior pituitary. Can. J. Biochem. 48:455- 462.
47. STEINER, D. F., W. KEMMLER, H. S. TAGER, and J. D. PETERSON. 1974. Proteolytic processing in the biosynthesis of insulin and other proteins, Fed. Proc. 33:2105-2115.
48. SUNDE, D. A., and H. W. SOKOL. 1975. Quantifica- tion of rat neurophysins by polyacrylamide gel elec- trophoresis (PAGE): application to the rat with hereditary hypothalamic diabetes insipidus, Ann. N. Y. Acad. Sci. 248:345-364.
380 THE JOURNAL OF CELL BIOLOGY" VOLUME 73, 1977
Dow
nloaded from http://rupress.org/jcb/article-pdf/73/2/366/1072464/366.pdf by guest on 07 April 2022

49. SWAAB, D. F., F. NI.rVELDT. and C. W. POOL. 1975. Distribution of oxytocin and vasopressin in the rat supraoptic and paraventricuiar nucleus, J. Endocrinol. 67:461-462.
50. TAr, ASATAKE, Y., and H. SACHS. 1964. Vasopres- sin biosynthesis. III. In vitro studies. Endocrinol- ogy. 75:934-942.
51. UrroN, G. V., A. B. LERNER, and S. LANDr.. 1966. Pituitary peptides. Resolution by gel filtration, J. Biol. Chem. 241:5585-5589.
52. VALrtN, H., J. Sa~wARr, and H. W. SOKOL. 1974. Genetic control of the production of posterior pitui-
tary principles. Handb. Physiol. 7:131-171. 53. VOGT, M. 1953. Vasopressin, antidiuretic, and oxy-
tocic activities of extracts of the dog's hypothala- mus, Br. J. Pharmacol. 8:193-196.
54. WARD, S., D. L. WILSON, and J. J. GILLIAM. 1970. Methods for fractionation and scintillation counting of radioisotope labeled polyacrylamide gels. Anal. Biochem. 38:90-97.
55. Woo, T. C., and M. SA~.^N. 1969. Isolation and characterization of a hormone-binding polypeptide from pig posterior pituitary powder. J. Biol. Chem. 244:482-490.
GAINER, SARNE, AND BROWNSTEIN Rat Neurohypophysial Proteins and Peptides 381
Dow
nloaded from http://rupress.org/jcb/article-pdf/73/2/366/1072464/366.pdf by guest on 07 April 2022