Embed Size (px)
Citation preview

BioMed CentralBioMedical Engineering OnLine
ss
Open AcceResearchInvestigation of non-uniform airflow signal oscillation during high frequency chest compressionKiwon Sohn1, Warren J Warwick*2, Yong W Lee1, Jongwon Lee1 and James E Holte1Address: 1Department of Electrical and Computer Engineering, University of Minnesota, Minneapolis, MN, USA and 2Department of Pediatrics, University of Minnesota, Minneapolis, MN, USA
Email: Kiwon Sohn - [email protected]; Warren J Warwick* - [email protected]; Yong W Lee - [email protected]; Jongwon Lee - [email protected]; James E Holte - [email protected]
* Corresponding author
AbstractBackground: High frequency chest compression (HFCC) is a useful and popular therapy forclearing bronchial airways of excessive or thicker mucus. Our observation of respiratory airflow ofa subject during use of HFCC showed the airflow oscillation by HFCC was strongly influenced bythe nonlinearity of the respiratory system. We used a computational model-based approach toanalyse the respiratory airflow during use of HFCC.
Methods: The computational model, which is based on previous physiological studies andrepresented by an electrical circuit analogue, was used for simulation of in vivo protocol that showsthe nonlinearity of the respiratory system. Besides, airflow was measured during use of HFCC. Wecompared the simulation results to either the measured data or the previous research, tounderstand and explain the observations.
Results and discussion: We could observe two important phenomena during respirationpertaining to the airflow signal oscillation generated by HFCC. The amplitudes of HFCC airflowsignals varied depending on spontaneous airflow signals. We used the simulation results toinvestigate how the nonlinearity of airway resistance, lung capacitance, and inertance of aircharacterized the respiratory airflow. The simulation results indicated that lung capacitance or theinertance of air is also not a factor in the non-uniformity of HFCC airflow signals. Although notperfect, our circuit analogue model allows us to effectively simulate the nonlinear characteristics ofthe respiratory system.
Conclusion: We found that the amplitudes of HFCC airflow signals behave as a function ofspontaneous airflow signals. This is due to the nonlinearity of the respiratory system, particularlyvariations in airway resistance.
BackgroundHigh Frequency Chest Compression (HFCC) [6,9,19,29]is a useful and popular therapy for clearing bronchial air-
ways of excessive or thick mucus since it does not requirepatients to do any directed efforts for respiration whiletherapy is given, unlike other airway clearance techniques
Published: 19 May 2005
BioMedical Engineering OnLine 2005, 4:34 doi:10.1186/1475-925X-4-34
Received: 10 March 2005Accepted: 19 May 2005
This article is available from: http://www.biomedical-engineering-online.com/content/4/1/34
© 2005 Sohn et al; licensee BioMed Central Ltd. This is an Open Access article distributed under the terms of the Creative Commons Attribution License (http://creativecommons.org/licenses/by/2.0), which permits unrestricted use, distribution, and reproduction in any medium, provided the original work is properly cited.
Page 1 of 14(page number not for citation purposes)

BioMedical Engineering OnLine 2005, 4:34 http://www.biomedical-engineering-online.com/content/4/1/34
such as active cycle of breathing or autogenic drainage[17]. A HFCC machine pumps air into an inflatable jacketworn by patient. By means of a surrogate piston, sinewaveform compression pulses with frequencies rangingfrom ~5 Hz to ~21 Hz are supplied to the thorax of apatient through the jacket. These pulses squeeze andvibrate the patient's thorax at prescribed frequencies.These actions help in the evacuation of mucus throughchanging the rheological property of the mucus and air-flow oscillation. King et al. [13], Krumpe et al. [15], andTomkiewicz at al. [28], showed that HFCC pulses decreasethe viscosity of mucus and helps evacuation. A moreimportant consequence is the respiratory airflow oscil-lated during use of HFCC, which results from variation ofintrapleural pressure. Lapin [17] and Warwick [30]pointed out that airflow is the most important factor formucus transport since airflow produces the shear stressesfor evacuation of mucus.
Although several models have been developed to simulaterespiration by other researchers and their models success-fully worked for their own purposes, these models are notappropriate for HFCC simulation because these modelswere either linearized [7,8] or because they assumed thatrespiration was driven by a mechanical ventilator at themouth [5,20]. The model presented in this paper providesreliable simulation results on fast change of intrapleuralpressure (Ppl) altered by HFCC because this model isdescribed with nonlinear equations and Ppl is selected asthe driving force of respiration. The nonlinear characteris-tics of the respiratory system are not easily noticed duringquiet tidal breathing, but the airflow signal oscillationmeasured at the mouth during use of HFCC is a strongindicator of the nonlinear characteristics of the respiratorysystem.
In this study, we simulated the respiratory system with acomputational model that carefully reflected its nonlinearcharacteristics. The model is an electrical circuit analogue,in which nonlinear resistors (R's), capacitors (C's), andinductors (L's) represent airway resistance, lung capaci-tance, and inertance of air, respectively. Just like in a livingorgan, the driving force of this model is Ppl which is asuperposition of HFCC pulses on the spontaneous breath-ing effort. We compared the simulation data to the in vivodata to demonstrate and understand the characteristics ofairflow signal oscillation.
MethodsConceptual model of the respiratory systemOur modelling and simulation for reproducing airflowsignals required simplification of airway structure in thelung. The geometrical and dimensional structures of theairways were proposed by several researchers, amongwhich Horsefield et al. [10] and Weibel [31] dissected and
measured the human lungs and airways, and morerecently, and Tawhai et al. [11] and Kitaoka et al. [14] pro-posed algorithmic approaches for reconstructing thebranching structure. We employed Weibel's morphome-try of the lung, which provides the geometries and thedimensions based on the symmetric dichotomous struc-ture of airway branching when the lung volume isassumed to be 75% of the total lung capacity (TLC).According to his morphometry, the trachea is defined asairway generation 0 and it is separated into two geometri-cally identical daughter branches. Each daughter is repeat-edly branched up to 22 times, thus the lung is consideredto have 24 (0–23) airway generations and the number ofairway branches total ~1.7 × 10⁷. In each airway genera-tion, there are 2z (z is a generation number) identicalbranches whose lengths and radii are provided and thedimensions of airway branches in each generation differfrom generation to generation. He also suggested that air-way generations 0–16 comprise the conducting zone,whereas airway generations 17 – 23 make up the respira-tory zone in which gases are exchanged.
Based on Weibel's morphometry of the lung, we simpli-fied the geometry of the airways. For airway generation Zin conducting zone, a bundle of 2z identical airwaybranches are considered as the big tube whose cross sec-tional area equals to 2z times the cross sectional area of asingle airway branch. The tubes for each airway generationare represented by RCL T-networks shown in fig. 1 (b),and evaluation of the R's, C's, and L's in the RCL T-net-work are explained in equations (4) – (6). Meanwhile, therespiratory zone is considered as a big lump, the alveolarspace, since alveolar ducts and sacs are scattered through-out the respiratory zone [8]. Although the upper airway isnot presented in Weibel's morphometry, it is one of thechief sites for airway resistance.
Our conceptual model as a summary of the simplifica-tion, 'the upper airway + 17 conducting airway genera-tions + the alveolar space', is demonstrated in fig. 1 (a),and circuit analogue converted from fig. 1 (a) is shown infig. 1 (c).
Dimensions of airway branchesSince the dimensions of every single airway branch in thelung vary during respiration, it is crucial to track them toextract proper values of R's, C's, and L's. The radii of theairway branches in airway generation Z are determined bytransmural pressure (PtmZ), pressure difference betweenthe pleural cavity and inside airway generation Z. In orderto determine PtmZ, we need to rely on the study abouttranspulmonary pressure (Ptp), pressure differencebetween the pleural cavity and alveolar space. Accordingto Salizar et al. [26], Ptp is a function of lung volume (LV)and TLC. With given LV, Ptp is obtained by,
Page 2 of 14(page number not for citation purposes)

BioMedical Engineering OnLine 2005, 4:34 http://www.biomedical-engineering-online.com/content/4/1/34
(a) The conceptual model based on Weibel's morphometry of the lung [31]Figure 1(a) The conceptual model based on Weibel's morphometry of the lung [31]. The lung and airways are comprised of five regions, namely, the alveolar space, the conducting airway zone, the pleural cavity, the thorax outside the lung, and outside the thorax. (b) RCL T-network that represents a region (airway generation) in the conducting airway zone. (c) Electrical circuit analogue converted from (a). For acronyms in the figure, see list of abbreviations.
Page 3 of 14(page number not for citation purposes)

BioMedical Engineering OnLine 2005, 4:34 http://www.biomedical-engineering-online.com/content/4/1/34
Ptp = -log (1 - LV / TLC) × 7.22. (1)
If LV is functional residual capacity (FRC) and no airflowexists in the airways, the lung is at rest. In this situation,air pressure at any site is the same and atmospheric (zero),therefore PtmZ and Ptp are the same. Our simulation beginswith assuming that the lung was at rest. The equation ofLambert et al., or Lambert's tube law [16], is a function ofPtmZ, and gives the ratio of the cross sectional area (AZ) tothe maximum cross sectional area of an airway branch(AmaxZ) in airway generation Z. That is,
AZ / Amax Z = 1.0 - (1.0 - α0)(1.0 - PtmZ / P0)-N (2)
where α0, α0' and N are constants for each airway genera-tion given from Lambert's tube law, and P0 = (α0-1)N/α0'.As mentioned earlier, the dimensions of the airwaybranches provided by Weibel's morphometry are basedon 75 % of TLC. Let AZ75 be Weibel's cross sectional areasin airway generation Z. By using
AmaxZ for each airway generation can be found. Since AmaxZdoes not change whether or not the lung is at rest, theequation is valid to find out AZ during respiration.
The length of an airway branch is assumed to vary in awaythat;
lz / lFRC = rz / rFRC (3)
where lz and rz are the length and the radius of an airwaybranch in airway generation Z, respectively. lFRC and rFRCare the length and the radius on FRC, respectively.
Equivalent circuit elements modellingThe RCL T-network consists of two resistors (RgZ), twoinductors (LgZ), a capacitor (CgZ), and a DC voltage source(Ptm_ini). RgZ and LgZ are the airway resistance and the iner-tance of air in the entire airway generation Z, respectively.CgZ, the airway capacitance of the entire airway generationZ, represents inflation and deflation of the non-rigid air-way wall during respiration. Ptm_ini is the initial value ofPtmZ. This initial pressure counterbalances Ppl, which isnegative when the lung is at rest.
The values of the circuit elements in the RCL T-network ofairway generation Z can be obtained by totalling the 2z air-way branches. Therefore, RgZ is given by
Similarly, Lgz is given by
and CgZ is
CgZ = CsZ × Nz [ml/cmH2O], (6)
where RsZ, LsZ, and CsZ indicate the values of a single air-way branch in airway generation Z. Nz is 2z, the number ofairway branches in generation Z.
RsZ depends on the classic Poiseuille equation and the Zetacorrection factor proposed by Pedley et al. [21]. The Zetacorrection factor is given by
and
Re is Reynolds number , V is air velocity, ρ is the
density of air, and η is the viscosity of air.
Because electric current flows at the speed of light in anelectrical circuit, it is necessary to compensate for theincomparably slower behaviour of airflow in the airwaysby placing inductors. Inertance of air in a single airwaybranch (LsZ) depends on the dimension of the airwaybranch [5] and it is given by
To compute the values for CsZ in equation (2), relationbetween AZ and PtmZ in airway generation Z, is used again.That is,
The alveolar space is represented by a capacitor in the cir-cuit analogue. Alveolar capacitance (Cas) is the ratio of the
AA
P PZ
Z
tmZNmax
. . . /, ’=
− −( ) −( )( )−
75
0 01 0 1 0 1 02
α
RR
NgZsZ
z= ⋅[ ] ( )cmH O s/ml2 . 4
LL
NgZsZ
z= ⋅ ( )[ / ,cmH O s ml]2
2 5
Zeta R r le z z= × ( )0 327 2 7. / ,
R
l
rZeta Zeta
l
rZeta
sZ
z
z
z
z
=
× ≥( )
<( )( )
81
81
84
4
ηπ
ηπ
,
2ρηVrz
Ll
rsZ
z
z
= ( )ρπ 2
9.
CVolume A l
sZz z= ∂
∂=
∂ ×∂
( )Pressure Pressure
( )10
=− −( ) −( ) × × ×
−( ) ( )−
1 1
111
0 02
0 0
α P P N A l
P P P
tmZN
z z
tmZ
/
/.
max
Page 4 of 14(page number not for citation purposes)

BioMedical Engineering OnLine 2005, 4:34 http://www.biomedical-engineering-online.com/content/4/1/34
alveolar volume (∆AV) to ∆Ptp. Lung volume (LV) consistsof airway volume and alveolar volume, and airway vol-ume is negligible compared to alveolar volume.Therefore,
which implies that represents Cas. It can be obtainedby equation (1); however, the equation did not considerthe hysteresis of Ptp-volume curves that is caused by sev-eral proposed reasons [1]. To overcome this, we definedCas as *k (k<0), and k was continuously changed
over the time course of the simulation. The values of kwere empirically determined to achieve the acceptableshape of the hysteresis, which is shown in fig. 2.
A resistor and an inductor characterize the upper airway,from the nasal/oral cavity to larynx. The equations for theresistance of the upper airway (Rua) that Jackson et al. [12]validated are described below:
Ptp-volume curves of the lung model during use of HFCCFigure 2Ptp-volume curves of the lung model during use of HFCC. Although the initial LV (FRC) is 2700 ml, LV during use of HFCC is smaller. The curves became jagged due to HFCC pulses.
∆∆
∆∆
AV
P
LV
Ptp tp≈ ( ), 12
∆∆
LV
Ptp
∆∆
LV
Ptp
R F
R
ua ua
ua
= + ( )= +
0 00038 0 00079
0 00031 0 000
. .
. .
during expiration
33513
Fua during inspiration( )( )
,
Page 5 of 14(page number not for citation purposes)

BioMedical Engineering OnLine 2005, 4:34 http://www.biomedical-engineering-online.com/content/4/1/34
where Fua is the airflow rate in the upper airway. As Mar-chal et al. [18] estimated, the value of the inductor thatrepresents inertance of air is 0.00003 [cmH2O·s2/ml].
Numerical methods for nonlinear circuit analogueAlthough the number of elements is manageable and thestructure of circuit is fairly simple, analysis of the circuitanalogue in fig. 1 (c) is not trivial since the values of all theenergy-storing (C's and L's) elements as well as resistiveelements (R's) change at every sequence of the simulationtime-step. To exemplify a general idea of numerical meth-ods for the nonlinear circuit analogue, analysis of a simplenonlinear second-order system in fig. 3 was demon-strated. The system of fig. 3 is described by an equation:
where vC is the voltage difference between each end of thecapacitor. Note that R(•) is a function of i and vC, and L(•)and C(•) are functions of vC just like in fig. 1 (c). Usingbackward Euler approximation [22], equation (14) is con-verted to a difference equation:
where ∆t is time difference between sequence [n] and [n-1]. Equation (15) is the same as
By the definition of backward Euler approximation, the
current of the circuit .
Then equation (16) can be restated as an equation;
In equation (17), the right hand side consists of all knownvalues, and the left hand side is a function of vC[n]. Sup-pose that vC[n] is x, equation (17) can be expressed as
f(x) = c, (18)
where c is a constant. Equation (18) can be easily solvedusing an iteration method [24]. To do this computation,MATLAB (Mathworks, Natick, MA) codes were written.
Protocols for measurement airflow signalsIn this study, The Vest™ (Advanced Respiratory, St.Paul,MN, USA; now named Hill-Rom Co.,Inc.), which deliverssine waveform compression pulses, was used for applica-tion of HFCC to a subject for measuring and recording theairflow signals at the mouth. The general usage of HFCCdevice was early described in the review of Hansen et al.[9] and the typical respiratory airflow during use of HFCCis shown in fig. 4.
The subject sat upright on a chair for measuring andrecording the airflow signals at the mouth with an in-house built electronic spirometer. The subject worn a noseclip and breathed through a mouthpiece. After the HFCCdevice is properly set up, the compression pulses wereapplied and then the subject made several slow and large,but not to TLC, breaths. During the breaths the subjecthold his glottis open until data collection was completed.This protocol was followed for the low (5 Hz), high (21Hz), and medium frequencies (15 Hz) of HFCC pulses.Before each frequency recording of airflow signals, thesubject rested for one minute. To ensure that the subjecthad adapted to HFCC pulses and had reached a steadystate, only the last ten seconds of the one- minute breath-ing were recorded and analyzed for our study.
ResultsFor the simulation, the parameters of the lung were deter-mined to represent a normal healthy lung. The TLC, FRC,and RV of the model lung are 6000 ml, 2700 ml, and 1000ml, respectively. The ambient atmospheric pressure isassumed to be zero, and the air density and viscosity are0.00113 g/cm3 and 0.00019 g/cm·s, respectively. It wasassumed that there would be no airflow in the airways andthat initially the LV would be the same as the FRC. Changeof Ppl is the primary driving force of respiration and is
A nonlinear second-order system in the form of an electrical circuitFigure 3A nonlinear second-order system in the form of an electrical circuit. i is electrical current, and vC is voltage difference between each end of C. The value of the resistor (R) in this figure is dependant on i as well as vC whereas the capacitor (C) and the inductor (L) are dependent only on vC. Vin(t) is a voltage source for this simple circuit system. Nonlinear cir-cuit elements in this circuit imply the nonlinearity of fig. 1 (c).
R v i i L vdi
dtv V tC C C in( , ) ( ) ,+ + = ( ) ( )14
( ( [ [ [ [ [[ [
R n], n]) n]) L( n]) n]L( n]) n ]
tv i i v i
v iC C
C⋅ + ⋅ −⋅ −
1
∆++ = ( )vC[ [n] V n], 15in
( ( [ [ [ [ [ [[ [
R n], n]) L ( n])) n] n] V n]L( n 1]) n
n inv i v i vv i
C C CC+ ⋅ + = +
− ⋅ −− ( )116
]
t∆.
i v nv n v n
CC C[ ( [ ])
[ ] [ ]n] C
t=
− −1
∆
R n],C( ])t
L n]) C(nv v nv n v n
v vC CC C
C C[ [[ ] [ ]
( [ . [− −
+
1
∆nn
v n v nv n
vv i
C CC
CC
])[ ] [ ]
[ ]
[ ] [ ][ ]) [ ]
− −+
= − − +− ⋅ −
1
11 1
∆t
V n nL( n n
in ∆∆t.
17( )
Page 6 of 14(page number not for citation purposes)

BioMedical Engineering OnLine 2005, 4:34 http://www.biomedical-engineering-online.com/content/4/1/34
initially -4.32 cmH2O, which is the counterbalance to ini-tial Ptp given by equation (1).
Fig. 4 is the airflow the oesophageal pressure measured byFink et al. [6], which shows typical respiratory airflow dur-ing use of HFCC. Fig. 5 shows the subject's airflow signalsduring ten seconds at the three different frequencies. Inthis figure, each airflow signal is also viewed as the low-pass filtered and the high-pass filtered curves. The high-pass filtered curve indicates the fast airflow signal oscilla-tion generated by HFCC pulses (HFCC airflow signal)whereas the low-pass filtered curve is the airflow duringthe spontaneous breathing effort (spontaneous airflowsignal) of the subject. We divided one cycle of the respira-tion into four phases. Phase I is the portion of the inspira-tion phase when the spontaneous airflow signal is greaterthan the amplitudes of HFCC airflow signal. In this phaseLV increases. During phase II, the spontaneous airflowsignal stays within the amplitudes of the HFCC airflowsignal. Phase II is the pause before expiration begins. The
amplitudes of HFCC airflow signals change considerablyas the phase moves from I to II. To emphasize the differ-ence of HFCC airflow signals, phase II were consciouslyprolonged and they are longer than phase II in fig. 6. Inphase III, passive or active expiration begins and theamplitudes of HFCC airflow signals decrease to aboutphase I amplitudes. The low-pass curve gets greater to thenegative direction curve than the high-pass curve. Thenext and last phase is phase IV. Phase IV is the restingperiod before inspiration, begins. During this phase theamplitudes of HFCC airflow signals again become greaterthan the spontaneous airflow signal. To reproduce similarairflow signals, a cycle of respiration from phase IV tophase IV was simulated using our computational model.The simulation results with the three frequencies areshown in fig. 6.
From the measured values and the simulation of airflowsignals at the mouth, we could observe two importantphenomena during respiration pertaining to the airflow
(a) The airflow and (b) the oesophageal pressure measured by Fink et al. [6] (modified with the permission), which shows typi-cal respiratory airflow during use of HFCCFigure 4(a) The airflow and (b) the oesophageal pressure measured by Fink et al. [6] (modified with the permission), which shows typi-cal respiratory airflow during use of HFCC. The positive numbers of airflow rate represent inspiration and the negative num-bers represent expiratory airflow. Oesophageal pressure reflects the intrapleural pressure (Ppl) that is altered by HFCC pulses (tiny peaks).
Page 7 of 14(page number not for citation purposes)

BioMedical Engineering OnLine 2005, 4:34 http://www.biomedical-engineering-online.com/content/4/1/34
The airflow signals measured at the mouth of the subject, the high-pass filtered (HFCC airflow signal) and the low-pass filtered (spontaneous airflow signal) curvesFigure 5The airflow signals measured at the mouth of the subject, the high-pass filtered (HFCC airflow signal) and the low-pass filtered (spontaneous airflow signal) curves. The subject was using HFCC with (a) 5 Hz, (b) 15 Hz, and (c) 21 Hz. Regardless of the fre-quencies, larger spontaneous airflow signals result in smaller HFCC airflow signals. Since it is difficult to breathe hard during 21 Hz, spontaneous airflow signals in (c) are smaller than in (a) and (b). Phase I is the portion of the inspiration phase when spon-taneous airflow signals are greater than the amplitudes of HFCC airflow signals. During phase II, spontaneous airflow signals stay within the amplitudes of HFCC airflow signals. In phase III, expiration begins, and the amplitudes of airflow oscillation decrease to about the amplitudes during phase I. Spontaneous airflow signals get greater to the negative direction than HFCC airflow signals. Finally phase IV, the resting period before inspiration, begins, and the amplitudes of HFCC airflow signals again become greater than spontaneous airflow signals. To emphasize the difference of HFCC airflow signals, phase II were con-sciously prolonged and they are longer than phase II in fig. 6.
Page 8 of 14(page number not for citation purposes)

BioMedical Engineering OnLine 2005, 4:34 http://www.biomedical-engineering-online.com/content/4/1/34
Simulated respiration, spontaneous airflow signals and HFCC airflow signalsFigure 6Simulated respiration, spontaneous airflow signals and HFCC airflow signals. The frequencies of HFCC were set (a) 5 Hz, (b) 15 Hz, and (c) 21 Hz. Definitions for Phases I, II, III, and IV in this figure are the same as those in the text and fig. 5.
Page 9 of 14(page number not for citation purposes)

BioMedical Engineering OnLine 2005, 4:34 http://www.biomedical-engineering-online.com/content/4/1/34
signal oscillation generated by HFCC. First, the ampli-tudes of HFCC airflow signals in phases I and III weresmaller than those in phases II and IV. Second, theamplitudes in phases I and III became even smaller as thespontaneous airflow signal became greater.
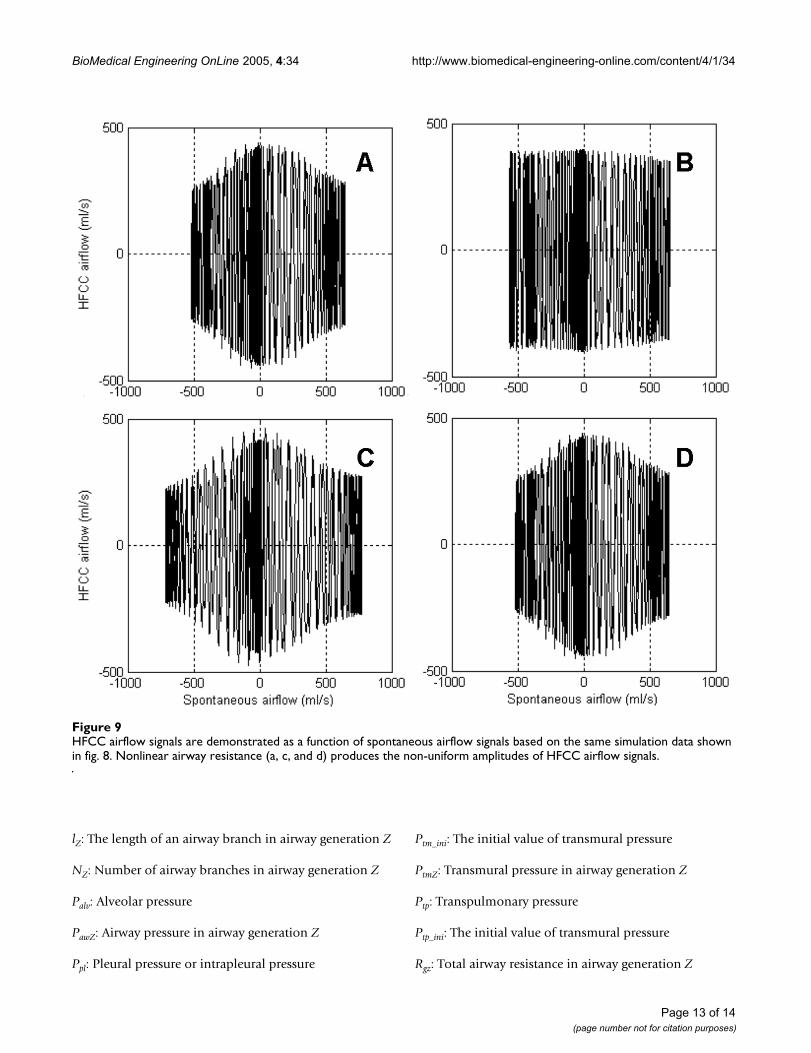
We used the simulation results to investigate how thenonlinearity of airway resistance, lung capacitance, andinertance of air characterized the respiratory airflow. Thesimulation was repeated after setting one of the threeproperties as a linear constant value. Fig. 7 compares thelinear values with the nonlinear values of the three prop-erties. The linear values are means of the nonlinear valuesduring the simulation. Fig. 8 presents the simulationresults of the lung model under the imaginary assump-tions. Fig. 8 (a) is normal respiratory airflow at 15 Hz, andfig. 6 (b) and fig. 8 (a) are from the same simulation data.Fig. 8 (b) demonstrates the predicted airflow signals at themouth with linear airway resistance, which indicates theamplitudes of HFCC airflow signals do not vary signifi-cantly. Fig. 8 (c) is the airflow when lung capacitance is setto a linear value. Just like fig. 8 (a), HFCC airflow signalsare the largest when spontaneous airflow signals are closeto zero. Therefore, it can be presumed that the nonliearityof lung capacitance does not play a role in the non-uni-formity of HFCC airflow signals. And neither is inertanceof air. Fig. 8 (d), which shows the simulation data withlinear inertance of air, is almost identical to fig. 8 (a). Thisindicates that the inertance of air is also not a factor in thenon-uniformity of HFCC airflow signals. Fig. 9 shows theHFCC airflow signals as a function of spontaneous airflowsignals based on the same simulation data shown in fig. 8.Fig. 8 (a), (c), and 8 (d) indicate that larger spontaneousairflow signals result in smaller oscillations of HFCC air-flow signals whereas HFCC airflow signals do not seem tobe related to spontaneous airflow signals in fig. 8 (b).
DiscussionThe number of the airway branches is estimated to beabout 17 million [31], and the dimensions of each airwaybranch vary while the lung is being inflated and deflatedduring respiration. To reduce the computational burden,models of the respiratory system are often simplified byignoring the nonlinear natures of the respiratory system[7,8]. Linearization entails considerable flexibility innumerical analysis since linear circuits arecomputationally much cheaper than nonlinear circuits,either on a time-domain or a frequency-domain basis.However, even during the slowest breathing, airway resist-ance, lung capacitance, and inertance of air change due tothe variation of airway dimensions as well as turbulence.In particular, increase of the airway resistance due to tur-bulence is so drastic that inaccurate evaluation of airwayresistance may result in a misleading simulation result.Our simulation results demonstrated that such errors are
(a) Airway resistance, (b) lung capacitance, and (c) inertance of air during the simulation used for fig. 8Figure 7(a) Airway resistance, (b) lung capacitance, and (c) inertance of air during the simulation used for fig. 8. The linear (fixed) values are the mean values of each nonlinear (varying) value.
Page 10 of 14(page number not for citation purposes)

BioMedical Engineering OnLine 2005, 4:34 http://www.biomedical-engineering-online.com/content/4/1/34
more likely when HFCC intervention is applied. Evidencefor this was that the result from a linear model was signif-icantly different from that from a nonlinear model (fig. 8and 9). As parts of the respiratory system, lung capacitanceand inertance of air are also nonlinear although it wasobserved that their nonlinearity did not cause the non-uniform amplitudes of HFCC airflow signals. However,this does not imply that the nonlinear characteristics oflung capacitance and inertance of air have no role in thesimulation of the respiratory system. Dimensionalchanges of the airway branches in the lung are responsiblefor the nonlinearity of lung capacitance and inertance of
air. When dimensions of the airways are involved for sim-ulation and prediction, the nonlinearity is very importantfor accurate results. For example, in the study of Sohn etal. [27], our model is used for estimation of air velocity,which is airflow rate ÷ cross sectional area. Since the crosssectional areas of airway branches do not vary linearly,lung capacitance and inertance of air also should not belinear in order to avoid discrepancy.
Ideally, studies about airflow in the airways would be bestresolved by CFD (Computational Fluid Dynamics), how-ever, using a CFD approach in this study presents several
Simulated spontaneous airflow signals and HFCC airflow signals, (a) when the values of airway resistance, lung capacitance, and inertance of air are nonlinear (varying), (b) when the value of airway resistance is linear (fixed), (c) when the value of lung capacitance is linear (fixed), and (d) when the value of inertance is linear (fixed)Figure 8Simulated spontaneous airflow signals and HFCC airflow signals, (a) when the values of airway resistance, lung capacitance, and inertance of air are nonlinear (varying), (b) when the value of airway resistance is linear (fixed), (c) when the value of lung capacitance is linear (fixed), and (d) when the value of inertance is linear (fixed). The frequencies of each plot are 15 Hz, so (a) is the same as fig. 6 (b). In (b), the amplitudes of HFCC airflow signals almost do not vary.
Page 11 of 14(page number not for citation purposes)

BioMedical Engineering OnLine 2005, 4:34 http://www.biomedical-engineering-online.com/content/4/1/34
problems that cannot be overcome by modern technol-ogy. First, the turbulence mechanism is not completelyknown [23]. Even during the slowest breathing manoeu-vre, turbulence exists in the proximal airways, and ignor-ing turbulence would not give true simulation results.Another obstacle is that the whole lung cannot be takeninto consideration even with the latest supercomputingpower. A CFD approach to simulate dynamics of airflowinteracting in a huge number of airway branches in thelung requires extremely massive computation. There is noway to deal with it, if any, its computation time would beincredibly long. It should be also pointed out that CFDtechniques for airflow in non-rigid wall tubes are not yetmature. Although not perfect, our circuit analogue modelallows us to effectively simulate the nonlinear characteris-tics of the respiratory system.
It is well known that respiratory system impedance con-sists of airway impedance and chest wall (tissue) imped-ance [2-4]. Since the driving force of airflow in our modelis the intrapleural pressure altered by HFCC pulses trans-ferred from the body surface, our model does notnecessarily incorporate chest wall (tissue) impedance.However, it is not clear how effectively the chest walltransfers HFCC pulses to the pleural cavity. Other factorsshould also be considered for impedance between thejacket of HFCC and the pleural cavity – such as clothes,posture, and tightness of the jacket. Currently, based onobservations of Milla et al. [19], we assume that HFCCpulses on the body surface are transferred to the pleuralcavity without any distortion of pulsation waveformsalthough some attenuation may exist.
The HFCC device was initially developed only for cysticfibrosis patients who normally have healthy lungs [29];consequently we modelled a healthy lung as the first stepof the research. As this medical treatment becomes widelyapplicable to other lung diseases, we are planning todevelop models that can be used to simulate HFCC onvarious lung diseases in the future.
ConclusionIn this study, the airflow signals measured at the mouthduring use of HFCC are viewed as a composite of twocauses: the spontaneous breathing effort and HFCCpulses. However, since the respiratory system is nonlinear,airflow signals at the mouth are not a mere superpositionof the effects from these two causes. In laboratory meas-urements, the amplitudes of the airflow signal oscillationvaried considerably despite the uniformity of the HFCCpulses. After confirming that the simulation resultsmatched up with the observations, we analyzed the simu-lation data to explain the observed inconsistency in theHFCC airflow signal amplitudes. We found that theamplitudes of HFCC airflow signals behave as a function
of spontaneous airflow signals. This is due to the nonlin-earity of the respiratory system, particularly variations inairway resistance.
The findings in this paper may not be immediately appli-cable for HFCC therapy, but they do lead to ways to betterprescribe HFCC therapy. Most importantly, the usefulnessof our computational simulation and the model-basedapproach as a tool to understand clinical observations ofHFCC was well demonstrated in this paper.
List of abbreviationsHFCC: High Frequency Chest Compression
FRC: Functional Residual Capacity
TLC: Total Lung Capacity
RV: Residual Volume
LV: Lung volume
AV: Alveolar volume
R: resistor
C: capacitor
L: inductor
AZ: Airway cross sectional area in airway generation Z
AmaxZ: Maximum Airway cross sectional area in airwaygeneration Z
AZ75: Airway cross sectional area in airway generation Zwhen LV is 75% of TLC
Cas: Alveolar capacitance
Cgz: Total airway capacitance in airway generation Z
CsZ: Single airway capacitance in airway generation Z
FinZ: Incoming airflow in airway generation Z
FoutZ: Outgoing airflow in airway generation Z
Fua: Airflow in the upper airway
Lgz: Total inductance (inertance of air) in airway genera-tion Z
LsZ: Single inductance (inertance of air) in airway genera-tion Z
Page 12 of 14(page number not for citation purposes)
BioMedical Engineering OnLine 2005, 4:34 http://www.biomedical-engineering-online.com/content/4/1/34
lZ: The length of an airway branch in airway generation Z
NZ: Number of airway branches in airway generation Z
Palv: Alveolar pressure
PawZ: Airway pressure in airway generation Z
Ppl: Pleural pressure or intrapleural pressure
Ptm_ini: The initial value of transmural pressure
PtmZ: Transmural pressure in airway generation Z
Ptp: Transpulmonary pressure
Ptp_ini: The initial value of transmural pressure
Rgz: Total airway resistance in airway generation Z
HFCC airflow signals are demonstrated as a function of spontaneous airflow signals based on the same simulation data shown in fig. 8Figure 9HFCC airflow signals are demonstrated as a function of spontaneous airflow signals based on the same simulation data shown in fig. 8. Nonlinear airway resistance (a, c, and d) produces the non-uniform amplitudes of HFCC airflow signals.
Page 13 of 14(page number not for citation purposes)

BioMedical Engineering OnLine 2005, 4:34 http://www.biomedical-engineering-online.com/content/4/1/34
Publish with BioMed Central and every scientist can read your work free of charge
"BioMed Central will be the most significant development for disseminating the results of biomedical research in our lifetime."
Sir Paul Nurse, Cancer Research UK
Your research papers will be:
available free of charge to the entire biomedical community
peer reviewed and published immediately upon acceptance
cited in PubMed and archived on PubMed Central
yours — you keep the copyright
Submit your manuscript here:http://www.biomedcentral.com/info/publishing_adv.asp
BioMedcentral
RsZ: Single airway resistance in airway generation Z
rz: The radius of an airway branch in airway generation Z
Authors' contributionsKS designed all the necessary computational and experi-mental procedures, analysed data to reach the conclusion,and also prepared the texts and figures in the manuscript.WJW conceived this study, helped organizing themanuscript, and advised all aspects of physiology andmedicine for this study. YWL and JL helped measuring therespiratory airflow. JEH advised all aspects of technologyand engineering for this study.
References1. Axe JR, Abbrecht PH: Analysis of the pressure-volume relation-
ship of excised lungs. Ann Biomed Eng 1985, 13:101-117.2. Black LD, Dellaca R, Jung K, Atileh H, Israel E, Ingenito EP, Lutchen
KR: Tracking variations in airway caliber by using total respi-ratory vs. airway resistance in healthy and asthmaticsubjects. J Appl Physiol 2003, 95:511-518.
3. Dellaca RL, Aliverti A, Lutchen KR, Pedotti A: Spatial distributionof human respiratory system transfer impedance. Ann BiomedEng 2003, 31:121-131.
4. Dellaca RL, Black LD, Atileh H, Pedotti A, Lutchen KR: Effects ofposture and bronchoconstriction on low-frequency inputand transfer impedances in humans. J Appl Physiol 2004,97:109-118.
5. Elad D, Shochat A, Shiner RJ: Computational model of oscilla-tory airflow in a bronchial bifurcation. Respir Physiol 1998,112:95-111.
6. Fink JB, Mahlmeister MJ: High-frequency oscillation of the air-way and chest wall. Respir Care 2002, 47:797-807.
7. Gillis HL, Lutchen KR: How heterogeneous bronchoconstric-tion affects ventilation distribution in human lungs: a mor-phometric model. Ann Biomed Eng 1999, 27:14-22.
8. Golden JF, Clark JW Jr, Stevens PM: Mathematical modeling ofpulmonary airway dynamics. IEEE Trans Biomed Eng 1973,20:397-404.
9. Hansen LG, Warwick WJ, Hansen KL: Mucus transport mecha-nisms in relation to the effect of high frequency chest com-pression (HFCC) on mucus clearance. Pediatr Pulmonol 1994,17:113-118.
10. Horsfield K, Dart G, Olson DE, Filley GF, Cumming G: Models ofthe human bronchial tree. J Appl Physiol 1971, 31:207-217.
11. Howatson Tawhai M, Pullan AJ, Hunter PJ: Generation of an ana-tomically based three-dimensional model of the conductingairways. Ann Biomed Eng 2000, 28:793-802.
12. Jackson AC, Milhorn HT Jr: Digital computer simulation of res-piratory mechanics. Comput Biomed Res 1973, 6:27-56.
13. King M, Rubin BK: Physiological bases for the control ofmucous hyper-secretion. In Airway secretion Edited by: TakishimaT, Shimura S. NY: Marcel Dekker, Inc; 1994.
14. Kitaoka H, Takaki R, Suki B: A three-dimensional model of thehuman airway tree. J Appl Physiol 1999, 87:2207-2217.
15. Krumpe PE, Evrensel CA, Hassan AA: Superimposed oscillationenhance the clearance of mucus stimulant at low air flows ina rigid tracheal model. ASME International Mechanical EngineeringCongress & Exposition 2002:437-438.
16. Lambert RK, Wilson TA, Hyatt RE, Rodarte JR: A computationalmodel for expiratory flow. J Appl Physiol 1982, 52:44-56.
17. Lapin CD: Airway physiology, autogenic drainage, and activecycle of breathing. Respir Care 2002, 47:778-785.
18. Marchal F, Haouzi P, Peslin R, Duvivier C, Gallina C: Mechanicalproperties of the upper airway wall in children and theirinfluence on respiratory impedance measurements. PediatrPulmonol 1992, 13:28-33.
19. Milla CE, Hansen LG, Weber A, Warwick WJ: High-frequencychest compression: effect of the third generation compres-sion waveform. Biomed Instrum Technol 2004, 38:322-328.
20. Nucci G, Suki B, Lutchen K: Modeling airflow-related shearstress during heterogeneous constriction and mechanicalventilation. J Appl Physiol 2003, 95:348-356.
21. Pedley TJ, Schroter RC, Sudlow MF: Flow and pressure drop insystems of repeatedly branching tubes. J Fluid Mech 1971,46:365-383.
22. Pillage TL, Rohrer RA, Visweswariah C: Electronic circuit and systemsimulation methods McGrow-Hill; 1995.
23. Rajagopal KR: On some unresolved issues in non-linear fluiddynamics. Russ Math Surv 2003, 58:319-330.
24. Robinson RC: An introduction to dynamical systems: Continuous anddiscrete NJ: Pearson Prentice Hall; 2004.
25. Rodarte JR, Rehder K: Dynamics of respiration. In Handbook ofPhysiology 2nd edition. Bethesda, MD: American Physiological Society;1986.
26. Salazar E, Knowles JH: An Analysis of Pressure-Volume Charac-teristics of the Lungs. J Appl Physiol 1964, 19:97-104.
27. Sohn K, Holte JE, Phillips JR, Warwick WJ: Modeled velocity of air-flow in the airways during various respiratory patterns. the26th Annual International Conference of the IEEE-EMBS; San Francisco, CA2004:3925-3928.
28. Tomkiewicz RP, Biviji A, King M: Effects of oscillating air flow onthe rheological properties and clearability of mucous gelsimulants. Biorheology 1994, 31:511-520.
29. Warwick WJ, Hansen LG: Chest compression apparatus. U.S.Patent 4 838 263 . June 13, 1989
30. Warwick WJ: Mechanisms of mucous transport. Eur J Respir DisSuppl 1983, 127:162-167.
31. Weibel ER: Morphometry of the human lung Berlin: Springer; 1963.
Page 14 of 14(page number not for citation purposes)